Grand Island, NE Map & Demographics
Grand Island Map
Grand Island Overview
$31,500
PER CAPITA INCOME
$73,340
AVG FAMILY INCOME
$59,061
AVG HOUSEHOLD INCOME
27.0%
WAGE / INCOME GAP [ % ]
73.0¢/ $1
WAGE / INCOME GAP [ $ ]
$11,461
FAMILY INCOME DEFICIT
0.45
INEQUALITY / GINI INDEX
52,822
TOTAL POPULATION
27,062
MALE POPULATION
25,760
FEMALE POPULATION
105.05
MALES / 100 FEMALES
95.19
FEMALES / 100 MALES
35.0
MEDIAN AGE
3.2
AVG FAMILY SIZE
2.6
AVG HOUSEHOLD SIZE
26,793
LABOR FORCE [ PEOPLE ]
67.8%
PERCENT IN LABOR FORCE
3.1%
UNEMPLOYMENT RATE
Grand Island Area Codes
Income in Grand Island
Income Overview in Grand Island
Per Capita Income in Grand Island is $31,500, while median incomes of families and households are $73,340 and $59,061 respectively.
| Characteristic | Number | Measure |
| Per Capita Income | 52,822 | $31,500 |
| Median Family Income | 12,932 | $73,340 |
| Mean Family Income | 12,932 | $93,987 |
| Median Household Income | 20,263 | $59,061 |
| Mean Household Income | 20,263 | $79,827 |
| Income Deficit | 12,932 | $11,461 |
| Wage / Income Gap (%) | 52,822 | 27.00% |
| Wage / Income Gap ($) | 52,822 | 73.00¢ per $1 |
| Gini / Inequality Index | 52,822 | 0.45 |
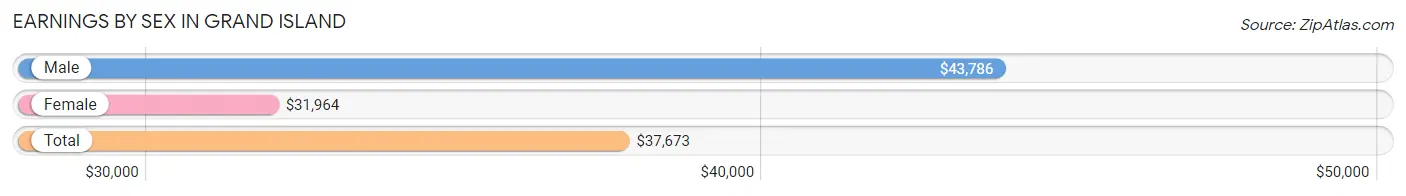
Earnings by Sex in Grand Island
Average Earnings in Grand Island are $37,673, $43,786 for men and $31,964 for women, a difference of 27.0%.
| Sex | Number | Average Earnings |
| Male | 15,103 (53.8%) | $43,786 |
| Female | 12,956 (46.2%) | $31,964 |
| Total | 28,059 (100.0%) | $37,673 |
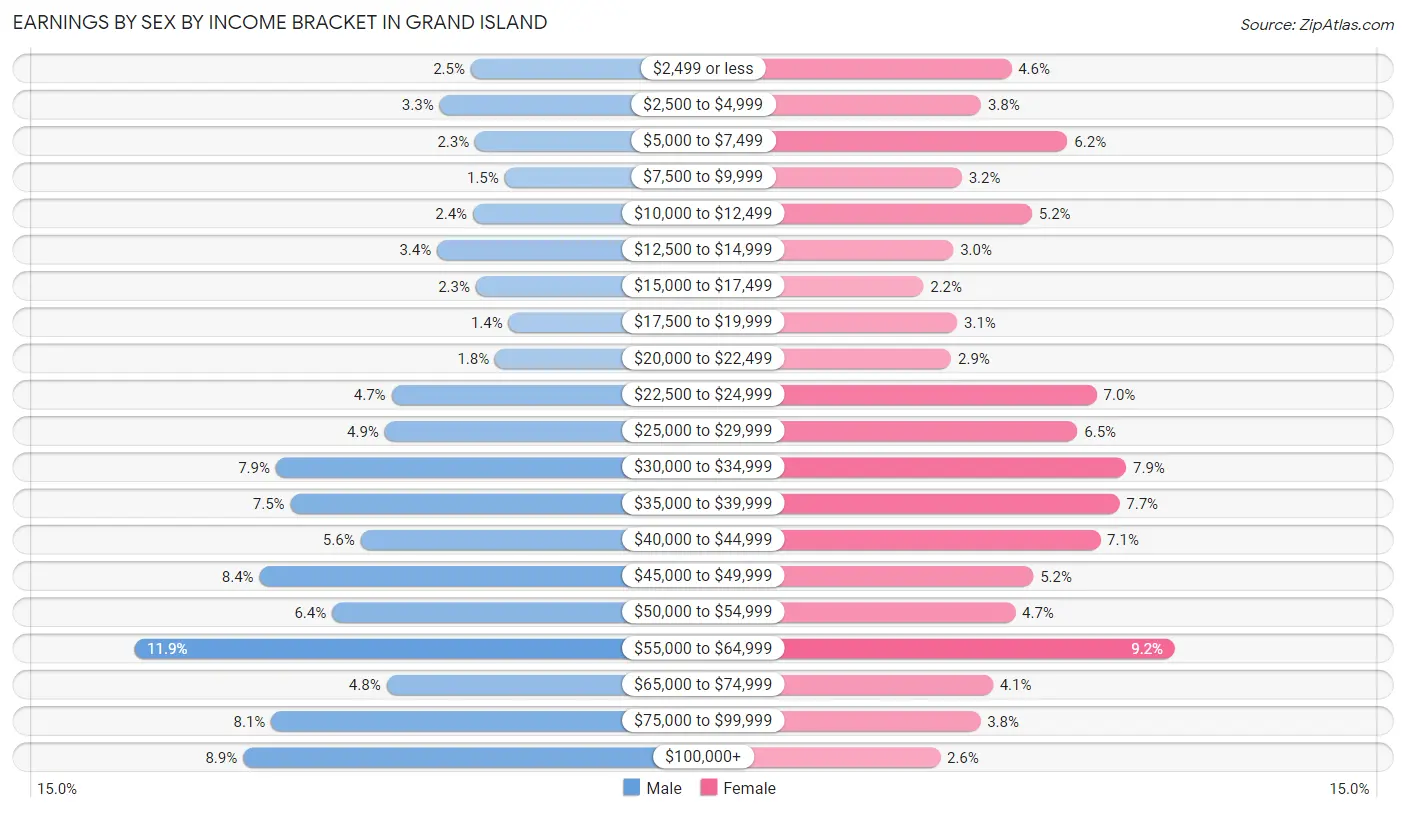
Earnings by Sex by Income Bracket in Grand Island
The most common earnings brackets in Grand Island are $55,000 to $64,999 for men (1,800 | 11.9%) and $55,000 to $64,999 for women (1,195 | 9.2%).
| Income | Male | Female |
| $2,499 or less | 372 (2.5%) | 599 (4.6%) |
| $2,500 to $4,999 | 505 (3.3%) | 489 (3.8%) |
| $5,000 to $7,499 | 353 (2.3%) | 803 (6.2%) |
| $7,500 to $9,999 | 228 (1.5%) | 419 (3.2%) |
| $10,000 to $12,499 | 362 (2.4%) | 674 (5.2%) |
| $12,500 to $14,999 | 515 (3.4%) | 388 (3.0%) |
| $15,000 to $17,499 | 350 (2.3%) | 278 (2.1%) |
| $17,500 to $19,999 | 212 (1.4%) | 402 (3.1%) |
| $20,000 to $22,499 | 269 (1.8%) | 380 (2.9%) |
| $22,500 to $24,999 | 709 (4.7%) | 909 (7.0%) |
| $25,000 to $29,999 | 737 (4.9%) | 840 (6.5%) |
| $30,000 to $34,999 | 1,199 (7.9%) | 1,017 (7.9%) |
| $35,000 to $39,999 | 1,137 (7.5%) | 992 (7.7%) |
| $40,000 to $44,999 | 840 (5.6%) | 922 (7.1%) |
| $45,000 to $49,999 | 1,268 (8.4%) | 679 (5.2%) |
| $50,000 to $54,999 | 961 (6.4%) | 613 (4.7%) |
| $55,000 to $64,999 | 1,800 (11.9%) | 1,195 (9.2%) |
| $65,000 to $74,999 | 729 (4.8%) | 531 (4.1%) |
| $75,000 to $99,999 | 1,219 (8.1%) | 486 (3.7%) |
| $100,000+ | 1,338 (8.9%) | 340 (2.6%) |
| Total | 15,103 (100.0%) | 12,956 (100.0%) |
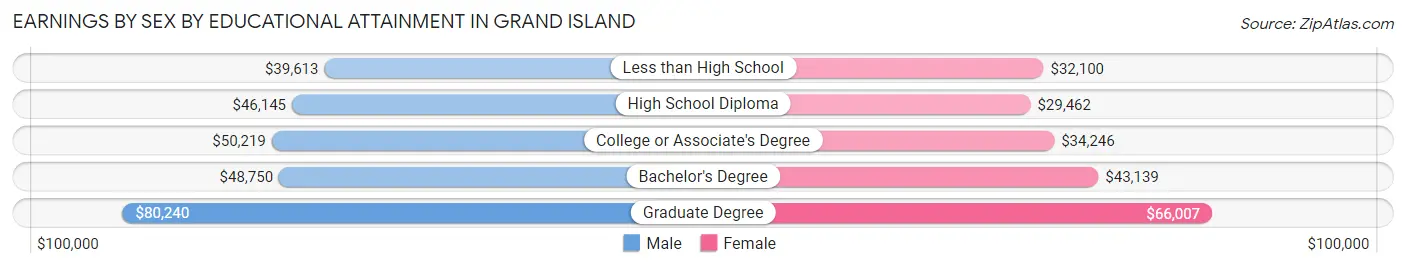
Earnings by Sex by Educational Attainment in Grand Island
Average earnings in Grand Island are $47,277 for men and $35,492 for women, a difference of 24.9%. Men with an educational attainment of graduate degree enjoy the highest average annual earnings of $80,240, while those with less than high school education earn the least with $39,613. Women with an educational attainment of graduate degree earn the most with the average annual earnings of $66,007, while those with high school diploma education have the smallest earnings of $29,462.
| Educational Attainment | Male Income | Female Income |
| Less than High School | $39,613 | $32,100 |
| High School Diploma | $46,145 | $29,462 |
| College or Associate's Degree | $50,219 | $34,246 |
| Bachelor's Degree | $48,750 | $43,139 |
| Graduate Degree | $80,240 | $66,007 |
| Total | $47,277 | $35,492 |
Family Income in Grand Island
Family Income Brackets in Grand Island
According to the Grand Island family income data, there are 2,871 families falling into the $50,000 to $74,999 income range, which is the most common income bracket and makes up 22.2% of all families. Conversely, the less than $10,000 income bracket is the least frequent group with only 440 families (3.4%) belonging to this category.
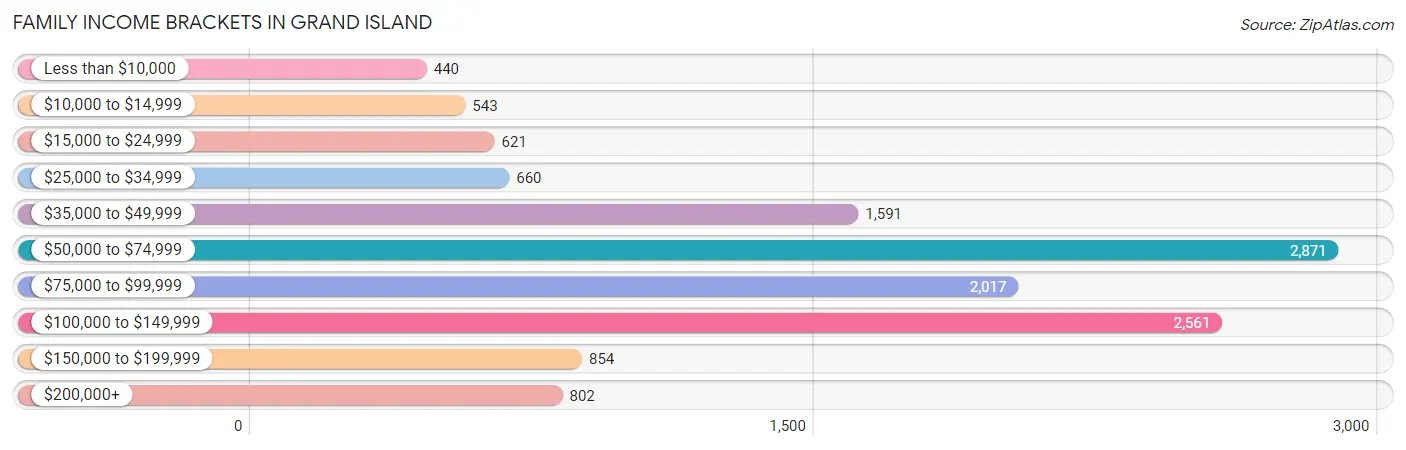
| Income Bracket | # Families | % Families |
| Less than $10,000 | 440 | 3.4% |
| $10,000 to $14,999 | 543 | 4.2% |
| $15,000 to $24,999 | 621 | 4.8% |
| $25,000 to $34,999 | 660 | 5.1% |
| $35,000 to $49,999 | 1,591 | 12.3% |
| $50,000 to $74,999 | 2,871 | 22.2% |
| $75,000 to $99,999 | 2,017 | 15.6% |
| $100,000 to $149,999 | 2,561 | 19.8% |
| $150,000 to $199,999 | 854 | 6.6% |
| $200,000+ | 802 | 6.2% |
Family Income by Famaliy Size in Grand Island
6-person families (214 | 1.7%) account for the highest median family income in Grand Island with $95,833 per family, while 2-person families (5,702 | 44.1%) have the highest median income of $34,757 per family member.
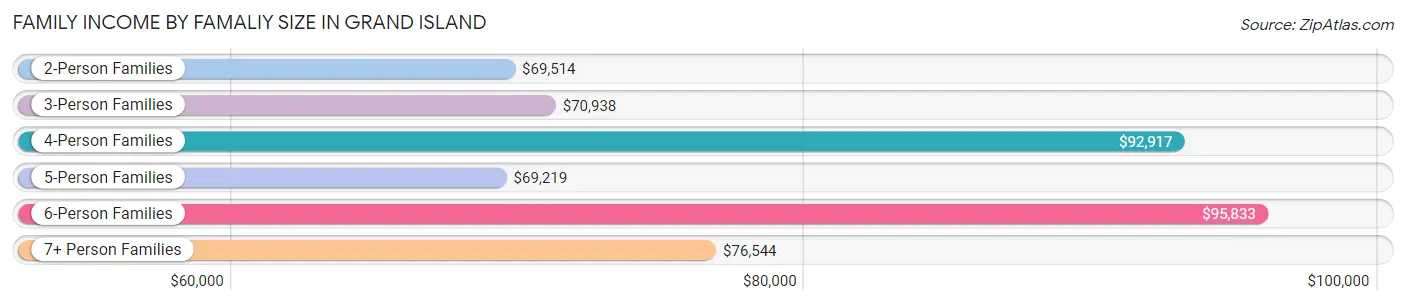
| Income Bracket | # Families | Median Income |
| 2-Person Families | 5,702 (44.1%) | $69,514 |
| 3-Person Families | 2,913 (22.5%) | $70,938 |
| 4-Person Families | 2,474 (19.1%) | $92,917 |
| 5-Person Families | 1,254 (9.7%) | $69,219 |
| 6-Person Families | 214 (1.7%) | $95,833 |
| 7+ Person Families | 375 (2.9%) | $76,544 |
| Total | 12,932 (100.0%) | $73,340 |
Family Income by Number of Earners in Grand Island
The median family income in Grand Island is $73,340, with families comprising 3+ earners (1,393) having the highest median family income of $118,482, while families with no earners (1,411) have the lowest median family income of $45,040, accounting for 10.8% and 10.9% of families, respectively.
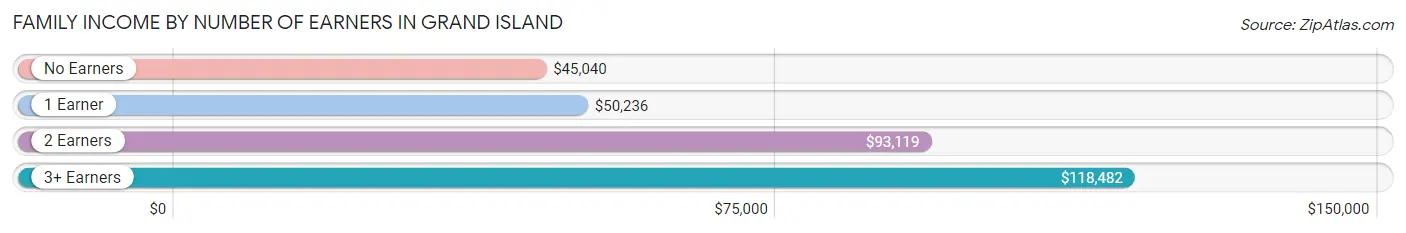
| Number of Earners | # Families | Median Income |
| No Earners | 1,411 (10.9%) | $45,040 |
| 1 Earner | 4,438 (34.3%) | $50,236 |
| 2 Earners | 5,690 (44.0%) | $93,119 |
| 3+ Earners | 1,393 (10.8%) | $118,482 |
| Total | 12,932 (100.0%) | $73,340 |
Household Income in Grand Island
Household Income Brackets in Grand Island
With 4,377 households falling in the category, the $50,000 to $74,999 income range is the most frequent in Grand Island, accounting for 21.6% of all households. In contrast, only 892 households (4.4%) fall into the $200,000+ income bracket, making it the least populous group.
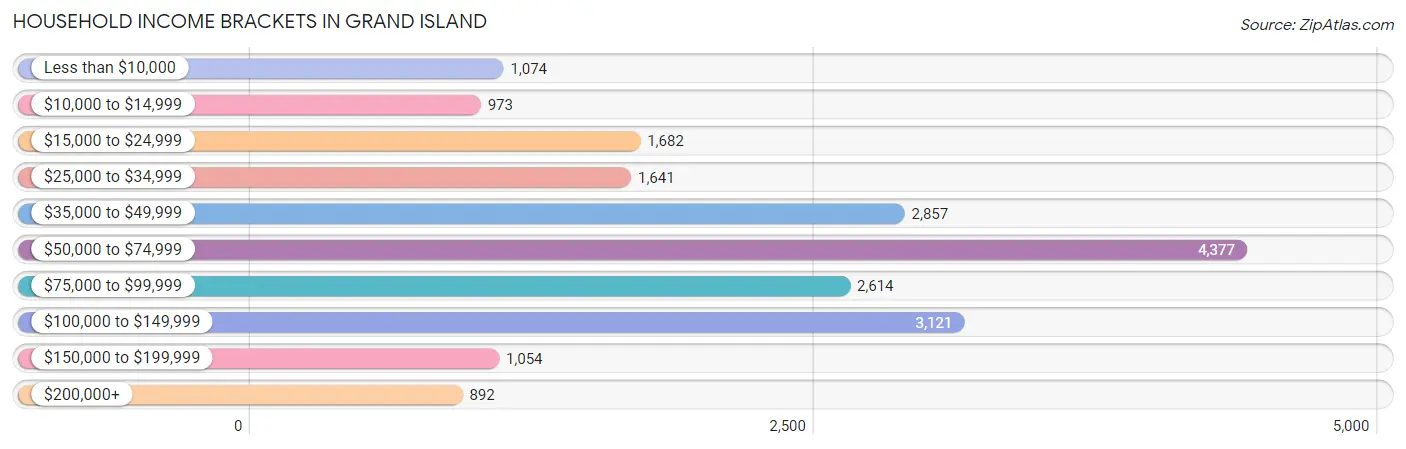
| Income Bracket | # Households | % Households |
| Less than $10,000 | 1,074 | 5.3% |
| $10,000 to $14,999 | 973 | 4.8% |
| $15,000 to $24,999 | 1,682 | 8.3% |
| $25,000 to $34,999 | 1,641 | 8.1% |
| $35,000 to $49,999 | 2,857 | 14.1% |
| $50,000 to $74,999 | 4,377 | 21.6% |
| $75,000 to $99,999 | 2,614 | 12.9% |
| $100,000 to $149,999 | 3,121 | 15.4% |
| $150,000 to $199,999 | 1,054 | 5.2% |
| $200,000+ | 892 | 4.4% |
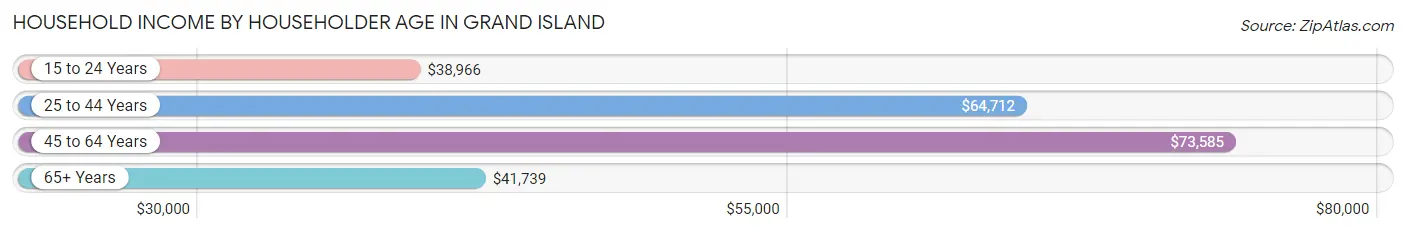
Household Income by Householder Age in Grand Island
The median household income in Grand Island is $59,061, with the highest median household income of $73,585 found in the 45 to 64 years age bracket for the primary householder. A total of 7,047 households (34.8%) fall into this category. Meanwhile, the 15 to 24 years age bracket for the primary householder has the lowest median household income of $38,966, with 1,365 households (6.7%) in this group.
| Income Bracket | # Households | Median Income |
| 15 to 24 Years | 1,365 (6.7%) | $38,966 |
| 25 to 44 Years | 6,911 (34.1%) | $64,712 |
| 45 to 64 Years | 7,047 (34.8%) | $73,585 |
| 65+ Years | 4,940 (24.4%) | $41,739 |
| Total | 20,263 (100.0%) | $59,061 |
Poverty in Grand Island
Income Below Poverty by Sex and Age in Grand Island
With 11.3% poverty level for males and 16.1% for females among the residents of Grand Island, 15 year old males and 15 year old females are the most vulnerable to poverty, with 137 males (29.3%) and 175 females (39.4%) in their respective age groups living below the poverty level.
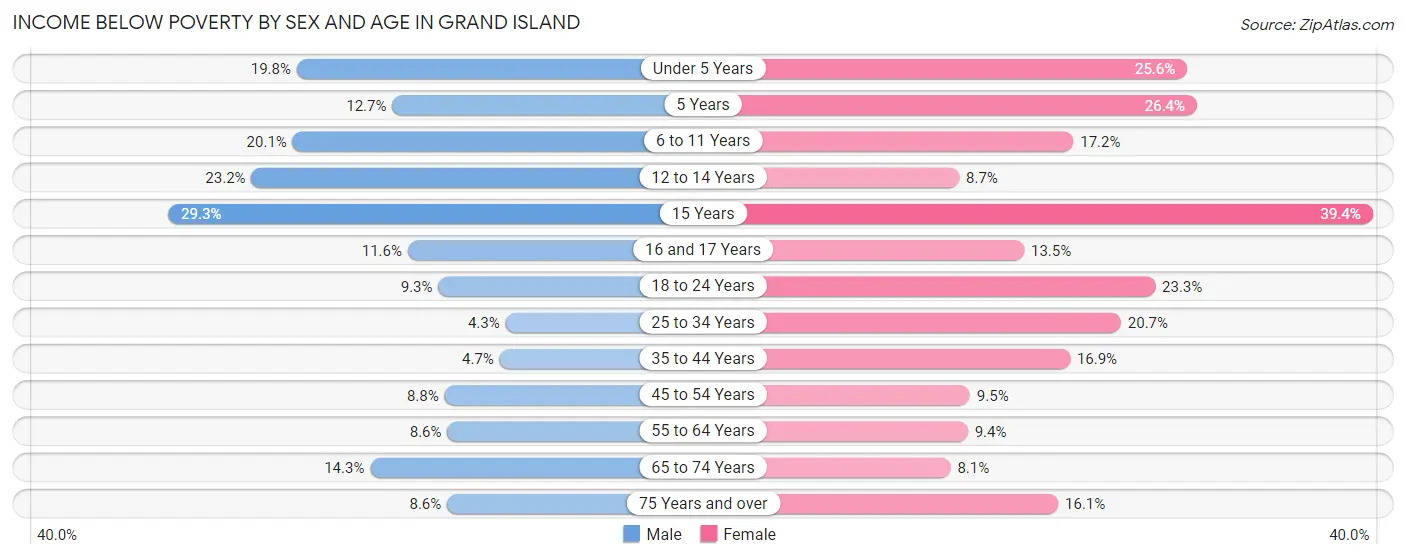
| Age Bracket | Male | Female |
| Under 5 Years | 431 (19.8%) | 480 (25.6%) |
| 5 Years | 48 (12.7%) | 102 (26.4%) |
| 6 to 11 Years | 496 (20.1%) | 345 (17.2%) |
| 12 to 14 Years | 321 (23.2%) | 130 (8.7%) |
| 15 Years | 137 (29.3%) | 175 (39.4%) |
| 16 and 17 Years | 91 (11.6%) | 102 (13.5%) |
| 18 to 24 Years | 218 (9.3%) | 508 (23.3%) |
| 25 to 34 Years | 150 (4.3%) | 711 (20.7%) |
| 35 to 44 Years | 163 (4.7%) | 557 (16.9%) |
| 45 to 54 Years | 276 (8.8%) | 266 (9.5%) |
| 55 to 64 Years | 248 (8.6%) | 256 (9.3%) |
| 65 to 74 Years | 307 (14.3%) | 187 (8.1%) |
| 75 Years and over | 123 (8.6%) | 279 (16.1%) |
| Total | 3,009 (11.3%) | 4,098 (16.1%) |
Income Above Poverty by Sex and Age in Grand Island
According to the poverty statistics in Grand Island, males aged 25 to 34 years and females aged 65 to 74 years are the age groups that are most secure financially, with 95.7% of males and 91.9% of females in these age groups living above the poverty line.
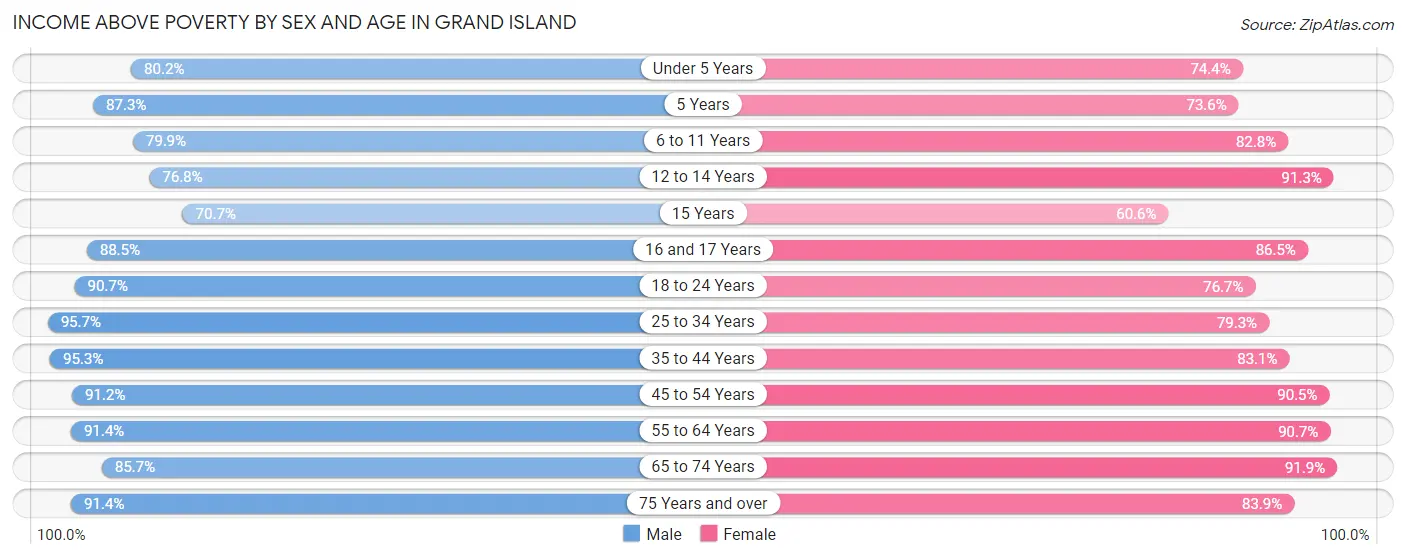
| Age Bracket | Male | Female |
| Under 5 Years | 1,747 (80.2%) | 1,393 (74.4%) |
| 5 Years | 330 (87.3%) | 285 (73.6%) |
| 6 to 11 Years | 1,972 (79.9%) | 1,662 (82.8%) |
| 12 to 14 Years | 1,065 (76.8%) | 1,363 (91.3%) |
| 15 Years | 330 (70.7%) | 269 (60.6%) |
| 16 and 17 Years | 697 (88.4%) | 652 (86.5%) |
| 18 to 24 Years | 2,131 (90.7%) | 1,676 (76.7%) |
| 25 to 34 Years | 3,346 (95.7%) | 2,721 (79.3%) |
| 35 to 44 Years | 3,284 (95.3%) | 2,731 (83.1%) |
| 45 to 54 Years | 2,854 (91.2%) | 2,531 (90.5%) |
| 55 to 64 Years | 2,633 (91.4%) | 2,483 (90.6%) |
| 65 to 74 Years | 1,834 (85.7%) | 2,130 (91.9%) |
| 75 Years and over | 1,302 (91.4%) | 1,458 (83.9%) |
| Total | 23,525 (88.7%) | 21,354 (83.9%) |
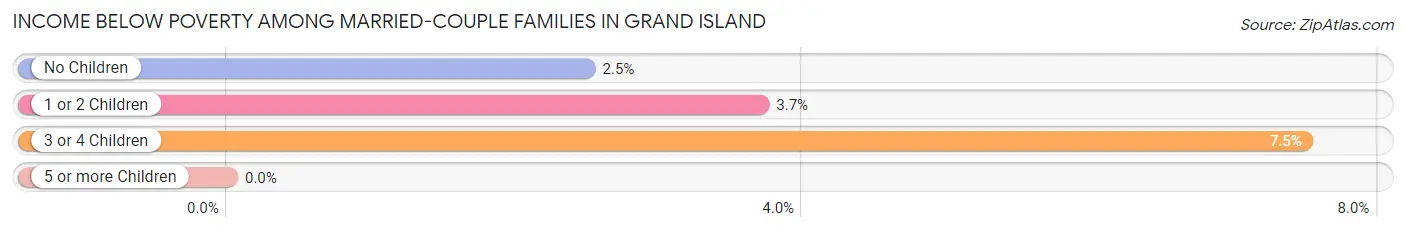
Income Below Poverty Among Married-Couple Families in Grand Island
The poverty statistics for married-couple families in Grand Island show that 3.4% or 305 of the total 9,107 families live below the poverty line. Families with 3 or 4 children have the highest poverty rate of 7.5%, comprising of 57 families. On the other hand, families with 5 or more children have the lowest poverty rate of 0.0%, which includes 0 families.
| Children | Above Poverty | Below Poverty |
| No Children | 4,732 (97.5%) | 121 (2.5%) |
| 1 or 2 Children | 3,305 (96.3%) | 127 (3.7%) |
| 3 or 4 Children | 704 (92.5%) | 57 (7.5%) |
| 5 or more Children | 61 (100.0%) | 0 (0.0%) |
| Total | 8,802 (96.7%) | 305 (3.4%) |
Income Below Poverty Among Single-Parent Households in Grand Island
According to the poverty data in Grand Island, 6.1% or 78 single-father households and 39.1% or 998 single-mother households are living below the poverty line. Among single-father households, those with 1 or 2 children have the highest poverty rate, with 78 households (11.1%) experiencing poverty. Likewise, among single-mother households, those with 3 or 4 children have the highest poverty rate, with 264 households (57.6%) falling below the poverty line.
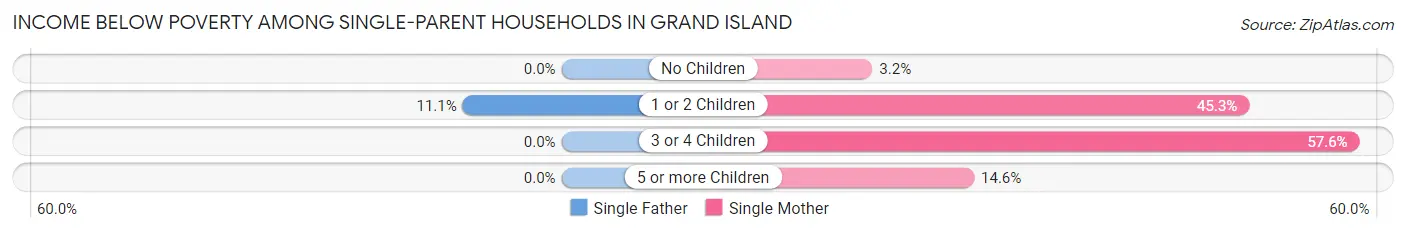
| Children | Single Father | Single Mother |
| No Children | 0 (0.0%) | 13 (3.2%) |
| 1 or 2 Children | 78 (11.1%) | 700 (45.3%) |
| 3 or 4 Children | 0 (0.0%) | 264 (57.6%) |
| 5 or more Children | 0 (0.0%) | 21 (14.6%) |
| Total | 78 (6.1%) | 998 (39.1%) |
Income Below Poverty Among Married-Couple vs Single-Parent Households in Grand Island
The poverty data for Grand Island shows that 305 of the married-couple family households (3.4%) and 1,076 of the single-parent households (28.1%) are living below the poverty level. Within the married-couple family households, those with 3 or 4 children have the highest poverty rate, with 57 households (7.5%) falling below the poverty line. Among the single-parent households, those with 3 or 4 children have the highest poverty rate, with 264 household (44.2%) living below poverty.
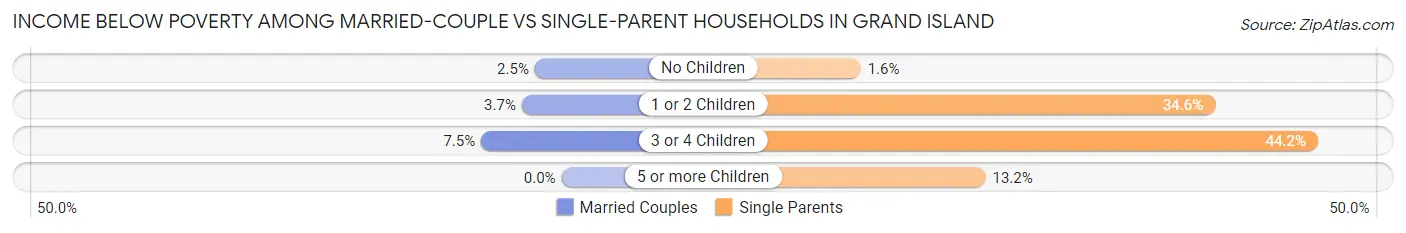
| Children | Married-Couple Families | Single-Parent Households |
| No Children | 121 (2.5%) | 13 (1.6%) |
| 1 or 2 Children | 127 (3.7%) | 778 (34.6%) |
| 3 or 4 Children | 57 (7.5%) | 264 (44.2%) |
| 5 or more Children | 0 (0.0%) | 21 (13.2%) |
| Total | 305 (3.4%) | 1,076 (28.1%) |
Race in Grand Island
The most populous races in Grand Island are White / Caucasian (36,365 | 68.8%), Hispanic or Latino (17,957 | 34.0%), and Some other Race (8,597 | 16.3%).
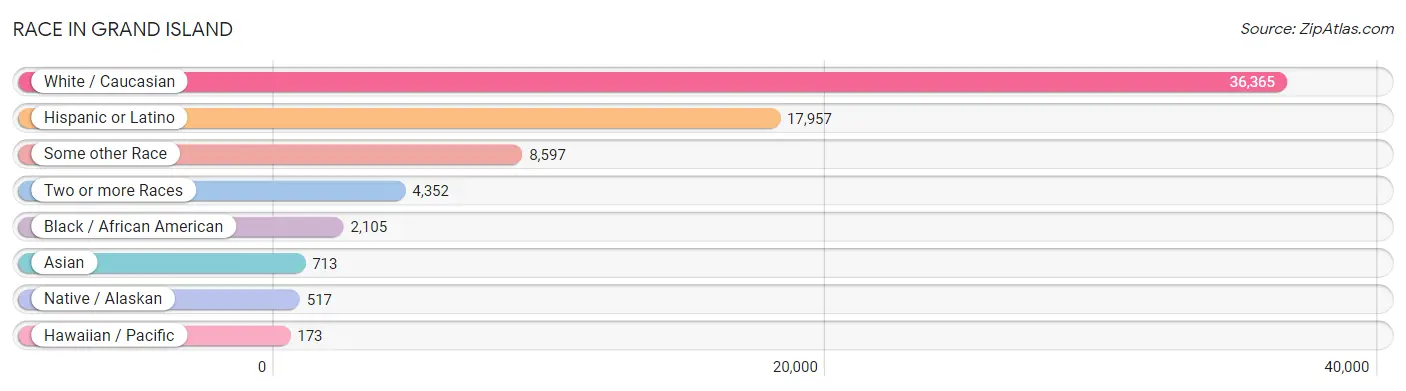
| Race | # Population | % Population |
| Asian | 713 | 1.3% |
| Black / African American | 2,105 | 4.0% |
| Hawaiian / Pacific | 173 | 0.3% |
| Hispanic or Latino | 17,957 | 34.0% |
| Native / Alaskan | 517 | 1.0% |
| White / Caucasian | 36,365 | 68.8% |
| Two or more Races | 4,352 | 8.2% |
| Some other Race | 8,597 | 16.3% |
| Total | 52,822 | 100.0% |
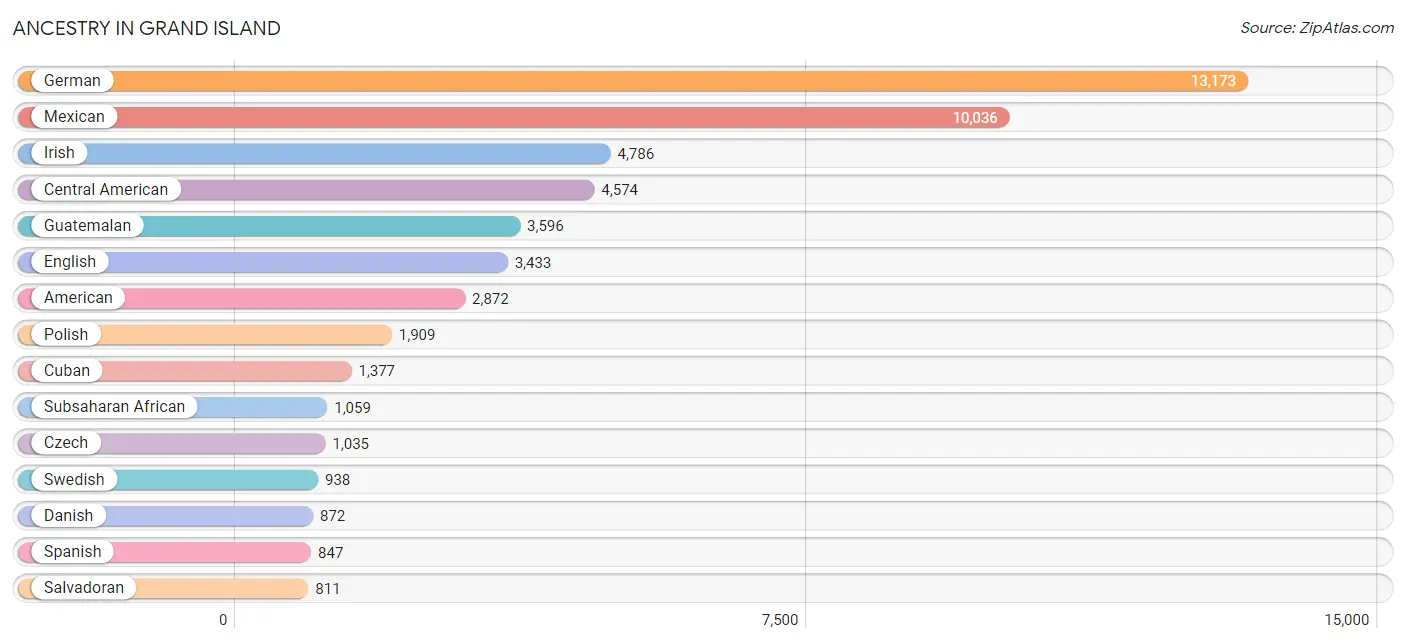
Ancestry in Grand Island
The most populous ancestries reported in Grand Island are German (13,173 | 24.9%), Mexican (10,036 | 19.0%), Irish (4,786 | 9.1%), Central American (4,574 | 8.7%), and Guatemalan (3,596 | 6.8%), together accounting for 68.5% of all Grand Island residents.
| Ancestry | # Population | % Population |
| African | 420 | 0.8% |
| American | 2,872 | 5.4% |
| Apache | 30 | 0.1% |
| Arab | 75 | 0.1% |
| Austrian | 27 | 0.1% |
| Bhutanese | 105 | 0.2% |
| Blackfeet | 18 | 0.0% |
| British | 76 | 0.1% |
| Burmese | 8 | 0.0% |
| Canadian | 123 | 0.2% |
| Celtic | 22 | 0.0% |
| Central American | 4,574 | 8.7% |
| Central American Indian | 87 | 0.2% |
| Cherokee | 151 | 0.3% |
| Chilean | 206 | 0.4% |
| Colombian | 7 | 0.0% |
| Cuban | 1,377 | 2.6% |
| Czech | 1,035 | 2.0% |
| Czechoslovakian | 141 | 0.3% |
| Danish | 872 | 1.7% |
| Dutch | 688 | 1.3% |
| Eastern European | 63 | 0.1% |
| Ecuadorian | 12 | 0.0% |
| English | 3,433 | 6.5% |
| Ethiopian | 31 | 0.1% |
| European | 293 | 0.5% |
| Filipino | 27 | 0.1% |
| Finnish | 137 | 0.3% |
| French | 682 | 1.3% |
| French Canadian | 59 | 0.1% |
| German | 13,173 | 24.9% |
| Greek | 59 | 0.1% |
| Guamanian / Chamorro | 162 | 0.3% |
| Guatemalan | 3,596 | 6.8% |
| Honduran | 146 | 0.3% |
| Hungarian | 8 | 0.0% |
| Indian (Asian) | 103 | 0.2% |
| Indonesian | 3 | 0.0% |
| Irish | 4,786 | 9.1% |
| Italian | 475 | 0.9% |
| Kiowa | 4 | 0.0% |
| Korean | 131 | 0.3% |
| Lebanese | 37 | 0.1% |
| Malaysian | 440 | 0.8% |
| Mexican | 10,036 | 19.0% |
| Mexican American Indian | 211 | 0.4% |
| Native Hawaiian | 120 | 0.2% |
| Navajo | 1 | 0.0% |
| Nicaraguan | 21 | 0.0% |
| Nigerian | 17 | 0.0% |
| Northern European | 37 | 0.1% |
| Norwegian | 301 | 0.6% |
| Pakistani | 68 | 0.1% |
| Peruvian | 11 | 0.0% |
| Polish | 1,909 | 3.6% |
| Portuguese | 16 | 0.0% |
| Puerto Rican | 162 | 0.3% |
| Romanian | 8 | 0.0% |
| Russian | 141 | 0.3% |
| Salvadoran | 811 | 1.5% |
| Scandinavian | 26 | 0.1% |
| Scotch-Irish | 278 | 0.5% |
| Scottish | 414 | 0.8% |
| Serbian | 31 | 0.1% |
| Sioux | 64 | 0.1% |
| Slavic | 11 | 0.0% |
| Somali | 103 | 0.2% |
| South American | 588 | 1.1% |
| Spaniard | 111 | 0.2% |
| Spanish | 847 | 1.6% |
| Sri Lankan | 110 | 0.2% |
| Subsaharan African | 1,059 | 2.0% |
| Sudanese | 488 | 0.9% |
| Swedish | 938 | 1.8% |
| Swiss | 82 | 0.2% |
| Thai | 19 | 0.0% |
| Trinidadian and Tobagonian | 7 | 0.0% |
| Turkish | 28 | 0.1% |
| Venezuelan | 328 | 0.6% |
| Welsh | 171 | 0.3% | View All 80 Rows |
Immigrants in Grand Island
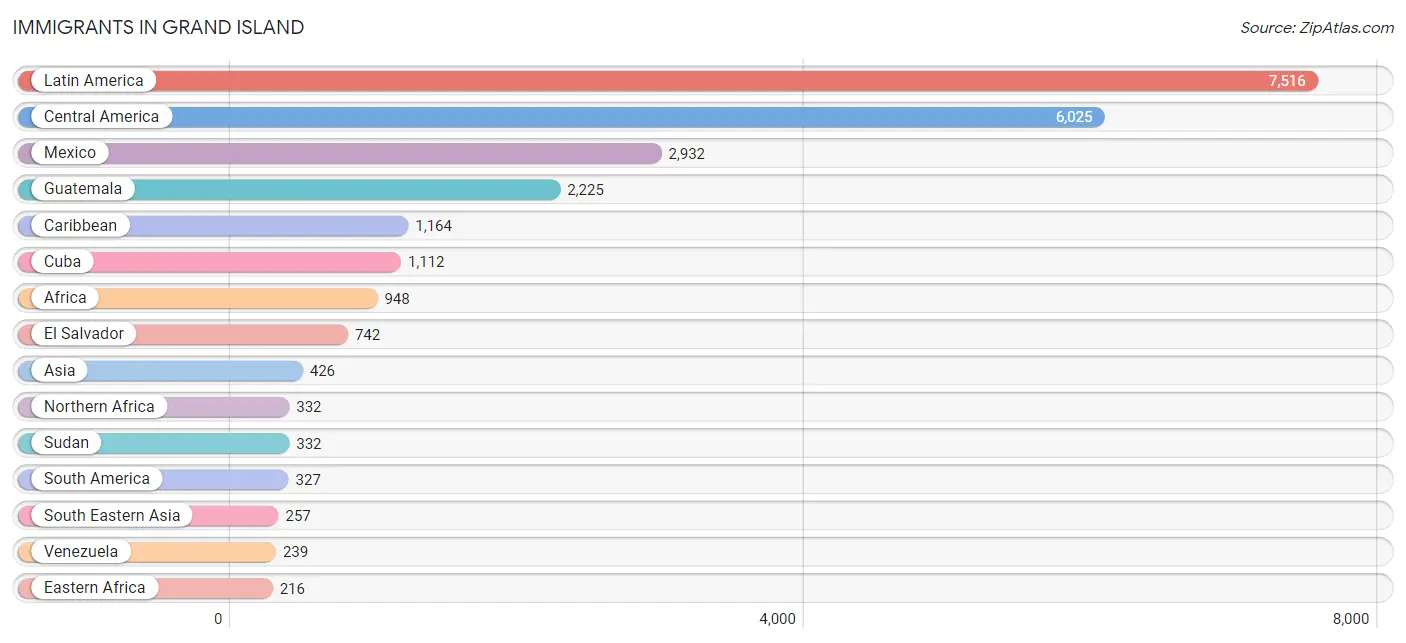
The most numerous immigrant groups reported in Grand Island came from Latin America (7,516 | 14.2%), Central America (6,025 | 11.4%), Mexico (2,932 | 5.6%), Guatemala (2,225 | 4.2%), and Caribbean (1,164 | 2.2%), together accounting for 37.6% of all Grand Island residents.
| Immigration Origin | # Population | % Population |
| Africa | 948 | 1.8% |
| Asia | 426 | 0.8% |
| Brazil | 46 | 0.1% |
| Caribbean | 1,164 | 2.2% |
| Central America | 6,025 | 11.4% |
| Chile | 23 | 0.0% |
| China | 94 | 0.2% |
| Colombia | 7 | 0.0% |
| Cuba | 1,112 | 2.1% |
| Eastern Africa | 216 | 0.4% |
| Eastern Asia | 117 | 0.2% |
| Eastern Europe | 2 | 0.0% |
| Ecuador | 12 | 0.0% |
| El Salvador | 742 | 1.4% |
| England | 4 | 0.0% |
| Ethiopia | 31 | 0.1% |
| Europe | 56 | 0.1% |
| Germany | 1 | 0.0% |
| Guatemala | 2,225 | 4.2% |
| Honduras | 89 | 0.2% |
| India | 19 | 0.0% |
| Japan | 15 | 0.0% |
| Korea | 8 | 0.0% |
| Laos | 115 | 0.2% |
| Latin America | 7,516 | 14.2% |
| Mexico | 2,932 | 5.6% |
| Middle Africa | 106 | 0.2% |
| Netherlands | 14 | 0.0% |
| Nicaragua | 4 | 0.0% |
| Northern Africa | 332 | 0.6% |
| Northern Europe | 4 | 0.0% |
| Philippines | 10 | 0.0% |
| Romania | 1 | 0.0% |
| Russia | 1 | 0.0% |
| Saudi Arabia | 33 | 0.1% |
| Somalia | 116 | 0.2% |
| South America | 327 | 0.6% |
| South Central Asia | 19 | 0.0% |
| South Eastern Asia | 257 | 0.5% |
| Southern Europe | 35 | 0.1% |
| Spain | 35 | 0.1% |
| Sudan | 332 | 0.6% |
| Taiwan | 18 | 0.0% |
| Thailand | 48 | 0.1% |
| Trinidad and Tobago | 52 | 0.1% |
| Venezuela | 239 | 0.4% |
| Vietnam | 84 | 0.2% |
| Western Asia | 33 | 0.1% |
| Western Europe | 15 | 0.0% | View All 49 Rows |
Sex and Age in Grand Island
Sex and Age in Grand Island
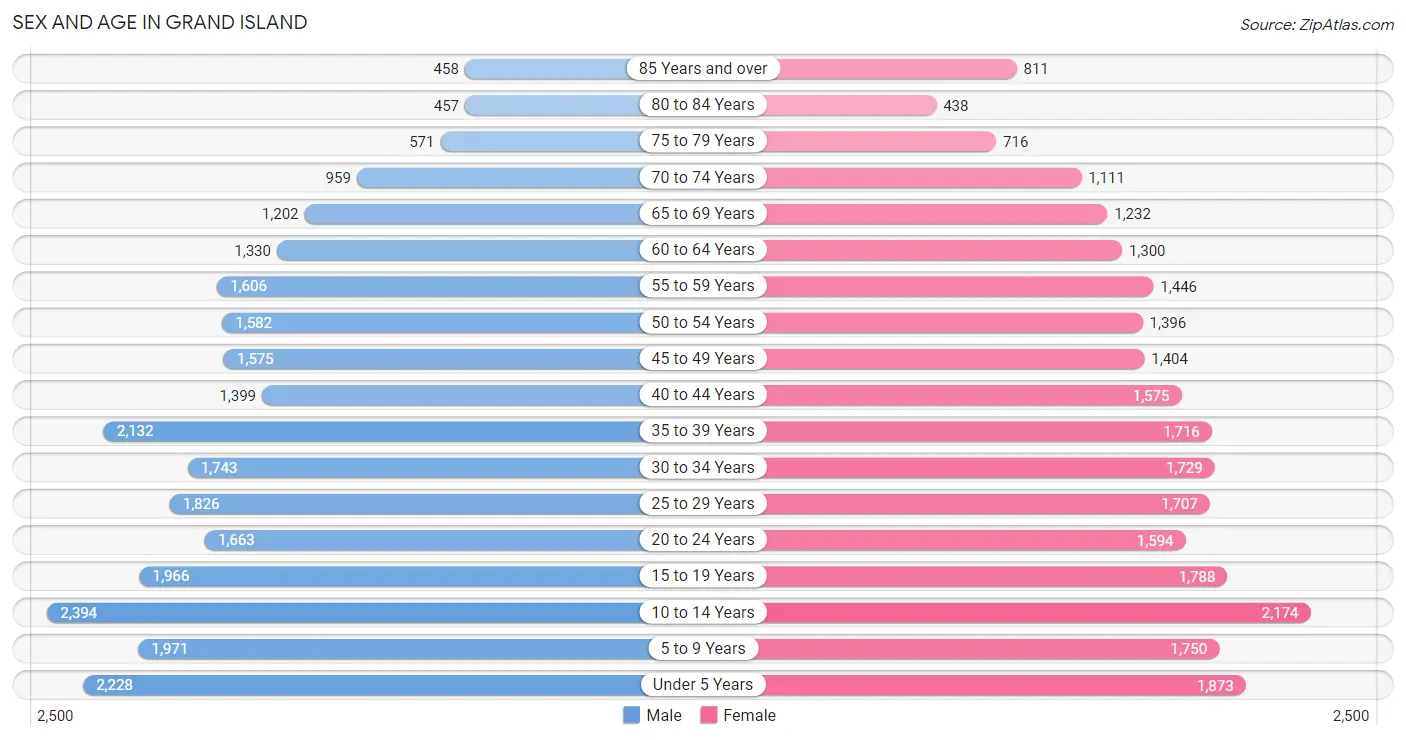
The most populous age groups in Grand Island are 10 to 14 Years (2,394 | 8.8%) for men and 10 to 14 Years (2,174 | 8.4%) for women.
| Age Bracket | Male | Female |
| Under 5 Years | 2,228 (8.2%) | 1,873 (7.3%) |
| 5 to 9 Years | 1,971 (7.3%) | 1,750 (6.8%) |
| 10 to 14 Years | 2,394 (8.8%) | 2,174 (8.4%) |
| 15 to 19 Years | 1,966 (7.3%) | 1,788 (6.9%) |
| 20 to 24 Years | 1,663 (6.1%) | 1,594 (6.2%) |
| 25 to 29 Years | 1,826 (6.8%) | 1,707 (6.6%) |
| 30 to 34 Years | 1,743 (6.4%) | 1,729 (6.7%) |
| 35 to 39 Years | 2,132 (7.9%) | 1,716 (6.7%) |
| 40 to 44 Years | 1,399 (5.2%) | 1,575 (6.1%) |
| 45 to 49 Years | 1,575 (5.8%) | 1,404 (5.4%) |
| 50 to 54 Years | 1,582 (5.9%) | 1,396 (5.4%) |
| 55 to 59 Years | 1,606 (5.9%) | 1,446 (5.6%) |
| 60 to 64 Years | 1,330 (4.9%) | 1,300 (5.1%) |
| 65 to 69 Years | 1,202 (4.4%) | 1,232 (4.8%) |
| 70 to 74 Years | 959 (3.5%) | 1,111 (4.3%) |
| 75 to 79 Years | 571 (2.1%) | 716 (2.8%) |
| 80 to 84 Years | 457 (1.7%) | 438 (1.7%) |
| 85 Years and over | 458 (1.7%) | 811 (3.2%) |
| Total | 27,062 (100.0%) | 25,760 (100.0%) |
Families and Households in Grand Island
Median Family Size in Grand Island
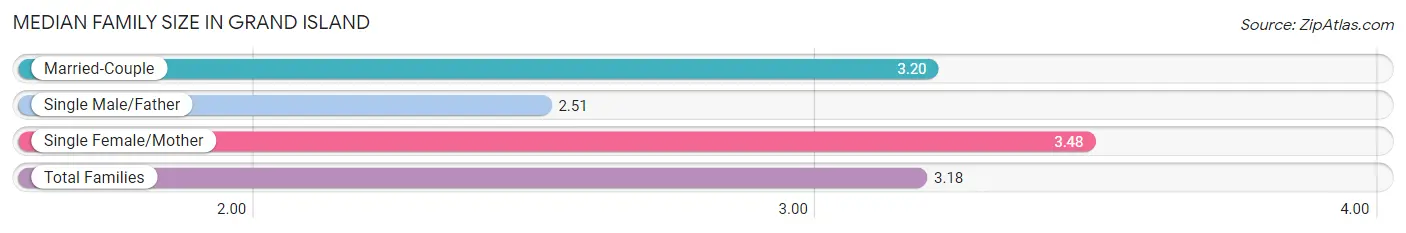
The median family size in Grand Island is 3.18 persons per family, with single female/mother families (2,552 | 19.7%) accounting for the largest median family size of 3.48 persons per family. On the other hand, single male/father families (1,273 | 9.8%) represent the smallest median family size with 2.51 persons per family.
| Family Type | # Families | Family Size |
| Married-Couple | 9,107 (70.4%) | 3.20 |
| Single Male/Father | 1,273 (9.8%) | 2.51 |
| Single Female/Mother | 2,552 (19.7%) | 3.48 |
| Total Families | 12,932 (100.0%) | 3.18 |
Median Household Size in Grand Island
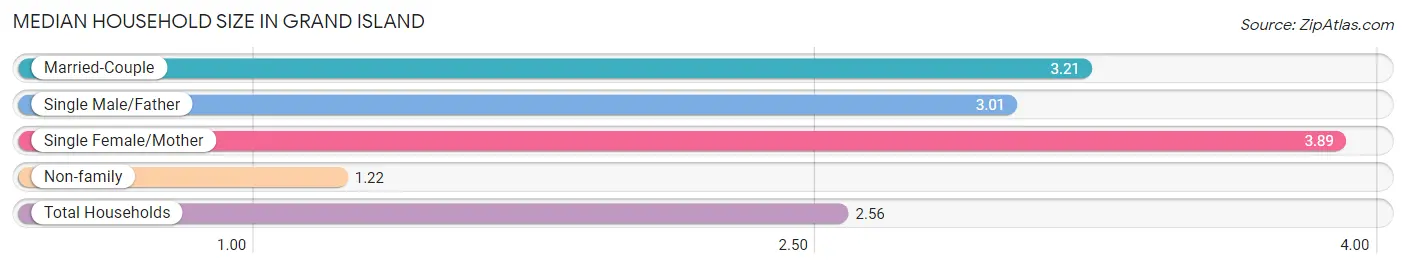
The median household size in Grand Island is 2.56 persons per household, with single female/mother households (2,552 | 12.6%) accounting for the largest median household size of 3.89 persons per household. non-family households (7,331 | 36.2%) represent the smallest median household size with 1.22 persons per household.
| Household Type | # Households | Household Size |
| Married-Couple | 9,107 (44.9%) | 3.21 |
| Single Male/Father | 1,273 (6.3%) | 3.01 |
| Single Female/Mother | 2,552 (12.6%) | 3.89 |
| Non-family | 7,331 (36.2%) | 1.22 |
| Total Households | 20,263 (100.0%) | 2.56 |
Household Size by Marriage Status in Grand Island
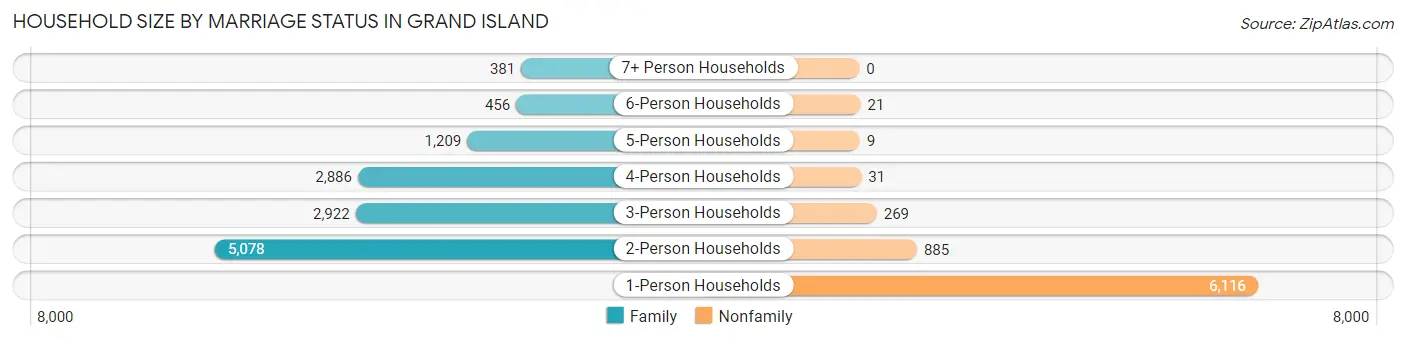
Out of a total of 20,263 households in Grand Island, 12,932 (63.8%) are family households, while 7,331 (36.2%) are nonfamily households. The most numerous type of family households are 2-person households, comprising 5,078, and the most common type of nonfamily households are 1-person households, comprising 6,116.
| Household Size | Family Households | Nonfamily Households |
| 1-Person Households | - | 6,116 (30.2%) |
| 2-Person Households | 5,078 (25.1%) | 885 (4.4%) |
| 3-Person Households | 2,922 (14.4%) | 269 (1.3%) |
| 4-Person Households | 2,886 (14.2%) | 31 (0.2%) |
| 5-Person Households | 1,209 (6.0%) | 9 (0.0%) |
| 6-Person Households | 456 (2.2%) | 21 (0.1%) |
| 7+ Person Households | 381 (1.9%) | 0 (0.0%) |
| Total | 12,932 (63.8%) | 7,331 (36.2%) |
Female Fertility in Grand Island
Fertility by Age in Grand Island
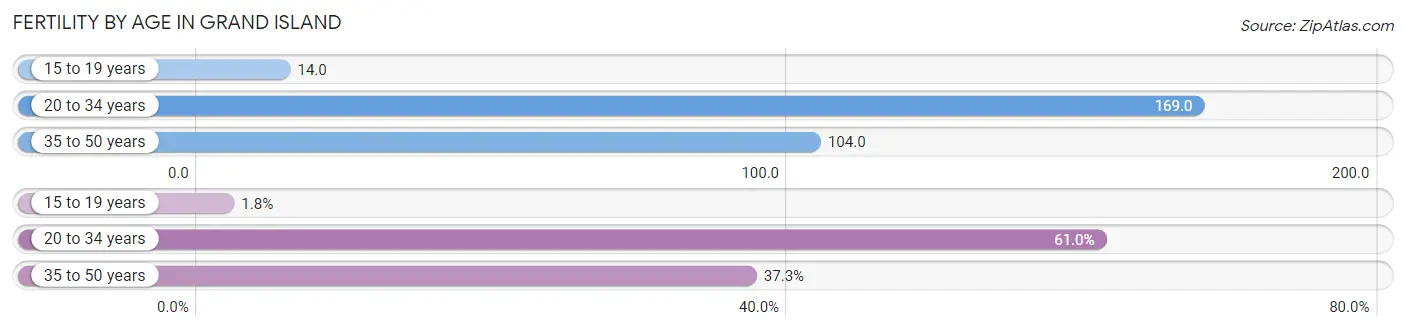
Average fertility rate in Grand Island is 118.0 births per 1,000 women. Women in the age bracket of 20 to 34 years have the highest fertility rate with 169.0 births per 1,000 women. Women in the age bracket of 20 to 34 years acount for 61.0% of all women with births.
| Age Bracket | Women with Births | Births / 1,000 Women |
| 15 to 19 years | 25 (1.8%) | 14.0 |
| 20 to 34 years | 851 (61.0%) | 169.0 |
| 35 to 50 years | 520 (37.2%) | 104.0 |
| Total | 1,396 (100.0%) | 118.0 |
Fertility by Age by Marriage Status in Grand Island
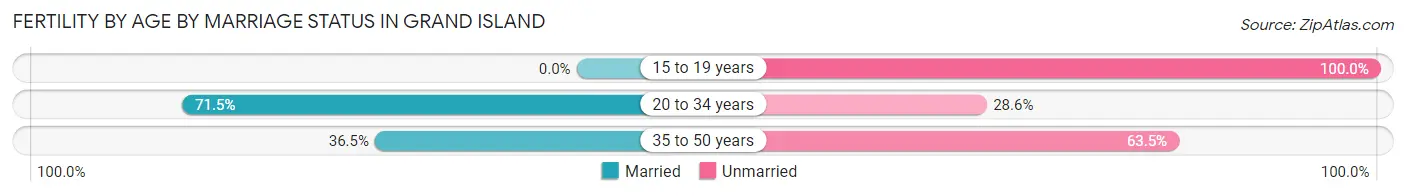
57.2% of women with births (1,396) in Grand Island are married. The highest percentage of unmarried women with births falls into 15 to 19 years age bracket with 100.0% of them unmarried at the time of birth, while the lowest percentage of unmarried women with births belong to 20 to 34 years age bracket with 28.5% of them unmarried.
| Age Bracket | Married | Unmarried |
| 15 to 19 years | 0 (0.0%) | 25 (100.0%) |
| 20 to 34 years | 608 (71.5%) | 243 (28.5%) |
| 35 to 50 years | 190 (36.5%) | 330 (63.5%) |
| Total | 799 (57.2%) | 597 (42.8%) |
Fertility by Education in Grand Island
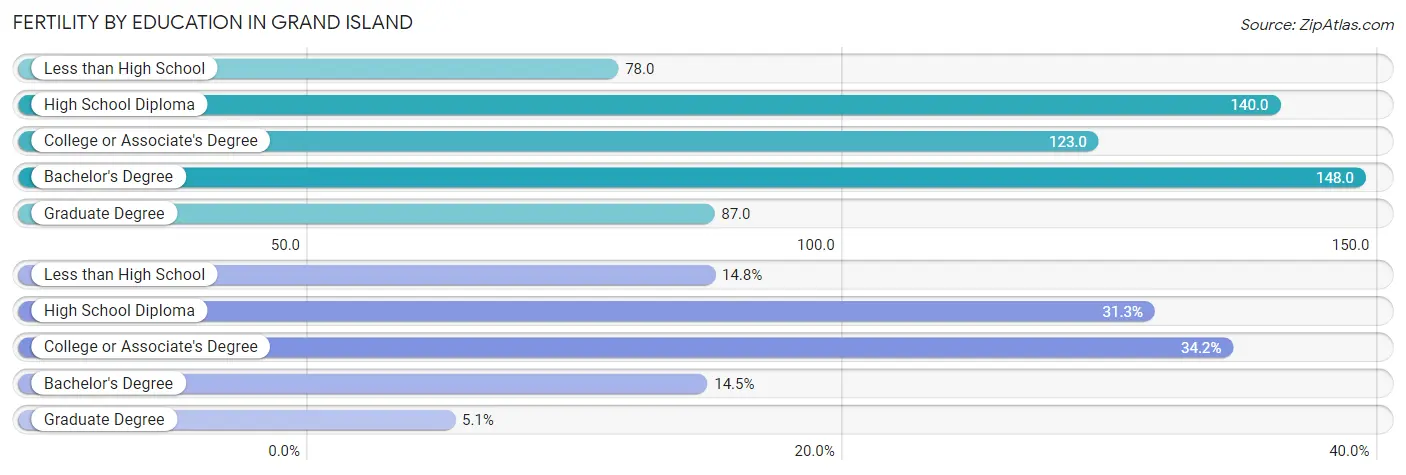
Average fertility rate in Grand Island is 118.0 births per 1,000 women. Women with the education attainment of bachelor's degree have the highest fertility rate of 148.0 births per 1,000 women, while women with the education attainment of less than high school have the lowest fertility at 78.0 births per 1,000 women. Women with the education attainment of college or associate's degree represent 34.2% of all women with births.
| Educational Attainment | Women with Births | Births / 1,000 Women |
| Less than High School | 207 (14.8%) | 78.0 |
| High School Diploma | 437 (31.3%) | 140.0 |
| College or Associate's Degree | 478 (34.2%) | 123.0 |
| Bachelor's Degree | 203 (14.5%) | 148.0 |
| Graduate Degree | 71 (5.1%) | 87.0 |
| Total | 1,396 (100.0%) | 118.0 |
Fertility by Education by Marriage Status in Grand Island
42.8% of women with births in Grand Island are unmarried. Women with the educational attainment of bachelor's degree are most likely to be married with 87.7% of them married at childbirth, while women with the educational attainment of high school diploma are least likely to be married with 69.6% of them unmarried at childbirth.
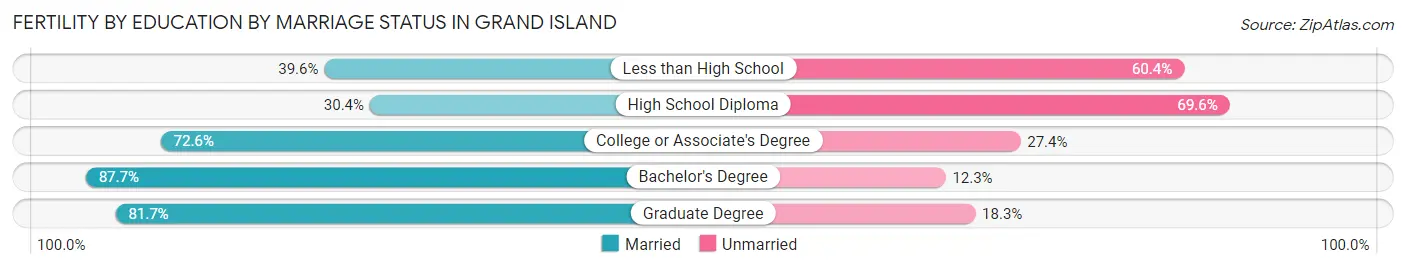
| Educational Attainment | Married | Unmarried |
| Less than High School | 82 (39.6%) | 125 (60.4%) |
| High School Diploma | 133 (30.4%) | 304 (69.6%) |
| College or Associate's Degree | 347 (72.6%) | 131 (27.4%) |
| Bachelor's Degree | 178 (87.7%) | 25 (12.3%) |
| Graduate Degree | 58 (81.7%) | 13 (18.3%) |
| Total | 799 (57.2%) | 597 (42.8%) |
Employment Characteristics in Grand Island
Employment by Class of Employer in Grand Island
Among the 25,360 employed individuals in Grand Island, private company employees (18,433 | 72.7%), not-for-profit organizations (2,157 | 8.5%), and local government employees (2,065 | 8.1%) make up the most common classes of employment.
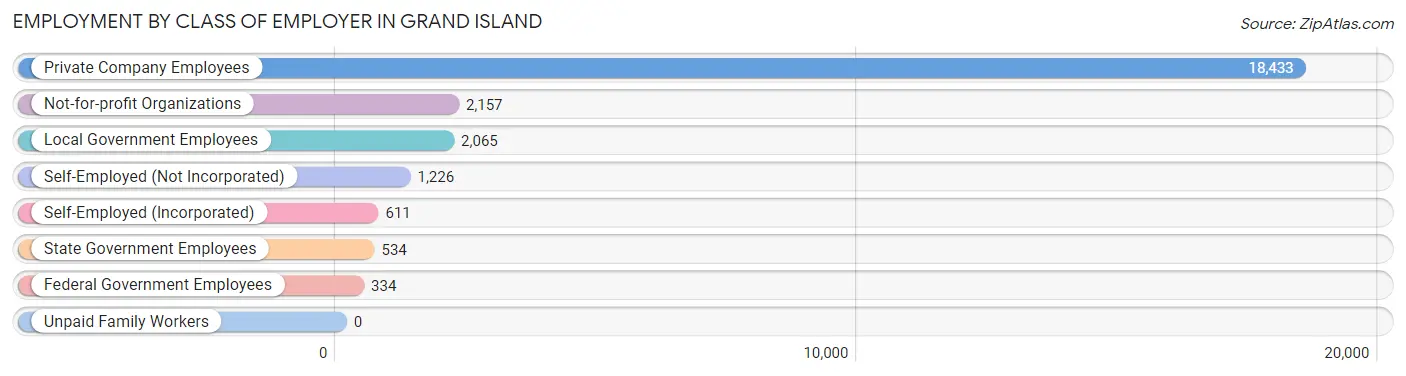
| Employer Class | # Employees | % Employees |
| Private Company Employees | 18,433 | 72.7% |
| Self-Employed (Incorporated) | 611 | 2.4% |
| Self-Employed (Not Incorporated) | 1,226 | 4.8% |
| Not-for-profit Organizations | 2,157 | 8.5% |
| Local Government Employees | 2,065 | 8.1% |
| State Government Employees | 534 | 2.1% |
| Federal Government Employees | 334 | 1.3% |
| Unpaid Family Workers | 0 | 0.0% |
| Total | 25,360 | 100.0% |
Employment Status by Age in Grand Island
According to the labor force statistics for Grand Island, out of the total population over 16 years of age (39,518), 67.8% or 26,793 individuals are in the labor force, with 3.1% or 831 of them unemployed. The age group with the highest labor force participation rate is 25 to 29 years, with 88.9% or 3,141 individuals in the labor force. Within the labor force, the 16 to 19 years age range has the highest percentage of unemployed individuals, with 7.8% or 111 of them being unemployed.
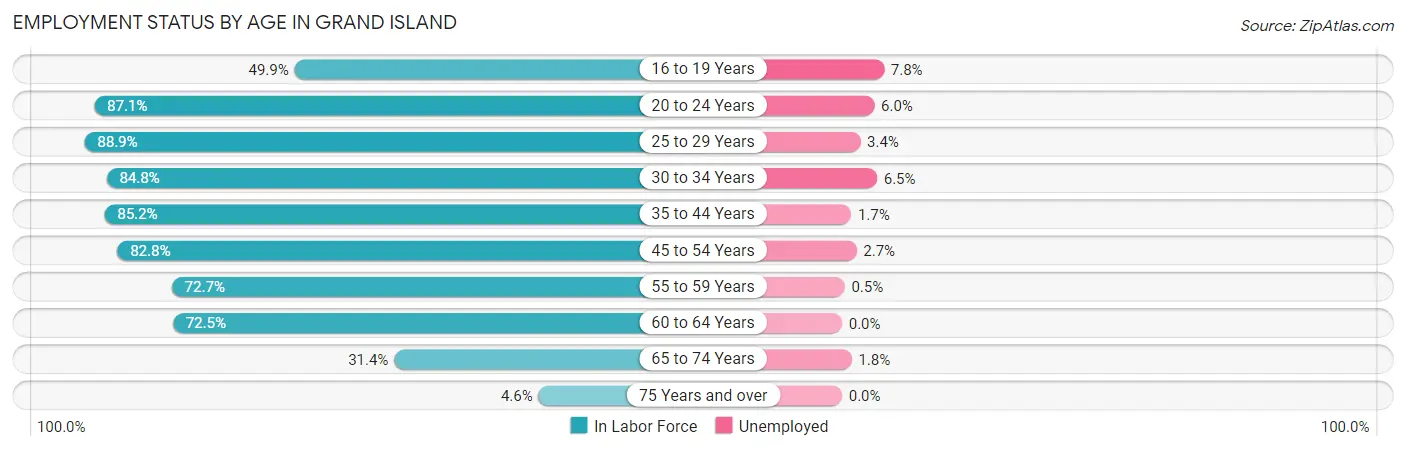
| Age Bracket | In Labor Force | Unemployed |
| 16 to 19 Years | 1,417 (49.9%) | 111 (7.8%) |
| 20 to 24 Years | 2,837 (87.1%) | 170 (6.0%) |
| 25 to 29 Years | 3,141 (88.9%) | 107 (3.4%) |
| 30 to 34 Years | 2,944 (84.8%) | 191 (6.5%) |
| 35 to 44 Years | 5,812 (85.2%) | 99 (1.7%) |
| 45 to 54 Years | 4,932 (82.8%) | 133 (2.7%) |
| 55 to 59 Years | 2,219 (72.7%) | 11 (0.5%) |
| 60 to 64 Years | 1,907 (72.5%) | 0 (0.0%) |
| 65 to 74 Years | 1,414 (31.4%) | 25 (1.8%) |
| 75 Years and over | 159 (4.6%) | 0 (0.0%) |
| Total | 26,793 (67.8%) | 831 (3.1%) |
Employment Status by Educational Attainment in Grand Island
According to labor force statistics for Grand Island, 82.3% of individuals (20,959) out of the total population between 25 and 64 years of age (25,466) are in the labor force, with 2.6% or 545 of them being unemployed. The group with the highest labor force participation rate are those with the educational attainment of bachelor's degree or higher, with 91.7% or 5,048 individuals in the labor force. Within the labor force, individuals with less than high school education have the highest percentage of unemployment, with 3.7% or 122 of them being unemployed.
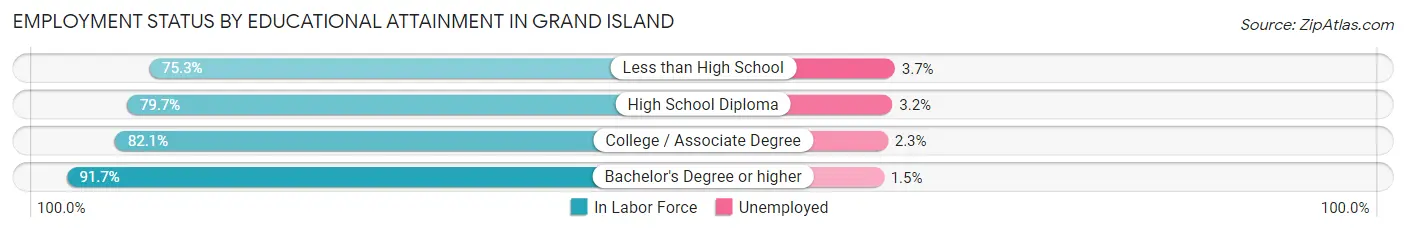
| Educational Attainment | In Labor Force | Unemployed |
| Less than High School | 3,308 (75.3%) | 163 (3.7%) |
| High School Diploma | 5,997 (79.7%) | 241 (3.2%) |
| College / Associate Degree | 6,603 (82.1%) | 185 (2.3%) |
| Bachelor's Degree or higher | 5,048 (91.7%) | 83 (1.5%) |
| Total | 20,959 (82.3%) | 662 (2.6%) |
Employment Occupations by Sex in Grand Island
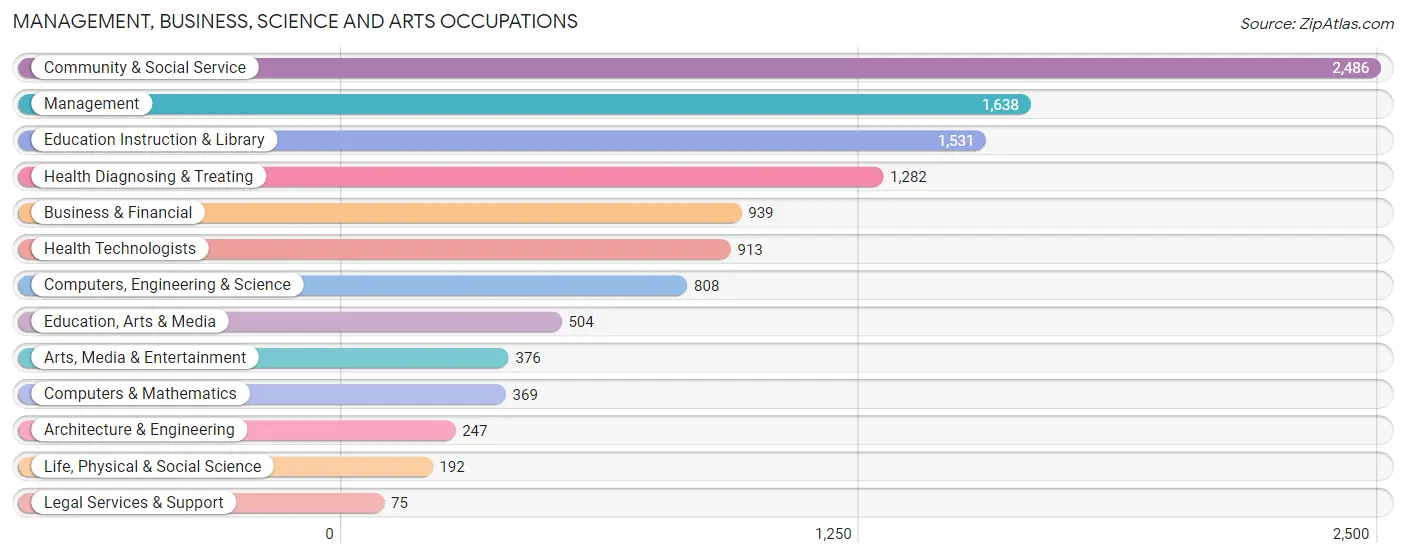
Management, Business, Science and Arts Occupations
The most common Management, Business, Science and Arts occupations in Grand Island are Community & Social Service (2,486 | 9.6%), Management (1,638 | 6.3%), Education Instruction & Library (1,531 | 5.9%), Health Diagnosing & Treating (1,282 | 4.9%), and Business & Financial (939 | 3.6%).
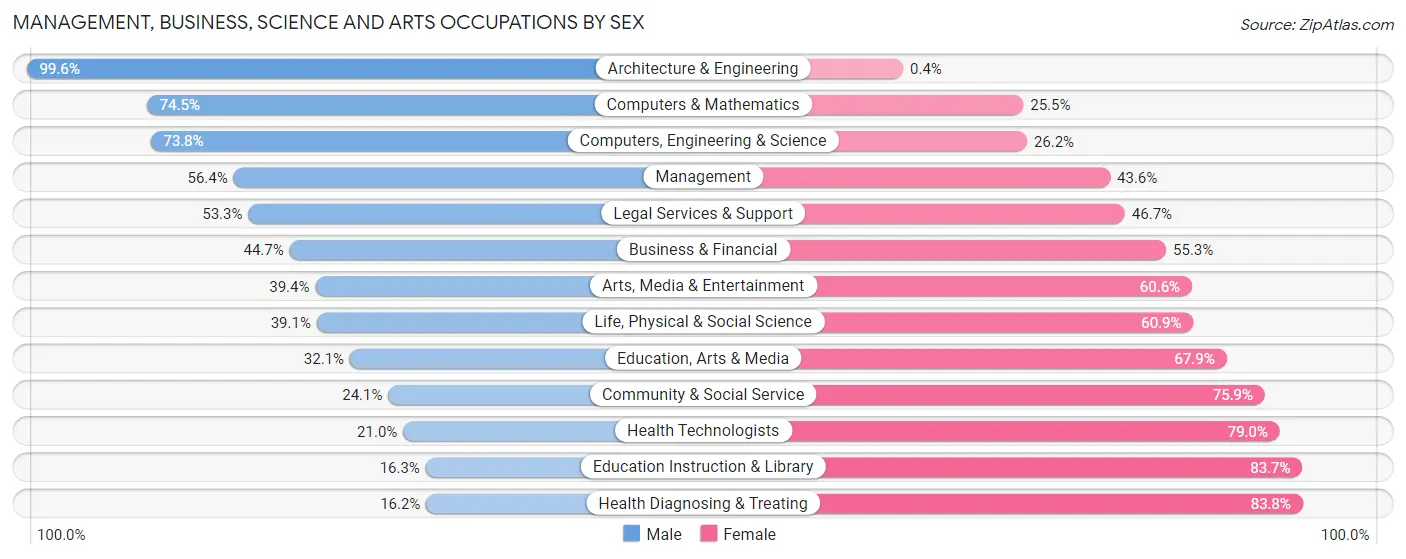
Management, Business, Science and Arts Occupations by Sex
Within the Management, Business, Science and Arts occupations in Grand Island, the most male-oriented occupations are Architecture & Engineering (99.6%), Computers & Mathematics (74.5%), and Computers, Engineering & Science (73.8%), while the most female-oriented occupations are Health Diagnosing & Treating (83.8%), Education Instruction & Library (83.7%), and Health Technologists (79.0%).
| Occupation | Male | Female |
| Management | 924 (56.4%) | 714 (43.6%) |
| Business & Financial | 420 (44.7%) | 519 (55.3%) |
| Computers, Engineering & Science | 596 (73.8%) | 212 (26.2%) |
| Computers & Mathematics | 275 (74.5%) | 94 (25.5%) |
| Architecture & Engineering | 246 (99.6%) | 1 (0.4%) |
| Life, Physical & Social Science | 75 (39.1%) | 117 (60.9%) |
| Community & Social Service | 600 (24.1%) | 1,886 (75.9%) |
| Education, Arts & Media | 162 (32.1%) | 342 (67.9%) |
| Legal Services & Support | 40 (53.3%) | 35 (46.7%) |
| Education Instruction & Library | 250 (16.3%) | 1,281 (83.7%) |
| Arts, Media & Entertainment | 148 (39.4%) | 228 (60.6%) |
| Health Diagnosing & Treating | 208 (16.2%) | 1,074 (83.8%) |
| Health Technologists | 192 (21.0%) | 721 (79.0%) |
| Total (Category) | 2,748 (38.4%) | 4,405 (61.6%) |
| Total (Overall) | 13,919 (53.6%) | 12,024 (46.4%) |
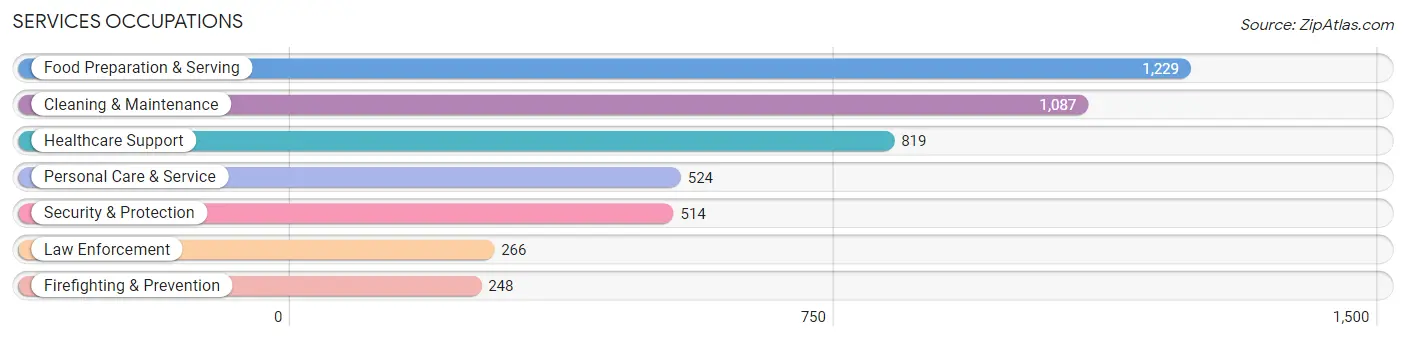
Services Occupations
The most common Services occupations in Grand Island are Food Preparation & Serving (1,229 | 4.7%), Cleaning & Maintenance (1,087 | 4.2%), Healthcare Support (819 | 3.2%), Personal Care & Service (524 | 2.0%), and Security & Protection (514 | 2.0%).
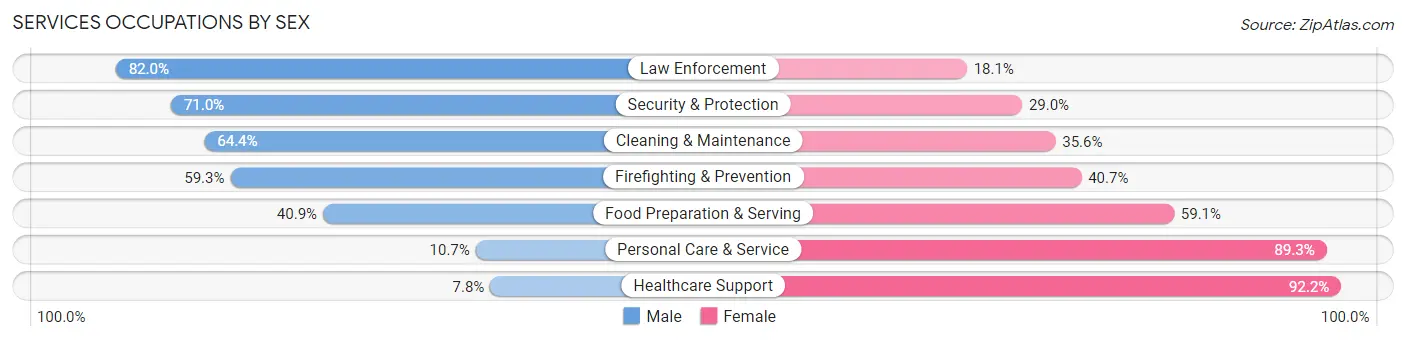
Services Occupations by Sex
Within the Services occupations in Grand Island, the most male-oriented occupations are Law Enforcement (82.0%), Security & Protection (71.0%), and Cleaning & Maintenance (64.4%), while the most female-oriented occupations are Healthcare Support (92.2%), Personal Care & Service (89.3%), and Food Preparation & Serving (59.1%).
| Occupation | Male | Female |
| Healthcare Support | 64 (7.8%) | 755 (92.2%) |
| Security & Protection | 365 (71.0%) | 149 (29.0%) |
| Firefighting & Prevention | 147 (59.3%) | 101 (40.7%) |
| Law Enforcement | 218 (82.0%) | 48 (18.0%) |
| Food Preparation & Serving | 503 (40.9%) | 726 (59.1%) |
| Cleaning & Maintenance | 700 (64.4%) | 387 (35.6%) |
| Personal Care & Service | 56 (10.7%) | 468 (89.3%) |
| Total (Category) | 1,688 (40.5%) | 2,485 (59.6%) |
| Total (Overall) | 13,919 (53.6%) | 12,024 (46.4%) |
Sales and Office Occupations
The most common Sales and Office occupations in Grand Island are Office & Administration (2,717 | 10.5%), and Sales & Related (2,346 | 9.0%).

Sales and Office Occupations by Sex
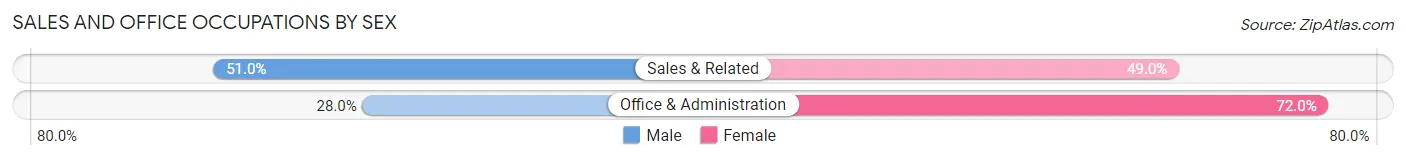
| Occupation | Male | Female |
| Sales & Related | 1,196 (51.0%) | 1,150 (49.0%) |
| Office & Administration | 761 (28.0%) | 1,956 (72.0%) |
| Total (Category) | 1,957 (38.7%) | 3,106 (61.4%) |
| Total (Overall) | 13,919 (53.6%) | 12,024 (46.4%) |
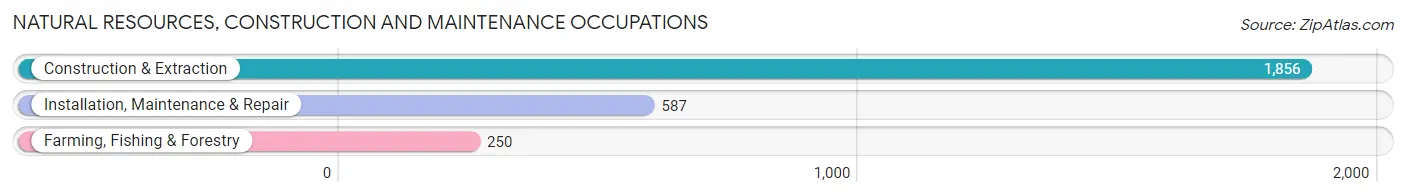
Natural Resources, Construction and Maintenance Occupations
The most common Natural Resources, Construction and Maintenance occupations in Grand Island are Construction & Extraction (1,856 | 7.1%), Installation, Maintenance & Repair (587 | 2.3%), and Farming, Fishing & Forestry (250 | 1.0%).
Natural Resources, Construction and Maintenance Occupations by Sex
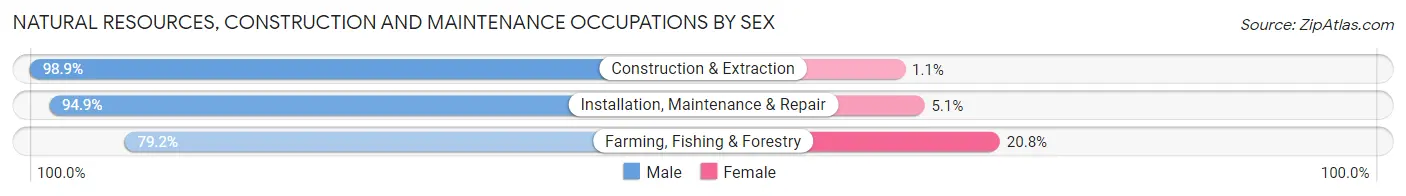
| Occupation | Male | Female |
| Farming, Fishing & Forestry | 198 (79.2%) | 52 (20.8%) |
| Construction & Extraction | 1,836 (98.9%) | 20 (1.1%) |
| Installation, Maintenance & Repair | 557 (94.9%) | 30 (5.1%) |
| Total (Category) | 2,591 (96.2%) | 102 (3.8%) |
| Total (Overall) | 13,919 (53.6%) | 12,024 (46.4%) |
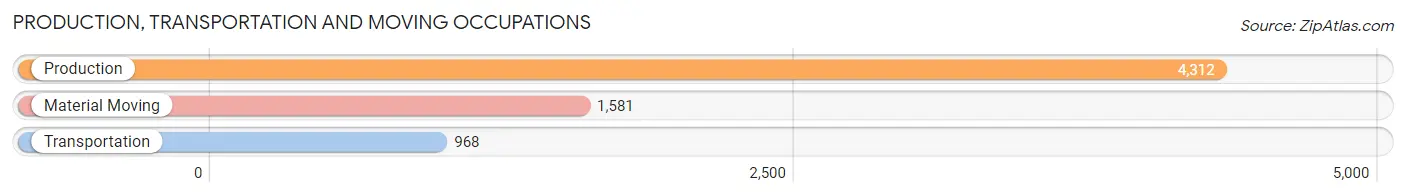
Production, Transportation and Moving Occupations
The most common Production, Transportation and Moving occupations in Grand Island are Production (4,312 | 16.6%), Material Moving (1,581 | 6.1%), and Transportation (968 | 3.7%).
Production, Transportation and Moving Occupations by Sex
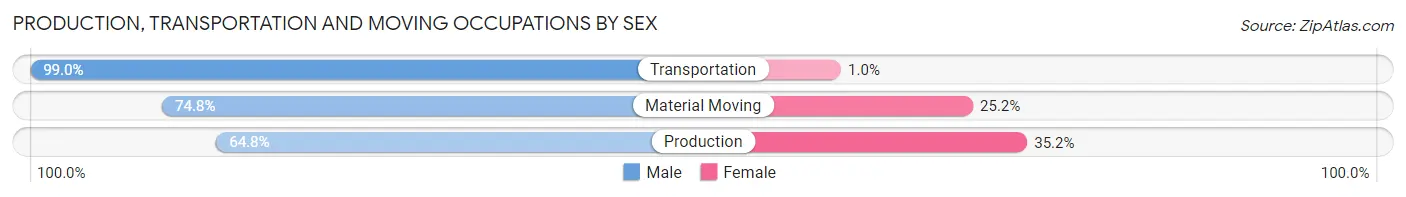
| Occupation | Male | Female |
| Production | 2,795 (64.8%) | 1,517 (35.2%) |
| Transportation | 958 (99.0%) | 10 (1.0%) |
| Material Moving | 1,182 (74.8%) | 399 (25.2%) |
| Total (Category) | 4,935 (71.9%) | 1,926 (28.1%) |
| Total (Overall) | 13,919 (53.6%) | 12,024 (46.4%) |
Employment Industries by Sex in Grand Island
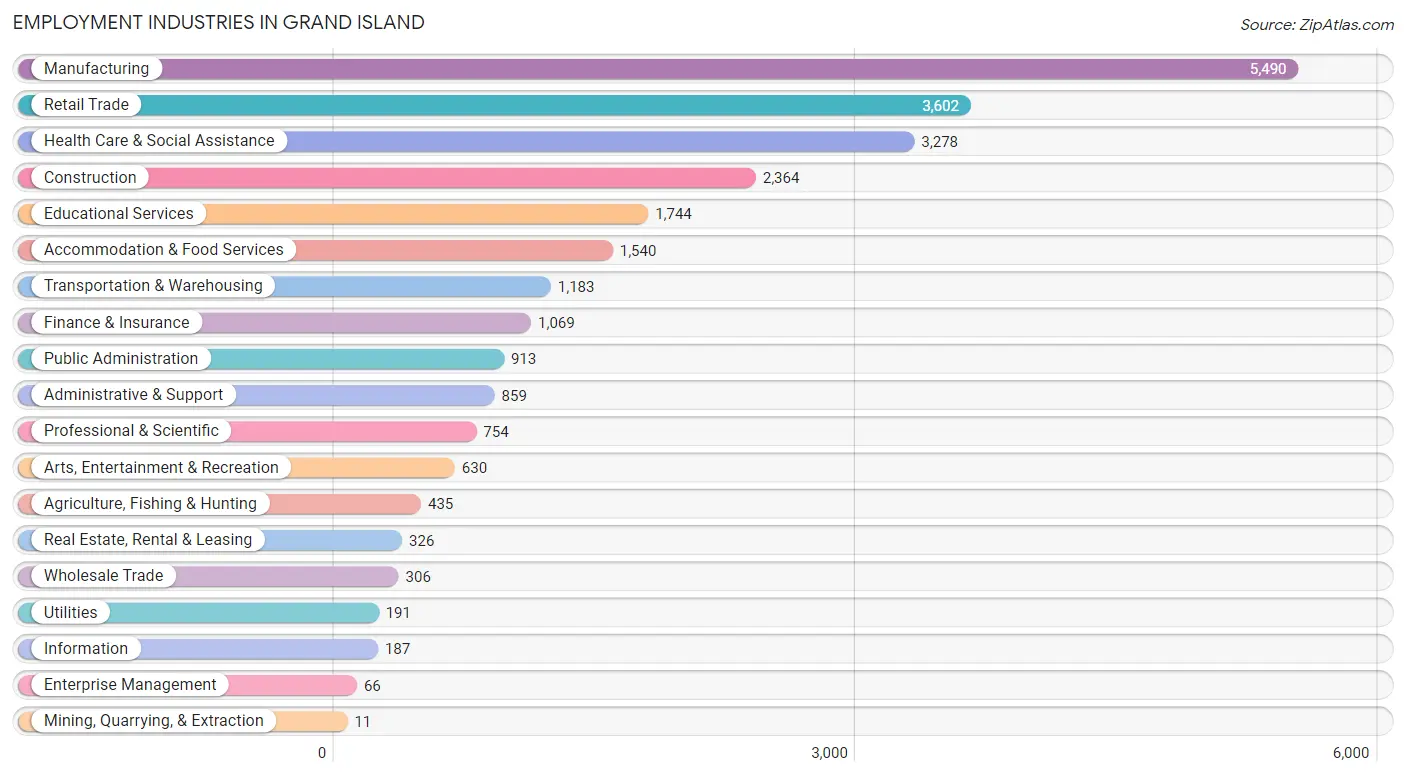
Employment Industries in Grand Island
The major employment industries in Grand Island include Manufacturing (5,490 | 21.2%), Retail Trade (3,602 | 13.9%), Health Care & Social Assistance (3,278 | 12.6%), Construction (2,364 | 9.1%), and Educational Services (1,744 | 6.7%).
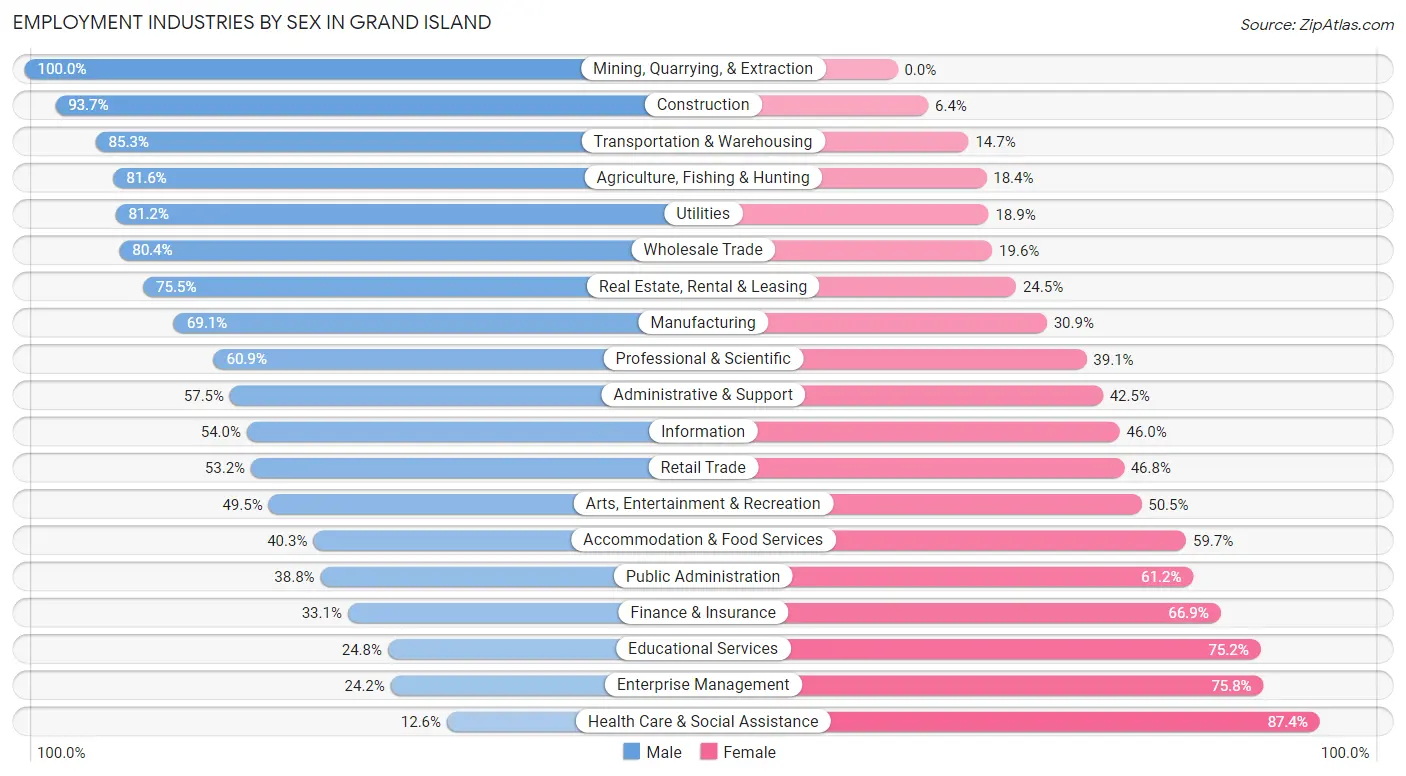
Employment Industries by Sex in Grand Island
The Grand Island industries that see more men than women are Mining, Quarrying, & Extraction (100.0%), Construction (93.6%), and Transportation & Warehousing (85.3%), whereas the industries that tend to have a higher number of women are Health Care & Social Assistance (87.4%), Enterprise Management (75.8%), and Educational Services (75.2%).
| Industry | Male | Female |
| Agriculture, Fishing & Hunting | 355 (81.6%) | 80 (18.4%) |
| Mining, Quarrying, & Extraction | 11 (100.0%) | 0 (0.0%) |
| Construction | 2,214 (93.6%) | 150 (6.4%) |
| Manufacturing | 3,793 (69.1%) | 1,697 (30.9%) |
| Wholesale Trade | 246 (80.4%) | 60 (19.6%) |
| Retail Trade | 1,915 (53.2%) | 1,687 (46.8%) |
| Transportation & Warehousing | 1,009 (85.3%) | 174 (14.7%) |
| Utilities | 155 (81.1%) | 36 (18.9%) |
| Information | 101 (54.0%) | 86 (46.0%) |
| Finance & Insurance | 354 (33.1%) | 715 (66.9%) |
| Real Estate, Rental & Leasing | 246 (75.5%) | 80 (24.5%) |
| Professional & Scientific | 459 (60.9%) | 295 (39.1%) |
| Enterprise Management | 16 (24.2%) | 50 (75.8%) |
| Administrative & Support | 494 (57.5%) | 365 (42.5%) |
| Educational Services | 433 (24.8%) | 1,311 (75.2%) |
| Health Care & Social Assistance | 413 (12.6%) | 2,865 (87.4%) |
| Arts, Entertainment & Recreation | 312 (49.5%) | 318 (50.5%) |
| Accommodation & Food Services | 620 (40.3%) | 920 (59.7%) |
| Public Administration | 354 (38.8%) | 559 (61.2%) |
| Total | 13,919 (53.6%) | 12,024 (46.4%) |
Education in Grand Island
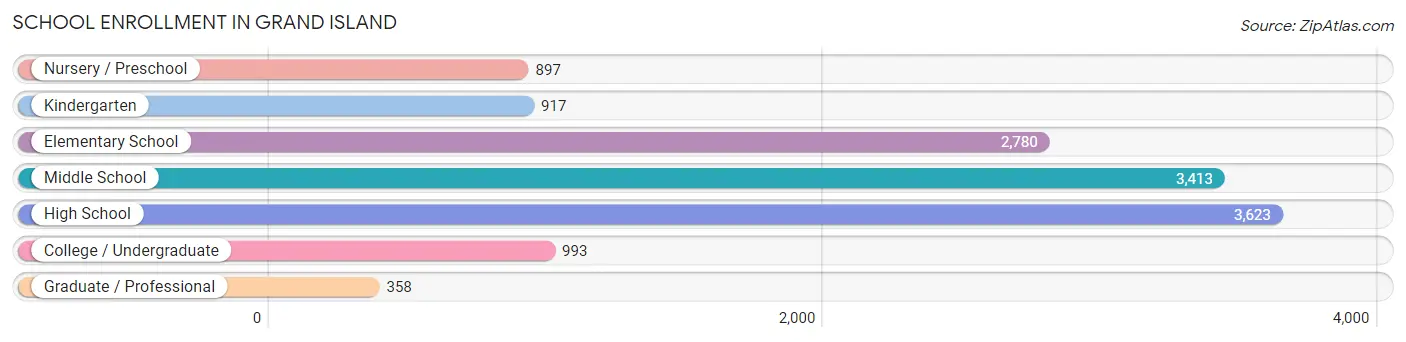
School Enrollment in Grand Island
The most common levels of schooling among the 12,981 students in Grand Island are high school (3,623 | 27.9%), middle school (3,413 | 26.3%), and elementary school (2,780 | 21.4%).
| School Level | # Students | % Students |
| Nursery / Preschool | 897 | 6.9% |
| Kindergarten | 917 | 7.1% |
| Elementary School | 2,780 | 21.4% |
| Middle School | 3,413 | 26.3% |
| High School | 3,623 | 27.9% |
| College / Undergraduate | 993 | 7.6% |
| Graduate / Professional | 358 | 2.8% |
| Total | 12,981 | 100.0% |
School Enrollment by Age by Funding Source in Grand Island
Out of a total of 12,981 students who are enrolled in schools in Grand Island, 1,155 (8.9%) attend a private institution, while the remaining 11,826 (91.1%) are enrolled in public schools. The age group of 3 to 4 year olds has the highest likelihood of being enrolled in private schools, with 236 (34.5% in the age bracket) enrolled. Conversely, the age group of 10 to 14 year olds has the lowest likelihood of being enrolled in a private school, with 4,293 (95.7% in the age bracket) attending a public institution.
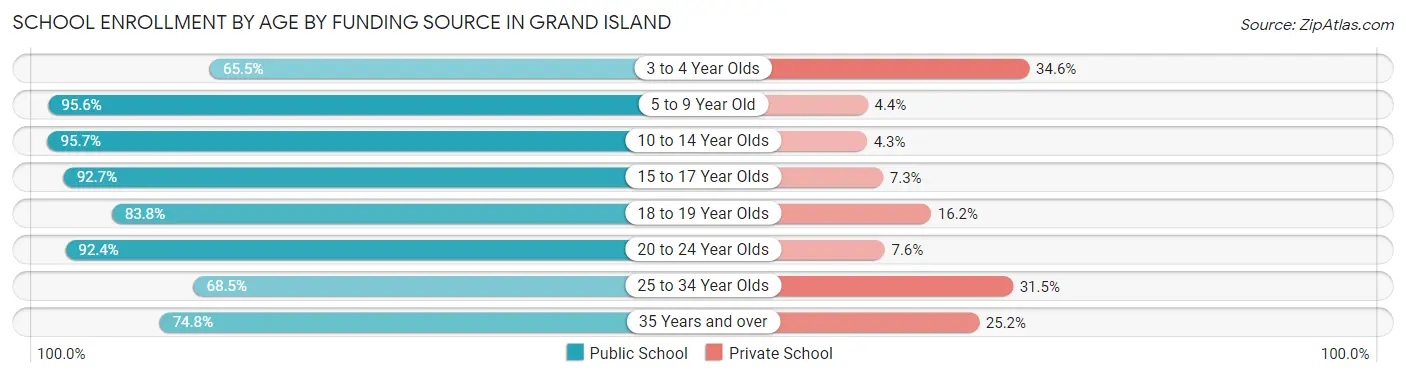
| Age Bracket | Public School | Private School |
| 3 to 4 Year Olds | 447 (65.4%) | 236 (34.5%) |
| 5 to 9 Year Old | 3,163 (95.6%) | 147 (4.4%) |
| 10 to 14 Year Olds | 4,293 (95.7%) | 193 (4.3%) |
| 15 to 17 Year Olds | 2,249 (92.7%) | 177 (7.3%) |
| 18 to 19 Year Olds | 753 (83.8%) | 146 (16.2%) |
| 20 to 24 Year Olds | 364 (92.4%) | 30 (7.6%) |
| 25 to 34 Year Olds | 248 (68.5%) | 114 (31.5%) |
| 35 Years and over | 315 (74.8%) | 106 (25.2%) |
| Total | 11,826 (91.1%) | 1,155 (8.9%) |
Educational Attainment by Field of Study in Grand Island
Business (1,793 | 23.8%), education (1,740 | 23.1%), science & technology (714 | 9.5%), arts & humanities (616 | 8.2%), and bio, nature & agricultural (540 | 7.2%) are the most common fields of study among 7,535 individuals in Grand Island who have obtained a bachelor's degree or higher.
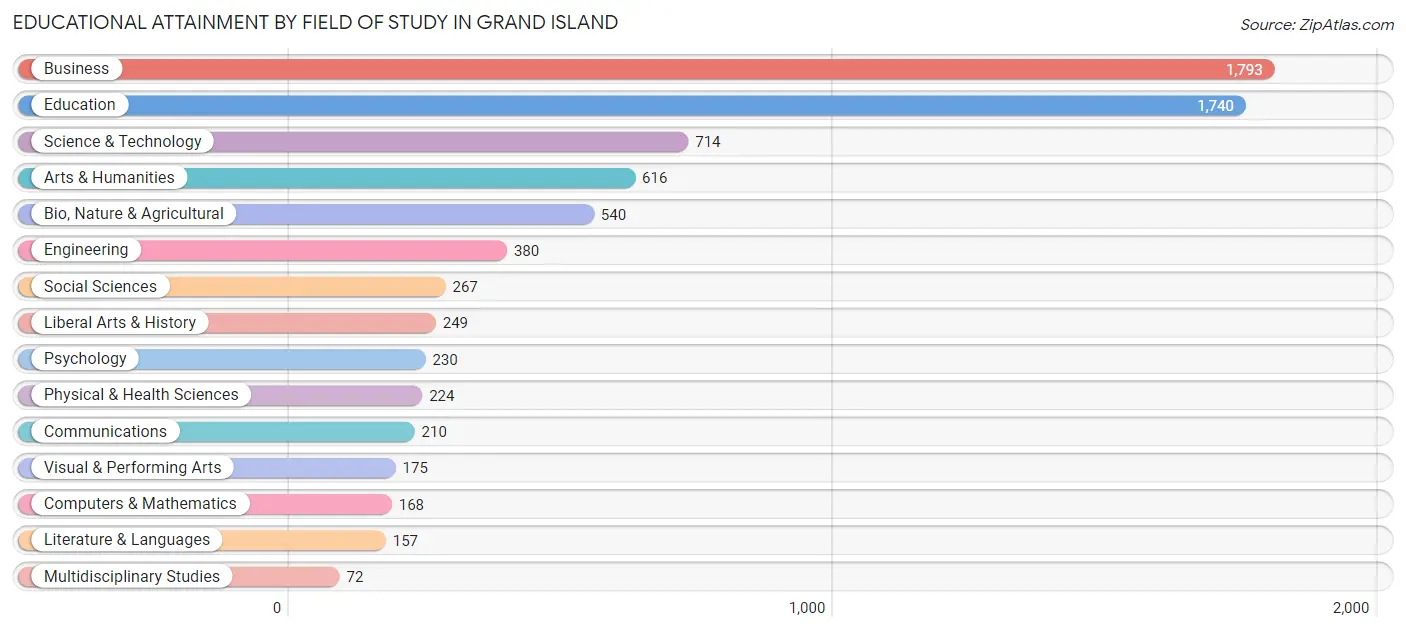
| Field of Study | # Graduates | % Graduates |
| Computers & Mathematics | 168 | 2.2% |
| Bio, Nature & Agricultural | 540 | 7.2% |
| Physical & Health Sciences | 224 | 3.0% |
| Psychology | 230 | 3.0% |
| Social Sciences | 267 | 3.5% |
| Engineering | 380 | 5.0% |
| Multidisciplinary Studies | 72 | 1.0% |
| Science & Technology | 714 | 9.5% |
| Business | 1,793 | 23.8% |
| Education | 1,740 | 23.1% |
| Literature & Languages | 157 | 2.1% |
| Liberal Arts & History | 249 | 3.3% |
| Visual & Performing Arts | 175 | 2.3% |
| Communications | 210 | 2.8% |
| Arts & Humanities | 616 | 8.2% |
| Total | 7,535 | 100.0% |
Transportation & Commute in Grand Island
Vehicle Availability by Sex in Grand Island
The most prevalent vehicle ownership categories in Grand Island are males with 2 vehicles (5,285, accounting for 38.9%) and females with 2 vehicles (4,705, making up 45.1%).
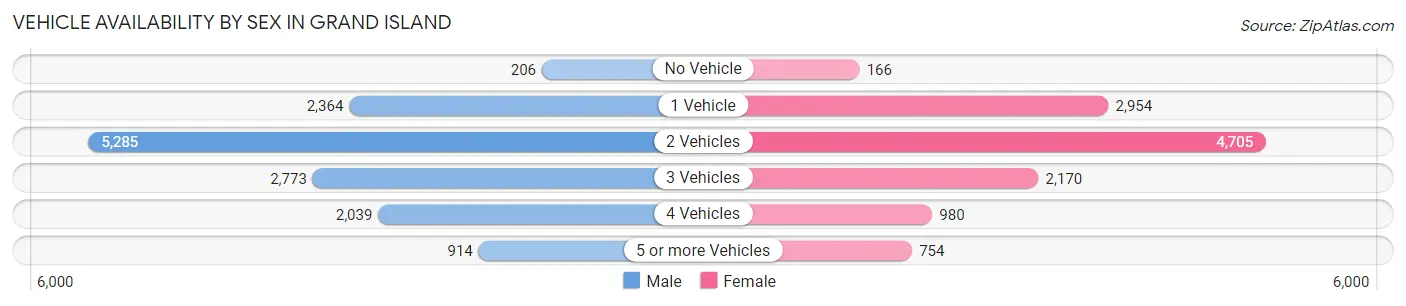
| Vehicles Available | Male | Female |
| No Vehicle | 206 (1.5%) | 166 (1.4%) |
| 1 Vehicle | 2,364 (17.4%) | 2,954 (25.2%) |
| 2 Vehicles | 5,285 (38.9%) | 4,705 (40.1%) |
| 3 Vehicles | 2,773 (20.4%) | 2,170 (18.5%) |
| 4 Vehicles | 2,039 (15.0%) | 980 (8.4%) |
| 5 or more Vehicles | 914 (6.7%) | 754 (6.4%) |
| Total | 13,581 (100.0%) | 11,729 (100.0%) |
Commute Time in Grand Island
The most frequently occuring commute durations in Grand Island are 10 to 14 minutes (6,873 commuters, 27.8%), 5 to 9 minutes (5,977 commuters, 24.2%), and 15 to 19 minutes (4,618 commuters, 18.7%).
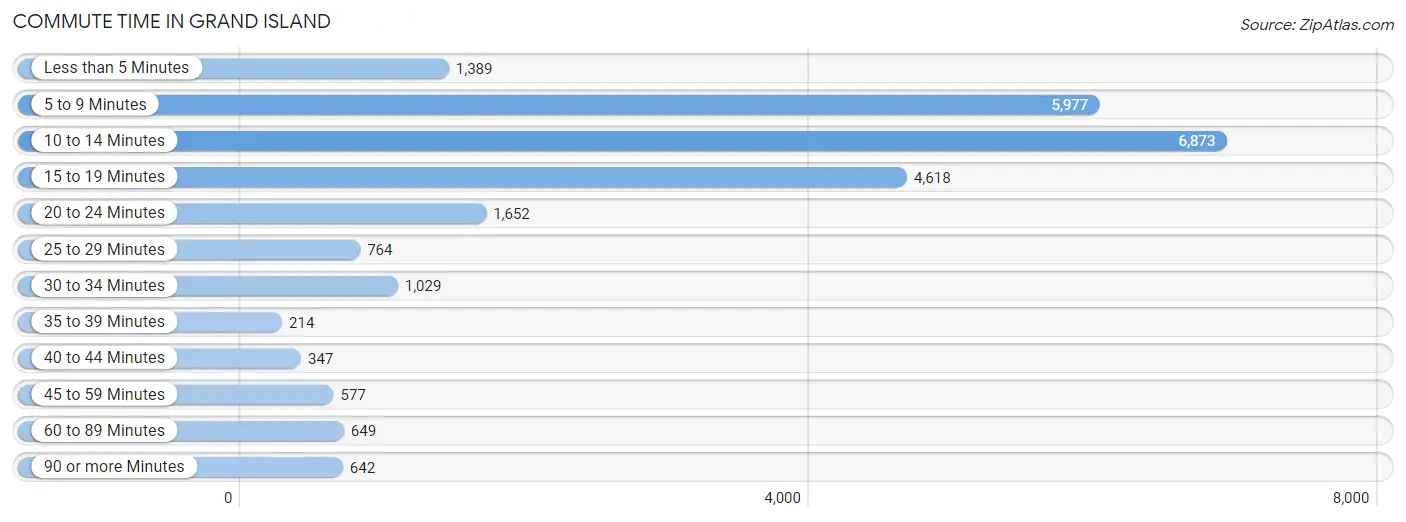
| Commute Time | # Commuters | % Commuters |
| Less than 5 Minutes | 1,389 | 5.6% |
| 5 to 9 Minutes | 5,977 | 24.2% |
| 10 to 14 Minutes | 6,873 | 27.8% |
| 15 to 19 Minutes | 4,618 | 18.7% |
| 20 to 24 Minutes | 1,652 | 6.7% |
| 25 to 29 Minutes | 764 | 3.1% |
| 30 to 34 Minutes | 1,029 | 4.2% |
| 35 to 39 Minutes | 214 | 0.9% |
| 40 to 44 Minutes | 347 | 1.4% |
| 45 to 59 Minutes | 577 | 2.3% |
| 60 to 89 Minutes | 649 | 2.6% |
| 90 or more Minutes | 642 | 2.6% |
Commute Time by Sex in Grand Island
The most common commute times in Grand Island are 10 to 14 minutes (3,452 commuters, 25.8%) for males and 10 to 14 minutes (3,421 commuters, 30.2%) for females.
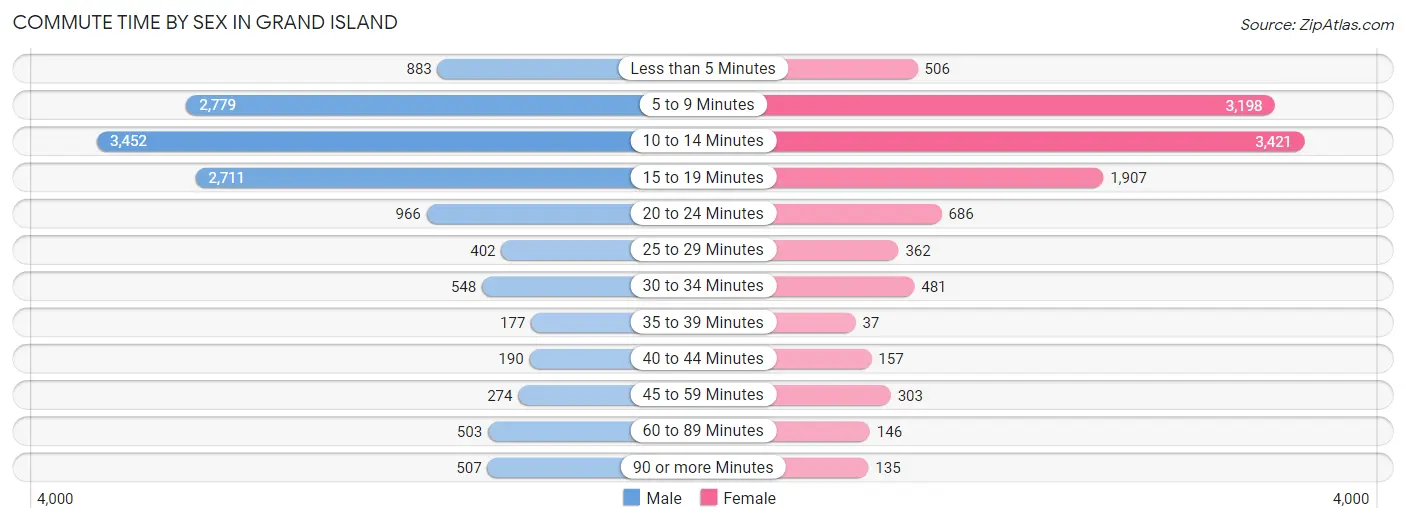
| Commute Time | Male | Female |
| Less than 5 Minutes | 883 (6.6%) | 506 (4.5%) |
| 5 to 9 Minutes | 2,779 (20.7%) | 3,198 (28.2%) |
| 10 to 14 Minutes | 3,452 (25.8%) | 3,421 (30.2%) |
| 15 to 19 Minutes | 2,711 (20.2%) | 1,907 (16.8%) |
| 20 to 24 Minutes | 966 (7.2%) | 686 (6.0%) |
| 25 to 29 Minutes | 402 (3.0%) | 362 (3.2%) |
| 30 to 34 Minutes | 548 (4.1%) | 481 (4.2%) |
| 35 to 39 Minutes | 177 (1.3%) | 37 (0.3%) |
| 40 to 44 Minutes | 190 (1.4%) | 157 (1.4%) |
| 45 to 59 Minutes | 274 (2.1%) | 303 (2.7%) |
| 60 to 89 Minutes | 503 (3.8%) | 146 (1.3%) |
| 90 or more Minutes | 507 (3.8%) | 135 (1.2%) |
Time of Departure to Work by Sex in Grand Island
The most frequent times of departure to work in Grand Island are 4:00 PM to 11:59 PM (1,440, 10.7%) for males and 7:30 AM to 7:59 AM (1,790, 15.8%) for females.
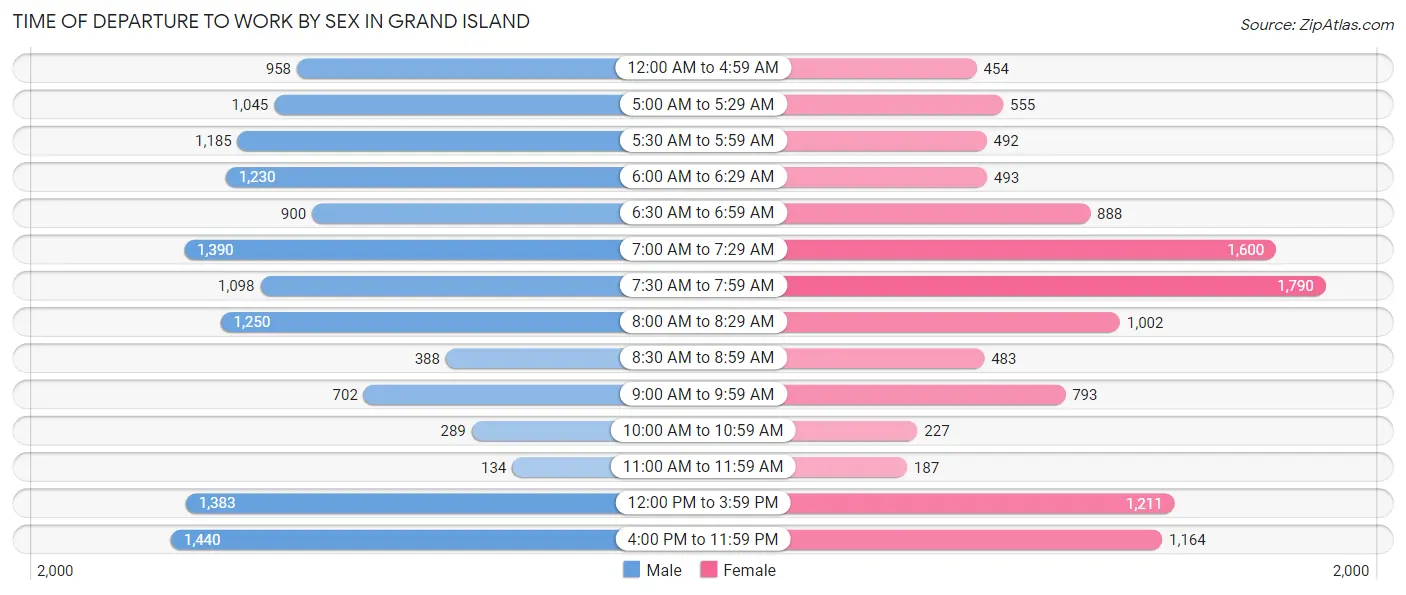
| Time of Departure | Male | Female |
| 12:00 AM to 4:59 AM | 958 (7.1%) | 454 (4.0%) |
| 5:00 AM to 5:29 AM | 1,045 (7.8%) | 555 (4.9%) |
| 5:30 AM to 5:59 AM | 1,185 (8.8%) | 492 (4.3%) |
| 6:00 AM to 6:29 AM | 1,230 (9.2%) | 493 (4.3%) |
| 6:30 AM to 6:59 AM | 900 (6.7%) | 888 (7.8%) |
| 7:00 AM to 7:29 AM | 1,390 (10.4%) | 1,600 (14.1%) |
| 7:30 AM to 7:59 AM | 1,098 (8.2%) | 1,790 (15.8%) |
| 8:00 AM to 8:29 AM | 1,250 (9.3%) | 1,002 (8.8%) |
| 8:30 AM to 8:59 AM | 388 (2.9%) | 483 (4.3%) |
| 9:00 AM to 9:59 AM | 702 (5.2%) | 793 (7.0%) |
| 10:00 AM to 10:59 AM | 289 (2.2%) | 227 (2.0%) |
| 11:00 AM to 11:59 AM | 134 (1.0%) | 187 (1.7%) |
| 12:00 PM to 3:59 PM | 1,383 (10.3%) | 1,211 (10.7%) |
| 4:00 PM to 11:59 PM | 1,440 (10.7%) | 1,164 (10.3%) |
| Total | 13,392 (100.0%) | 11,339 (100.0%) |
Housing Occupancy in Grand Island
Occupancy by Ownership in Grand Island
Of the total 20,263 dwellings in Grand Island, owner-occupied units account for 11,878 (58.6%), while renter-occupied units make up 8,385 (41.4%).
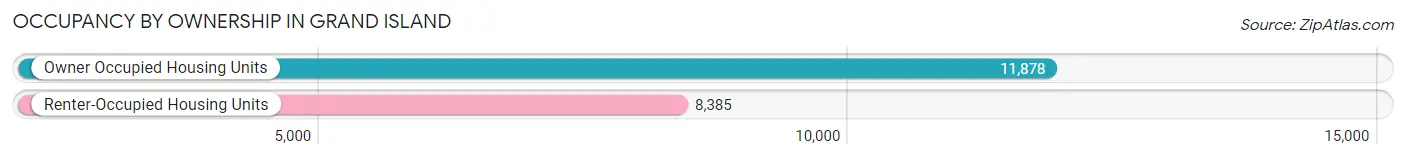
| Occupancy | # Housing Units | % Housing Units |
| Owner Occupied Housing Units | 11,878 | 58.6% |
| Renter-Occupied Housing Units | 8,385 | 41.4% |
| Total Occupied Housing Units | 20,263 | 100.0% |
Occupancy by Household Size in Grand Island
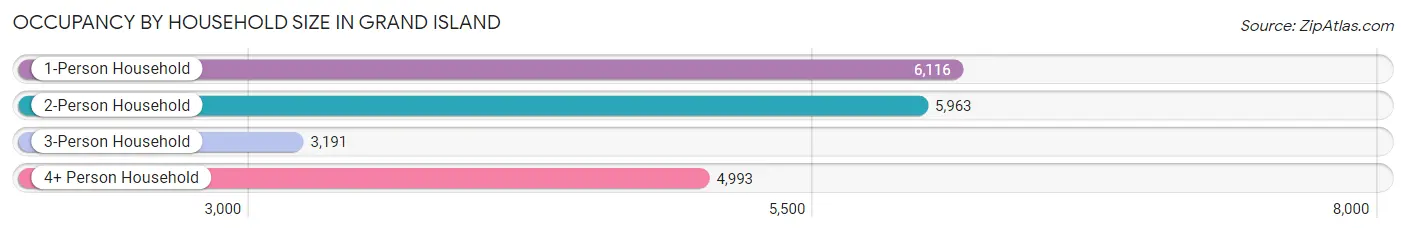
| Household Size | # Housing Units | % Housing Units |
| 1-Person Household | 6,116 | 30.2% |
| 2-Person Household | 5,963 | 29.4% |
| 3-Person Household | 3,191 | 15.8% |
| 4+ Person Household | 4,993 | 24.6% |
| Total Housing Units | 20,263 | 100.0% |
Occupancy by Ownership by Household Size in Grand Island
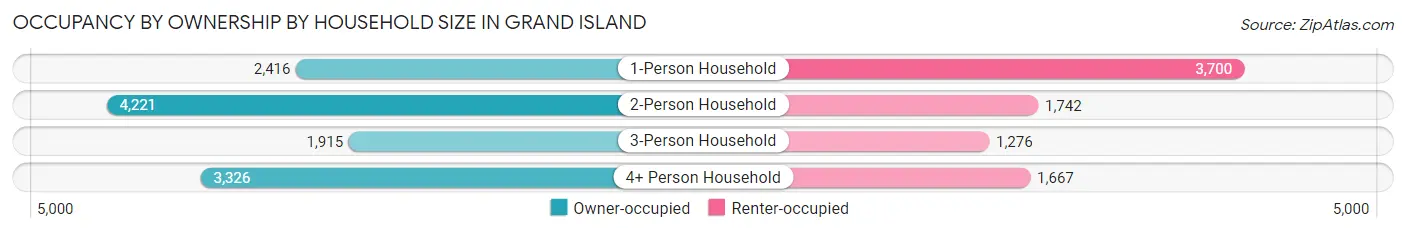
| Household Size | Owner-occupied | Renter-occupied |
| 1-Person Household | 2,416 (39.5%) | 3,700 (60.5%) |
| 2-Person Household | 4,221 (70.8%) | 1,742 (29.2%) |
| 3-Person Household | 1,915 (60.0%) | 1,276 (40.0%) |
| 4+ Person Household | 3,326 (66.6%) | 1,667 (33.4%) |
| Total Housing Units | 11,878 (58.6%) | 8,385 (41.4%) |
Occupancy by Educational Attainment in Grand Island
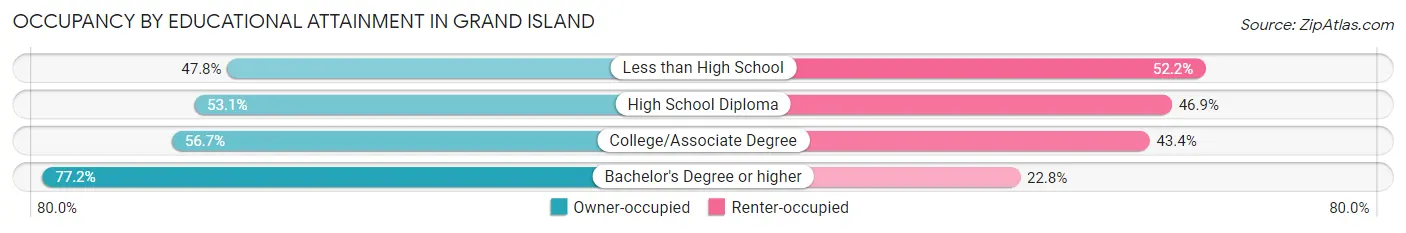
| Household Size | Owner-occupied | Renter-occupied |
| Less than High School | 1,562 (47.8%) | 1,703 (52.2%) |
| High School Diploma | 3,094 (53.1%) | 2,730 (46.9%) |
| College/Associate Degree | 3,870 (56.7%) | 2,961 (43.3%) |
| Bachelor's Degree or higher | 3,352 (77.2%) | 991 (22.8%) |
Occupancy by Age of Householder in Grand Island
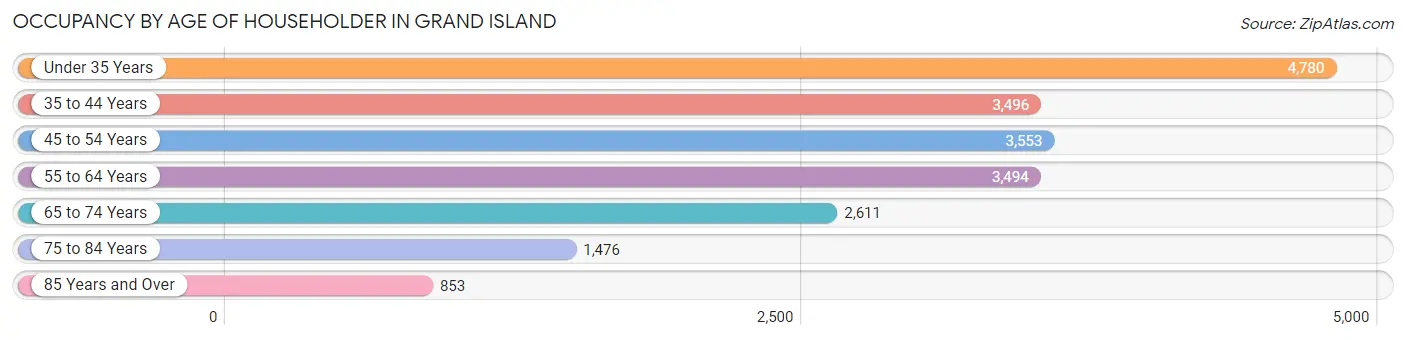
| Age Bracket | # Households | % Households |
| Under 35 Years | 4,780 | 23.6% |
| 35 to 44 Years | 3,496 | 17.2% |
| 45 to 54 Years | 3,553 | 17.5% |
| 55 to 64 Years | 3,494 | 17.2% |
| 65 to 74 Years | 2,611 | 12.9% |
| 75 to 84 Years | 1,476 | 7.3% |
| 85 Years and Over | 853 | 4.2% |
| Total | 20,263 | 100.0% |
Housing Finances in Grand Island
Median Income by Occupancy in Grand Island
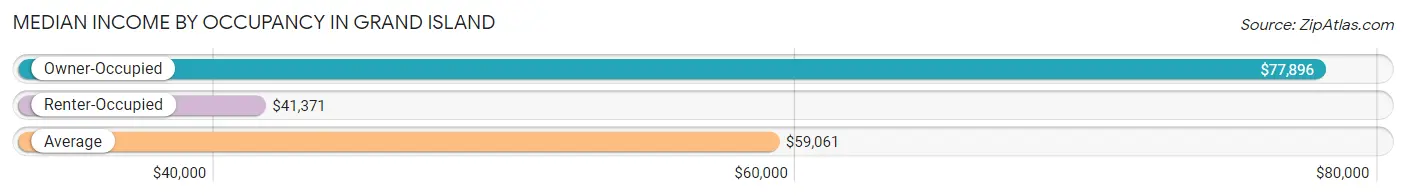
| Occupancy Type | # Households | Median Income |
| Owner-Occupied | 11,878 (58.6%) | $77,896 |
| Renter-Occupied | 8,385 (41.4%) | $41,371 |
| Average | 20,263 (100.0%) | $59,061 |
Occupancy by Householder Income Bracket in Grand Island
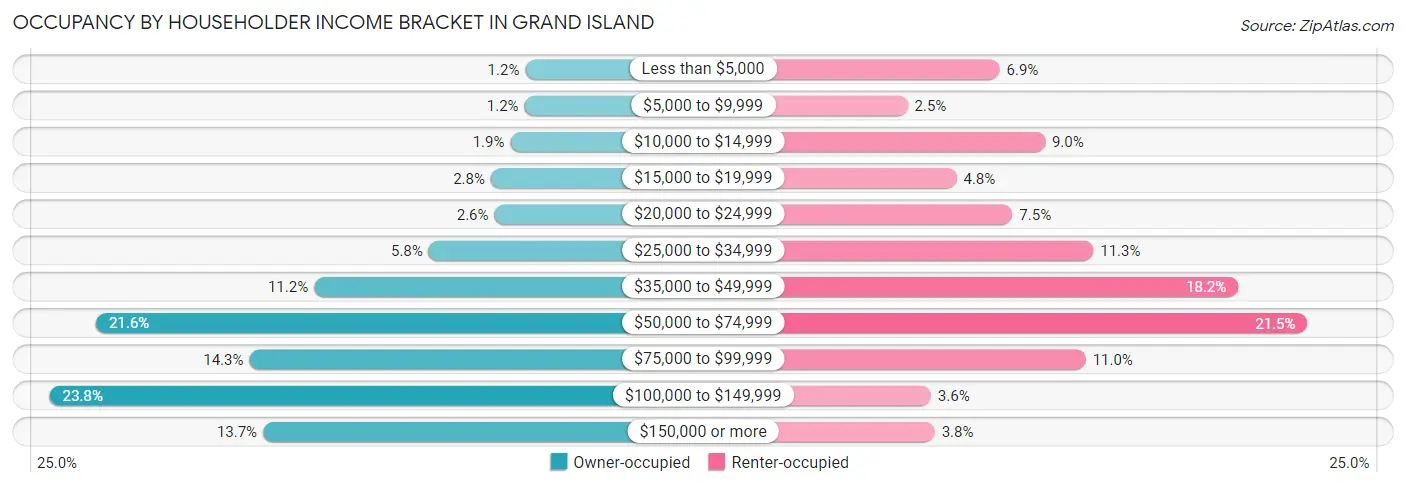
| Income Bracket | Owner-occupied | Renter-occupied |
| Less than $5,000 | 138 (1.2%) | 575 (6.9%) |
| $5,000 to $9,999 | 143 (1.2%) | 208 (2.5%) |
| $10,000 to $14,999 | 222 (1.9%) | 756 (9.0%) |
| $15,000 to $19,999 | 333 (2.8%) | 403 (4.8%) |
| $20,000 to $24,999 | 312 (2.6%) | 626 (7.5%) |
| $25,000 to $34,999 | 684 (5.8%) | 949 (11.3%) |
| $35,000 to $49,999 | 1,333 (11.2%) | 1,528 (18.2%) |
| $50,000 to $74,999 | 2,566 (21.6%) | 1,804 (21.5%) |
| $75,000 to $99,999 | 1,698 (14.3%) | 919 (11.0%) |
| $100,000 to $149,999 | 2,828 (23.8%) | 301 (3.6%) |
| $150,000 or more | 1,621 (13.7%) | 316 (3.8%) |
| Total | 11,878 (100.0%) | 8,385 (100.0%) |
Monthly Housing Cost Tiers in Grand Island
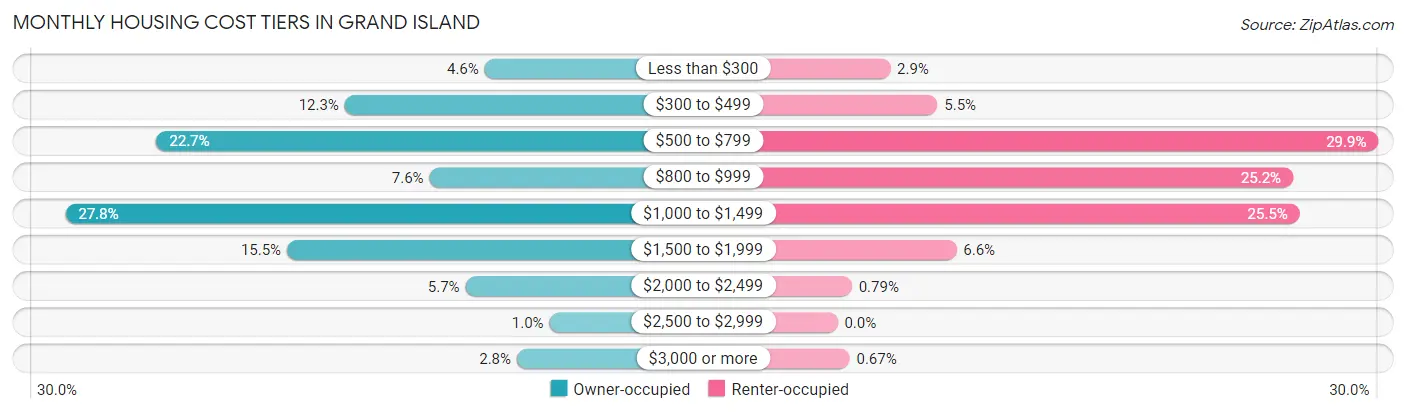
| Monthly Cost | Owner-occupied | Renter-occupied |
| Less than $300 | 545 (4.6%) | 244 (2.9%) |
| $300 to $499 | 1,463 (12.3%) | 463 (5.5%) |
| $500 to $799 | 2,699 (22.7%) | 2,505 (29.9%) |
| $800 to $999 | 908 (7.6%) | 2,110 (25.2%) |
| $1,000 to $1,499 | 3,296 (27.8%) | 2,141 (25.5%) |
| $1,500 to $1,999 | 1,842 (15.5%) | 551 (6.6%) |
| $2,000 to $2,499 | 671 (5.7%) | 66 (0.8%) |
| $2,500 to $2,999 | 120 (1.0%) | 0 (0.0%) |
| $3,000 or more | 334 (2.8%) | 56 (0.7%) |
| Total | 11,878 (100.0%) | 8,385 (100.0%) |
Physical Housing Characteristics in Grand Island
Housing Structures in Grand Island
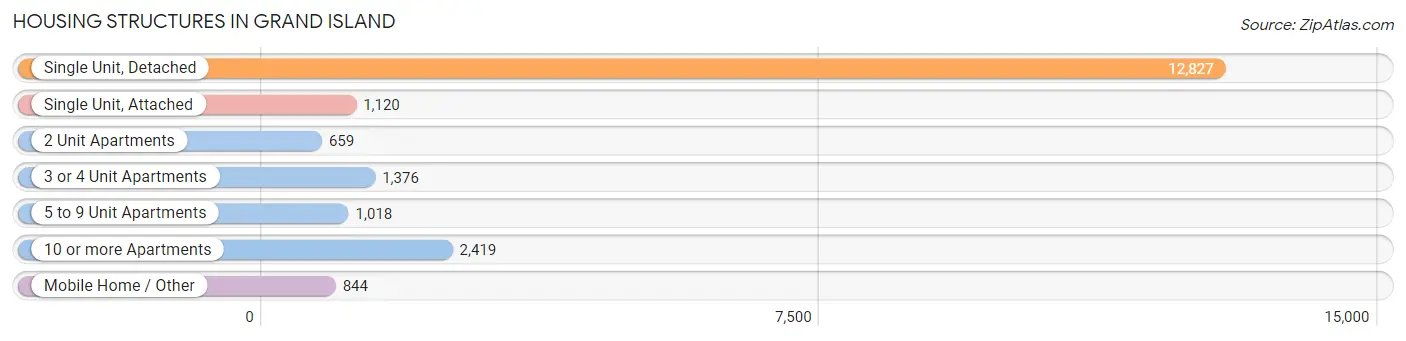
| Structure Type | # Housing Units | % Housing Units |
| Single Unit, Detached | 12,827 | 63.3% |
| Single Unit, Attached | 1,120 | 5.5% |
| 2 Unit Apartments | 659 | 3.3% |
| 3 or 4 Unit Apartments | 1,376 | 6.8% |
| 5 to 9 Unit Apartments | 1,018 | 5.0% |
| 10 or more Apartments | 2,419 | 11.9% |
| Mobile Home / Other | 844 | 4.2% |
| Total | 20,263 | 100.0% |
Housing Structures by Occupancy in Grand Island
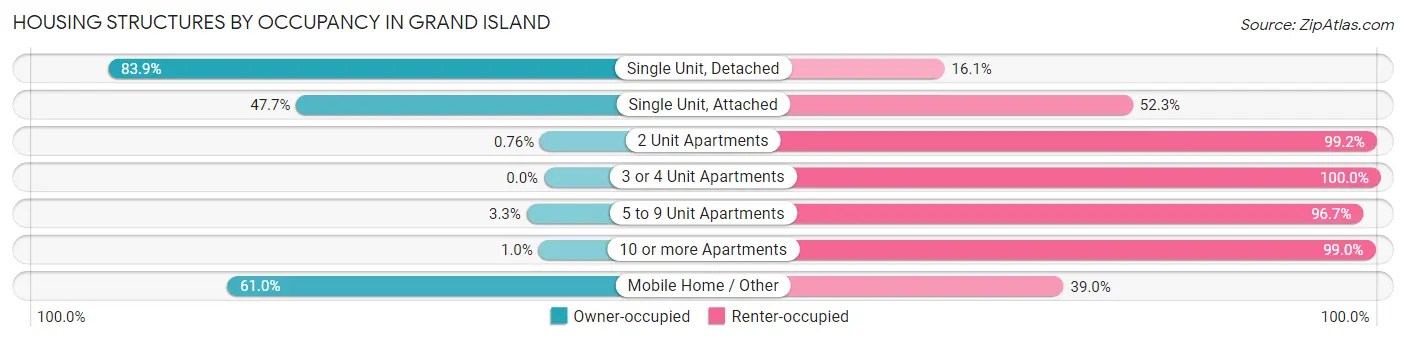
| Structure Type | Owner-occupied | Renter-occupied |
| Single Unit, Detached | 10,765 (83.9%) | 2,062 (16.1%) |
| Single Unit, Attached | 534 (47.7%) | 586 (52.3%) |
| 2 Unit Apartments | 5 (0.8%) | 654 (99.2%) |
| 3 or 4 Unit Apartments | 0 (0.0%) | 1,376 (100.0%) |
| 5 to 9 Unit Apartments | 34 (3.3%) | 984 (96.7%) |
| 10 or more Apartments | 25 (1.0%) | 2,394 (99.0%) |
| Mobile Home / Other | 515 (61.0%) | 329 (39.0%) |
| Total | 11,878 (58.6%) | 8,385 (41.4%) |
Housing Structures by Number of Rooms in Grand Island
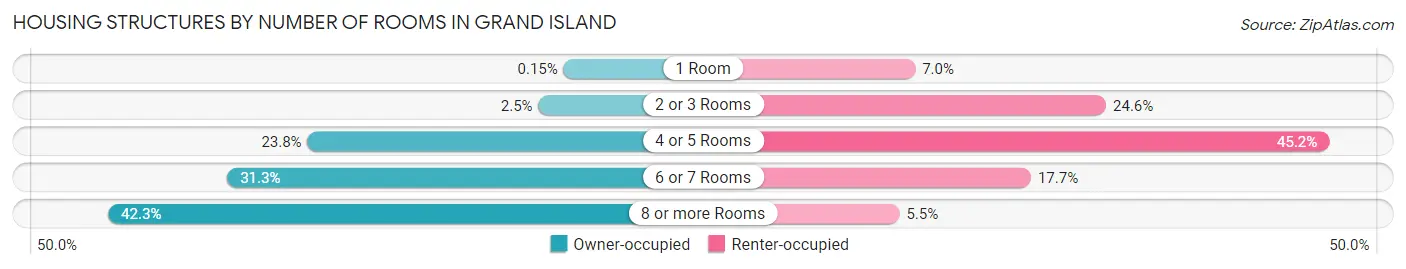
| Number of Rooms | Owner-occupied | Renter-occupied |
| 1 Room | 18 (0.2%) | 584 (7.0%) |
| 2 or 3 Rooms | 294 (2.5%) | 2,064 (24.6%) |
| 4 or 5 Rooms | 2,832 (23.8%) | 3,793 (45.2%) |
| 6 or 7 Rooms | 3,713 (31.3%) | 1,482 (17.7%) |
| 8 or more Rooms | 5,021 (42.3%) | 462 (5.5%) |
| Total | 11,878 (100.0%) | 8,385 (100.0%) |
Housing Structure by Heating Type in Grand Island
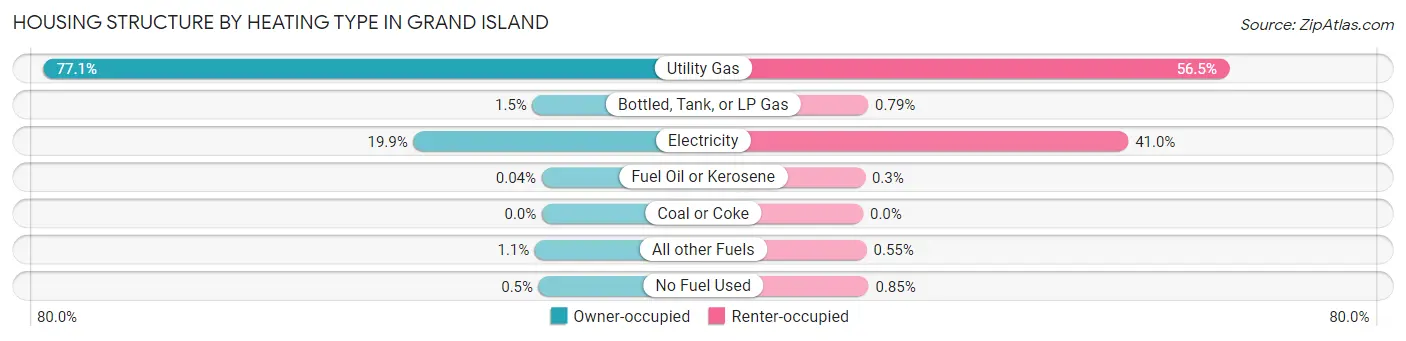
| Heating Type | Owner-occupied | Renter-occupied |
| Utility Gas | 9,152 (77.0%) | 4,740 (56.5%) |
| Bottled, Tank, or LP Gas | 174 (1.5%) | 66 (0.8%) |
| Electricity | 2,360 (19.9%) | 3,437 (41.0%) |
| Fuel Oil or Kerosene | 5 (0.0%) | 25 (0.3%) |
| Coal or Coke | 0 (0.0%) | 0 (0.0%) |
| All other Fuels | 128 (1.1%) | 46 (0.5%) |
| No Fuel Used | 59 (0.5%) | 71 (0.9%) |
| Total | 11,878 (100.0%) | 8,385 (100.0%) |
Household Vehicle Usage in Grand Island
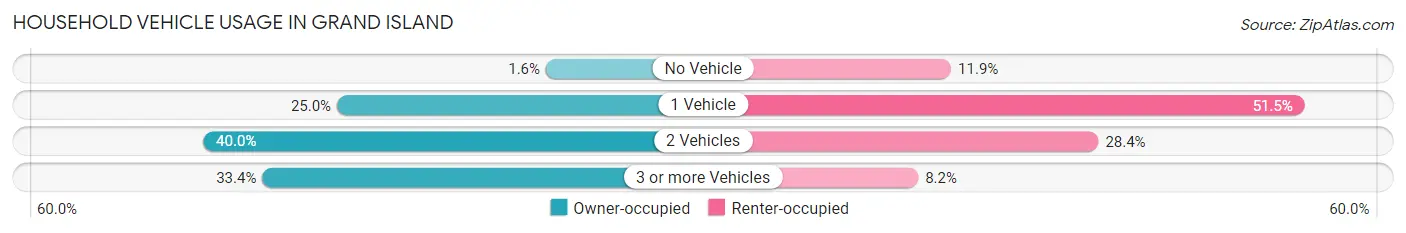
| Vehicles per Household | Owner-occupied | Renter-occupied |
| No Vehicle | 191 (1.6%) | 998 (11.9%) |
| 1 Vehicle | 2,971 (25.0%) | 4,318 (51.5%) |
| 2 Vehicles | 4,751 (40.0%) | 2,381 (28.4%) |
| 3 or more Vehicles | 3,965 (33.4%) | 688 (8.2%) |
| Total | 11,878 (100.0%) | 8,385 (100.0%) |
Real Estate & Mortgages in Grand Island
Real Estate and Mortgage Overview in Grand Island
| Characteristic | Without Mortgage | With Mortgage |
| Housing Units | 5,434 | 6,444 |
| Median Property Value | $170,100 | $193,000 |
| Median Household Income | $60,000 | $1,104 |
| Monthly Housing Costs | $565 | $320 |
| Real Estate Taxes | $2,550 | $119 |
Property Value by Mortgage Status in Grand Island
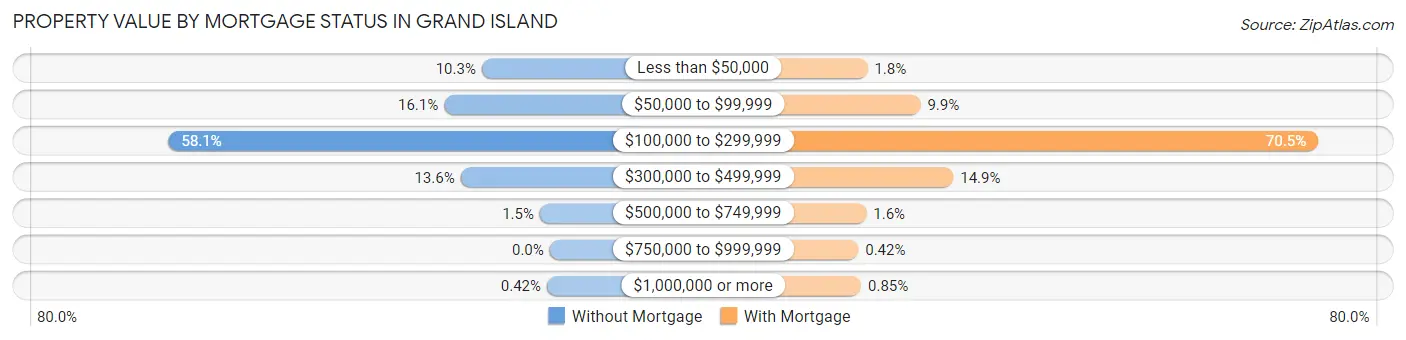
| Property Value | Without Mortgage | With Mortgage |
| Less than $50,000 | 562 (10.3%) | 117 (1.8%) |
| $50,000 to $99,999 | 874 (16.1%) | 637 (9.9%) |
| $100,000 to $299,999 | 3,156 (58.1%) | 4,542 (70.5%) |
| $300,000 to $499,999 | 738 (13.6%) | 960 (14.9%) |
| $500,000 to $749,999 | 81 (1.5%) | 106 (1.6%) |
| $750,000 to $999,999 | 0 (0.0%) | 27 (0.4%) |
| $1,000,000 or more | 23 (0.4%) | 55 (0.9%) |
| Total | 5,434 (100.0%) | 6,444 (100.0%) |
Household Income by Mortgage Status in Grand Island
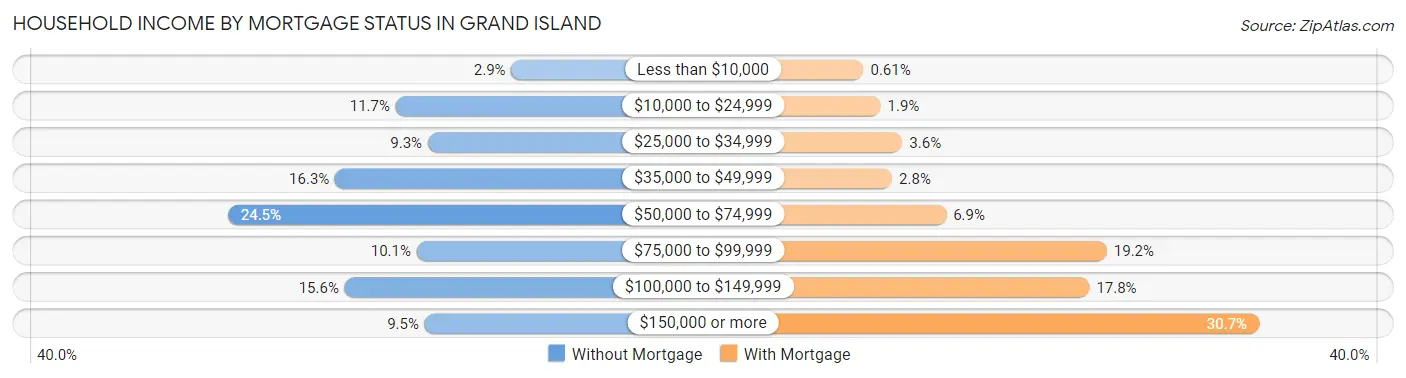
| Household Income | Without Mortgage | With Mortgage |
| Less than $10,000 | 158 (2.9%) | 39 (0.6%) |
| $10,000 to $24,999 | 637 (11.7%) | 123 (1.9%) |
| $25,000 to $34,999 | 504 (9.3%) | 230 (3.6%) |
| $35,000 to $49,999 | 888 (16.3%) | 180 (2.8%) |
| $50,000 to $74,999 | 1,332 (24.5%) | 445 (6.9%) |
| $75,000 to $99,999 | 550 (10.1%) | 1,234 (19.2%) |
| $100,000 to $149,999 | 848 (15.6%) | 1,148 (17.8%) |
| $150,000 or more | 517 (9.5%) | 1,980 (30.7%) |
| Total | 5,434 (100.0%) | 6,444 (100.0%) |
Property Value to Household Income Ratio in Grand Island
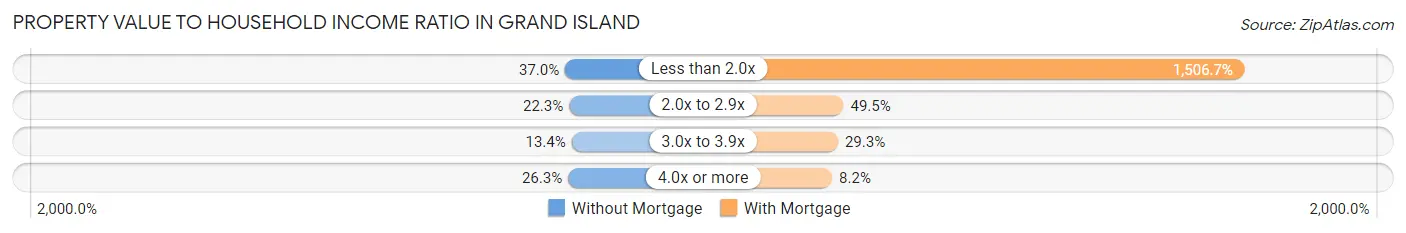
| Value-to-Income Ratio | Without Mortgage | With Mortgage |
| Less than 2.0x | 2,010 (37.0%) | 97,093 (1,506.7%) |
| 2.0x to 2.9x | 1,212 (22.3%) | 3,191 (49.5%) |
| 3.0x to 3.9x | 728 (13.4%) | 1,888 (29.3%) |
| 4.0x or more | 1,428 (26.3%) | 528 (8.2%) |
| Total | 5,434 (100.0%) | 6,444 (100.0%) |
Real Estate Taxes by Mortgage Status in Grand Island
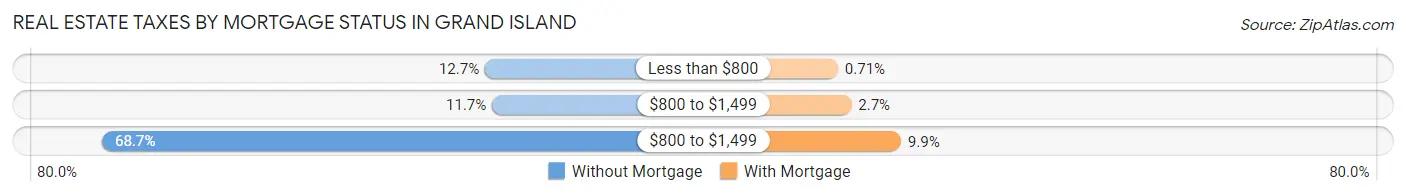
| Property Taxes | Without Mortgage | With Mortgage |
| Less than $800 | 692 (12.7%) | 46 (0.7%) |
| $800 to $1,499 | 635 (11.7%) | 172 (2.7%) |
| $800 to $1,499 | 3,732 (68.7%) | 639 (9.9%) |
| Total | 5,434 (100.0%) | 6,444 (100.0%) |
Health & Disability in Grand Island
Health Insurance Coverage by Age in Grand Island
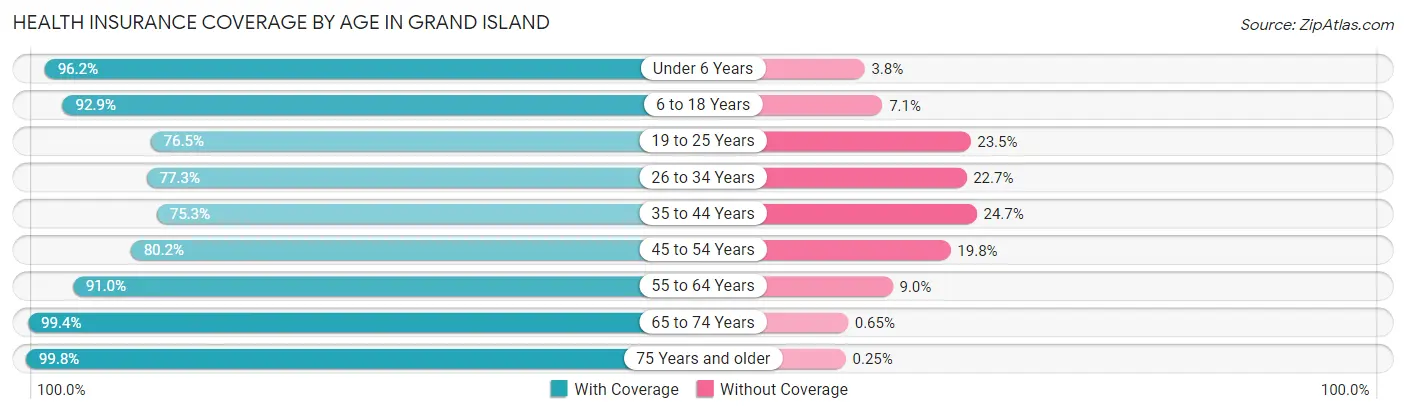
| Age Bracket | With Coverage | Without Coverage |
| Under 6 Years | 4,705 (96.2%) | 184 (3.8%) |
| 6 to 18 Years | 9,864 (92.9%) | 752 (7.1%) |
| 19 to 25 Years | 3,529 (76.5%) | 1,084 (23.5%) |
| 26 to 34 Years | 4,779 (77.3%) | 1,407 (22.7%) |
| 35 to 44 Years | 5,074 (75.3%) | 1,661 (24.7%) |
| 45 to 54 Years | 4,754 (80.2%) | 1,173 (19.8%) |
| 55 to 64 Years | 5,115 (91.0%) | 505 (9.0%) |
| 65 to 74 Years | 4,429 (99.4%) | 29 (0.6%) |
| 75 Years and older | 3,154 (99.8%) | 8 (0.3%) |
| Total | 45,403 (87.0%) | 6,803 (13.0%) |
Health Insurance Coverage by Citizenship Status in Grand Island
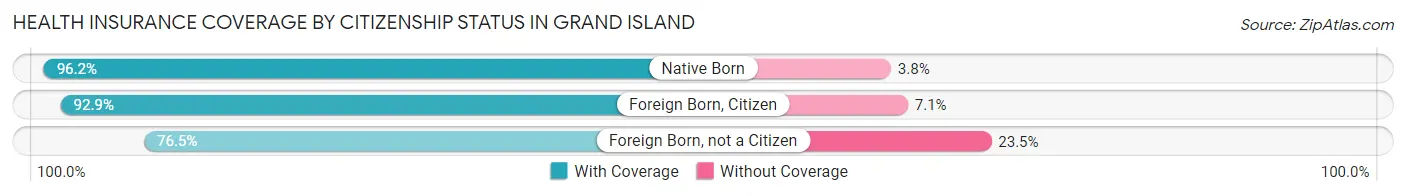
| Citizenship Status | With Coverage | Without Coverage |
| Native Born | 4,705 (96.2%) | 184 (3.8%) |
| Foreign Born, Citizen | 9,864 (92.9%) | 752 (7.1%) |
| Foreign Born, not a Citizen | 3,529 (76.5%) | 1,084 (23.5%) |
Health Insurance Coverage by Household Income in Grand Island
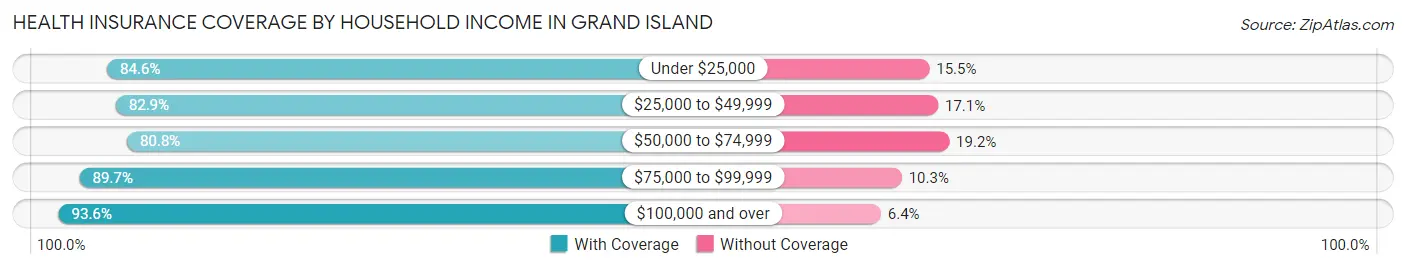
| Household Income | With Coverage | Without Coverage |
| Under $25,000 | 5,072 (84.6%) | 927 (15.4%) |
| $25,000 to $49,999 | 7,797 (82.9%) | 1,608 (17.1%) |
| $50,000 to $74,999 | 9,529 (80.8%) | 2,261 (19.2%) |
| $75,000 to $99,999 | 7,147 (89.7%) | 820 (10.3%) |
| $100,000 and over | 15,711 (93.6%) | 1,071 (6.4%) |
Public vs Private Health Insurance Coverage by Age in Grand Island
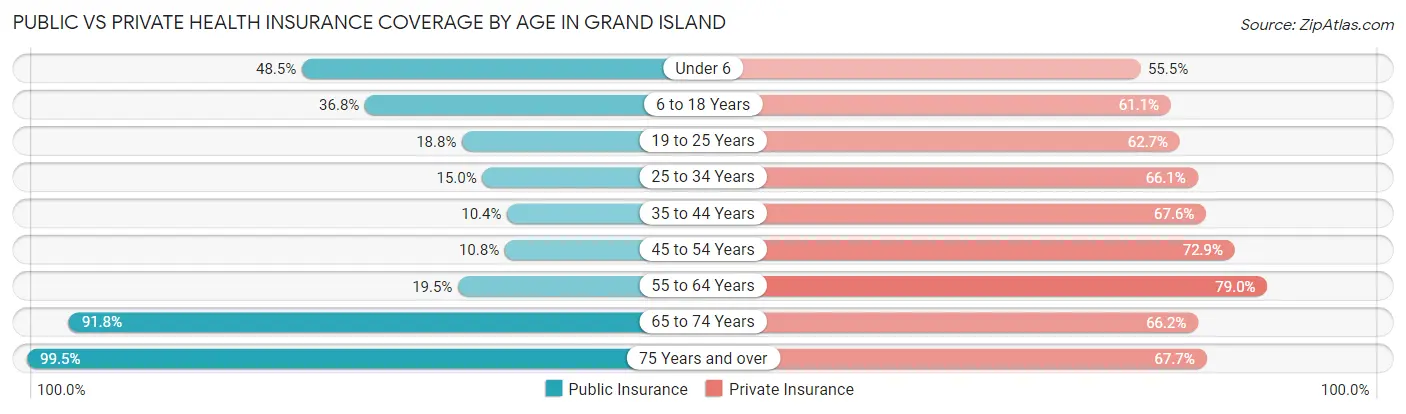
| Age Bracket | Public Insurance | Private Insurance |
| Under 6 | 2,371 (48.5%) | 2,715 (55.5%) |
| 6 to 18 Years | 3,906 (36.8%) | 6,484 (61.1%) |
| 19 to 25 Years | 866 (18.8%) | 2,894 (62.7%) |
| 25 to 34 Years | 928 (15.0%) | 4,086 (66.0%) |
| 35 to 44 Years | 701 (10.4%) | 4,554 (67.6%) |
| 45 to 54 Years | 642 (10.8%) | 4,323 (72.9%) |
| 55 to 64 Years | 1,097 (19.5%) | 4,439 (79.0%) |
| 65 to 74 Years | 4,092 (91.8%) | 2,949 (66.1%) |
| 75 Years and over | 3,147 (99.5%) | 2,141 (67.7%) |
| Total | 17,750 (34.0%) | 34,585 (66.2%) |
Disability Status by Sex by Age in Grand Island
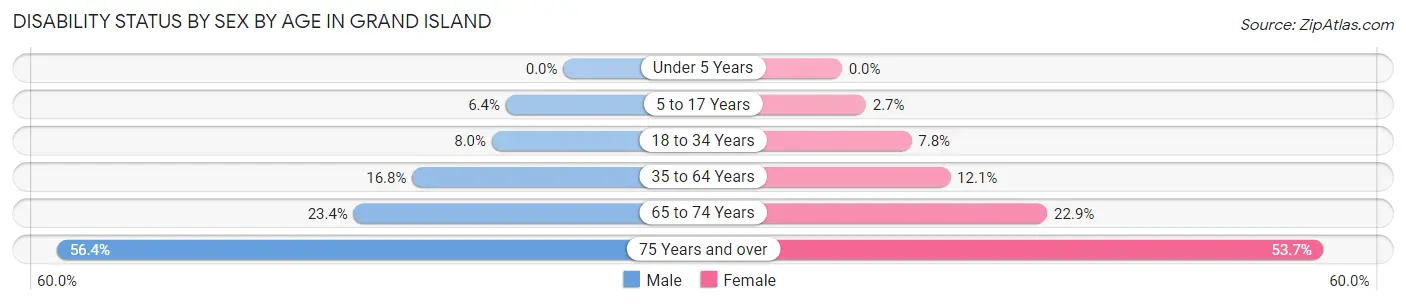
| Age Bracket | Male | Female |
| Under 5 Years | 0 (0.0%) | 0 (0.0%) |
| 5 to 17 Years | 360 (6.4%) | 137 (2.7%) |
| 18 to 34 Years | 465 (8.0%) | 435 (7.7%) |
| 35 to 64 Years | 1,591 (16.8%) | 1,065 (12.1%) |
| 65 to 74 Years | 500 (23.4%) | 530 (22.9%) |
| 75 Years and over | 804 (56.4%) | 932 (53.7%) |
Disability Class by Sex by Age in Grand Island
Disability Class: Hearing Difficulty
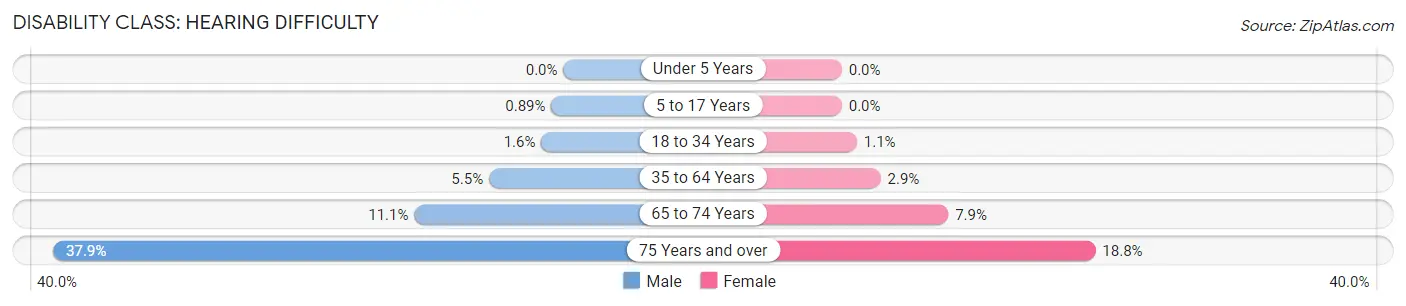
| Age Bracket | Male | Female |
| Under 5 Years | 0 (0.0%) | 0 (0.0%) |
| 5 to 17 Years | 50 (0.9%) | 0 (0.0%) |
| 18 to 34 Years | 96 (1.6%) | 63 (1.1%) |
| 35 to 64 Years | 522 (5.5%) | 254 (2.9%) |
| 65 to 74 Years | 237 (11.1%) | 183 (7.9%) |
| 75 Years and over | 540 (37.9%) | 327 (18.8%) |
Disability Class: Vision Difficulty
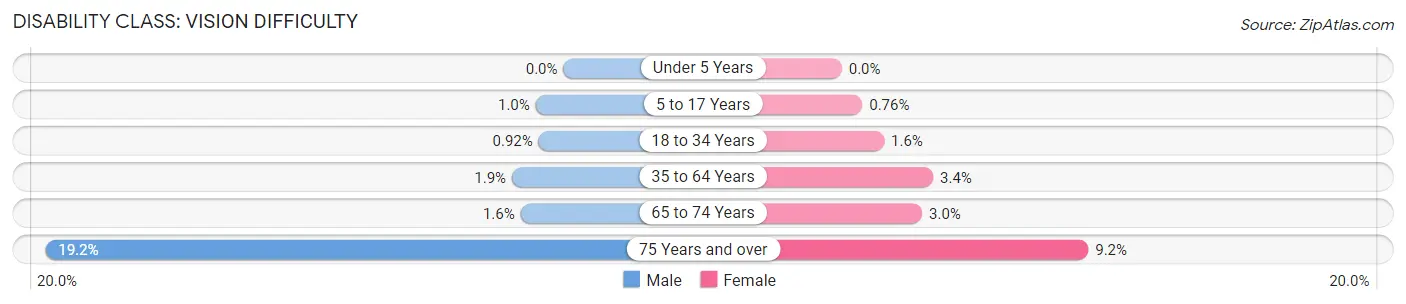
| Age Bracket | Male | Female |
| Under 5 Years | 0 (0.0%) | 0 (0.0%) |
| 5 to 17 Years | 58 (1.0%) | 39 (0.8%) |
| 18 to 34 Years | 54 (0.9%) | 88 (1.6%) |
| 35 to 64 Years | 181 (1.9%) | 299 (3.4%) |
| 65 to 74 Years | 34 (1.6%) | 69 (3.0%) |
| 75 Years and over | 274 (19.2%) | 159 (9.1%) |
Disability Class: Cognitive Difficulty
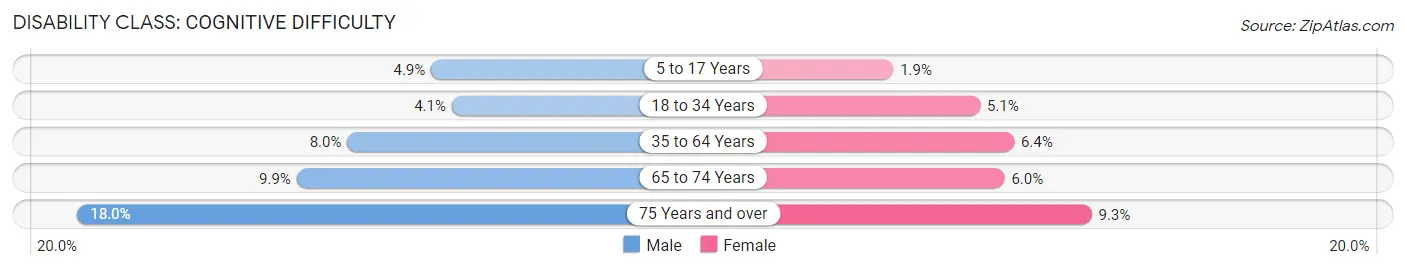
| Age Bracket | Male | Female |
| 5 to 17 Years | 276 (4.9%) | 98 (1.9%) |
| 18 to 34 Years | 242 (4.1%) | 288 (5.1%) |
| 35 to 64 Years | 759 (8.0%) | 564 (6.4%) |
| 65 to 74 Years | 212 (9.9%) | 140 (6.0%) |
| 75 Years and over | 257 (18.0%) | 161 (9.3%) |
Disability Class: Ambulatory Difficulty
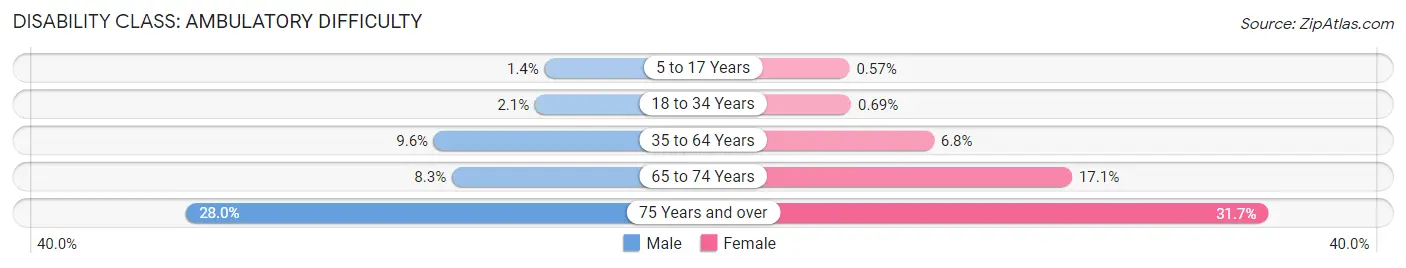
| Age Bracket | Male | Female |
| 5 to 17 Years | 78 (1.4%) | 29 (0.6%) |
| 18 to 34 Years | 123 (2.1%) | 39 (0.7%) |
| 35 to 64 Years | 909 (9.6%) | 603 (6.8%) |
| 65 to 74 Years | 177 (8.3%) | 396 (17.1%) |
| 75 Years and over | 399 (28.0%) | 550 (31.7%) |
Disability Class: Self-Care Difficulty
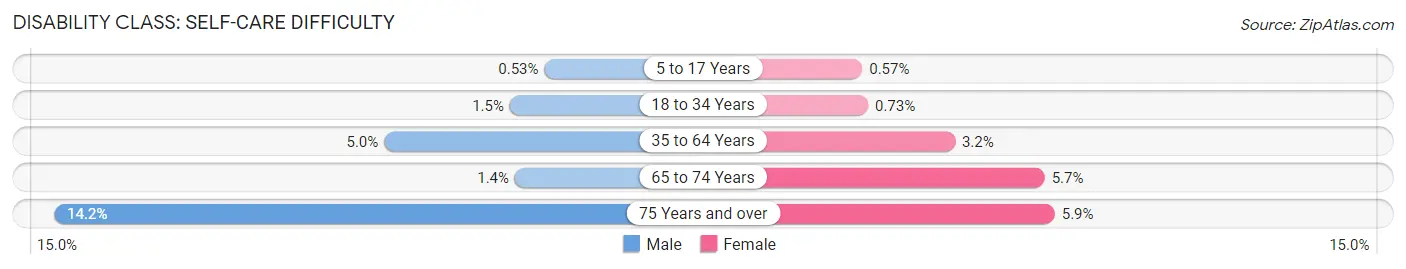
| Age Bracket | Male | Female |
| 5 to 17 Years | 30 (0.5%) | 29 (0.6%) |
| 18 to 34 Years | 87 (1.5%) | 41 (0.7%) |
| 35 to 64 Years | 472 (5.0%) | 278 (3.2%) |
| 65 to 74 Years | 29 (1.3%) | 131 (5.7%) |
| 75 Years and over | 202 (14.2%) | 103 (5.9%) |
Technology Access in Grand Island
Computing Device Access in Grand Island
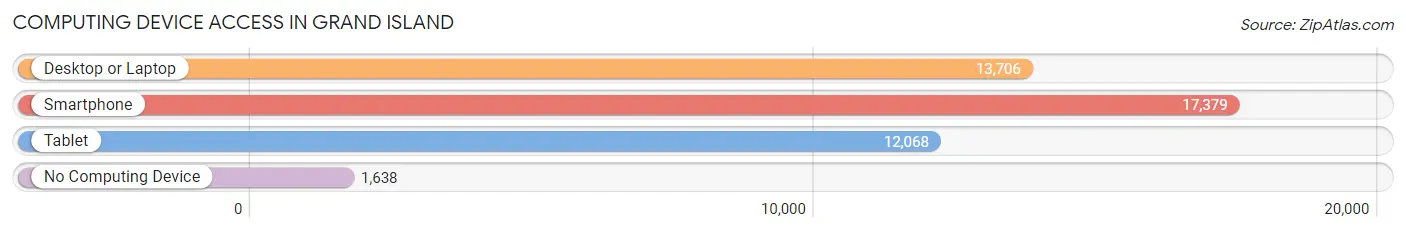
| Device Type | # Households | % Households |
| Desktop or Laptop | 13,706 | 67.6% |
| Smartphone | 17,379 | 85.8% |
| Tablet | 12,068 | 59.6% |
| No Computing Device | 1,638 | 8.1% |
| Total | 20,263 | 100.0% |
Internet Access in Grand Island
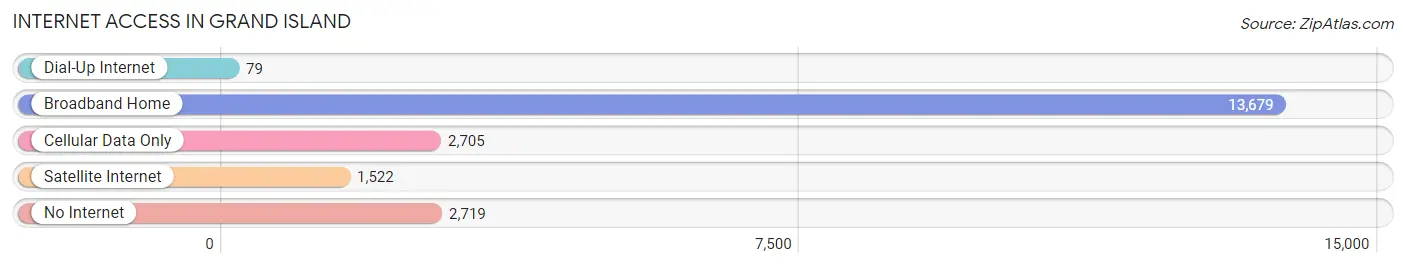
| Internet Type | # Households | % Households |
| Dial-Up Internet | 79 | 0.4% |
| Broadband Home | 13,679 | 67.5% |
| Cellular Data Only | 2,705 | 13.4% |
| Satellite Internet | 1,522 | 7.5% |
| No Internet | 2,719 | 13.4% |
| Total | 20,263 | 100.0% |
Grand Island Summary
Geography
Located in central Nebraska, Grand Island is the county seat of Hall County. It is situated along the Platte River, approximately halfway between Omaha and Denver. Grand Island is the principal city of the Grand Island metropolitan area, which consists of Hall, Merrick, and Howard counties. The city is located in the center of the state, approximately 90 miles west of Lincoln and 120 miles east of North Platte.
Grand Island is located in the Central Plains region of the United States. The city is situated on the edge of the Sandhills, a region of rolling hills and grasslands. The city is also located in the Central Flyway, a major migratory bird route. The Platte River runs through the city, providing a source of recreation and irrigation.
History
Grand Island was first settled in 1857 by a group of German immigrants. The city was named after the nearby Grand Island, which was an important landmark for travelers on the Oregon Trail. The city was incorporated in 1872 and quickly became a major hub for the Union Pacific Railroad.
In the late 19th century, Grand Island was a major stop on the Union Pacific Railroad. The city was also a major agricultural center, with a large number of farms and ranches in the area.
In the early 20th century, Grand Island was a major center for the sugar beet industry. The city was also a major stop on the Lincoln Highway, the first transcontinental highway in the United States.
Economy
Grand Island is a major center for agriculture, manufacturing, and transportation. The city is home to several major employers, including Cargill, ConAgra, and Tyson Foods. The city is also home to several major manufacturing companies, including Grand Island Manufacturing, Grand Island Plastics, and Grand Island Steel.
The city is also a major transportation hub, with several major highways and railroads running through the city. The city is served by the Grand Island Airport, which offers daily flights to Omaha, Denver, and other major cities.
Demographics
As of the 2010 census, the population of Grand Island was 48,520. The city has a population density of 1,845 people per square mile. The median age of the population is 35.7 years.
The racial makeup of the city is 87.3% White, 5.2% African American, 0.7% Native American, 1.7% Asian, 0.1% Pacific Islander, 2.7% from other races, and 2.4% from two or more races. The Hispanic or Latino population of the city is 8.3%.
The median household income in Grand Island is $45,945. The per capita income is $22,845. The city has a poverty rate of 11.3%.
Conclusion
Grand Island is a major city in central Nebraska. The city is located along the Platte River and is a major hub for agriculture, manufacturing, and transportation. The city has a population of 48,520 and a median household income of $45,945. Grand Island is a diverse city, with a population that is 87.3% White, 5.2% African American, 0.7% Native American, 1.7% Asian, 0.1% Pacific Islander, 2.7% from other races, and 2.4% from two or more races. The city is a major center for agriculture, manufacturing, and transportation, and is served by the Grand Island Airport.
Common Questions
What is Per Capita Income in Grand Island?
Per Capita income in Grand Island is $31,500.
What is the Median Family Income in Grand Island?
Median Family Income in Grand Island is $73,340.
What is the Median Household income in Grand Island?
Median Household Income in Grand Island is $59,061.
What is Income or Wage Gap in Grand Island?
Income or Wage Gap in Grand Island is 27.0%.
Women in Grand Island earn 73.0 cents for every dollar earned by a man.
What is Family Income Deficit in Grand Island?
Family Income Deficit in Grand Island is $11,461.
Families that are below poverty line in Grand Island earn $11,461 less on average than the poverty threshold level.
What is Inequality or Gini Index in Grand Island?
Inequality or Gini Index in Grand Island is 0.45.
What is the Total Population of Grand Island?
Total Population of Grand Island is 52,822.
What is the Total Male Population of Grand Island?
Total Male Population of Grand Island is 27,062.
What is the Total Female Population of Grand Island?
Total Female Population of Grand Island is 25,760.
What is the Ratio of Males per 100 Females in Grand Island?
There are 105.05 Males per 100 Females in Grand Island.
What is the Ratio of Females per 100 Males in Grand Island?
There are 95.19 Females per 100 Males in Grand Island.
What is the Median Population Age in Grand Island?
Median Population Age in Grand Island is 35.0 Years.
What is the Average Family Size in Grand Island
Average Family Size in Grand Island is 3.2 People.
What is the Average Household Size in Grand Island
Average Household Size in Grand Island is 2.6 People.
How Large is the Labor Force in Grand Island?
There are 26,793 People in the Labor Forcein in Grand Island.
What is the Percentage of People in the Labor Force in Grand Island?
67.8% of People are in the Labor Force in Grand Island.
What is the Unemployment Rate in Grand Island?
Unemployment Rate in Grand Island is 3.1%.