Rochester, MN Map & Demographics
Rochester Map
Rochester Overview
$47,516
PER CAPITA INCOME
$108,759
AVG FAMILY INCOME
$83,973
AVG HOUSEHOLD INCOME
12.7%
WAGE / INCOME GAP [ % ]
87.3¢/ $1
WAGE / INCOME GAP [ $ ]
$8,885
FAMILY INCOME DEFICIT
0.45
INEQUALITY / GINI INDEX
120,848
TOTAL POPULATION
59,270
MALE POPULATION
61,578
FEMALE POPULATION
96.25
MALES / 100 FEMALES
103.89
FEMALES / 100 MALES
36.3
MEDIAN AGE
3.0
AVG FAMILY SIZE
2.4
AVG HOUSEHOLD SIZE
67,636
LABOR FORCE [ PEOPLE ]
70.9%
PERCENT IN LABOR FORCE
3.7%
UNEMPLOYMENT RATE
Rochester Area Codes
Income in Rochester
Income Overview in Rochester
Per Capita Income in Rochester is $47,516, while median incomes of families and households are $108,759 and $83,973 respectively.
| Characteristic | Number | Measure |
| Per Capita Income | 120,848 | $47,516 |
| Median Family Income | 29,542 | $108,759 |
| Mean Family Income | 29,542 | $139,210 |
| Median Household Income | 50,236 | $83,973 |
| Mean Household Income | 50,236 | $113,641 |
| Income Deficit | 29,542 | $8,885 |
| Wage / Income Gap (%) | 120,848 | 12.70% |
| Wage / Income Gap ($) | 120,848 | 87.30¢ per $1 |
| Gini / Inequality Index | 120,848 | 0.45 |
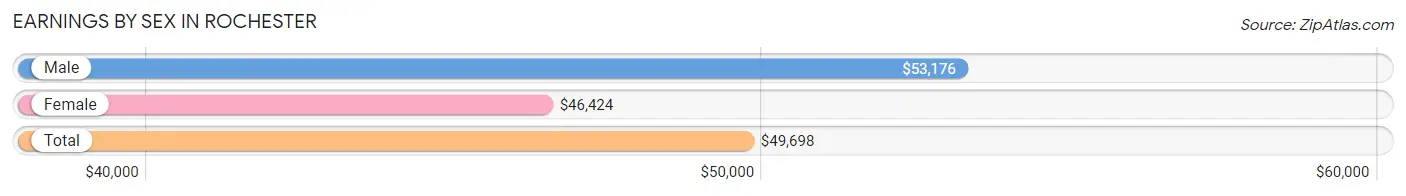
Earnings by Sex in Rochester
Average Earnings in Rochester are $49,698, $53,176 for men and $46,424 for women, a difference of 12.7%.
| Sex | Number | Average Earnings |
| Male | 35,840 (51.1%) | $53,176 |
| Female | 34,346 (48.9%) | $46,424 |
| Total | 70,186 (100.0%) | $49,698 |
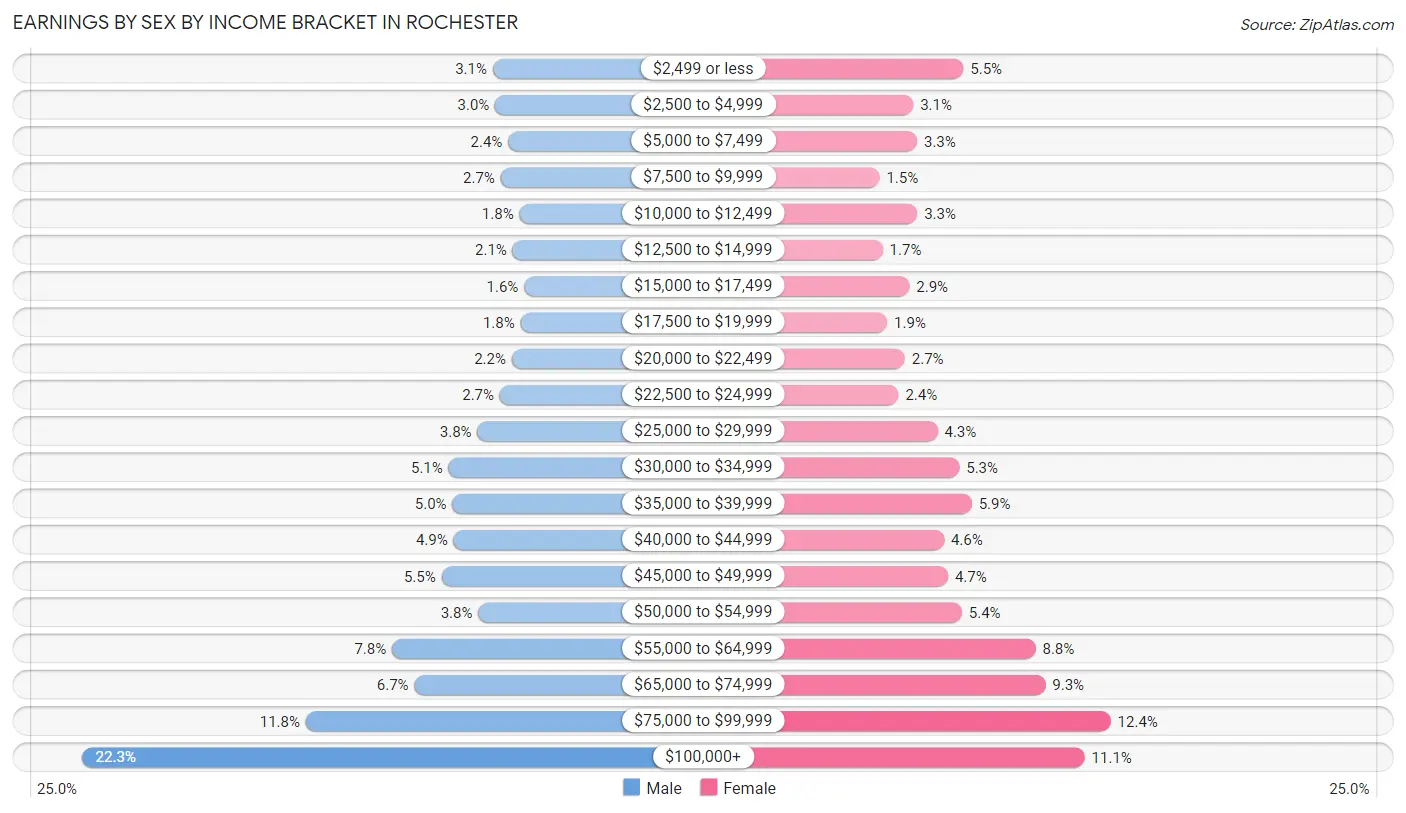
Earnings by Sex by Income Bracket in Rochester
The most common earnings brackets in Rochester are $100,000+ for men (7,985 | 22.3%) and $75,000 to $99,999 for women (4,245 | 12.4%).
| Income | Male | Female |
| $2,499 or less | 1,102 (3.1%) | 1,875 (5.5%) |
| $2,500 to $4,999 | 1,061 (3.0%) | 1,069 (3.1%) |
| $5,000 to $7,499 | 843 (2.4%) | 1,130 (3.3%) |
| $7,500 to $9,999 | 967 (2.7%) | 524 (1.5%) |
| $10,000 to $12,499 | 653 (1.8%) | 1,132 (3.3%) |
| $12,500 to $14,999 | 766 (2.1%) | 576 (1.7%) |
| $15,000 to $17,499 | 574 (1.6%) | 1,006 (2.9%) |
| $17,500 to $19,999 | 635 (1.8%) | 649 (1.9%) |
| $20,000 to $22,499 | 782 (2.2%) | 934 (2.7%) |
| $22,500 to $24,999 | 981 (2.7%) | 830 (2.4%) |
| $25,000 to $29,999 | 1,357 (3.8%) | 1,461 (4.3%) |
| $30,000 to $34,999 | 1,841 (5.1%) | 1,809 (5.3%) |
| $35,000 to $39,999 | 1,779 (5.0%) | 2,008 (5.9%) |
| $40,000 to $44,999 | 1,760 (4.9%) | 1,563 (4.5%) |
| $45,000 to $49,999 | 1,962 (5.5%) | 1,627 (4.7%) |
| $50,000 to $54,999 | 1,345 (3.7%) | 1,851 (5.4%) |
| $55,000 to $64,999 | 2,792 (7.8%) | 3,036 (8.8%) |
| $65,000 to $74,999 | 2,416 (6.7%) | 3,194 (9.3%) |
| $75,000 to $99,999 | 4,239 (11.8%) | 4,245 (12.4%) |
| $100,000+ | 7,985 (22.3%) | 3,827 (11.1%) |
| Total | 35,840 (100.0%) | 34,346 (100.0%) |
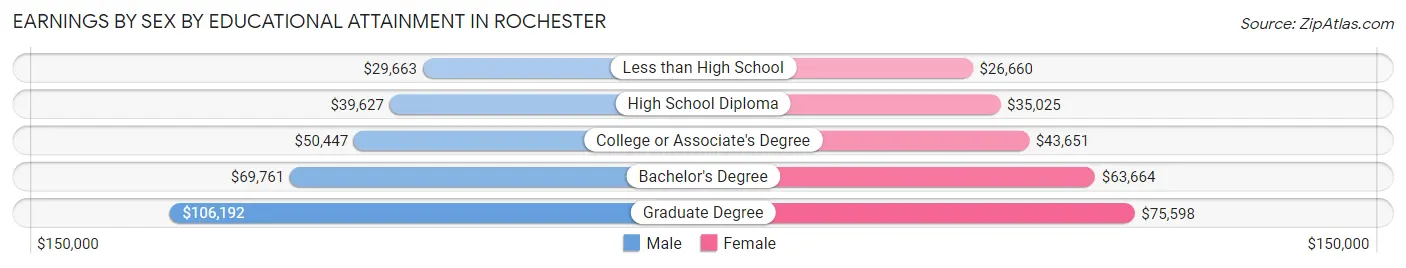
Earnings by Sex by Educational Attainment in Rochester
Average earnings in Rochester are $62,120 for men and $53,002 for women, a difference of 14.7%. Men with an educational attainment of graduate degree enjoy the highest average annual earnings of $106,192, while those with less than high school education earn the least with $29,663. Women with an educational attainment of graduate degree earn the most with the average annual earnings of $75,598, while those with less than high school education have the smallest earnings of $26,660.
| Educational Attainment | Male Income | Female Income |
| Less than High School | $29,663 | $26,660 |
| High School Diploma | $39,627 | $35,025 |
| College or Associate's Degree | $50,447 | $43,651 |
| Bachelor's Degree | $69,761 | $63,664 |
| Graduate Degree | $106,192 | $75,598 |
| Total | $62,120 | $53,002 |
Family Income in Rochester
Family Income Brackets in Rochester
According to the Rochester family income data, there are 6,854 families falling into the $100,000 to $149,999 income range, which is the most common income bracket and makes up 23.2% of all families. Conversely, the $10,000 to $14,999 income bracket is the least frequent group with only 325 families (1.1%) belonging to this category.
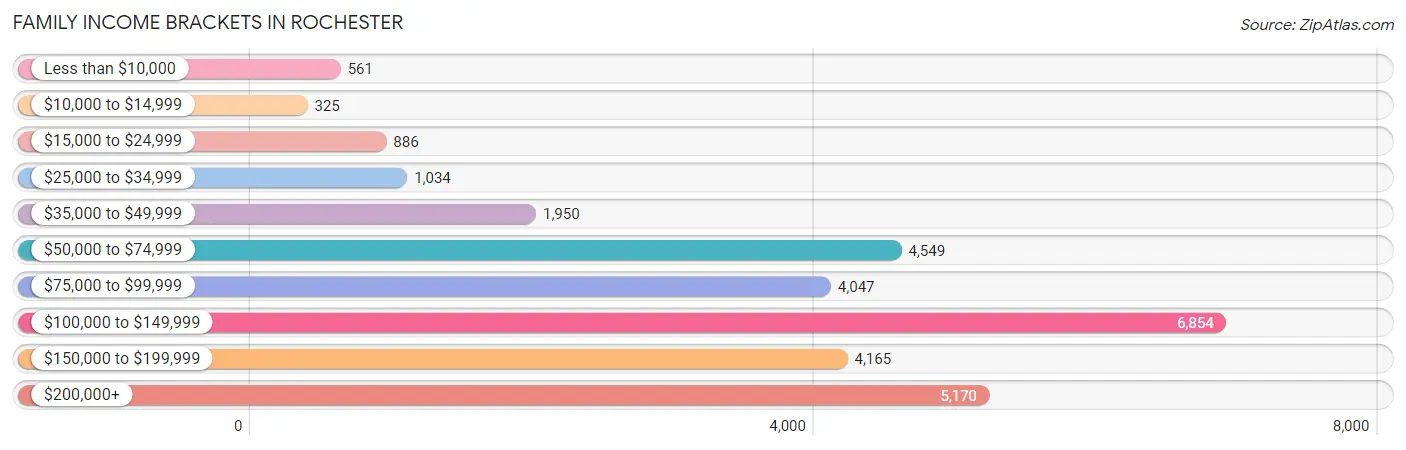
| Income Bracket | # Families | % Families |
| Less than $10,000 | 561 | 1.9% |
| $10,000 to $14,999 | 325 | 1.1% |
| $15,000 to $24,999 | 886 | 3.0% |
| $25,000 to $34,999 | 1,034 | 3.5% |
| $35,000 to $49,999 | 1,950 | 6.6% |
| $50,000 to $74,999 | 4,549 | 15.4% |
| $75,000 to $99,999 | 4,047 | 13.7% |
| $100,000 to $149,999 | 6,854 | 23.2% |
| $150,000 to $199,999 | 4,165 | 14.1% |
| $200,000+ | 5,170 | 17.5% |
Family Income by Famaliy Size in Rochester
6-person families (805 | 2.7%) account for the highest median family income in Rochester with $148,828 per family, while 2-person families (14,783 | 50.0%) have the highest median income of $46,397 per family member.
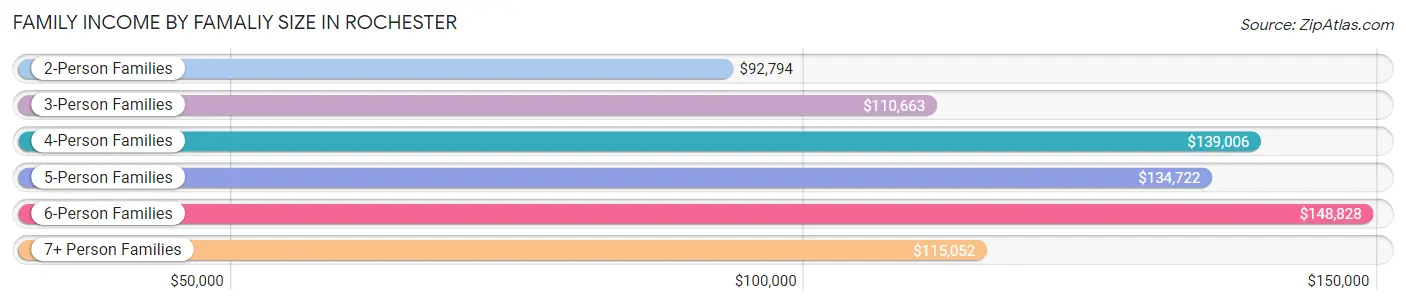
| Income Bracket | # Families | Median Income |
| 2-Person Families | 14,783 (50.0%) | $92,794 |
| 3-Person Families | 5,921 (20.0%) | $110,663 |
| 4-Person Families | 5,256 (17.8%) | $139,006 |
| 5-Person Families | 2,276 (7.7%) | $134,722 |
| 6-Person Families | 805 (2.7%) | $148,828 |
| 7+ Person Families | 501 (1.7%) | $115,052 |
| Total | 29,542 (100.0%) | $108,759 |
Family Income by Number of Earners in Rochester
The median family income in Rochester is $108,759, with families comprising 3+ earners (3,025) having the highest median family income of $145,882, while families with no earners (4,091) have the lowest median family income of $66,944, accounting for 10.2% and 13.9% of families, respectively.
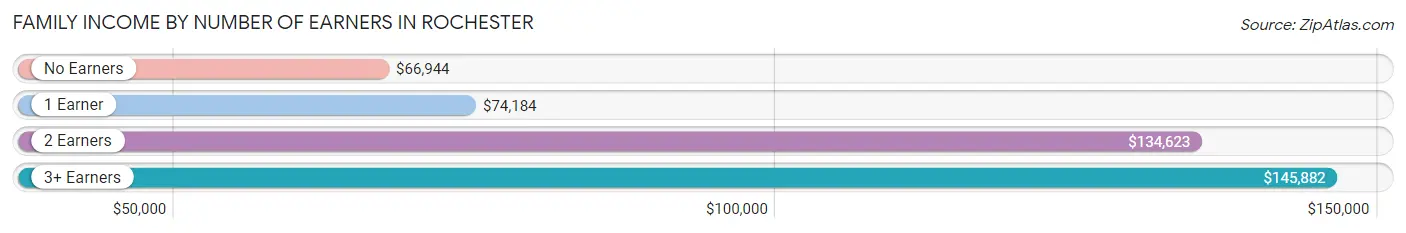
| Number of Earners | # Families | Median Income |
| No Earners | 4,091 (13.9%) | $66,944 |
| 1 Earner | 7,767 (26.3%) | $74,184 |
| 2 Earners | 14,659 (49.6%) | $134,623 |
| 3+ Earners | 3,025 (10.2%) | $145,882 |
| Total | 29,542 (100.0%) | $108,759 |
Household Income in Rochester
Household Income Brackets in Rochester
With 9,796 households falling in the category, the $100,000 to $149,999 income range is the most frequent in Rochester, accounting for 19.5% of all households. In contrast, only 1,206 households (2.4%) fall into the $10,000 to $14,999 income bracket, making it the least populous group.
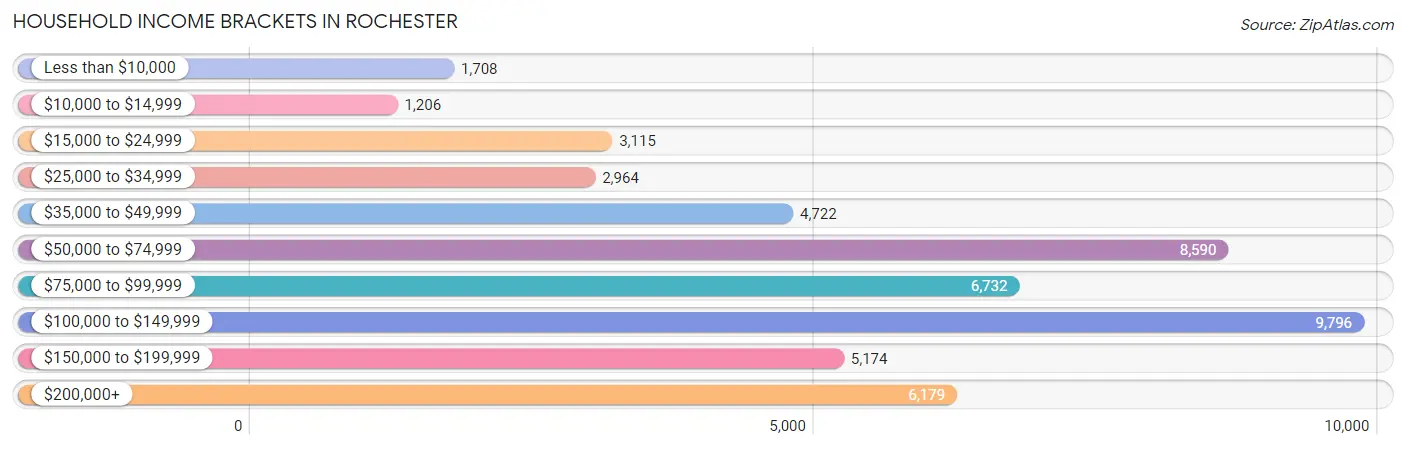
| Income Bracket | # Households | % Households |
| Less than $10,000 | 1,708 | 3.4% |
| $10,000 to $14,999 | 1,206 | 2.4% |
| $15,000 to $24,999 | 3,115 | 6.2% |
| $25,000 to $34,999 | 2,964 | 5.9% |
| $35,000 to $49,999 | 4,722 | 9.4% |
| $50,000 to $74,999 | 8,590 | 17.1% |
| $75,000 to $99,999 | 6,732 | 13.4% |
| $100,000 to $149,999 | 9,796 | 19.5% |
| $150,000 to $199,999 | 5,174 | 10.3% |
| $200,000+ | 6,179 | 12.3% |
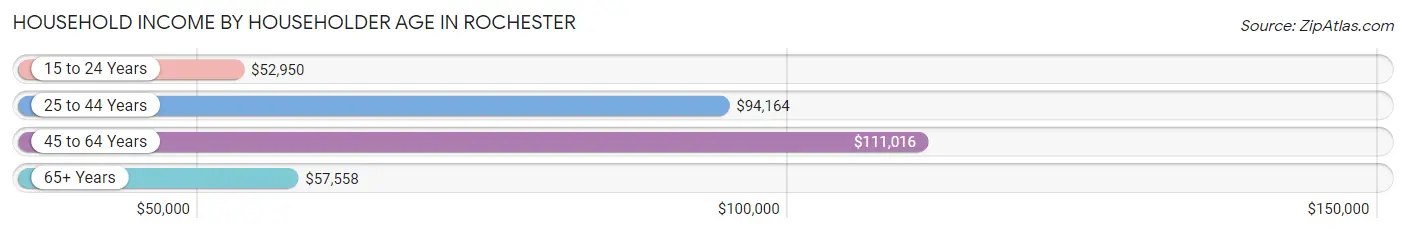
Household Income by Householder Age in Rochester
The median household income in Rochester is $83,973, with the highest median household income of $111,016 found in the 45 to 64 years age bracket for the primary householder. A total of 15,738 households (31.3%) fall into this category. Meanwhile, the 15 to 24 years age bracket for the primary householder has the lowest median household income of $52,950, with 3,405 households (6.8%) in this group.
| Income Bracket | # Households | Median Income |
| 15 to 24 Years | 3,405 (6.8%) | $52,950 |
| 25 to 44 Years | 19,432 (38.7%) | $94,164 |
| 45 to 64 Years | 15,738 (31.3%) | $111,016 |
| 65+ Years | 11,661 (23.2%) | $57,558 |
| Total | 50,236 (100.0%) | $83,973 |
Poverty in Rochester
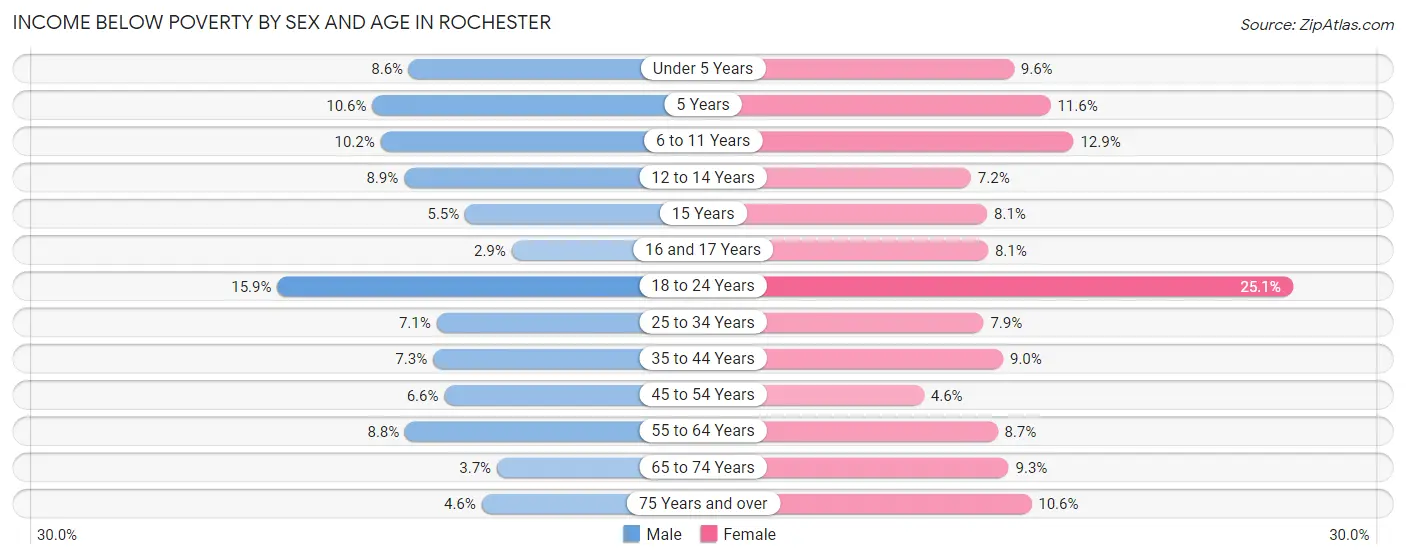
Income Below Poverty by Sex and Age in Rochester
With 8.0% poverty level for males and 10.2% for females among the residents of Rochester, 18 to 24 year old males and 18 to 24 year old females are the most vulnerable to poverty, with 826 males (15.9%) and 1,353 females (25.1%) in their respective age groups living below the poverty level.
| Age Bracket | Male | Female |
| Under 5 Years | 369 (8.6%) | 372 (9.6%) |
| 5 Years | 83 (10.6%) | 63 (11.6%) |
| 6 to 11 Years | 479 (10.2%) | 603 (12.9%) |
| 12 to 14 Years | 202 (8.9%) | 129 (7.2%) |
| 15 Years | 50 (5.5%) | 65 (8.1%) |
| 16 and 17 Years | 43 (2.9%) | 129 (8.1%) |
| 18 to 24 Years | 826 (15.9%) | 1,353 (25.1%) |
| 25 to 34 Years | 648 (7.1%) | 775 (7.9%) |
| 35 to 44 Years | 613 (7.3%) | 728 (9.0%) |
| 45 to 54 Years | 409 (6.6%) | 288 (4.6%) |
| 55 to 64 Years | 600 (8.8%) | 630 (8.7%) |
| 65 to 74 Years | 165 (3.7%) | 513 (9.3%) |
| 75 Years and over | 146 (4.5%) | 504 (10.5%) |
| Total | 4,633 (8.0%) | 6,152 (10.2%) |
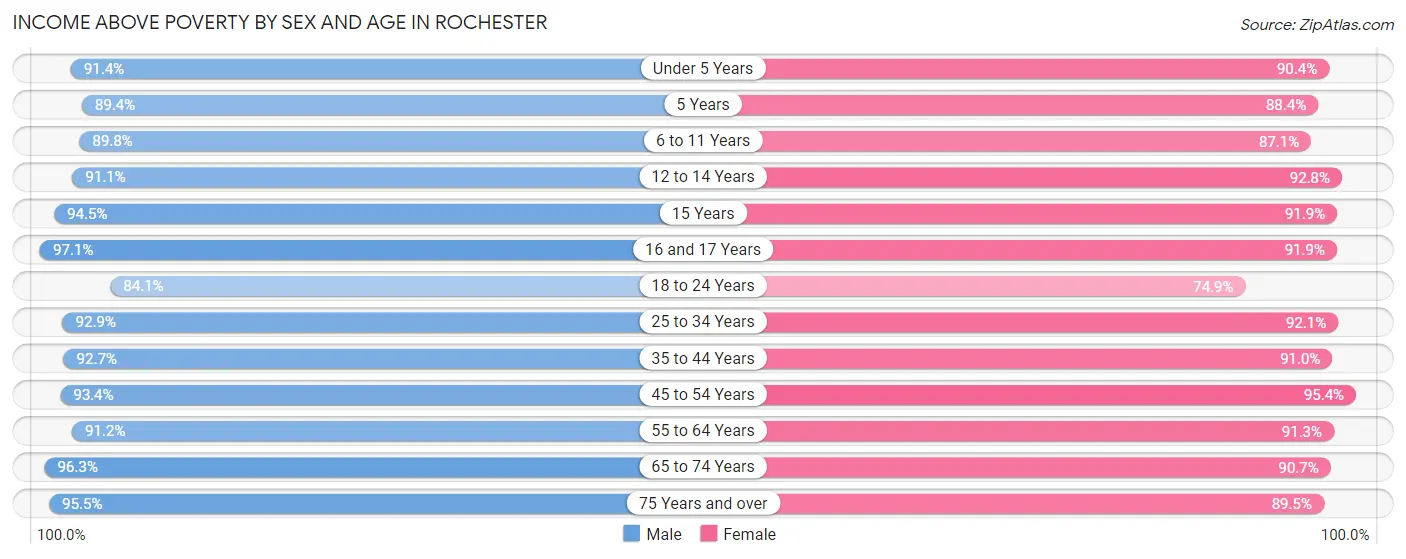
Income Above Poverty by Sex and Age in Rochester
According to the poverty statistics in Rochester, males aged 16 and 17 years and females aged 45 to 54 years are the age groups that are most secure financially, with 97.1% of males and 95.4% of females in these age groups living above the poverty line.
| Age Bracket | Male | Female |
| Under 5 Years | 3,922 (91.4%) | 3,510 (90.4%) |
| 5 Years | 697 (89.4%) | 479 (88.4%) |
| 6 to 11 Years | 4,226 (89.8%) | 4,070 (87.1%) |
| 12 to 14 Years | 2,076 (91.1%) | 1,666 (92.8%) |
| 15 Years | 864 (94.5%) | 738 (91.9%) |
| 16 and 17 Years | 1,448 (97.1%) | 1,456 (91.9%) |
| 18 to 24 Years | 4,358 (84.1%) | 4,037 (74.9%) |
| 25 to 34 Years | 8,536 (92.9%) | 9,043 (92.1%) |
| 35 to 44 Years | 7,828 (92.7%) | 7,377 (91.0%) |
| 45 to 54 Years | 5,758 (93.4%) | 6,013 (95.4%) |
| 55 to 64 Years | 6,208 (91.2%) | 6,638 (91.3%) |
| 65 to 74 Years | 4,293 (96.3%) | 5,008 (90.7%) |
| 75 Years and over | 3,063 (95.5%) | 4,274 (89.4%) |
| Total | 53,277 (92.0%) | 54,309 (89.8%) |
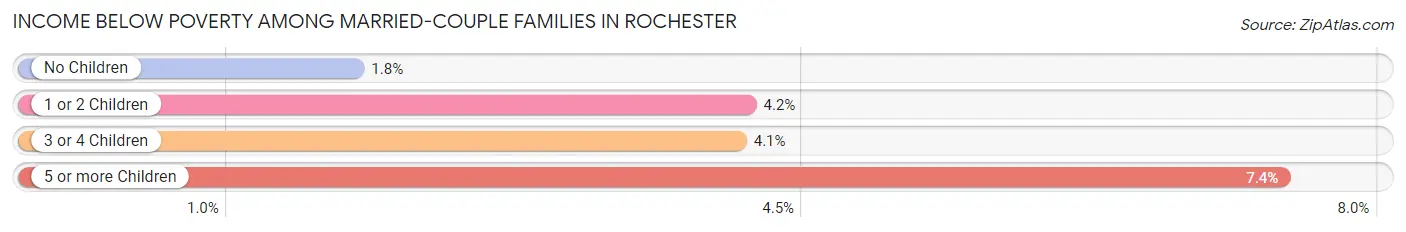
Income Below Poverty Among Married-Couple Families in Rochester
The poverty statistics for married-couple families in Rochester show that 2.8% or 667 of the total 23,492 families live below the poverty line. Families with 5 or more children have the highest poverty rate of 7.4%, comprising of 16 families. On the other hand, families with no children have the lowest poverty rate of 1.8%, which includes 234 families.
| Children | Above Poverty | Below Poverty |
| No Children | 12,982 (98.2%) | 234 (1.8%) |
| 1 or 2 Children | 7,657 (95.8%) | 332 (4.2%) |
| 3 or 4 Children | 1,986 (95.9%) | 85 (4.1%) |
| 5 or more Children | 200 (92.6%) | 16 (7.4%) |
| Total | 22,825 (97.2%) | 667 (2.8%) |
Income Below Poverty Among Single-Parent Households in Rochester
According to the poverty data in Rochester, 10.7% or 198 single-father households and 21.5% or 904 single-mother households are living below the poverty line. Among single-father households, those with 1 or 2 children have the highest poverty rate, with 175 households (17.6%) experiencing poverty. Likewise, among single-mother households, those with 3 or 4 children have the highest poverty rate, with 109 households (37.3%) falling below the poverty line.
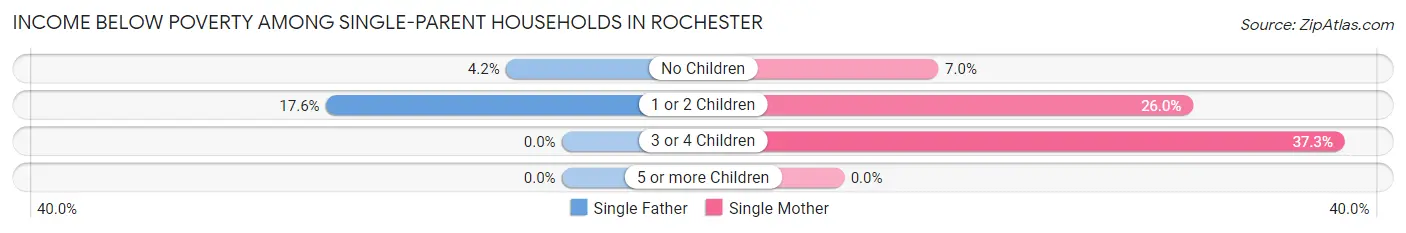
| Children | Single Father | Single Mother |
| No Children | 23 (4.2%) | 81 (7.0%) |
| 1 or 2 Children | 175 (17.6%) | 714 (26.0%) |
| 3 or 4 Children | 0 (0.0%) | 109 (37.3%) |
| 5 or more Children | 0 (0.0%) | 0 (0.0%) |
| Total | 198 (10.7%) | 904 (21.5%) |
Income Below Poverty Among Married-Couple vs Single-Parent Households in Rochester
The poverty data for Rochester shows that 667 of the married-couple family households (2.8%) and 1,102 of the single-parent households (18.2%) are living below the poverty level. Within the married-couple family households, those with 5 or more children have the highest poverty rate, with 16 households (7.4%) falling below the poverty line. Among the single-parent households, those with 1 or 2 children have the highest poverty rate, with 889 household (23.8%) living below poverty.
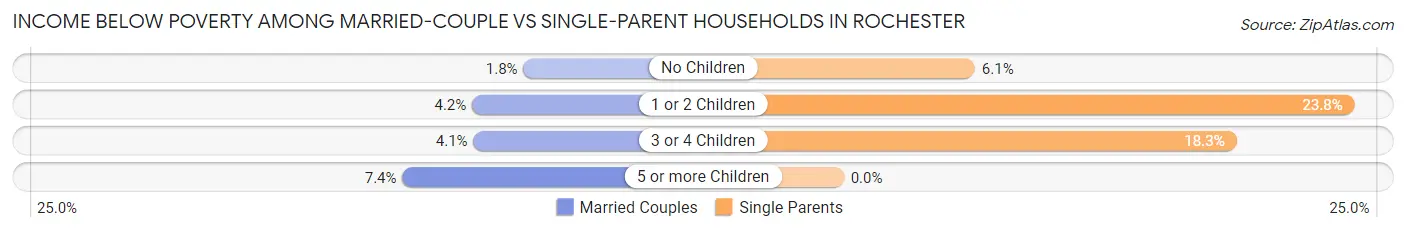
| Children | Married-Couple Families | Single-Parent Households |
| No Children | 234 (1.8%) | 104 (6.1%) |
| 1 or 2 Children | 332 (4.2%) | 889 (23.8%) |
| 3 or 4 Children | 85 (4.1%) | 109 (18.3%) |
| 5 or more Children | 16 (7.4%) | 0 (0.0%) |
| Total | 667 (2.8%) | 1,102 (18.2%) |
Race in Rochester
The most populous races in Rochester are White / Caucasian (92,155 | 76.3%), Black / African American (11,088 | 9.2%), and Asian (9,415 | 7.8%).
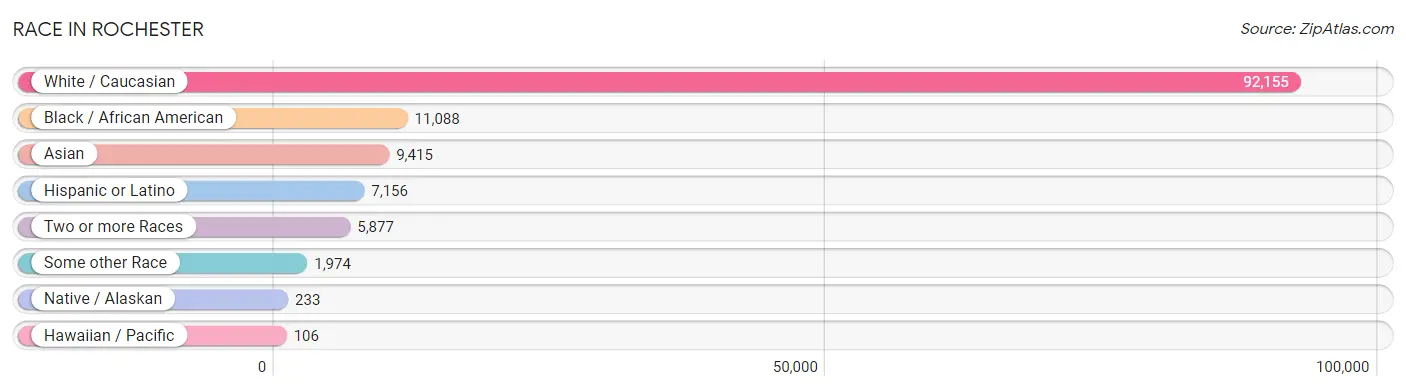
| Race | # Population | % Population |
| Asian | 9,415 | 7.8% |
| Black / African American | 11,088 | 9.2% |
| Hawaiian / Pacific | 106 | 0.1% |
| Hispanic or Latino | 7,156 | 5.9% |
| Native / Alaskan | 233 | 0.2% |
| White / Caucasian | 92,155 | 76.3% |
| Two or more Races | 5,877 | 4.9% |
| Some other Race | 1,974 | 1.6% |
| Total | 120,848 | 100.0% |
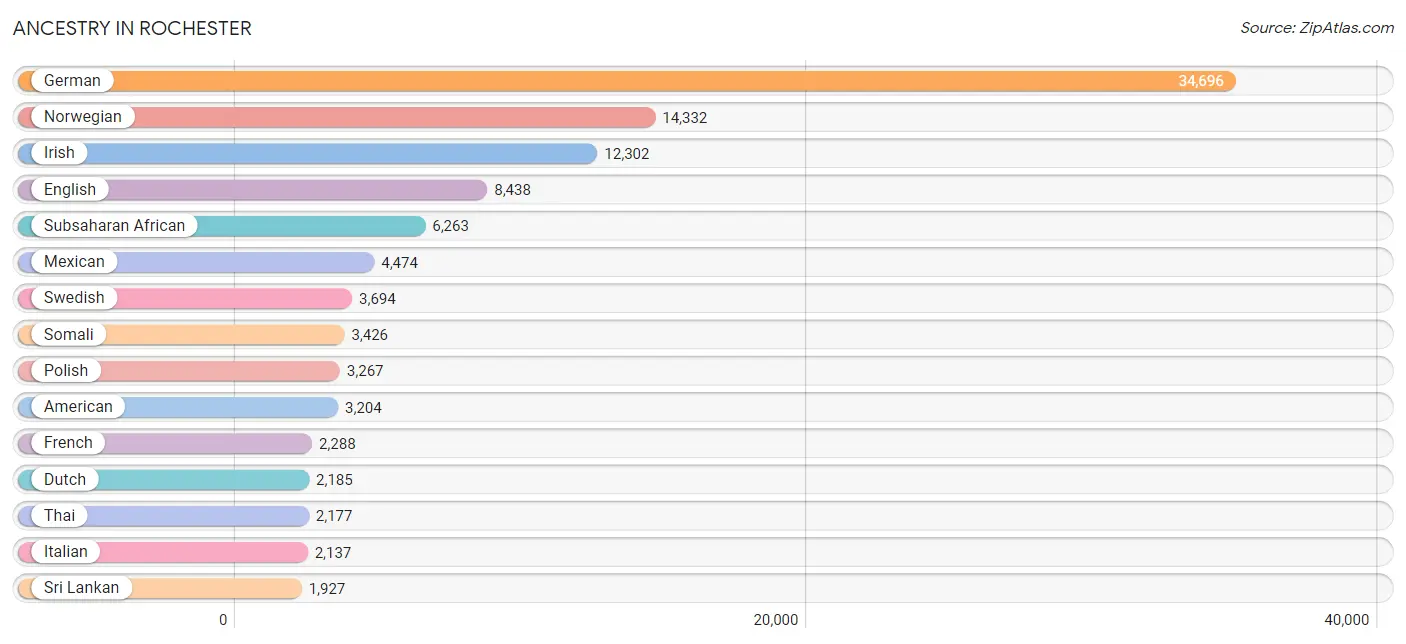
Ancestry in Rochester
The most populous ancestries reported in Rochester are German (34,696 | 28.7%), Norwegian (14,332 | 11.9%), Irish (12,302 | 10.2%), English (8,438 | 7.0%), and Subsaharan African (6,263 | 5.2%), together accounting for 62.9% of all Rochester residents.
| Ancestry | # Population | % Population |
| Afghan | 55 | 0.1% |
| African | 750 | 0.6% |
| Albanian | 9 | 0.0% |
| Alsatian | 9 | 0.0% |
| American | 3,204 | 2.6% |
| Arab | 1,700 | 1.4% |
| Armenian | 45 | 0.0% |
| Austrian | 180 | 0.2% |
| Bangladeshi | 285 | 0.2% |
| Belgian | 219 | 0.2% |
| Bermudan | 36 | 0.0% |
| Bhutanese | 321 | 0.3% |
| Brazilian | 117 | 0.1% |
| British | 391 | 0.3% |
| British West Indian | 8 | 0.0% |
| Bulgarian | 60 | 0.1% |
| Burmese | 388 | 0.3% |
| Canadian | 258 | 0.2% |
| Celtic | 35 | 0.0% |
| Central American | 324 | 0.3% |
| Central American Indian | 14 | 0.0% |
| Cherokee | 93 | 0.1% |
| Chilean | 68 | 0.1% |
| Chippewa | 190 | 0.2% |
| Colombian | 228 | 0.2% |
| Costa Rican | 26 | 0.0% |
| Cree | 5 | 0.0% |
| Croatian | 238 | 0.2% |
| Crow | 7 | 0.0% |
| Cuban | 217 | 0.2% |
| Czech | 1,315 | 1.1% |
| Czechoslovakian | 149 | 0.1% |
| Danish | 1,135 | 0.9% |
| Dominican | 15 | 0.0% |
| Dutch | 2,185 | 1.8% |
| Eastern European | 608 | 0.5% |
| Ecuadorian | 151 | 0.1% |
| Egyptian | 223 | 0.2% |
| English | 8,438 | 7.0% |
| Ethiopian | 734 | 0.6% |
| European | 1,714 | 1.4% |
| Filipino | 138 | 0.1% |
| Finnish | 802 | 0.7% |
| French | 2,288 | 1.9% |
| French Canadian | 649 | 0.5% |
| German | 34,696 | 28.7% |
| German Russian | 8 | 0.0% |
| Ghanaian | 81 | 0.1% |
| Greek | 134 | 0.1% |
| Guamanian / Chamorro | 63 | 0.1% |
| Guatemalan | 49 | 0.0% |
| Honduran | 27 | 0.0% |
| Hungarian | 346 | 0.3% |
| Icelander | 49 | 0.0% |
| Indian (Asian) | 1,885 | 1.6% |
| Indonesian | 234 | 0.2% |
| Iranian | 203 | 0.2% |
| Iraqi | 165 | 0.1% |
| Irish | 12,302 | 10.2% |
| Italian | 2,137 | 1.8% |
| Japanese | 1,427 | 1.2% |
| Jordanian | 15 | 0.0% |
| Kenyan | 44 | 0.0% |
| Korean | 542 | 0.4% |
| Latvian | 58 | 0.1% |
| Lebanese | 123 | 0.1% |
| Liberian | 3 | 0.0% |
| Lithuanian | 192 | 0.2% |
| Luxembourger | 193 | 0.2% |
| Malaysian | 530 | 0.4% |
| Maltese | 47 | 0.0% |
| Mexican | 4,474 | 3.7% |
| Mexican American Indian | 22 | 0.0% |
| Mongolian | 22 | 0.0% |
| Moroccan | 796 | 0.7% |
| Native Hawaiian | 30 | 0.0% |
| Nicaraguan | 66 | 0.1% |
| Nigerian | 181 | 0.2% |
| Northern European | 268 | 0.2% |
| Norwegian | 14,332 | 11.9% |
| Pakistani | 229 | 0.2% |
| Palestinian | 19 | 0.0% |
| Paraguayan | 81 | 0.1% |
| Pennsylvania German | 42 | 0.0% |
| Peruvian | 156 | 0.1% |
| Polish | 3,267 | 2.7% |
| Portuguese | 54 | 0.0% |
| Puerto Rican | 558 | 0.5% |
| Romanian | 180 | 0.2% |
| Russian | 457 | 0.4% |
| Salvadoran | 156 | 0.1% |
| Scandinavian | 1,749 | 1.5% |
| Scotch-Irish | 568 | 0.5% |
| Scottish | 1,632 | 1.3% |
| Serbian | 103 | 0.1% |
| Sioux | 13 | 0.0% |
| Slavic | 18 | 0.0% |
| Slovak | 146 | 0.1% |
| Slovene | 38 | 0.0% |
| Somali | 3,426 | 2.8% |
| South African | 39 | 0.0% |
| South American | 800 | 0.7% |
| Spaniard | 42 | 0.0% |
| Spanish | 105 | 0.1% |
| Sri Lankan | 1,927 | 1.6% |
| Subsaharan African | 6,263 | 5.2% |
| Sudanese | 904 | 0.7% |
| Swedish | 3,694 | 3.1% |
| Swiss | 676 | 0.6% |
| Syrian | 8 | 0.0% |
| Thai | 2,177 | 1.8% |
| Turkish | 95 | 0.1% |
| Ugandan | 59 | 0.1% |
| Ukrainian | 390 | 0.3% |
| Uruguayan | 42 | 0.0% |
| Venezuelan | 74 | 0.1% |
| Vietnamese | 150 | 0.1% |
| Welsh | 628 | 0.5% |
| West Indian | 8 | 0.0% |
| Yugoslavian | 489 | 0.4% | View All 120 Rows |
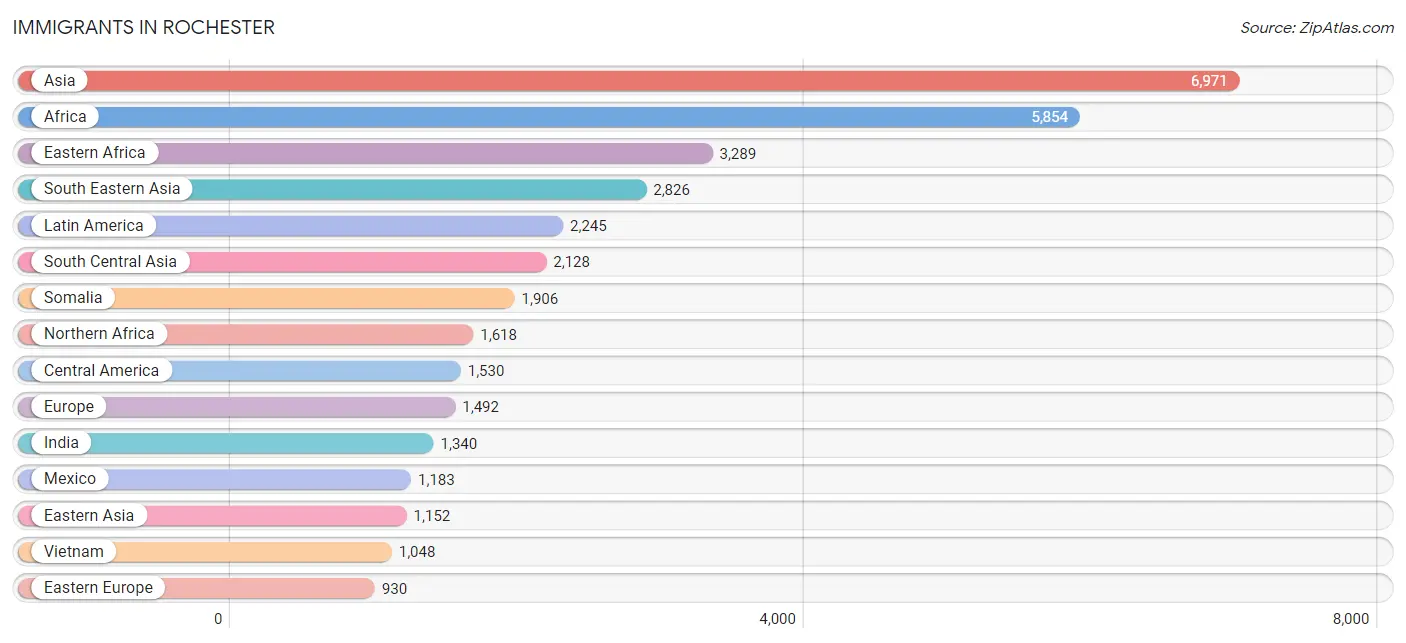
Immigrants in Rochester
The most numerous immigrant groups reported in Rochester came from Asia (6,971 | 5.8%), Africa (5,854 | 4.8%), Eastern Africa (3,289 | 2.7%), South Eastern Asia (2,826 | 2.3%), and Latin America (2,245 | 1.9%), together accounting for 17.5% of all Rochester residents.
| Immigration Origin | # Population | % Population |
| Afghanistan | 8 | 0.0% |
| Africa | 5,854 | 4.8% |
| Argentina | 16 | 0.0% |
| Asia | 6,971 | 5.8% |
| Australia | 45 | 0.0% |
| Bangladesh | 138 | 0.1% |
| Belarus | 17 | 0.0% |
| Bosnia and Herzegovina | 472 | 0.4% |
| Brazil | 85 | 0.1% |
| Bulgaria | 33 | 0.0% |
| Cambodia | 744 | 0.6% |
| Cameroon | 298 | 0.3% |
| Canada | 269 | 0.2% |
| Caribbean | 151 | 0.1% |
| Central America | 1,530 | 1.3% |
| Chile | 57 | 0.1% |
| China | 823 | 0.7% |
| Colombia | 103 | 0.1% |
| Congo | 94 | 0.1% |
| Croatia | 29 | 0.0% |
| Cuba | 33 | 0.0% |
| Czechoslovakia | 10 | 0.0% |
| Denmark | 10 | 0.0% |
| Eastern Africa | 3,289 | 2.7% |
| Eastern Asia | 1,152 | 0.9% |
| Eastern Europe | 930 | 0.8% |
| Ecuador | 77 | 0.1% |
| Egypt | 793 | 0.7% |
| El Salvador | 224 | 0.2% |
| England | 56 | 0.1% |
| Eritrea | 27 | 0.0% |
| Ethiopia | 650 | 0.5% |
| Europe | 1,492 | 1.2% |
| Fiji | 9 | 0.0% |
| France | 64 | 0.1% |
| Germany | 105 | 0.1% |
| Ghana | 135 | 0.1% |
| Greece | 49 | 0.0% |
| Guatemala | 48 | 0.0% |
| Guyana | 18 | 0.0% |
| Honduras | 9 | 0.0% |
| Hong Kong | 9 | 0.0% |
| Hungary | 31 | 0.0% |
| India | 1,340 | 1.1% |
| Iran | 147 | 0.1% |
| Iraq | 64 | 0.1% |
| Ireland | 27 | 0.0% |
| Italy | 24 | 0.0% |
| Japan | 97 | 0.1% |
| Jordan | 15 | 0.0% |
| Kazakhstan | 19 | 0.0% |
| Kenya | 385 | 0.3% |
| Korea | 232 | 0.2% |
| Kuwait | 36 | 0.0% |
| Laos | 223 | 0.2% |
| Latin America | 2,245 | 1.9% |
| Lebanon | 64 | 0.1% |
| Liberia | 34 | 0.0% |
| Lithuania | 14 | 0.0% |
| Malaysia | 36 | 0.0% |
| Mexico | 1,183 | 1.0% |
| Middle Africa | 410 | 0.3% |
| Morocco | 347 | 0.3% |
| Nepal | 123 | 0.1% |
| Netherlands | 19 | 0.0% |
| Nicaragua | 22 | 0.0% |
| Nigeria | 284 | 0.2% |
| Northern Africa | 1,618 | 1.3% |
| Northern Europe | 211 | 0.2% |
| Oceania | 54 | 0.0% |
| Pakistan | 292 | 0.2% |
| Peru | 75 | 0.1% |
| Philippines | 305 | 0.3% |
| Poland | 86 | 0.1% |
| Romania | 70 | 0.1% |
| Russia | 77 | 0.1% |
| Saudi Arabia | 245 | 0.2% |
| Scotland | 18 | 0.0% |
| Serbia | 18 | 0.0% |
| Somalia | 1,906 | 1.6% |
| South Africa | 53 | 0.0% |
| South America | 564 | 0.5% |
| South Central Asia | 2,128 | 1.8% |
| South Eastern Asia | 2,826 | 2.3% |
| Southern Europe | 145 | 0.1% |
| Spain | 42 | 0.0% |
| Sri Lanka | 61 | 0.1% |
| Sudan | 465 | 0.4% |
| Switzerland | 18 | 0.0% |
| Syria | 55 | 0.1% |
| Taiwan | 142 | 0.1% |
| Thailand | 257 | 0.2% |
| Turkey | 116 | 0.1% |
| Uganda | 12 | 0.0% |
| Ukraine | 30 | 0.0% |
| Uruguay | 38 | 0.0% |
| Venezuela | 74 | 0.1% |
| Vietnam | 1,048 | 0.9% |
| Western Africa | 453 | 0.4% |
| Western Asia | 865 | 0.7% |
| Western Europe | 206 | 0.2% |
| Yemen | 193 | 0.2% |
| Zaire | 11 | 0.0% | View All 103 Rows |
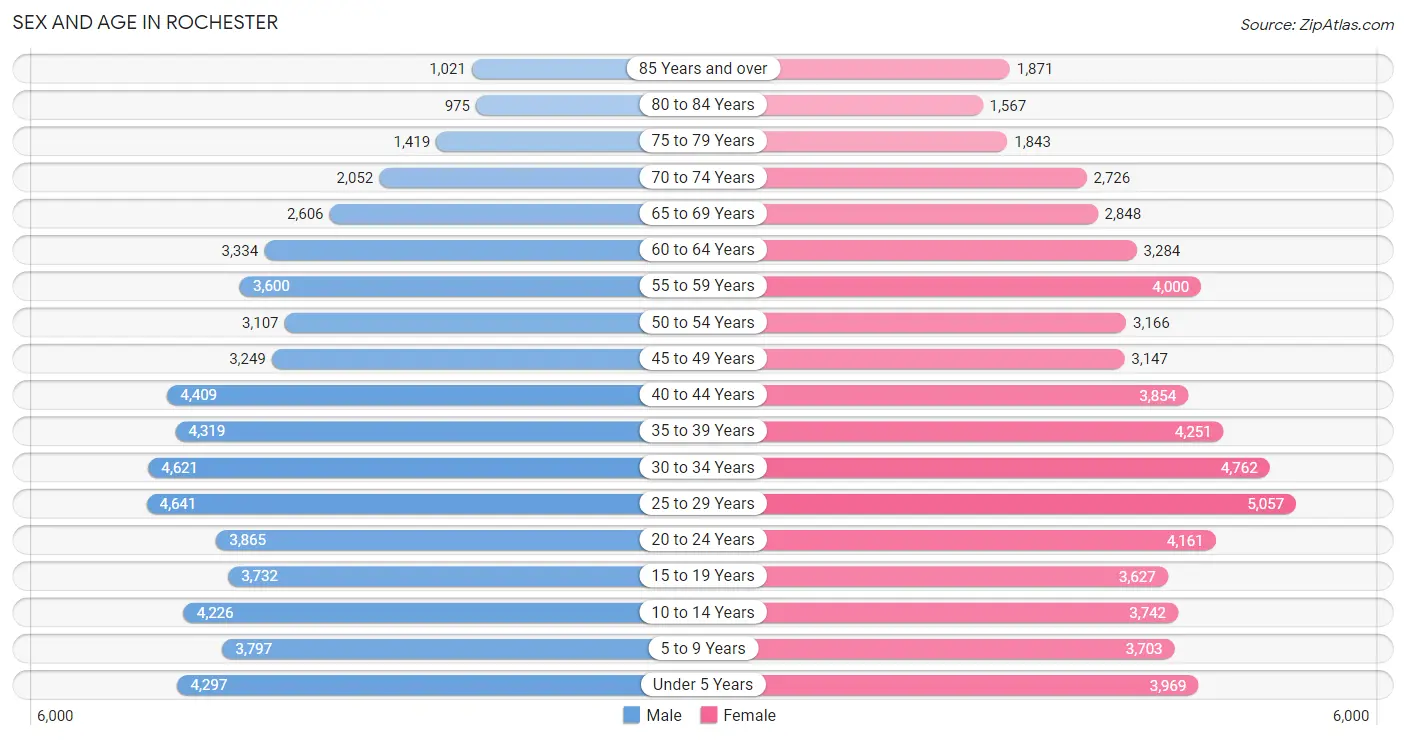
Sex and Age in Rochester
Sex and Age in Rochester
The most populous age groups in Rochester are 25 to 29 Years (4,641 | 7.8%) for men and 25 to 29 Years (5,057 | 8.2%) for women.
| Age Bracket | Male | Female |
| Under 5 Years | 4,297 (7.2%) | 3,969 (6.5%) |
| 5 to 9 Years | 3,797 (6.4%) | 3,703 (6.0%) |
| 10 to 14 Years | 4,226 (7.1%) | 3,742 (6.1%) |
| 15 to 19 Years | 3,732 (6.3%) | 3,627 (5.9%) |
| 20 to 24 Years | 3,865 (6.5%) | 4,161 (6.8%) |
| 25 to 29 Years | 4,641 (7.8%) | 5,057 (8.2%) |
| 30 to 34 Years | 4,621 (7.8%) | 4,762 (7.7%) |
| 35 to 39 Years | 4,319 (7.3%) | 4,251 (6.9%) |
| 40 to 44 Years | 4,409 (7.4%) | 3,854 (6.3%) |
| 45 to 49 Years | 3,249 (5.5%) | 3,147 (5.1%) |
| 50 to 54 Years | 3,107 (5.2%) | 3,166 (5.1%) |
| 55 to 59 Years | 3,600 (6.1%) | 4,000 (6.5%) |
| 60 to 64 Years | 3,334 (5.6%) | 3,284 (5.3%) |
| 65 to 69 Years | 2,606 (4.4%) | 2,848 (4.6%) |
| 70 to 74 Years | 2,052 (3.5%) | 2,726 (4.4%) |
| 75 to 79 Years | 1,419 (2.4%) | 1,843 (3.0%) |
| 80 to 84 Years | 975 (1.7%) | 1,567 (2.5%) |
| 85 Years and over | 1,021 (1.7%) | 1,871 (3.0%) |
| Total | 59,270 (100.0%) | 61,578 (100.0%) |
Families and Households in Rochester
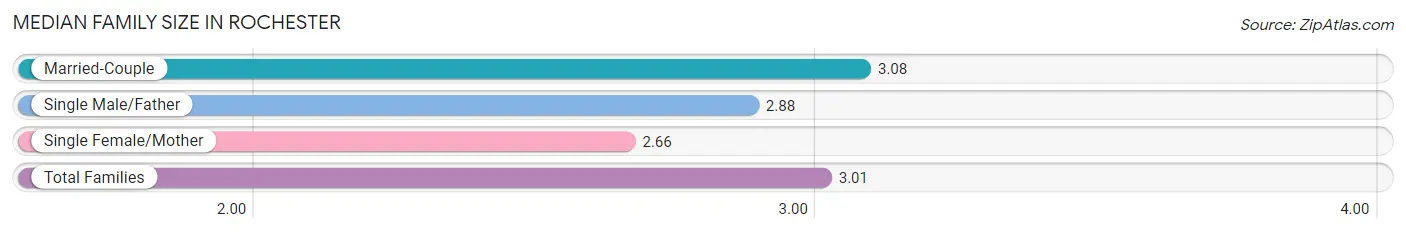
Median Family Size in Rochester
The median family size in Rochester is 3.01 persons per family, with married-couple families (23,492 | 79.5%) accounting for the largest median family size of 3.08 persons per family. On the other hand, single female/mother families (4,200 | 14.2%) represent the smallest median family size with 2.66 persons per family.
| Family Type | # Families | Family Size |
| Married-Couple | 23,492 (79.5%) | 3.08 |
| Single Male/Father | 1,850 (6.3%) | 2.88 |
| Single Female/Mother | 4,200 (14.2%) | 2.66 |
| Total Families | 29,542 (100.0%) | 3.01 |
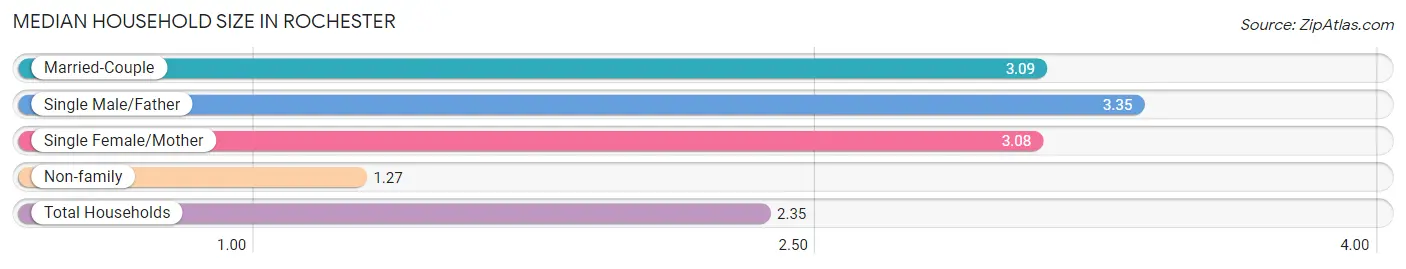
Median Household Size in Rochester
The median household size in Rochester is 2.35 persons per household, with single male/father households (1,850 | 3.7%) accounting for the largest median household size of 3.35 persons per household. non-family households (20,694 | 41.2%) represent the smallest median household size with 1.27 persons per household.
| Household Type | # Households | Household Size |
| Married-Couple | 23,492 (46.8%) | 3.09 |
| Single Male/Father | 1,850 (3.7%) | 3.35 |
| Single Female/Mother | 4,200 (8.4%) | 3.08 |
| Non-family | 20,694 (41.2%) | 1.27 |
| Total Households | 50,236 (100.0%) | 2.35 |
Household Size by Marriage Status in Rochester
Out of a total of 50,236 households in Rochester, 29,542 (58.8%) are family households, while 20,694 (41.2%) are nonfamily households. The most numerous type of family households are 2-person households, comprising 13,647, and the most common type of nonfamily households are 1-person households, comprising 16,005.
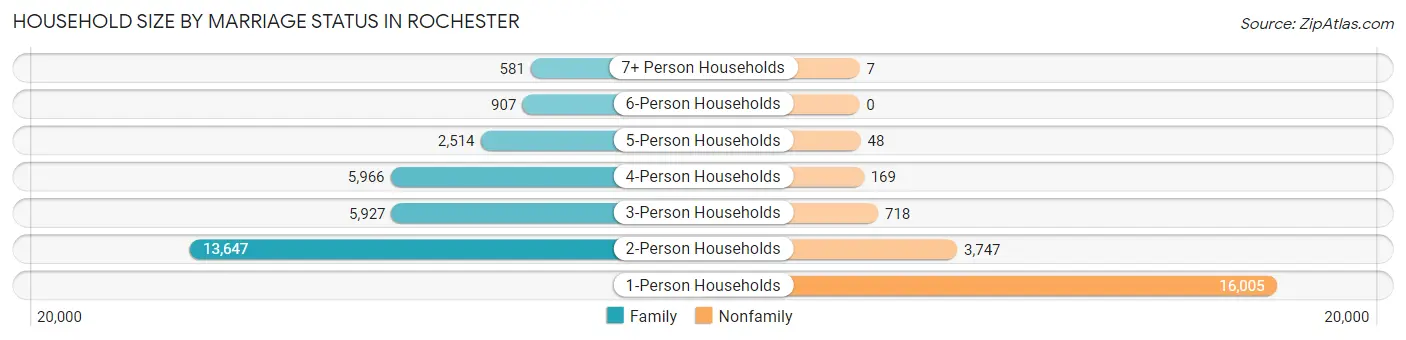
| Household Size | Family Households | Nonfamily Households |
| 1-Person Households | - | 16,005 (31.9%) |
| 2-Person Households | 13,647 (27.2%) | 3,747 (7.5%) |
| 3-Person Households | 5,927 (11.8%) | 718 (1.4%) |
| 4-Person Households | 5,966 (11.9%) | 169 (0.3%) |
| 5-Person Households | 2,514 (5.0%) | 48 (0.1%) |
| 6-Person Households | 907 (1.8%) | 0 (0.0%) |
| 7+ Person Households | 581 (1.2%) | 7 (0.0%) |
| Total | 29,542 (58.8%) | 20,694 (41.2%) |
Female Fertility in Rochester
Fertility by Age in Rochester
Average fertility rate in Rochester is 62.0 births per 1,000 women. Women in the age bracket of 20 to 34 years have the highest fertility rate with 84.0 births per 1,000 women. Women in the age bracket of 20 to 34 years acount for 64.5% of all women with births.
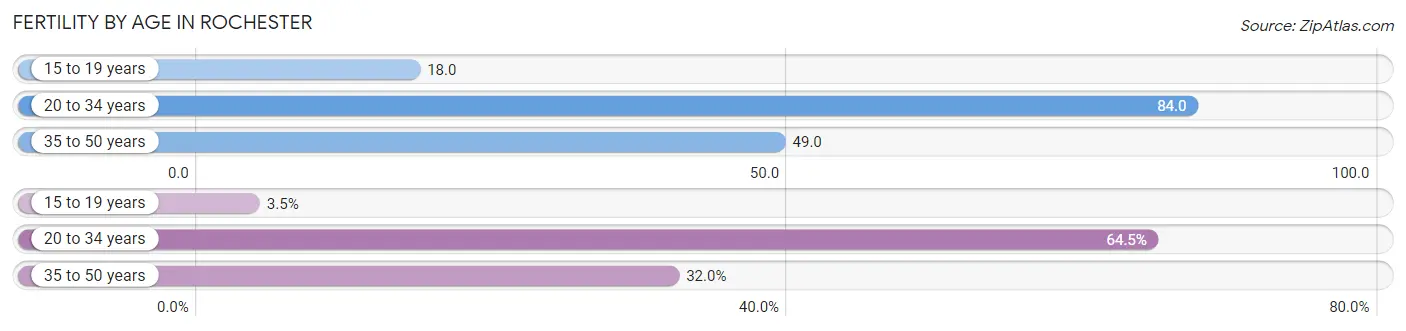
| Age Bracket | Women with Births | Births / 1,000 Women |
| 15 to 19 years | 64 (3.5%) | 18.0 |
| 20 to 34 years | 1,174 (64.5%) | 84.0 |
| 35 to 50 years | 582 (32.0%) | 49.0 |
| Total | 1,820 (100.0%) | 62.0 |
Fertility by Age by Marriage Status in Rochester
78.2% of women with births (1,820) in Rochester are married. The highest percentage of unmarried women with births falls into 15 to 19 years age bracket with 82.8% of them unmarried at the time of birth, while the lowest percentage of unmarried women with births belong to 20 to 34 years age bracket with 16.5% of them unmarried.
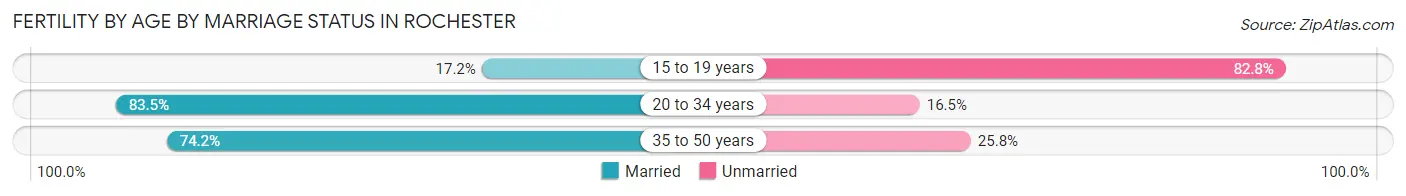
| Age Bracket | Married | Unmarried |
| 15 to 19 years | 11 (17.2%) | 53 (82.8%) |
| 20 to 34 years | 980 (83.5%) | 194 (16.5%) |
| 35 to 50 years | 432 (74.2%) | 150 (25.8%) |
| Total | 1,423 (78.2%) | 397 (21.8%) |
Fertility by Education in Rochester
Average fertility rate in Rochester is 62.0 births per 1,000 women. Women with the education attainment of college or associate's degree have the highest fertility rate of 72.0 births per 1,000 women, while women with the education attainment of less than high school have the lowest fertility at 40.0 births per 1,000 women. Women with the education attainment of bachelor's degree represent 29.9% of all women with births.
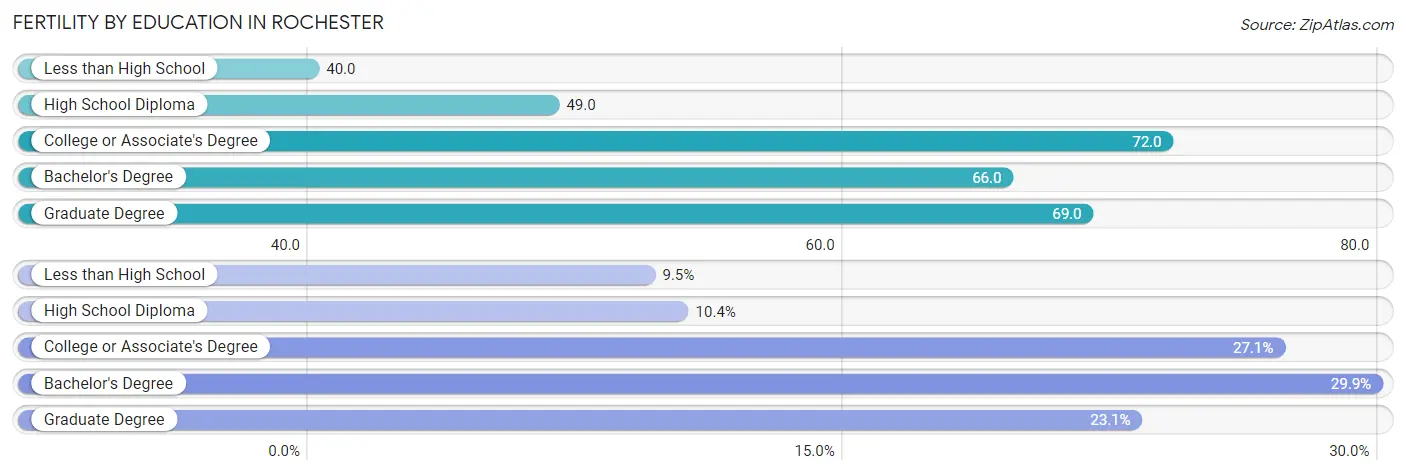
| Educational Attainment | Women with Births | Births / 1,000 Women |
| Less than High School | 172 (9.5%) | 40.0 |
| High School Diploma | 189 (10.4%) | 49.0 |
| College or Associate's Degree | 494 (27.1%) | 72.0 |
| Bachelor's Degree | 544 (29.9%) | 66.0 |
| Graduate Degree | 421 (23.1%) | 69.0 |
| Total | 1,820 (100.0%) | 62.0 |
Fertility by Education by Marriage Status in Rochester
21.8% of women with births in Rochester are unmarried. Women with the educational attainment of graduate degree are most likely to be married with 90.5% of them married at childbirth, while women with the educational attainment of less than high school are least likely to be married with 73.8% of them unmarried at childbirth.
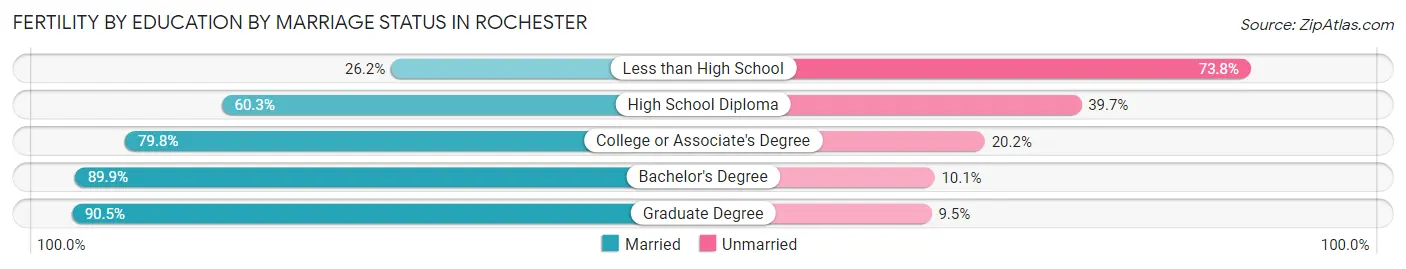
| Educational Attainment | Married | Unmarried |
| Less than High School | 45 (26.2%) | 127 (73.8%) |
| High School Diploma | 114 (60.3%) | 75 (39.7%) |
| College or Associate's Degree | 394 (79.8%) | 100 (20.2%) |
| Bachelor's Degree | 489 (89.9%) | 55 (10.1%) |
| Graduate Degree | 381 (90.5%) | 40 (9.5%) |
| Total | 1,423 (78.2%) | 397 (21.8%) |
Employment Characteristics in Rochester
Employment by Class of Employer in Rochester
Among the 63,878 employed individuals in Rochester, private company employees (30,889 | 48.4%), not-for-profit organizations (22,487 | 35.2%), and local government employees (4,024 | 6.3%) make up the most common classes of employment.
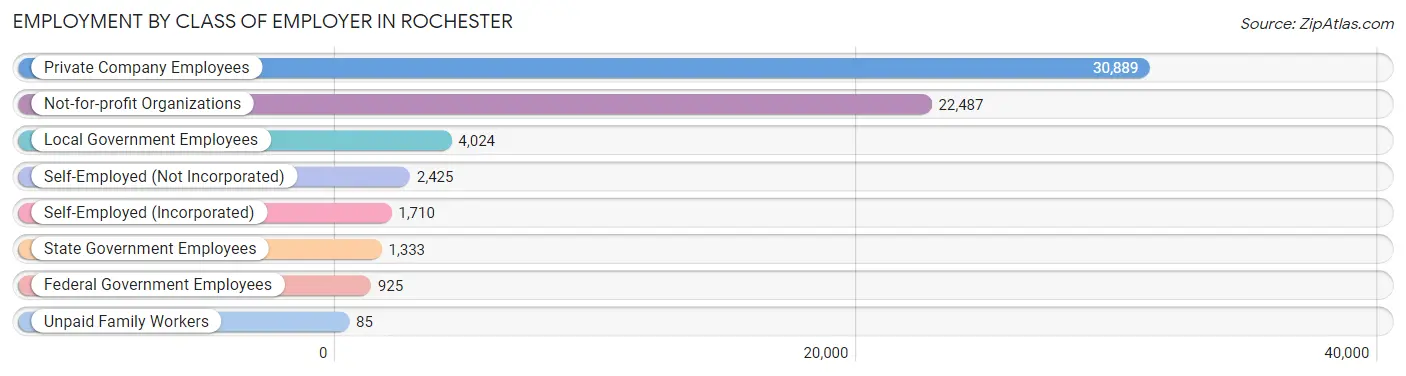
| Employer Class | # Employees | % Employees |
| Private Company Employees | 30,889 | 48.4% |
| Self-Employed (Incorporated) | 1,710 | 2.7% |
| Self-Employed (Not Incorporated) | 2,425 | 3.8% |
| Not-for-profit Organizations | 22,487 | 35.2% |
| Local Government Employees | 4,024 | 6.3% |
| State Government Employees | 1,333 | 2.1% |
| Federal Government Employees | 925 | 1.5% |
| Unpaid Family Workers | 85 | 0.1% |
| Total | 63,878 | 100.0% |
Employment Status by Age in Rochester
According to the labor force statistics for Rochester, out of the total population over 16 years of age (95,397), 70.9% or 67,636 individuals are in the labor force, with 3.7% or 2,503 of them unemployed. The age group with the highest labor force participation rate is 25 to 29 years, with 91.3% or 8,854 individuals in the labor force. Within the labor force, the 20 to 24 years age range has the highest percentage of unemployed individuals, with 8.1% or 571 of them being unemployed.
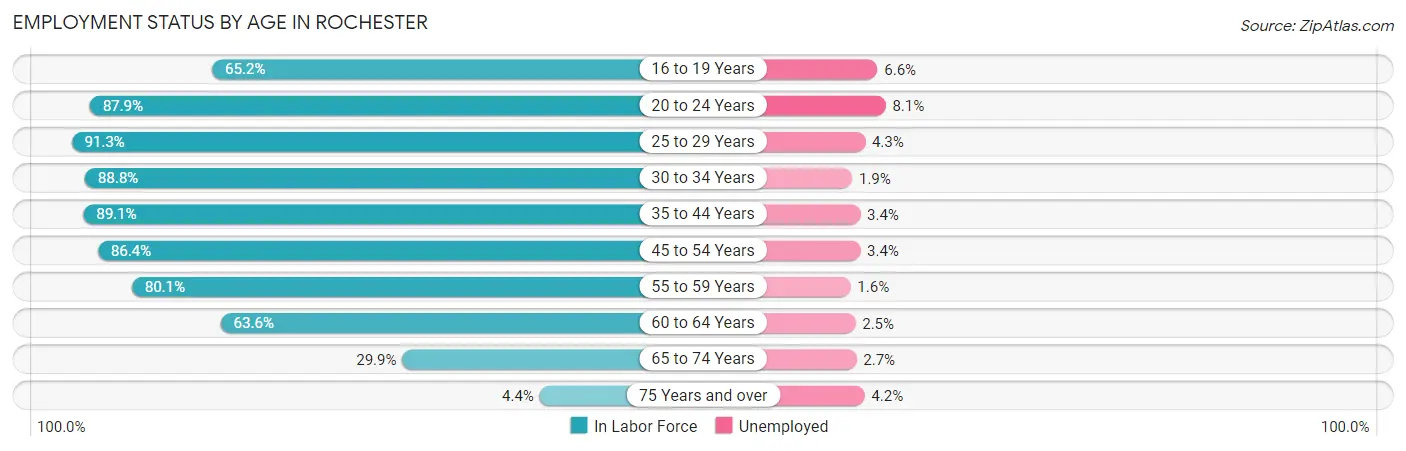
| Age Bracket | In Labor Force | Unemployed |
| 16 to 19 Years | 3,679 (65.2%) | 243 (6.6%) |
| 20 to 24 Years | 7,055 (87.9%) | 571 (8.1%) |
| 25 to 29 Years | 8,854 (91.3%) | 381 (4.3%) |
| 30 to 34 Years | 8,332 (88.8%) | 158 (1.9%) |
| 35 to 44 Years | 14,998 (89.1%) | 510 (3.4%) |
| 45 to 54 Years | 10,946 (86.4%) | 372 (3.4%) |
| 55 to 59 Years | 6,088 (80.1%) | 97 (1.6%) |
| 60 to 64 Years | 4,209 (63.6%) | 105 (2.5%) |
| 65 to 74 Years | 3,059 (29.9%) | 83 (2.7%) |
| 75 Years and over | 383 (4.4%) | 16 (4.2%) |
| Total | 67,636 (70.9%) | 2,503 (3.7%) |
Employment Status by Educational Attainment in Rochester
According to labor force statistics for Rochester, 85.1% of individuals (53,444) out of the total population between 25 and 64 years of age (62,801) are in the labor force, with 3.0% or 1,603 of them being unemployed. The group with the highest labor force participation rate are those with the educational attainment of bachelor's degree or higher, with 89.2% or 28,996 individuals in the labor force. Within the labor force, individuals with high school diploma education have the highest percentage of unemployment, with 5.8% or 465 of them being unemployed.
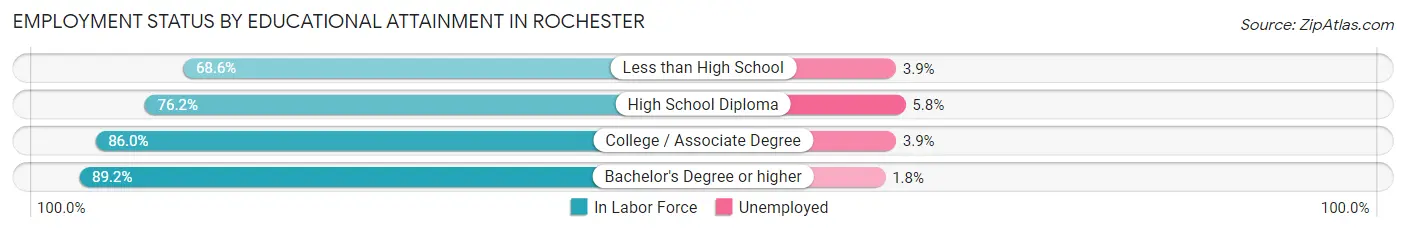
| Educational Attainment | In Labor Force | Unemployed |
| Less than High School | 2,386 (68.6%) | 136 (3.9%) |
| High School Diploma | 8,025 (76.2%) | 611 (5.8%) |
| College / Associate Degree | 14,004 (86.0%) | 635 (3.9%) |
| Bachelor's Degree or higher | 28,996 (89.2%) | 585 (1.8%) |
| Total | 53,444 (85.1%) | 1,884 (3.0%) |
Employment Occupations by Sex in Rochester
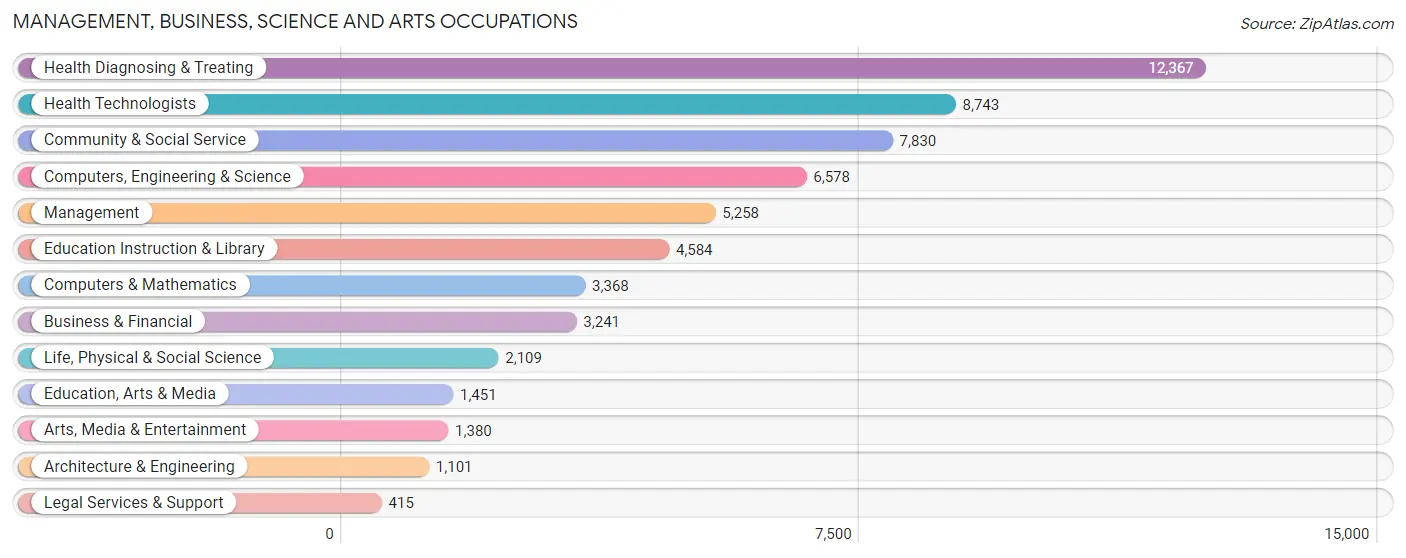
Management, Business, Science and Arts Occupations
The most common Management, Business, Science and Arts occupations in Rochester are Health Diagnosing & Treating (12,367 | 19.0%), Health Technologists (8,743 | 13.5%), Community & Social Service (7,830 | 12.0%), Computers, Engineering & Science (6,578 | 10.1%), and Management (5,258 | 8.1%).
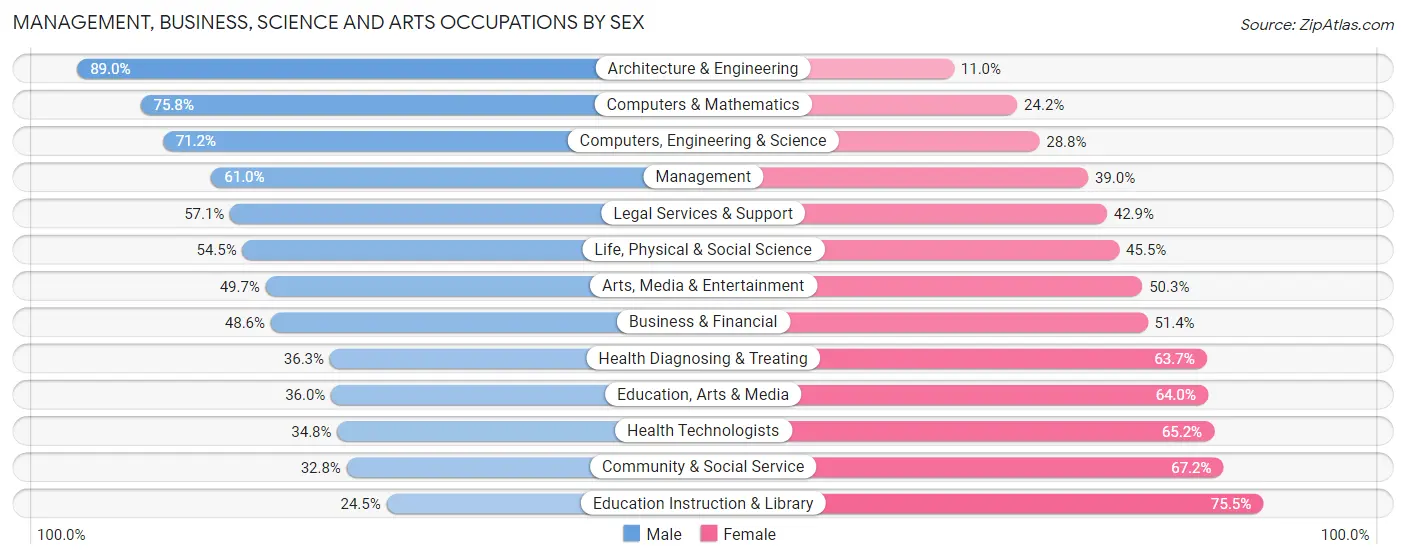
Management, Business, Science and Arts Occupations by Sex
Within the Management, Business, Science and Arts occupations in Rochester, the most male-oriented occupations are Architecture & Engineering (89.0%), Computers & Mathematics (75.8%), and Computers, Engineering & Science (71.2%), while the most female-oriented occupations are Education Instruction & Library (75.5%), Community & Social Service (67.2%), and Health Technologists (65.2%).
| Occupation | Male | Female |
| Management | 3,209 (61.0%) | 2,049 (39.0%) |
| Business & Financial | 1,576 (48.6%) | 1,665 (51.4%) |
| Computers, Engineering & Science | 4,683 (71.2%) | 1,895 (28.8%) |
| Computers & Mathematics | 2,553 (75.8%) | 815 (24.2%) |
| Architecture & Engineering | 980 (89.0%) | 121 (11.0%) |
| Life, Physical & Social Science | 1,150 (54.5%) | 959 (45.5%) |
| Community & Social Service | 2,569 (32.8%) | 5,261 (67.2%) |
| Education, Arts & Media | 523 (36.0%) | 928 (64.0%) |
| Legal Services & Support | 237 (57.1%) | 178 (42.9%) |
| Education Instruction & Library | 1,123 (24.5%) | 3,461 (75.5%) |
| Arts, Media & Entertainment | 686 (49.7%) | 694 (50.3%) |
| Health Diagnosing & Treating | 4,492 (36.3%) | 7,875 (63.7%) |
| Health Technologists | 3,039 (34.8%) | 5,704 (65.2%) |
| Total (Category) | 16,529 (46.9%) | 18,745 (53.1%) |
| Total (Overall) | 32,955 (50.7%) | 32,071 (49.3%) |
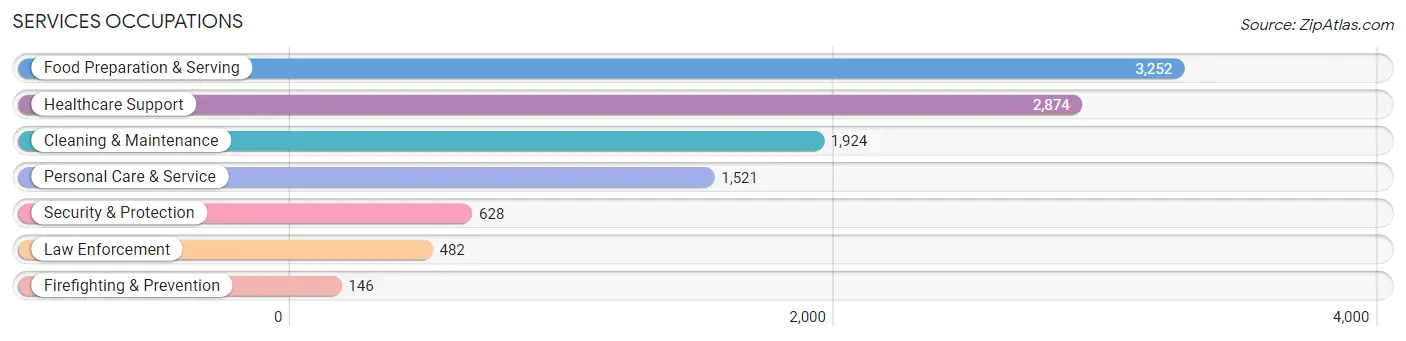
Services Occupations
The most common Services occupations in Rochester are Food Preparation & Serving (3,252 | 5.0%), Healthcare Support (2,874 | 4.4%), Cleaning & Maintenance (1,924 | 3.0%), Personal Care & Service (1,521 | 2.3%), and Security & Protection (628 | 1.0%).
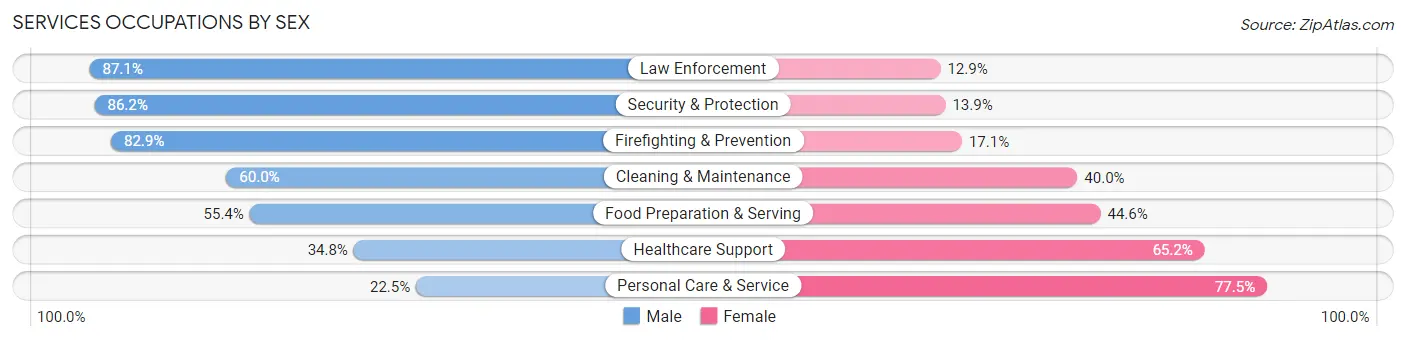
Services Occupations by Sex
Within the Services occupations in Rochester, the most male-oriented occupations are Law Enforcement (87.1%), Security & Protection (86.2%), and Firefighting & Prevention (82.9%), while the most female-oriented occupations are Personal Care & Service (77.5%), Healthcare Support (65.2%), and Food Preparation & Serving (44.6%).
| Occupation | Male | Female |
| Healthcare Support | 1,001 (34.8%) | 1,873 (65.2%) |
| Security & Protection | 541 (86.2%) | 87 (13.9%) |
| Firefighting & Prevention | 121 (82.9%) | 25 (17.1%) |
| Law Enforcement | 420 (87.1%) | 62 (12.9%) |
| Food Preparation & Serving | 1,803 (55.4%) | 1,449 (44.6%) |
| Cleaning & Maintenance | 1,155 (60.0%) | 769 (40.0%) |
| Personal Care & Service | 342 (22.5%) | 1,179 (77.5%) |
| Total (Category) | 4,842 (47.5%) | 5,357 (52.5%) |
| Total (Overall) | 32,955 (50.7%) | 32,071 (49.3%) |
Sales and Office Occupations
The most common Sales and Office occupations in Rochester are Office & Administration (5,576 | 8.6%), and Sales & Related (4,810 | 7.4%).
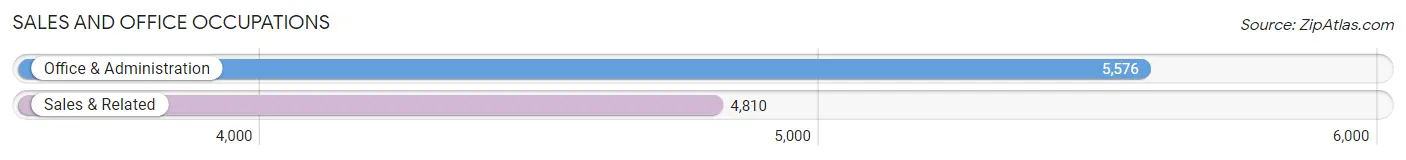
Sales and Office Occupations by Sex
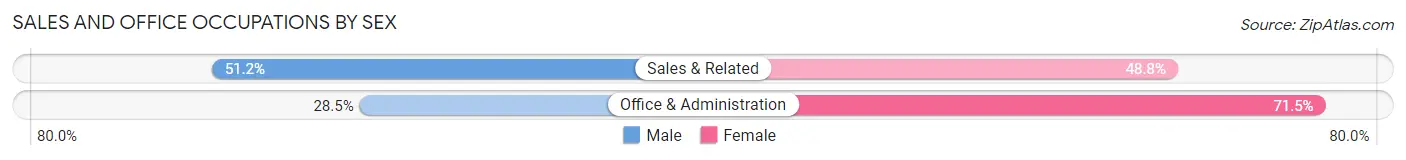
| Occupation | Male | Female |
| Sales & Related | 2,463 (51.2%) | 2,347 (48.8%) |
| Office & Administration | 1,588 (28.5%) | 3,988 (71.5%) |
| Total (Category) | 4,051 (39.0%) | 6,335 (61.0%) |
| Total (Overall) | 32,955 (50.7%) | 32,071 (49.3%) |
Natural Resources, Construction and Maintenance Occupations
The most common Natural Resources, Construction and Maintenance occupations in Rochester are Construction & Extraction (2,095 | 3.2%), Installation, Maintenance & Repair (1,158 | 1.8%), and Farming, Fishing & Forestry (117 | 0.2%).
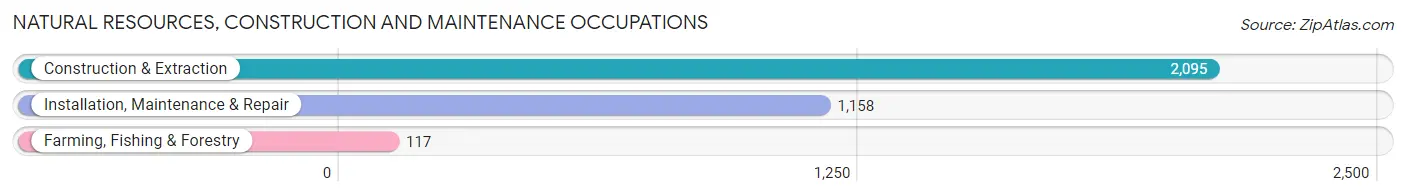
Natural Resources, Construction and Maintenance Occupations by Sex
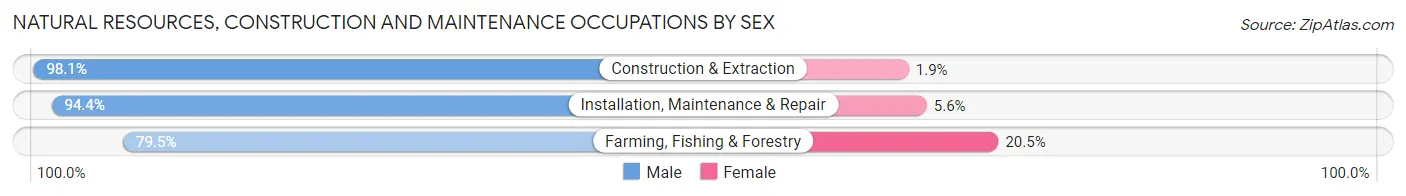
| Occupation | Male | Female |
| Farming, Fishing & Forestry | 93 (79.5%) | 24 (20.5%) |
| Construction & Extraction | 2,056 (98.1%) | 39 (1.9%) |
| Installation, Maintenance & Repair | 1,093 (94.4%) | 65 (5.6%) |
| Total (Category) | 3,242 (96.2%) | 128 (3.8%) |
| Total (Overall) | 32,955 (50.7%) | 32,071 (49.3%) |
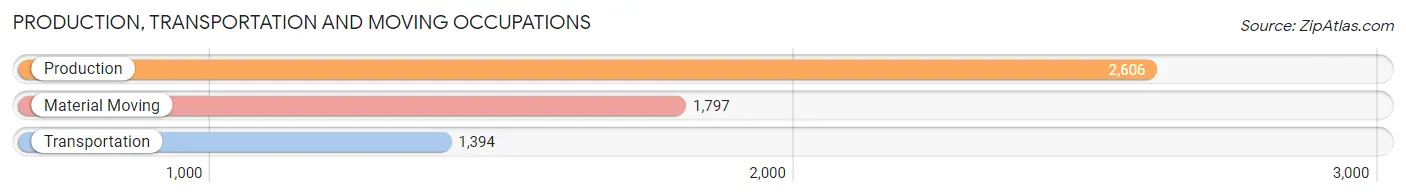
Production, Transportation and Moving Occupations
The most common Production, Transportation and Moving occupations in Rochester are Production (2,606 | 4.0%), Material Moving (1,797 | 2.8%), and Transportation (1,394 | 2.1%).
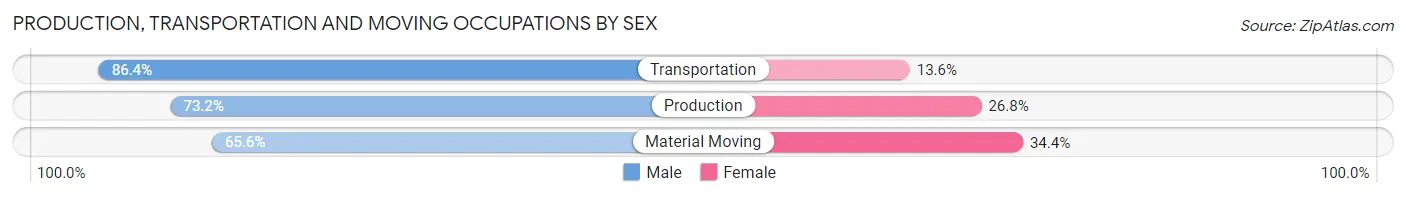
Production, Transportation and Moving Occupations by Sex
| Occupation | Male | Female |
| Production | 1,908 (73.2%) | 698 (26.8%) |
| Transportation | 1,204 (86.4%) | 190 (13.6%) |
| Material Moving | 1,179 (65.6%) | 618 (34.4%) |
| Total (Category) | 4,291 (74.0%) | 1,506 (26.0%) |
| Total (Overall) | 32,955 (50.7%) | 32,071 (49.3%) |
Employment Industries by Sex in Rochester
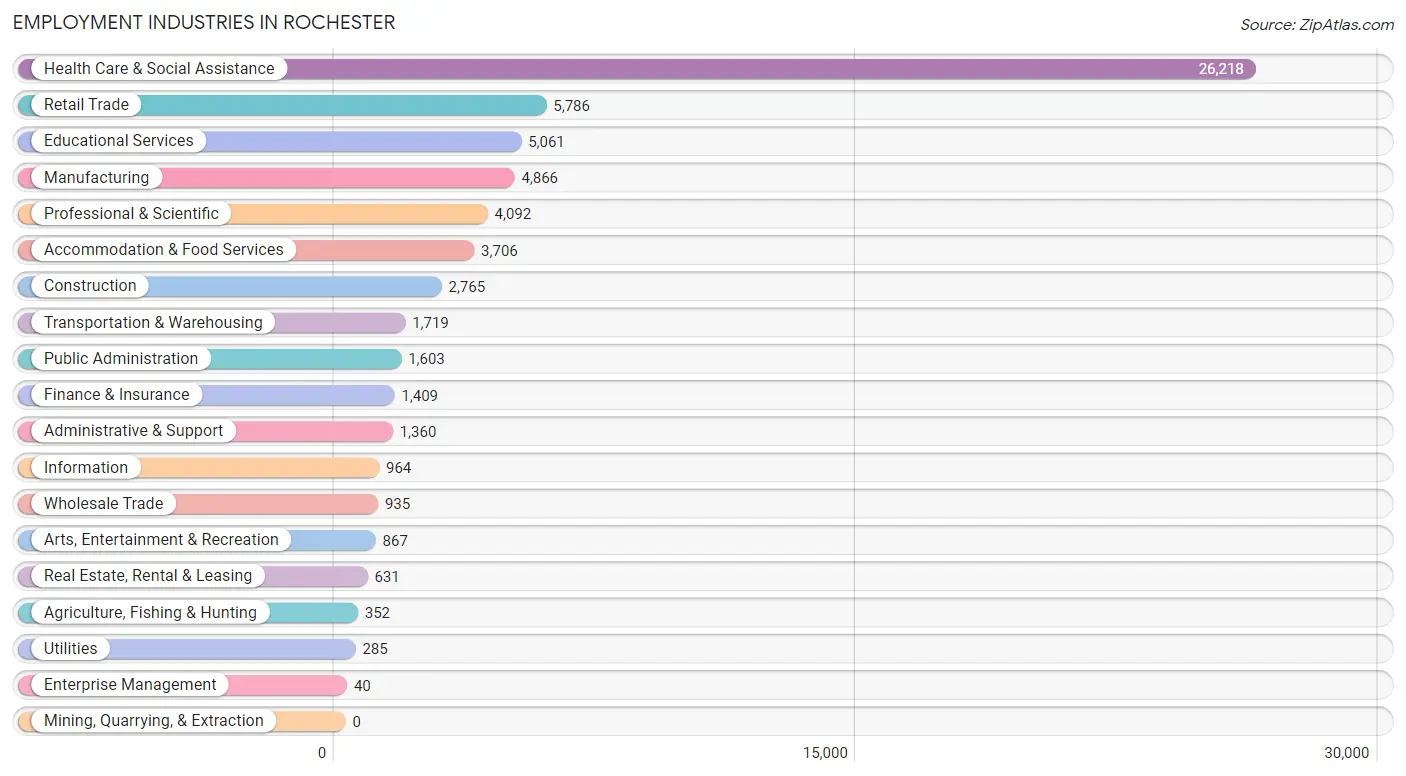
Employment Industries in Rochester
The major employment industries in Rochester include Health Care & Social Assistance (26,218 | 40.3%), Retail Trade (5,786 | 8.9%), Educational Services (5,061 | 7.8%), Manufacturing (4,866 | 7.5%), and Professional & Scientific (4,092 | 6.3%).
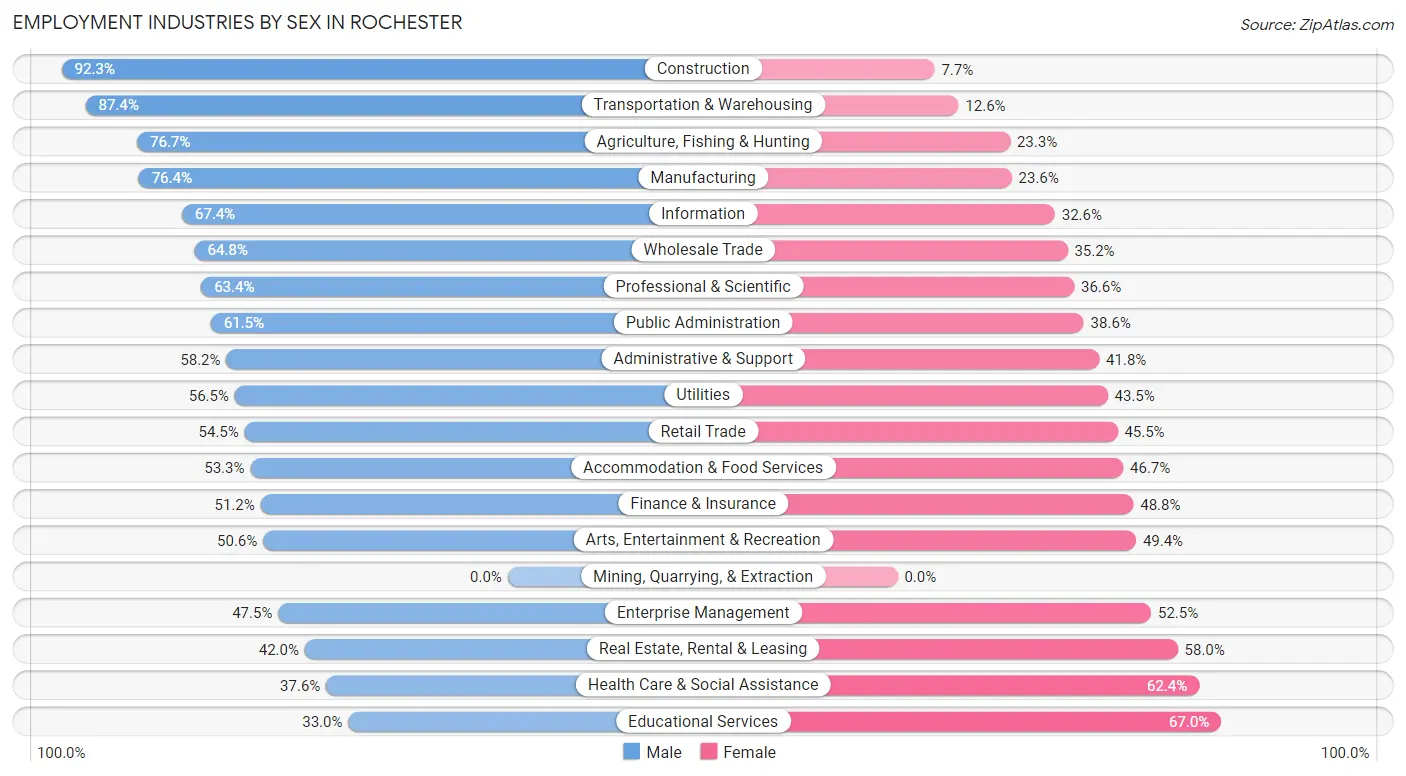
Employment Industries by Sex in Rochester
The Rochester industries that see more men than women are Construction (92.3%), Transportation & Warehousing (87.4%), and Agriculture, Fishing & Hunting (76.7%), whereas the industries that tend to have a higher number of women are Educational Services (67.0%), Health Care & Social Assistance (62.4%), and Real Estate, Rental & Leasing (58.0%).
| Industry | Male | Female |
| Agriculture, Fishing & Hunting | 270 (76.7%) | 82 (23.3%) |
| Mining, Quarrying, & Extraction | 0 (0.0%) | 0 (0.0%) |
| Construction | 2,553 (92.3%) | 212 (7.7%) |
| Manufacturing | 3,716 (76.4%) | 1,150 (23.6%) |
| Wholesale Trade | 606 (64.8%) | 329 (35.2%) |
| Retail Trade | 3,151 (54.5%) | 2,635 (45.5%) |
| Transportation & Warehousing | 1,502 (87.4%) | 217 (12.6%) |
| Utilities | 161 (56.5%) | 124 (43.5%) |
| Information | 650 (67.4%) | 314 (32.6%) |
| Finance & Insurance | 721 (51.2%) | 688 (48.8%) |
| Real Estate, Rental & Leasing | 265 (42.0%) | 366 (58.0%) |
| Professional & Scientific | 2,596 (63.4%) | 1,496 (36.6%) |
| Enterprise Management | 19 (47.5%) | 21 (52.5%) |
| Administrative & Support | 792 (58.2%) | 568 (41.8%) |
| Educational Services | 1,670 (33.0%) | 3,391 (67.0%) |
| Health Care & Social Assistance | 9,852 (37.6%) | 16,366 (62.4%) |
| Arts, Entertainment & Recreation | 439 (50.6%) | 428 (49.4%) |
| Accommodation & Food Services | 1,975 (53.3%) | 1,731 (46.7%) |
| Public Administration | 985 (61.5%) | 618 (38.6%) |
| Total | 32,955 (50.7%) | 32,071 (49.3%) |
Education in Rochester
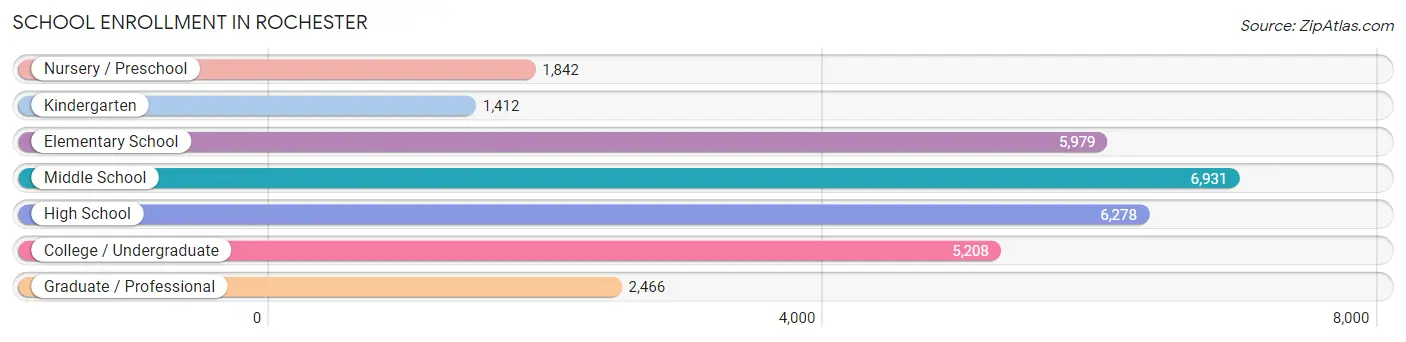
School Enrollment in Rochester
The most common levels of schooling among the 30,116 students in Rochester are middle school (6,931 | 23.0%), high school (6,278 | 20.8%), and elementary school (5,979 | 19.9%).
| School Level | # Students | % Students |
| Nursery / Preschool | 1,842 | 6.1% |
| Kindergarten | 1,412 | 4.7% |
| Elementary School | 5,979 | 19.9% |
| Middle School | 6,931 | 23.0% |
| High School | 6,278 | 20.8% |
| College / Undergraduate | 5,208 | 17.3% |
| Graduate / Professional | 2,466 | 8.2% |
| Total | 30,116 | 100.0% |
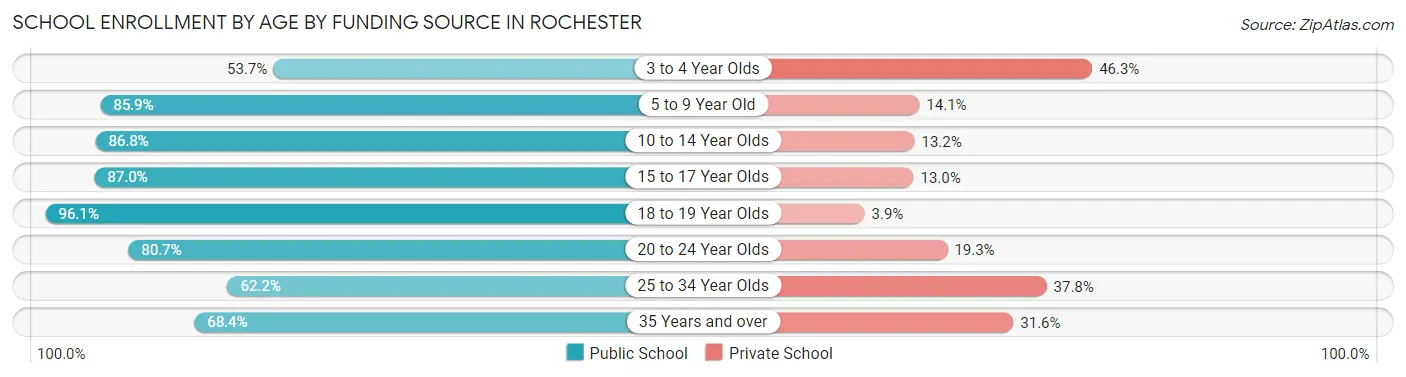
School Enrollment by Age by Funding Source in Rochester
Out of a total of 30,116 students who are enrolled in schools in Rochester, 5,541 (18.4%) attend a private institution, while the remaining 24,575 (81.6%) are enrolled in public schools. The age group of 3 to 4 year olds has the highest likelihood of being enrolled in private schools, with 668 (46.3% in the age bracket) enrolled. Conversely, the age group of 18 to 19 year olds has the lowest likelihood of being enrolled in a private school, with 1,526 (96.1% in the age bracket) attending a public institution.
| Age Bracket | Public School | Private School |
| 3 to 4 Year Olds | 775 (53.7%) | 668 (46.3%) |
| 5 to 9 Year Old | 6,125 (85.9%) | 1,006 (14.1%) |
| 10 to 14 Year Olds | 6,837 (86.8%) | 1,040 (13.2%) |
| 15 to 17 Year Olds | 3,964 (87.0%) | 593 (13.0%) |
| 18 to 19 Year Olds | 1,526 (96.1%) | 62 (3.9%) |
| 20 to 24 Year Olds | 2,541 (80.7%) | 609 (19.3%) |
| 25 to 34 Year Olds | 1,685 (62.2%) | 1,024 (37.8%) |
| 35 Years and over | 1,136 (68.4%) | 525 (31.6%) |
| Total | 24,575 (81.6%) | 5,541 (18.4%) |
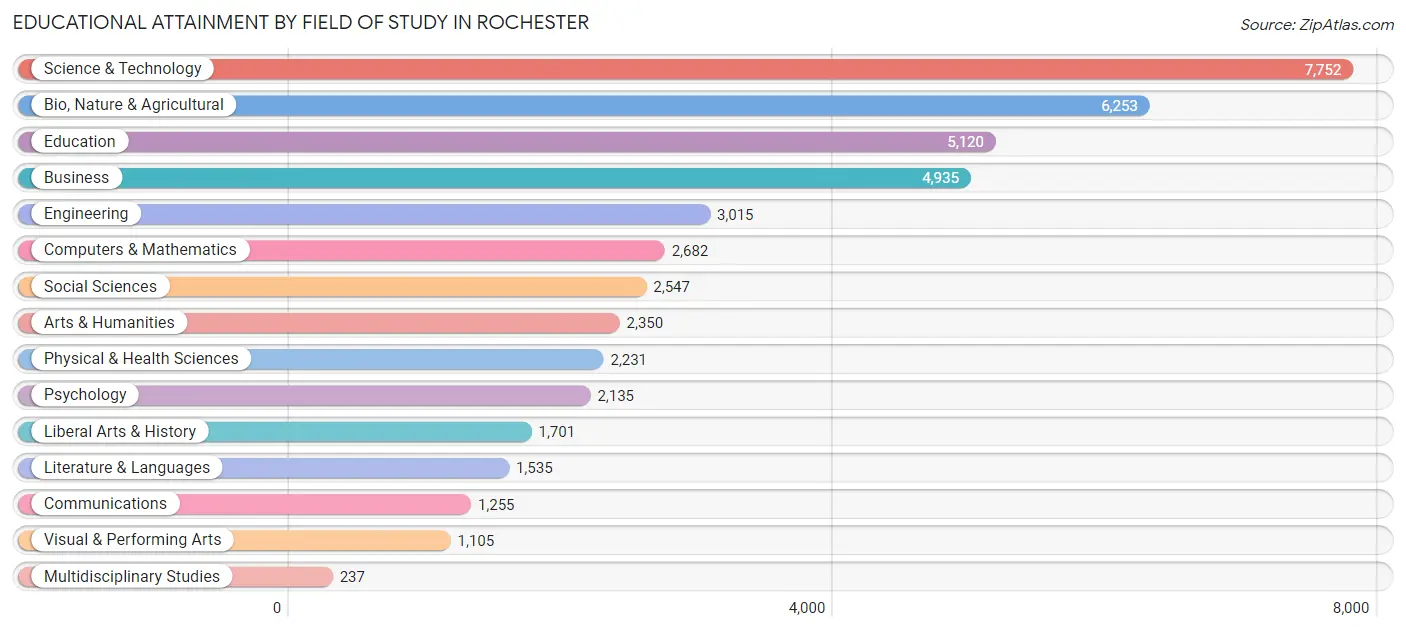
Educational Attainment by Field of Study in Rochester
Science & technology (7,752 | 17.3%), bio, nature & agricultural (6,253 | 13.9%), education (5,120 | 11.4%), business (4,935 | 11.0%), and engineering (3,015 | 6.7%) are the most common fields of study among 44,853 individuals in Rochester who have obtained a bachelor's degree or higher.
| Field of Study | # Graduates | % Graduates |
| Computers & Mathematics | 2,682 | 6.0% |
| Bio, Nature & Agricultural | 6,253 | 13.9% |
| Physical & Health Sciences | 2,231 | 5.0% |
| Psychology | 2,135 | 4.8% |
| Social Sciences | 2,547 | 5.7% |
| Engineering | 3,015 | 6.7% |
| Multidisciplinary Studies | 237 | 0.5% |
| Science & Technology | 7,752 | 17.3% |
| Business | 4,935 | 11.0% |
| Education | 5,120 | 11.4% |
| Literature & Languages | 1,535 | 3.4% |
| Liberal Arts & History | 1,701 | 3.8% |
| Visual & Performing Arts | 1,105 | 2.5% |
| Communications | 1,255 | 2.8% |
| Arts & Humanities | 2,350 | 5.2% |
| Total | 44,853 | 100.0% |
Transportation & Commute in Rochester
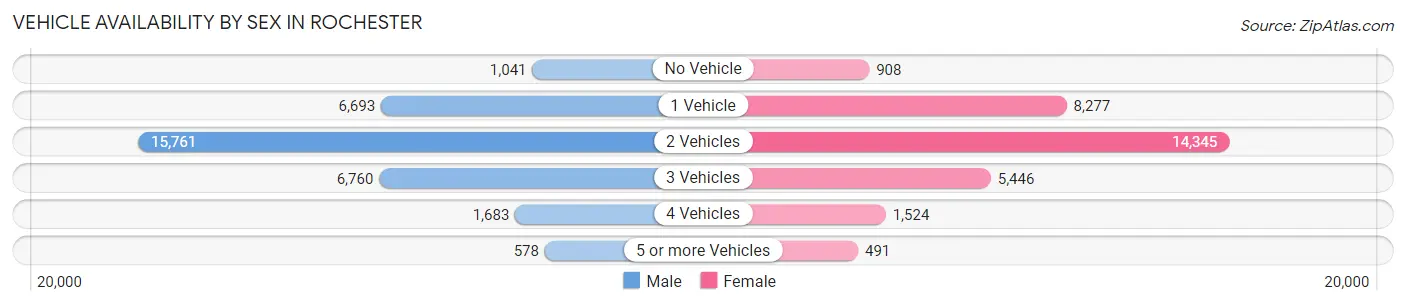
Vehicle Availability by Sex in Rochester
The most prevalent vehicle ownership categories in Rochester are males with 2 vehicles (15,761, accounting for 48.5%) and females with 2 vehicles (14,345, making up 50.9%).
| Vehicles Available | Male | Female |
| No Vehicle | 1,041 (3.2%) | 908 (2.9%) |
| 1 Vehicle | 6,693 (20.6%) | 8,277 (26.7%) |
| 2 Vehicles | 15,761 (48.5%) | 14,345 (46.3%) |
| 3 Vehicles | 6,760 (20.8%) | 5,446 (17.6%) |
| 4 Vehicles | 1,683 (5.2%) | 1,524 (4.9%) |
| 5 or more Vehicles | 578 (1.8%) | 491 (1.6%) |
| Total | 32,516 (100.0%) | 30,991 (100.0%) |
Commute Time in Rochester
The most frequently occuring commute durations in Rochester are 15 to 19 minutes (15,728 commuters, 27.5%), 10 to 14 minutes (15,600 commuters, 27.3%), and 5 to 9 minutes (8,812 commuters, 15.4%).
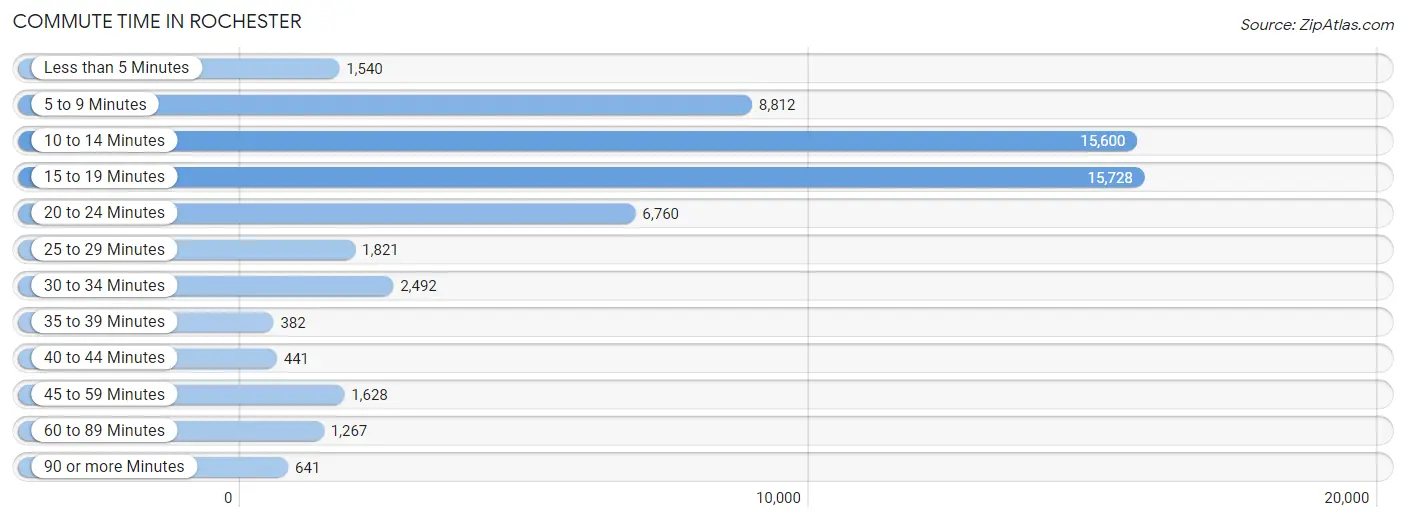
| Commute Time | # Commuters | % Commuters |
| Less than 5 Minutes | 1,540 | 2.7% |
| 5 to 9 Minutes | 8,812 | 15.4% |
| 10 to 14 Minutes | 15,600 | 27.3% |
| 15 to 19 Minutes | 15,728 | 27.5% |
| 20 to 24 Minutes | 6,760 | 11.8% |
| 25 to 29 Minutes | 1,821 | 3.2% |
| 30 to 34 Minutes | 2,492 | 4.4% |
| 35 to 39 Minutes | 382 | 0.7% |
| 40 to 44 Minutes | 441 | 0.8% |
| 45 to 59 Minutes | 1,628 | 2.9% |
| 60 to 89 Minutes | 1,267 | 2.2% |
| 90 or more Minutes | 641 | 1.1% |
Commute Time by Sex in Rochester
The most common commute times in Rochester are 10 to 14 minutes (7,799 commuters, 26.4%) for males and 15 to 19 minutes (8,127 commuters, 29.5%) for females.
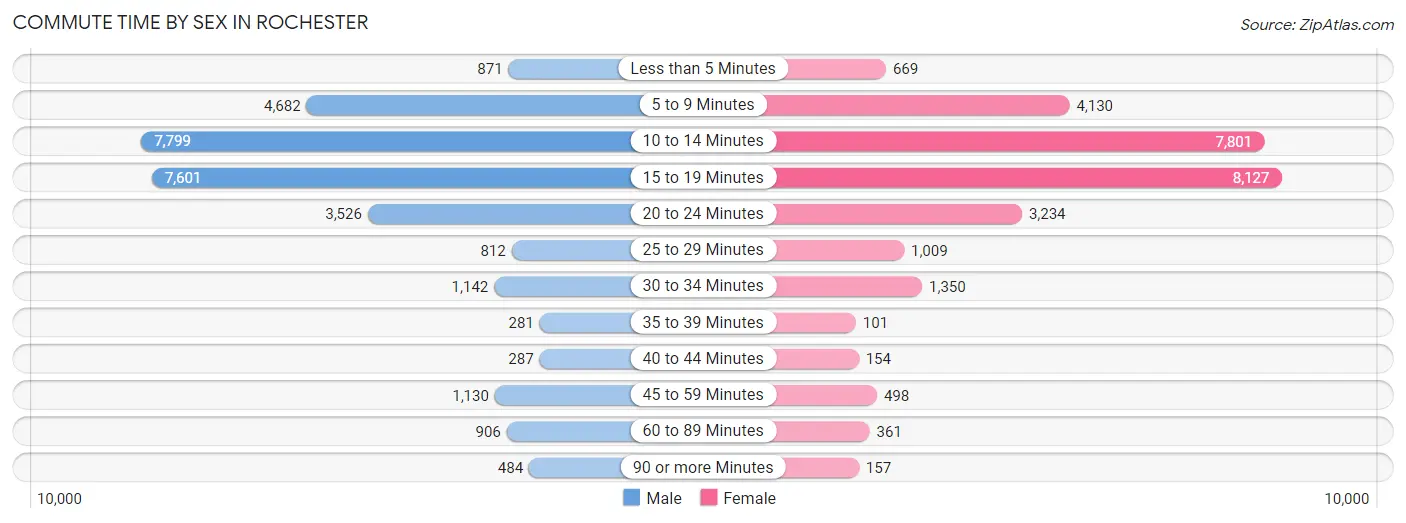
| Commute Time | Male | Female |
| Less than 5 Minutes | 871 (2.9%) | 669 (2.4%) |
| 5 to 9 Minutes | 4,682 (15.9%) | 4,130 (15.0%) |
| 10 to 14 Minutes | 7,799 (26.4%) | 7,801 (28.3%) |
| 15 to 19 Minutes | 7,601 (25.8%) | 8,127 (29.5%) |
| 20 to 24 Minutes | 3,526 (11.9%) | 3,234 (11.7%) |
| 25 to 29 Minutes | 812 (2.8%) | 1,009 (3.7%) |
| 30 to 34 Minutes | 1,142 (3.9%) | 1,350 (4.9%) |
| 35 to 39 Minutes | 281 (0.9%) | 101 (0.4%) |
| 40 to 44 Minutes | 287 (1.0%) | 154 (0.6%) |
| 45 to 59 Minutes | 1,130 (3.8%) | 498 (1.8%) |
| 60 to 89 Minutes | 906 (3.1%) | 361 (1.3%) |
| 90 or more Minutes | 484 (1.6%) | 157 (0.6%) |
Time of Departure to Work by Sex in Rochester
The most frequent times of departure to work in Rochester are 7:00 AM to 7:29 AM (4,859, 16.5%) for males and 7:00 AM to 7:29 AM (4,747, 17.2%) for females.
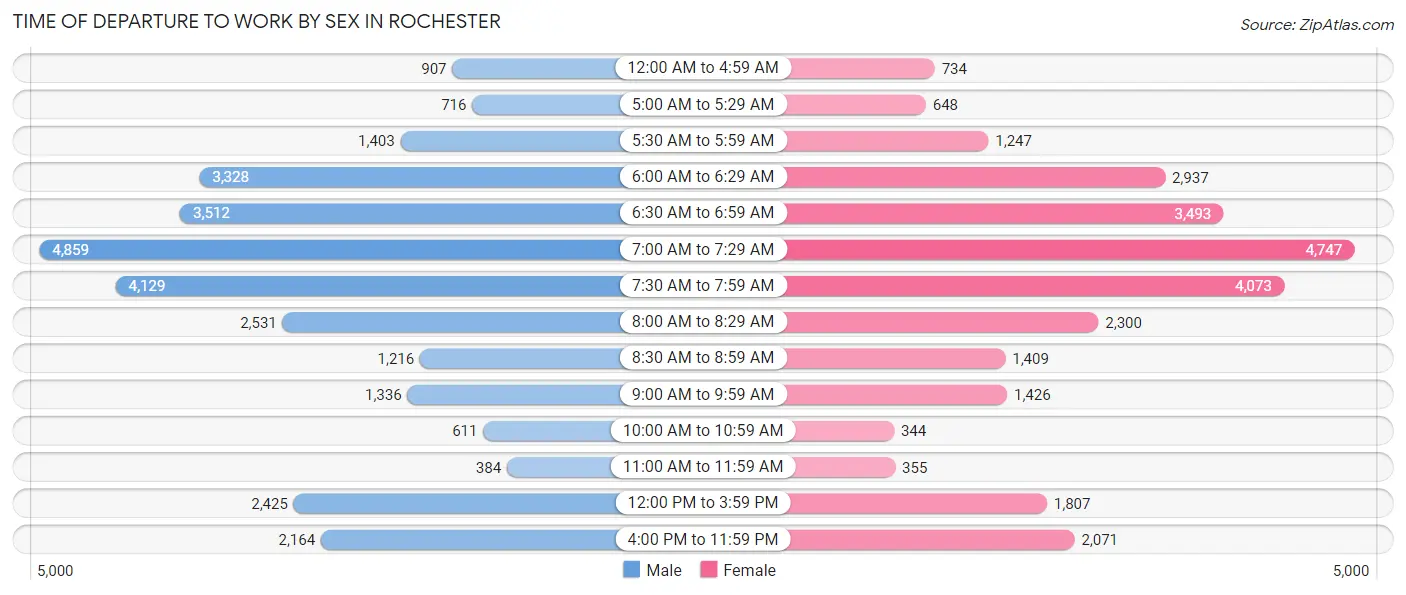
| Time of Departure | Male | Female |
| 12:00 AM to 4:59 AM | 907 (3.1%) | 734 (2.7%) |
| 5:00 AM to 5:29 AM | 716 (2.4%) | 648 (2.4%) |
| 5:30 AM to 5:59 AM | 1,403 (4.8%) | 1,247 (4.5%) |
| 6:00 AM to 6:29 AM | 3,328 (11.3%) | 2,937 (10.6%) |
| 6:30 AM to 6:59 AM | 3,512 (11.9%) | 3,493 (12.7%) |
| 7:00 AM to 7:29 AM | 4,859 (16.5%) | 4,747 (17.2%) |
| 7:30 AM to 7:59 AM | 4,129 (14.0%) | 4,073 (14.8%) |
| 8:00 AM to 8:29 AM | 2,531 (8.6%) | 2,300 (8.3%) |
| 8:30 AM to 8:59 AM | 1,216 (4.1%) | 1,409 (5.1%) |
| 9:00 AM to 9:59 AM | 1,336 (4.5%) | 1,426 (5.2%) |
| 10:00 AM to 10:59 AM | 611 (2.1%) | 344 (1.3%) |
| 11:00 AM to 11:59 AM | 384 (1.3%) | 355 (1.3%) |
| 12:00 PM to 3:59 PM | 2,425 (8.2%) | 1,807 (6.6%) |
| 4:00 PM to 11:59 PM | 2,164 (7.3%) | 2,071 (7.5%) |
| Total | 29,521 (100.0%) | 27,591 (100.0%) |
Housing Occupancy in Rochester
Occupancy by Ownership in Rochester
Of the total 50,236 dwellings in Rochester, owner-occupied units account for 32,880 (65.4%), while renter-occupied units make up 17,356 (34.5%).
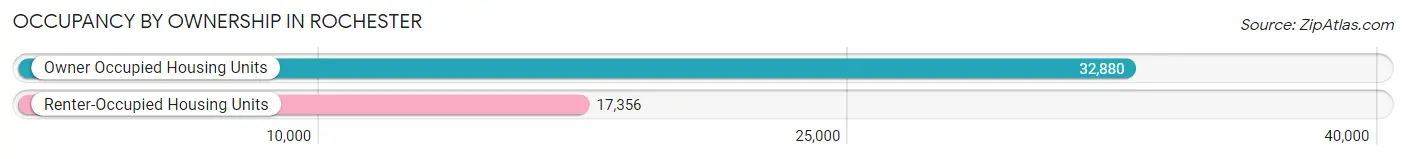
| Occupancy | # Housing Units | % Housing Units |
| Owner Occupied Housing Units | 32,880 | 65.4% |
| Renter-Occupied Housing Units | 17,356 | 34.5% |
| Total Occupied Housing Units | 50,236 | 100.0% |
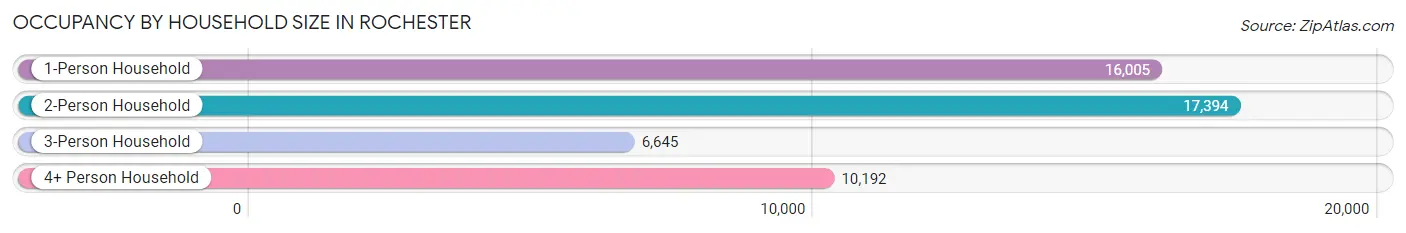
Occupancy by Household Size in Rochester
| Household Size | # Housing Units | % Housing Units |
| 1-Person Household | 16,005 | 31.9% |
| 2-Person Household | 17,394 | 34.6% |
| 3-Person Household | 6,645 | 13.2% |
| 4+ Person Household | 10,192 | 20.3% |
| Total Housing Units | 50,236 | 100.0% |
Occupancy by Ownership by Household Size in Rochester
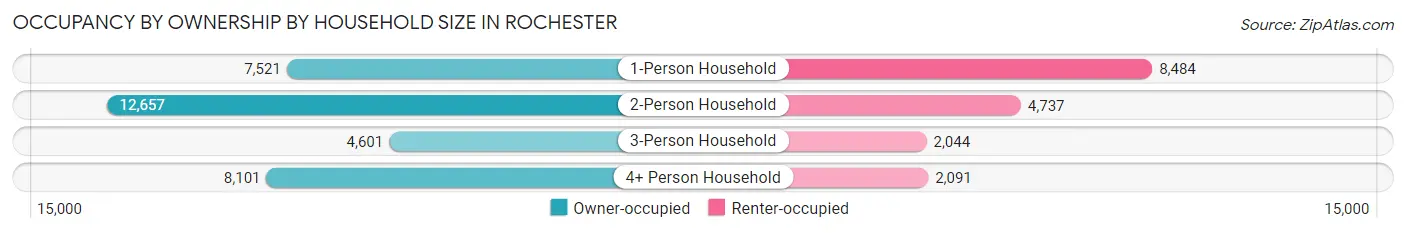
| Household Size | Owner-occupied | Renter-occupied |
| 1-Person Household | 7,521 (47.0%) | 8,484 (53.0%) |
| 2-Person Household | 12,657 (72.8%) | 4,737 (27.2%) |
| 3-Person Household | 4,601 (69.2%) | 2,044 (30.8%) |
| 4+ Person Household | 8,101 (79.5%) | 2,091 (20.5%) |
| Total Housing Units | 32,880 (65.4%) | 17,356 (34.5%) |
Occupancy by Educational Attainment in Rochester
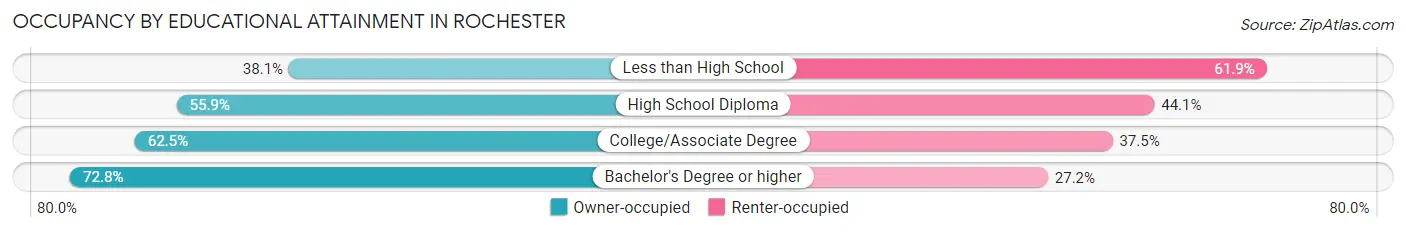
| Household Size | Owner-occupied | Renter-occupied |
| Less than High School | 923 (38.1%) | 1,501 (61.9%) |
| High School Diploma | 4,632 (55.9%) | 3,657 (44.1%) |
| College/Associate Degree | 8,762 (62.5%) | 5,252 (37.5%) |
| Bachelor's Degree or higher | 18,563 (72.8%) | 6,946 (27.2%) |
Occupancy by Age of Householder in Rochester
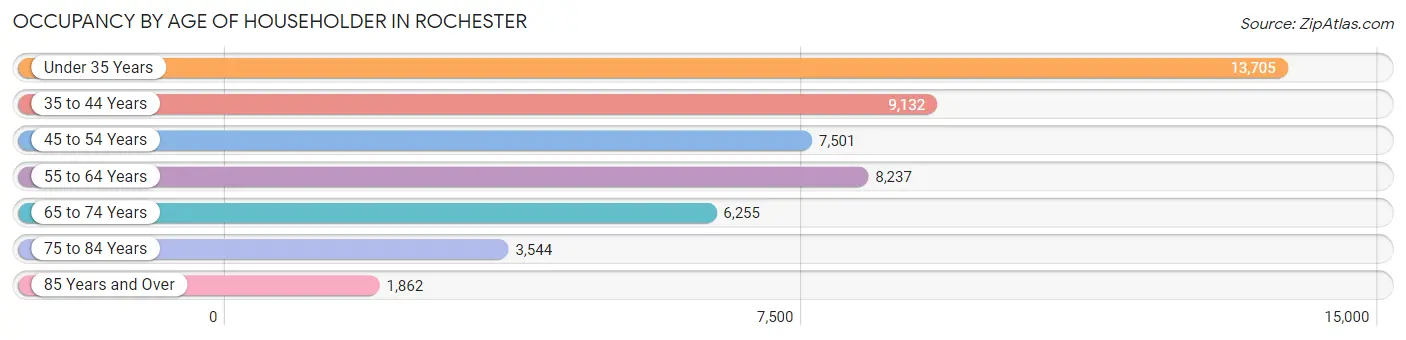
| Age Bracket | # Households | % Households |
| Under 35 Years | 13,705 | 27.3% |
| 35 to 44 Years | 9,132 | 18.2% |
| 45 to 54 Years | 7,501 | 14.9% |
| 55 to 64 Years | 8,237 | 16.4% |
| 65 to 74 Years | 6,255 | 12.4% |
| 75 to 84 Years | 3,544 | 7.0% |
| 85 Years and Over | 1,862 | 3.7% |
| Total | 50,236 | 100.0% |
Housing Finances in Rochester
Median Income by Occupancy in Rochester
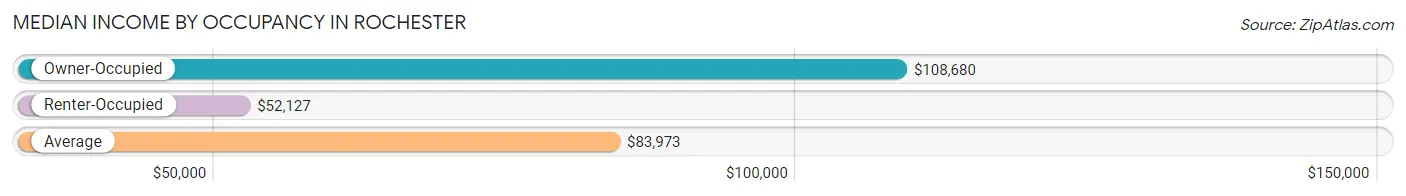
| Occupancy Type | # Households | Median Income |
| Owner-Occupied | 32,880 (65.4%) | $108,680 |
| Renter-Occupied | 17,356 (34.5%) | $52,127 |
| Average | 50,236 (100.0%) | $83,973 |
Occupancy by Householder Income Bracket in Rochester
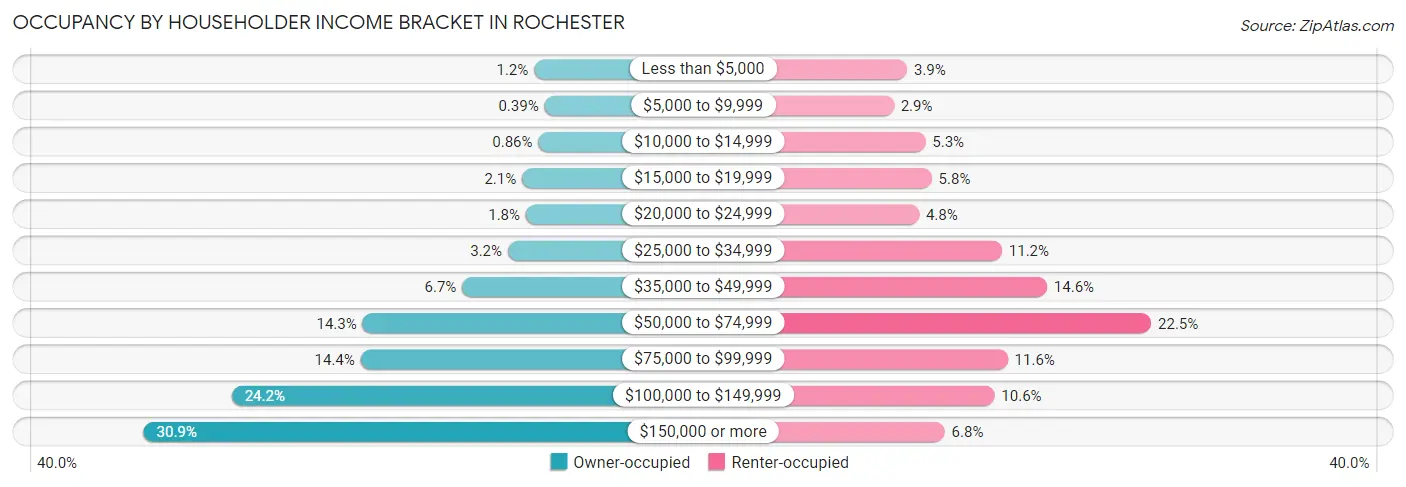
| Income Bracket | Owner-occupied | Renter-occupied |
| Less than $5,000 | 389 (1.2%) | 680 (3.9%) |
| $5,000 to $9,999 | 128 (0.4%) | 505 (2.9%) |
| $10,000 to $14,999 | 284 (0.9%) | 924 (5.3%) |
| $15,000 to $19,999 | 691 (2.1%) | 1,006 (5.8%) |
| $20,000 to $24,999 | 594 (1.8%) | 839 (4.8%) |
| $25,000 to $34,999 | 1,047 (3.2%) | 1,936 (11.2%) |
| $35,000 to $49,999 | 2,191 (6.7%) | 2,531 (14.6%) |
| $50,000 to $74,999 | 4,686 (14.2%) | 3,908 (22.5%) |
| $75,000 to $99,999 | 4,736 (14.4%) | 2,012 (11.6%) |
| $100,000 to $149,999 | 7,965 (24.2%) | 1,837 (10.6%) |
| $150,000 or more | 10,169 (30.9%) | 1,178 (6.8%) |
| Total | 32,880 (100.0%) | 17,356 (100.0%) |
Monthly Housing Cost Tiers in Rochester
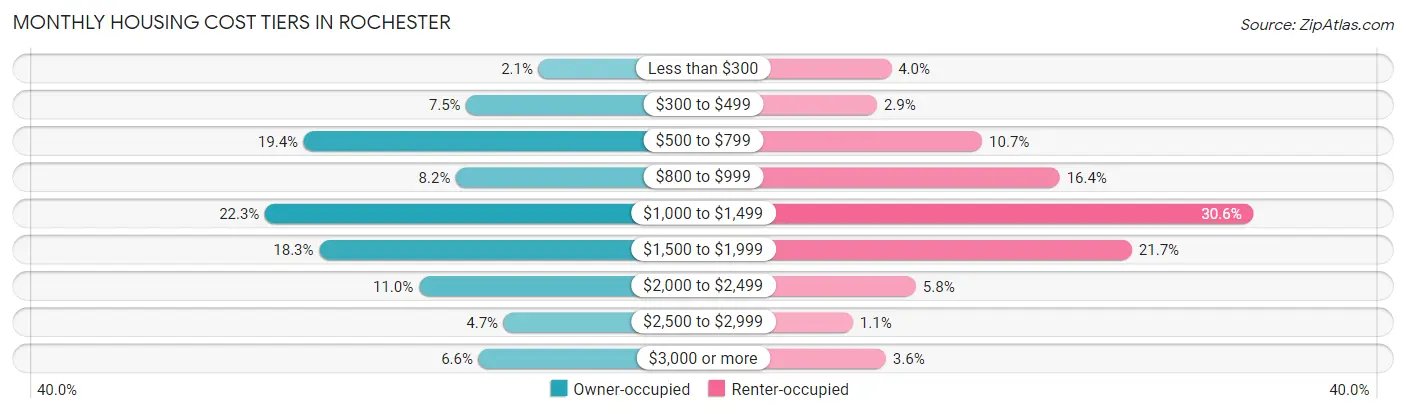
| Monthly Cost | Owner-occupied | Renter-occupied |
| Less than $300 | 701 (2.1%) | 688 (4.0%) |
| $300 to $499 | 2,454 (7.5%) | 505 (2.9%) |
| $500 to $799 | 6,390 (19.4%) | 1,851 (10.7%) |
| $800 to $999 | 2,699 (8.2%) | 2,841 (16.4%) |
| $1,000 to $1,499 | 7,326 (22.3%) | 5,318 (30.6%) |
| $1,500 to $1,999 | 6,014 (18.3%) | 3,765 (21.7%) |
| $2,000 to $2,499 | 3,599 (11.0%) | 1,004 (5.8%) |
| $2,500 to $2,999 | 1,544 (4.7%) | 197 (1.1%) |
| $3,000 or more | 2,153 (6.6%) | 620 (3.6%) |
| Total | 32,880 (100.0%) | 17,356 (100.0%) |
Physical Housing Characteristics in Rochester
Housing Structures in Rochester
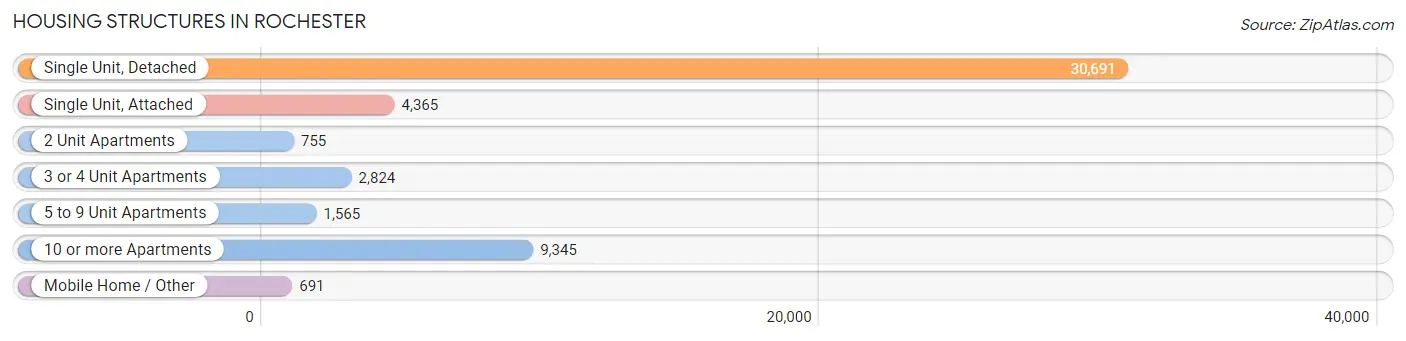
| Structure Type | # Housing Units | % Housing Units |
| Single Unit, Detached | 30,691 | 61.1% |
| Single Unit, Attached | 4,365 | 8.7% |
| 2 Unit Apartments | 755 | 1.5% |
| 3 or 4 Unit Apartments | 2,824 | 5.6% |
| 5 to 9 Unit Apartments | 1,565 | 3.1% |
| 10 or more Apartments | 9,345 | 18.6% |
| Mobile Home / Other | 691 | 1.4% |
| Total | 50,236 | 100.0% |
Housing Structures by Occupancy in Rochester
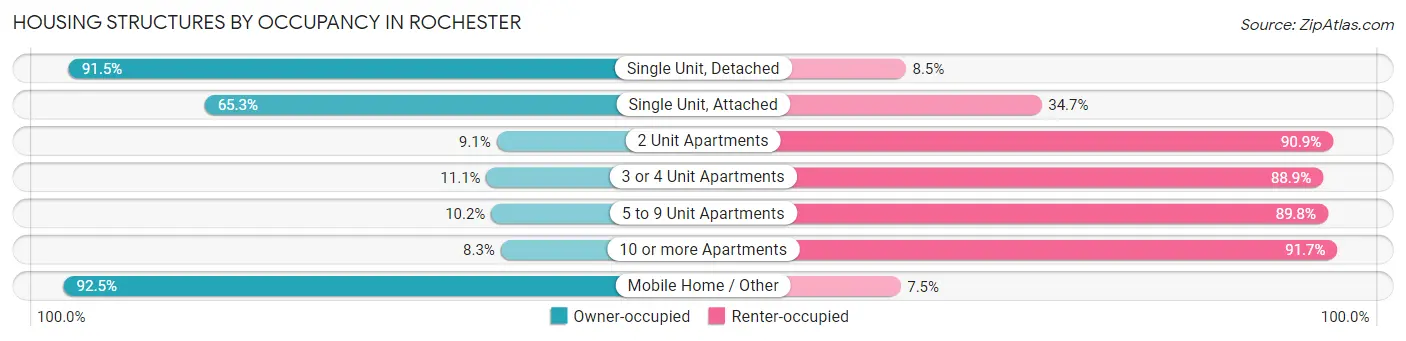
| Structure Type | Owner-occupied | Renter-occupied |
| Single Unit, Detached | 28,071 (91.5%) | 2,620 (8.5%) |
| Single Unit, Attached | 2,851 (65.3%) | 1,514 (34.7%) |
| 2 Unit Apartments | 69 (9.1%) | 686 (90.9%) |
| 3 or 4 Unit Apartments | 313 (11.1%) | 2,511 (88.9%) |
| 5 to 9 Unit Apartments | 159 (10.2%) | 1,406 (89.8%) |
| 10 or more Apartments | 778 (8.3%) | 8,567 (91.7%) |
| Mobile Home / Other | 639 (92.5%) | 52 (7.5%) |
| Total | 32,880 (65.4%) | 17,356 (34.5%) |
Housing Structures by Number of Rooms in Rochester
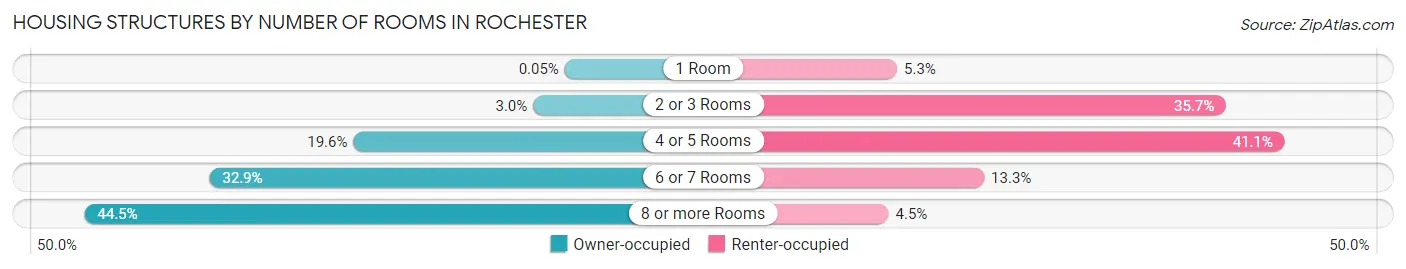
| Number of Rooms | Owner-occupied | Renter-occupied |
| 1 Room | 18 (0.1%) | 919 (5.3%) |
| 2 or 3 Rooms | 976 (3.0%) | 6,200 (35.7%) |
| 4 or 5 Rooms | 6,444 (19.6%) | 7,141 (41.1%) |
| 6 or 7 Rooms | 10,820 (32.9%) | 2,315 (13.3%) |
| 8 or more Rooms | 14,622 (44.5%) | 781 (4.5%) |
| Total | 32,880 (100.0%) | 17,356 (100.0%) |
Housing Structure by Heating Type in Rochester
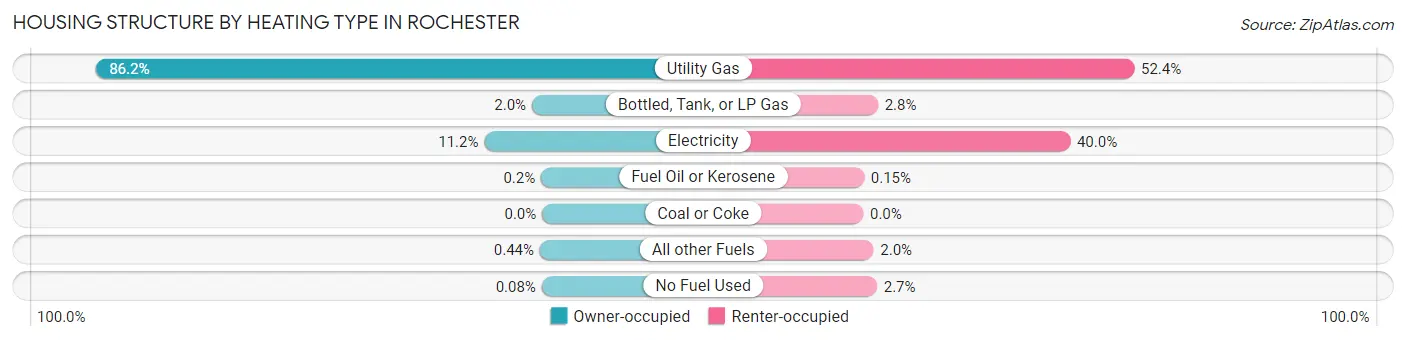
| Heating Type | Owner-occupied | Renter-occupied |
| Utility Gas | 28,325 (86.2%) | 9,088 (52.4%) |
| Bottled, Tank, or LP Gas | 648 (2.0%) | 493 (2.8%) |
| Electricity | 3,672 (11.2%) | 6,941 (40.0%) |
| Fuel Oil or Kerosene | 65 (0.2%) | 26 (0.2%) |
| Coal or Coke | 0 (0.0%) | 0 (0.0%) |
| All other Fuels | 144 (0.4%) | 346 (2.0%) |
| No Fuel Used | 26 (0.1%) | 462 (2.7%) |
| Total | 32,880 (100.0%) | 17,356 (100.0%) |
Household Vehicle Usage in Rochester
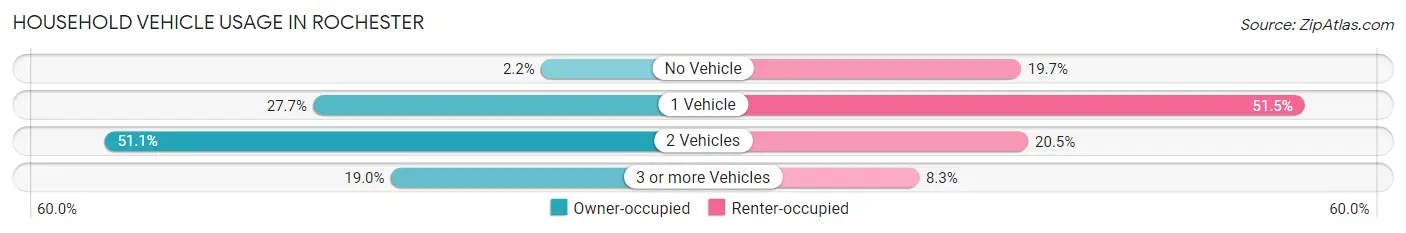
| Vehicles per Household | Owner-occupied | Renter-occupied |
| No Vehicle | 722 (2.2%) | 3,419 (19.7%) |
| 1 Vehicle | 9,115 (27.7%) | 8,936 (51.5%) |
| 2 Vehicles | 16,785 (51.0%) | 3,562 (20.5%) |
| 3 or more Vehicles | 6,258 (19.0%) | 1,439 (8.3%) |
| Total | 32,880 (100.0%) | 17,356 (100.0%) |
Real Estate & Mortgages in Rochester
Real Estate and Mortgage Overview in Rochester
| Characteristic | Without Mortgage | With Mortgage |
| Housing Units | 11,952 | 20,928 |
| Median Property Value | $259,000 | $274,600 |
| Median Household Income | $86,930 | $7,361 |
| Monthly Housing Costs | $633 | $2,122 |
| Real Estate Taxes | $2,838 | $392 |
Property Value by Mortgage Status in Rochester
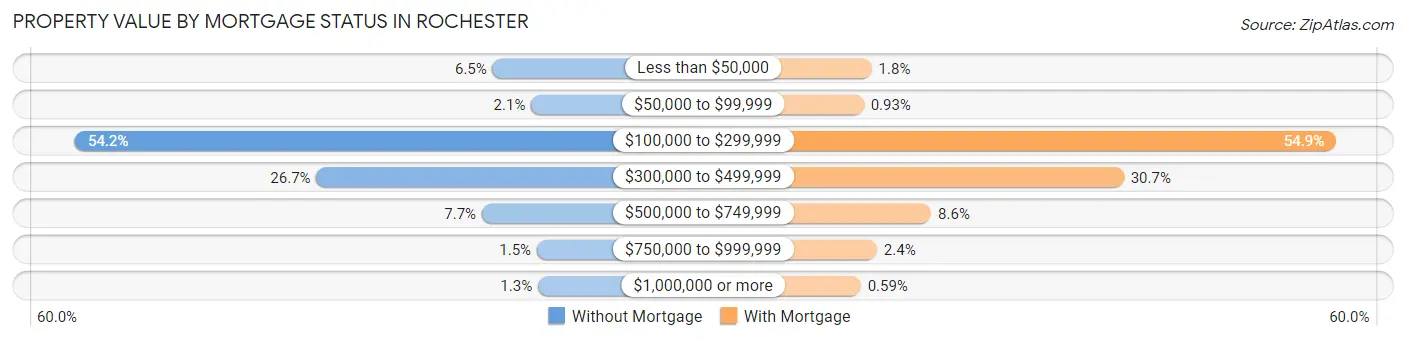
| Property Value | Without Mortgage | With Mortgage |
| Less than $50,000 | 778 (6.5%) | 385 (1.8%) |
| $50,000 to $99,999 | 251 (2.1%) | 195 (0.9%) |
| $100,000 to $299,999 | 6,482 (54.2%) | 11,492 (54.9%) |
| $300,000 to $499,999 | 3,185 (26.7%) | 6,414 (30.6%) |
| $500,000 to $749,999 | 924 (7.7%) | 1,809 (8.6%) |
| $750,000 to $999,999 | 173 (1.5%) | 510 (2.4%) |
| $1,000,000 or more | 159 (1.3%) | 123 (0.6%) |
| Total | 11,952 (100.0%) | 20,928 (100.0%) |
Household Income by Mortgage Status in Rochester
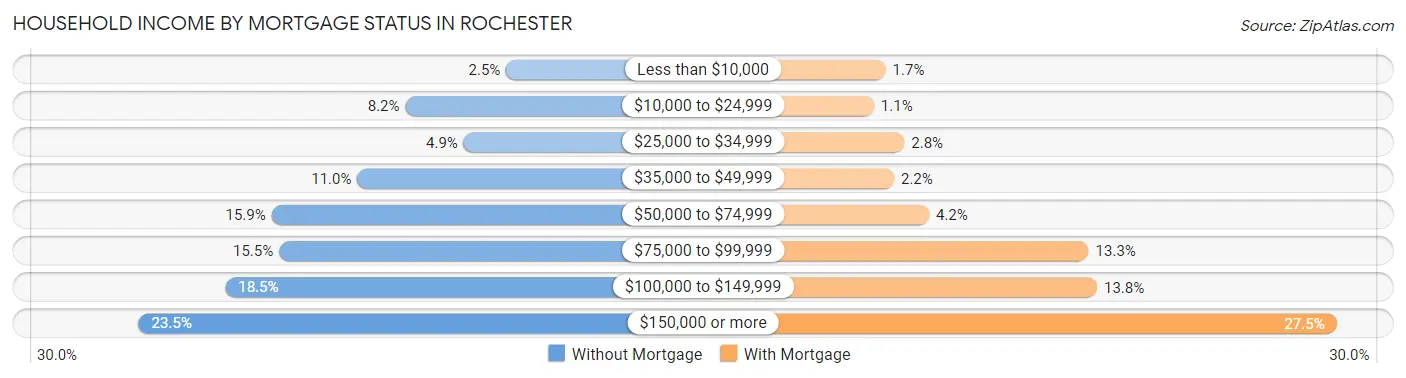
| Household Income | Without Mortgage | With Mortgage |
| Less than $10,000 | 297 (2.5%) | 360 (1.7%) |
| $10,000 to $24,999 | 985 (8.2%) | 220 (1.1%) |
| $25,000 to $34,999 | 587 (4.9%) | 584 (2.8%) |
| $35,000 to $49,999 | 1,313 (11.0%) | 460 (2.2%) |
| $50,000 to $74,999 | 1,899 (15.9%) | 878 (4.2%) |
| $75,000 to $99,999 | 1,848 (15.5%) | 2,787 (13.3%) |
| $100,000 to $149,999 | 2,215 (18.5%) | 2,888 (13.8%) |
| $150,000 or more | 2,808 (23.5%) | 5,750 (27.5%) |
| Total | 11,952 (100.0%) | 20,928 (100.0%) |
Property Value to Household Income Ratio in Rochester
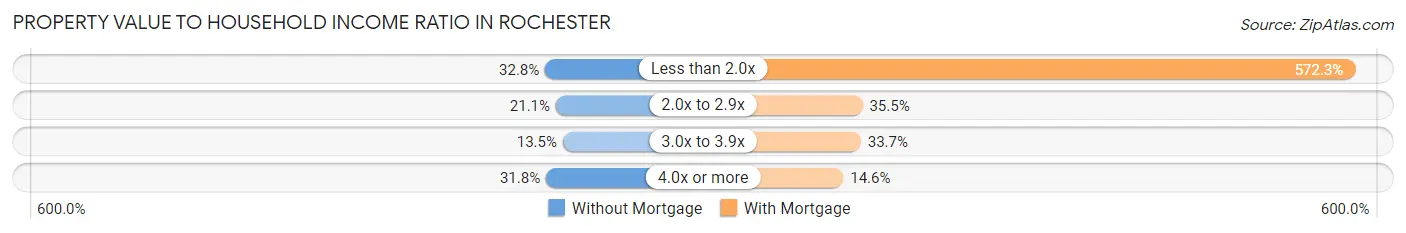
| Value-to-Income Ratio | Without Mortgage | With Mortgage |
| Less than 2.0x | 3,924 (32.8%) | 119,764 (572.3%) |
| 2.0x to 2.9x | 2,523 (21.1%) | 7,425 (35.5%) |
| 3.0x to 3.9x | 1,614 (13.5%) | 7,046 (33.7%) |
| 4.0x or more | 3,806 (31.8%) | 3,046 (14.5%) |
| Total | 11,952 (100.0%) | 20,928 (100.0%) |
Real Estate Taxes by Mortgage Status in Rochester
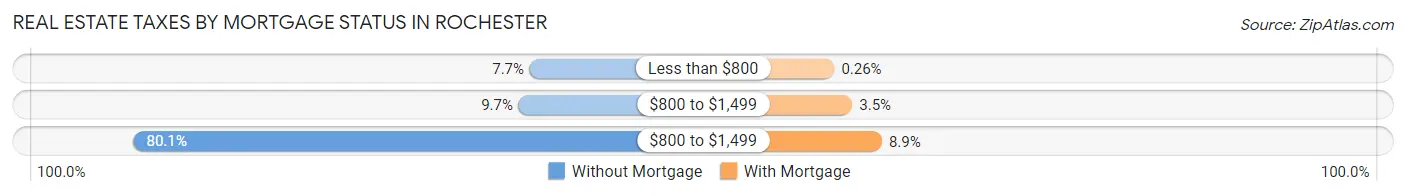
| Property Taxes | Without Mortgage | With Mortgage |
| Less than $800 | 921 (7.7%) | 54 (0.3%) |
| $800 to $1,499 | 1,164 (9.7%) | 737 (3.5%) |
| $800 to $1,499 | 9,573 (80.1%) | 1,870 (8.9%) |
| Total | 11,952 (100.0%) | 20,928 (100.0%) |
Health & Disability in Rochester
Health Insurance Coverage by Age in Rochester
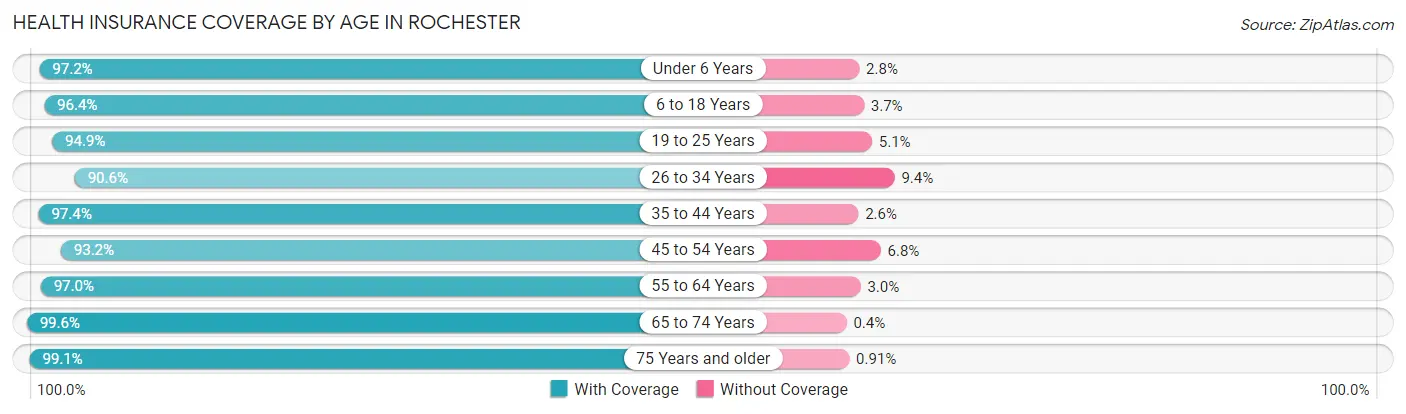
| Age Bracket | With Coverage | Without Coverage |
| Under 6 Years | 9,507 (97.2%) | 271 (2.8%) |
| 6 to 18 Years | 19,348 (96.4%) | 732 (3.6%) |
| 19 to 25 Years | 10,181 (94.9%) | 552 (5.1%) |
| 26 to 34 Years | 15,845 (90.6%) | 1,637 (9.4%) |
| 35 to 44 Years | 16,116 (97.4%) | 430 (2.6%) |
| 45 to 54 Years | 11,616 (93.2%) | 844 (6.8%) |
| 55 to 64 Years | 13,652 (97.0%) | 424 (3.0%) |
| 65 to 74 Years | 9,939 (99.6%) | 40 (0.4%) |
| 75 Years and older | 7,914 (99.1%) | 73 (0.9%) |
| Total | 114,118 (95.8%) | 5,003 (4.2%) |
Health Insurance Coverage by Citizenship Status in Rochester
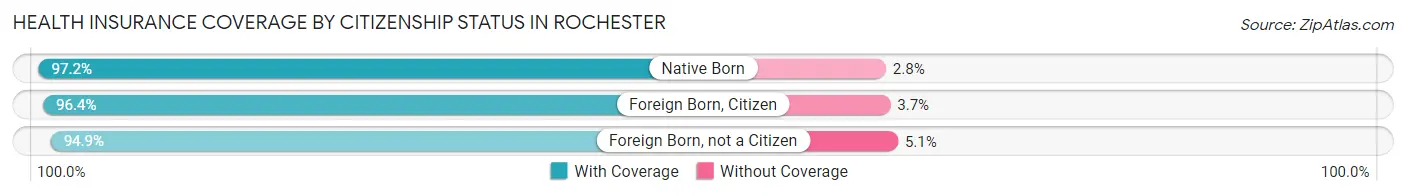
| Citizenship Status | With Coverage | Without Coverage |
| Native Born | 9,507 (97.2%) | 271 (2.8%) |
| Foreign Born, Citizen | 19,348 (96.4%) | 732 (3.6%) |
| Foreign Born, not a Citizen | 10,181 (94.9%) | 552 (5.1%) |
Health Insurance Coverage by Household Income in Rochester
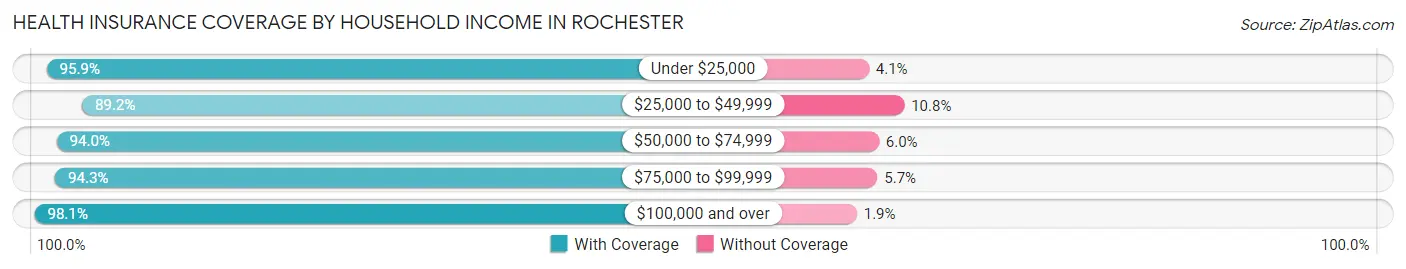
| Household Income | With Coverage | Without Coverage |
| Under $25,000 | 9,130 (95.9%) | 393 (4.1%) |
| $25,000 to $49,999 | 11,743 (89.2%) | 1,416 (10.8%) |
| $50,000 to $74,999 | 17,602 (94.0%) | 1,125 (6.0%) |
| $75,000 to $99,999 | 14,816 (94.3%) | 900 (5.7%) |
| $100,000 and over | 59,854 (98.1%) | 1,142 (1.9%) |
Public vs Private Health Insurance Coverage by Age in Rochester
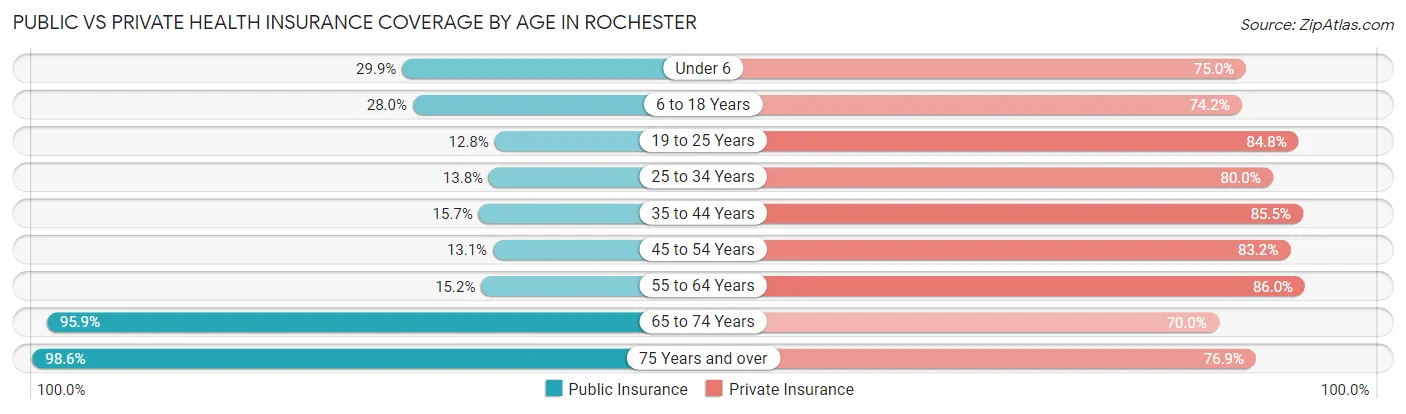
| Age Bracket | Public Insurance | Private Insurance |
| Under 6 | 2,926 (29.9%) | 7,337 (75.0%) |
| 6 to 18 Years | 5,613 (28.0%) | 14,896 (74.2%) |
| 19 to 25 Years | 1,370 (12.8%) | 9,098 (84.8%) |
| 25 to 34 Years | 2,416 (13.8%) | 13,977 (79.9%) |
| 35 to 44 Years | 2,603 (15.7%) | 14,153 (85.5%) |
| 45 to 54 Years | 1,629 (13.1%) | 10,368 (83.2%) |
| 55 to 64 Years | 2,145 (15.2%) | 12,100 (86.0%) |
| 65 to 74 Years | 9,567 (95.9%) | 6,981 (70.0%) |
| 75 Years and over | 7,871 (98.6%) | 6,138 (76.8%) |
| Total | 36,140 (30.3%) | 95,048 (79.8%) |
Disability Status by Sex by Age in Rochester
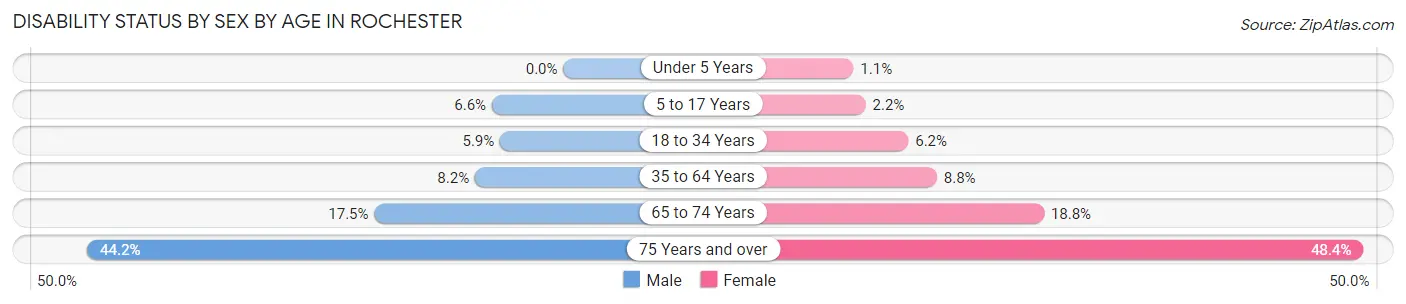
| Age Bracket | Male | Female |
| Under 5 Years | 0 (0.0%) | 43 (1.1%) |
| 5 to 17 Years | 691 (6.6%) | 217 (2.2%) |
| 18 to 34 Years | 841 (5.9%) | 938 (6.2%) |
| 35 to 64 Years | 1,755 (8.2%) | 1,911 (8.8%) |
| 65 to 74 Years | 782 (17.5%) | 1,036 (18.8%) |
| 75 Years and over | 1,418 (44.2%) | 2,312 (48.4%) |
Disability Class by Sex by Age in Rochester
Disability Class: Hearing Difficulty
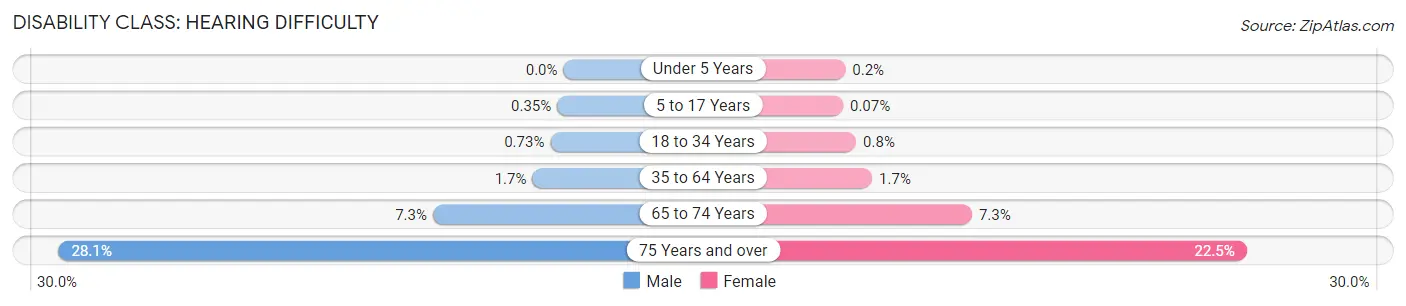
| Age Bracket | Male | Female |
| Under 5 Years | 0 (0.0%) | 8 (0.2%) |
| 5 to 17 Years | 37 (0.4%) | 7 (0.1%) |
| 18 to 34 Years | 105 (0.7%) | 121 (0.8%) |
| 35 to 64 Years | 370 (1.7%) | 366 (1.7%) |
| 65 to 74 Years | 324 (7.3%) | 400 (7.2%) |
| 75 Years and over | 902 (28.1%) | 1,077 (22.5%) |
Disability Class: Vision Difficulty
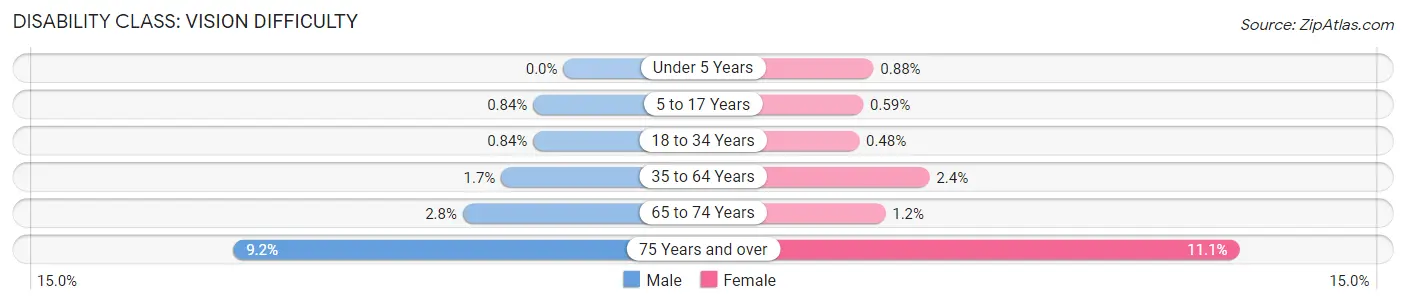
| Age Bracket | Male | Female |
| Under 5 Years | 0 (0.0%) | 35 (0.9%) |
| 5 to 17 Years | 88 (0.8%) | 58 (0.6%) |
| 18 to 34 Years | 121 (0.8%) | 73 (0.5%) |
| 35 to 64 Years | 371 (1.7%) | 528 (2.4%) |
| 65 to 74 Years | 125 (2.8%) | 67 (1.2%) |
| 75 Years and over | 295 (9.2%) | 529 (11.1%) |
Disability Class: Cognitive Difficulty
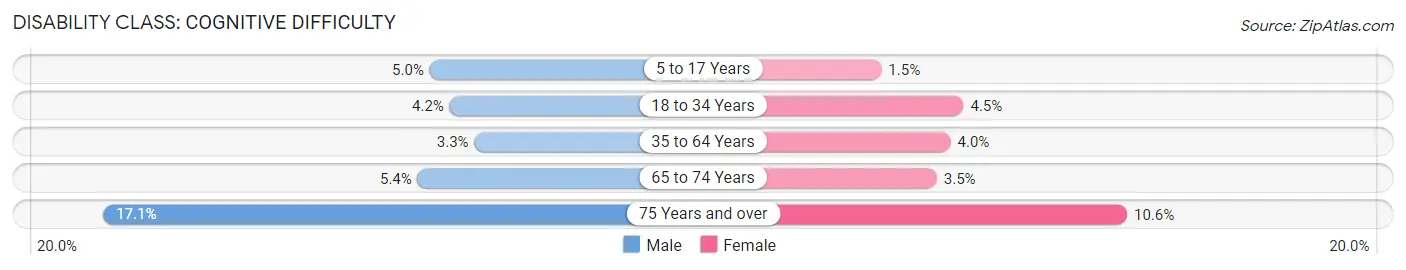
| Age Bracket | Male | Female |
| 5 to 17 Years | 517 (5.0%) | 145 (1.5%) |
| 18 to 34 Years | 605 (4.2%) | 687 (4.5%) |
| 35 to 64 Years | 707 (3.3%) | 875 (4.0%) |
| 65 to 74 Years | 241 (5.4%) | 195 (3.5%) |
| 75 Years and over | 548 (17.1%) | 506 (10.6%) |
Disability Class: Ambulatory Difficulty
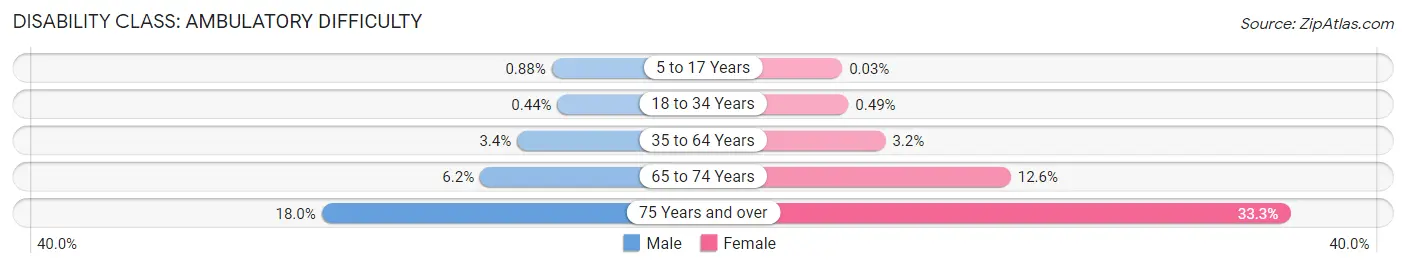
| Age Bracket | Male | Female |
| 5 to 17 Years | 92 (0.9%) | 3 (0.0%) |
| 18 to 34 Years | 63 (0.4%) | 74 (0.5%) |
| 35 to 64 Years | 736 (3.4%) | 703 (3.2%) |
| 65 to 74 Years | 276 (6.2%) | 693 (12.6%) |
| 75 Years and over | 576 (17.9%) | 1,590 (33.3%) |
Disability Class: Self-Care Difficulty
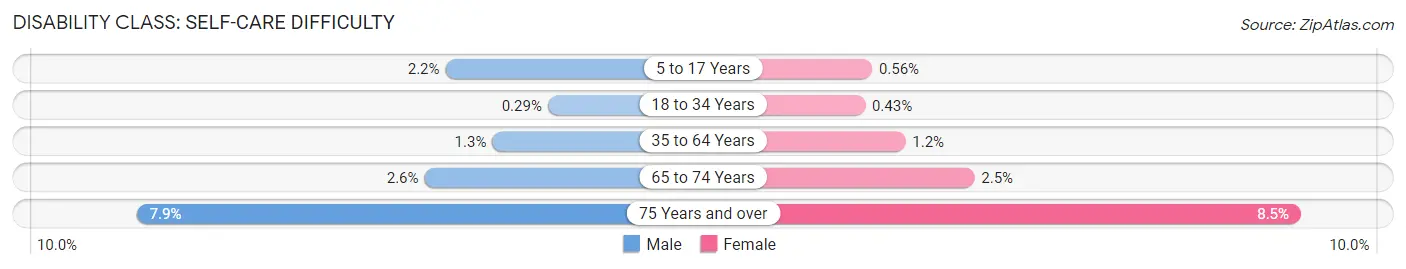
| Age Bracket | Male | Female |
| 5 to 17 Years | 228 (2.2%) | 55 (0.6%) |
| 18 to 34 Years | 41 (0.3%) | 65 (0.4%) |
| 35 to 64 Years | 282 (1.3%) | 255 (1.2%) |
| 65 to 74 Years | 115 (2.6%) | 136 (2.5%) |
| 75 Years and over | 254 (7.9%) | 407 (8.5%) |
Technology Access in Rochester
Computing Device Access in Rochester
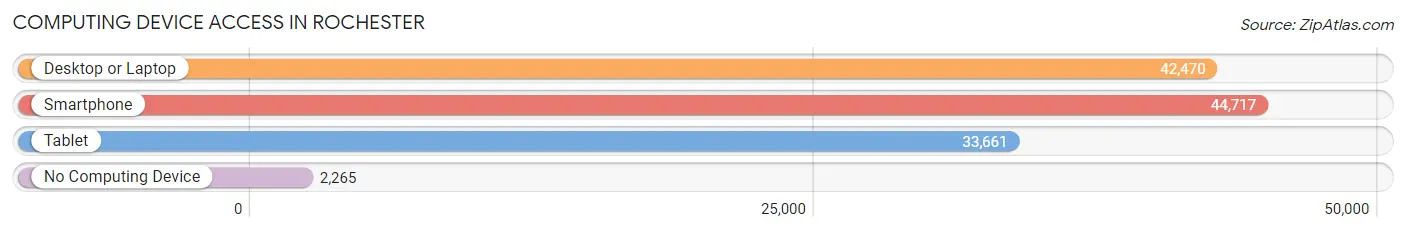
| Device Type | # Households | % Households |
| Desktop or Laptop | 42,470 | 84.5% |
| Smartphone | 44,717 | 89.0% |
| Tablet | 33,661 | 67.0% |
| No Computing Device | 2,265 | 4.5% |
| Total | 50,236 | 100.0% |
Internet Access in Rochester
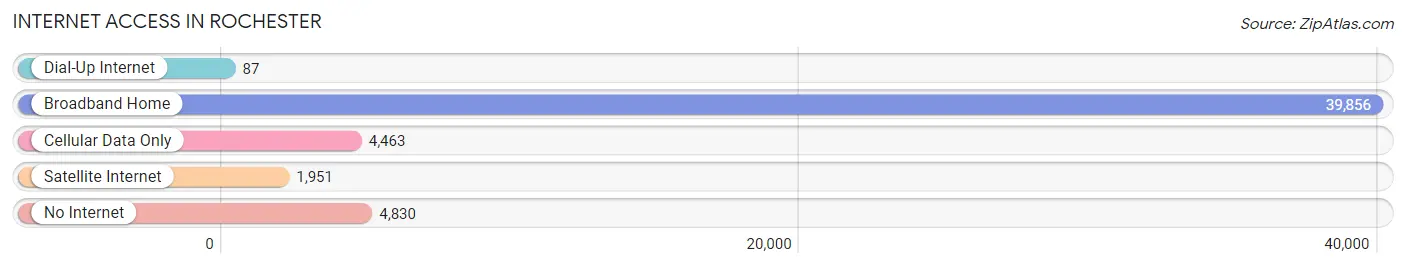
| Internet Type | # Households | % Households |
| Dial-Up Internet | 87 | 0.2% |
| Broadband Home | 39,856 | 79.3% |
| Cellular Data Only | 4,463 | 8.9% |
| Satellite Internet | 1,951 | 3.9% |
| No Internet | 4,830 | 9.6% |
| Total | 50,236 | 100.0% |
Rochester Summary
Rochester, Minnesota is a city located in Olmsted County in the southeastern part of the state. It is the third-largest city in Minnesota, with a population of 106,769 as of the 2010 census. The city is situated on the Zumbro River and is home to the Mayo Clinic, one of the world's largest and most renowned medical centers.
History
Rochester was founded in 1854 by George Head and his family, who were among the first settlers in the area. The city was named after Rochester, New York, where Head had previously lived. The city was incorporated in 1857 and quickly grew due to its location on the Zumbro River, which provided a convenient transportation route for goods and services.
In 1863, the city was chosen as the site of the Mayo Clinic, which was founded by William Worrall Mayo and his sons. The clinic quickly became a major employer in the city and has since grown to become one of the world's largest and most renowned medical centers.
Geography
Rochester is located in southeastern Minnesota, in Olmsted County. It is situated on the Zumbro River, which flows through the city and provides a convenient transportation route for goods and services. The city is located approximately 75 miles south of Minneapolis and St. Paul.
The city has a total area of 54.2 square miles, of which 53.9 square miles is land and 0.3 square miles is water. The city is located in the Driftless Area, which is characterized by its rolling hills and valleys.
Economy
Rochester's economy is largely driven by the Mayo Clinic, which is one of the city's largest employers. Other major employers in the city include IBM, the University of Minnesota Rochester, and the Olmsted Medical Center.
The city is also home to a number of manufacturing companies, including the Rochester Manufacturing Company, which produces medical equipment, and the Rochester Products Company, which produces automotive parts.
Demographics
As of the 2010 census, Rochester had a population of 106,769. The city's population is predominantly white (90.2%), with smaller percentages of African Americans (3.2%), Asians (2.7%), and Hispanics (2.3%).
The median household income in Rochester is $60,945, and the median family income is $76,945. The city's poverty rate is 8.3%, which is lower than the national average of 12.3%.
Rochester is home to a number of higher education institutions, including the University of Minnesota Rochester, Rochester Community and Technical College, and the Mayo Clinic College of Medicine. The city also has a number of public and private schools, including the Rochester Public Schools, which serves more than 20,000 students.
Common Questions
What is Per Capita Income in Rochester?
Per Capita income in Rochester is $47,516.
What is the Median Family Income in Rochester?
Median Family Income in Rochester is $108,759.
What is the Median Household income in Rochester?
Median Household Income in Rochester is $83,973.
What is Income or Wage Gap in Rochester?
Income or Wage Gap in Rochester is 12.7%.
Women in Rochester earn 87.3 cents for every dollar earned by a man.
What is Family Income Deficit in Rochester?
Family Income Deficit in Rochester is $8,885.
Families that are below poverty line in Rochester earn $8,885 less on average than the poverty threshold level.
What is Inequality or Gini Index in Rochester?
Inequality or Gini Index in Rochester is 0.45.
What is the Total Population of Rochester?
Total Population of Rochester is 120,848.
What is the Total Male Population of Rochester?
Total Male Population of Rochester is 59,270.
What is the Total Female Population of Rochester?
Total Female Population of Rochester is 61,578.
What is the Ratio of Males per 100 Females in Rochester?
There are 96.25 Males per 100 Females in Rochester.
What is the Ratio of Females per 100 Males in Rochester?
There are 103.89 Females per 100 Males in Rochester.
What is the Median Population Age in Rochester?
Median Population Age in Rochester is 36.3 Years.
What is the Average Family Size in Rochester
Average Family Size in Rochester is 3.0 People.
What is the Average Household Size in Rochester
Average Household Size in Rochester is 2.4 People.
How Large is the Labor Force in Rochester?
There are 67,636 People in the Labor Forcein in Rochester.
What is the Percentage of People in the Labor Force in Rochester?
70.9% of People are in the Labor Force in Rochester.
What is the Unemployment Rate in Rochester?
Unemployment Rate in Rochester is 3.7%.