Meadville, MS Map & Demographics
Meadville Map
Meadville Overview
$28,261
PER CAPITA INCOME
$54,614
AVG FAMILY INCOME
$54,250
AVG HOUSEHOLD INCOME
36.9%
WAGE / INCOME GAP [ % ]
63.1¢/ $1
WAGE / INCOME GAP [ $ ]
0.42
INEQUALITY / GINI INDEX
690
TOTAL POPULATION
376
MALE POPULATION
314
FEMALE POPULATION
119.75
MALES / 100 FEMALES
83.51
FEMALES / 100 MALES
55.0
MEDIAN AGE
2.7
AVG FAMILY SIZE
2.4
AVG HOUSEHOLD SIZE
187
LABOR FORCE [ PEOPLE ]
29.6%
PERCENT IN LABOR FORCE
1.6%
UNEMPLOYMENT RATE
Meadville Zip Codes
Income in Meadville
Income Overview in Meadville
Per Capita Income in Meadville is $28,261, while median incomes of families and households are $54,614 and $54,250 respectively.
| Characteristic | Number | Measure |
| Per Capita Income | 690 | $28,261 |
| Median Family Income | 193 | $54,614 |
| Mean Family Income | 193 | $74,113 |
| Median Household Income | 251 | $54,250 |
| Mean Household Income | 251 | $78,059 |
| Income Deficit | 193 | $0 |
| Wage / Income Gap (%) | 690 | 36.90% |
| Wage / Income Gap ($) | 690 | 63.10¢ per $1 |
| Gini / Inequality Index | 690 | 0.42 |
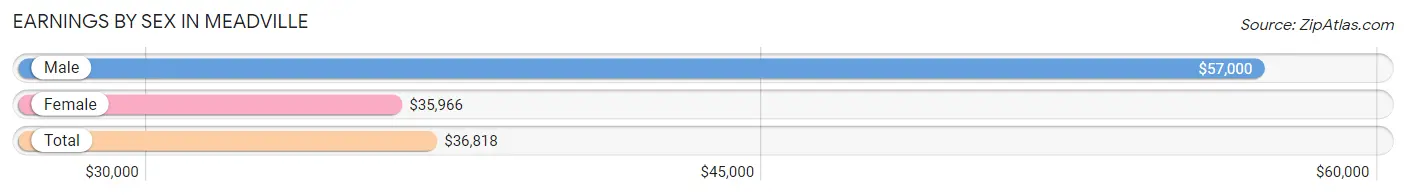
Earnings by Sex in Meadville
Average Earnings in Meadville are $36,818, $57,000 for men and $35,966 for women, a difference of 36.9%.
| Sex | Number | Average Earnings |
| Male | 88 (44.0%) | $57,000 |
| Female | 112 (56.0%) | $35,966 |
| Total | 200 (100.0%) | $36,818 |
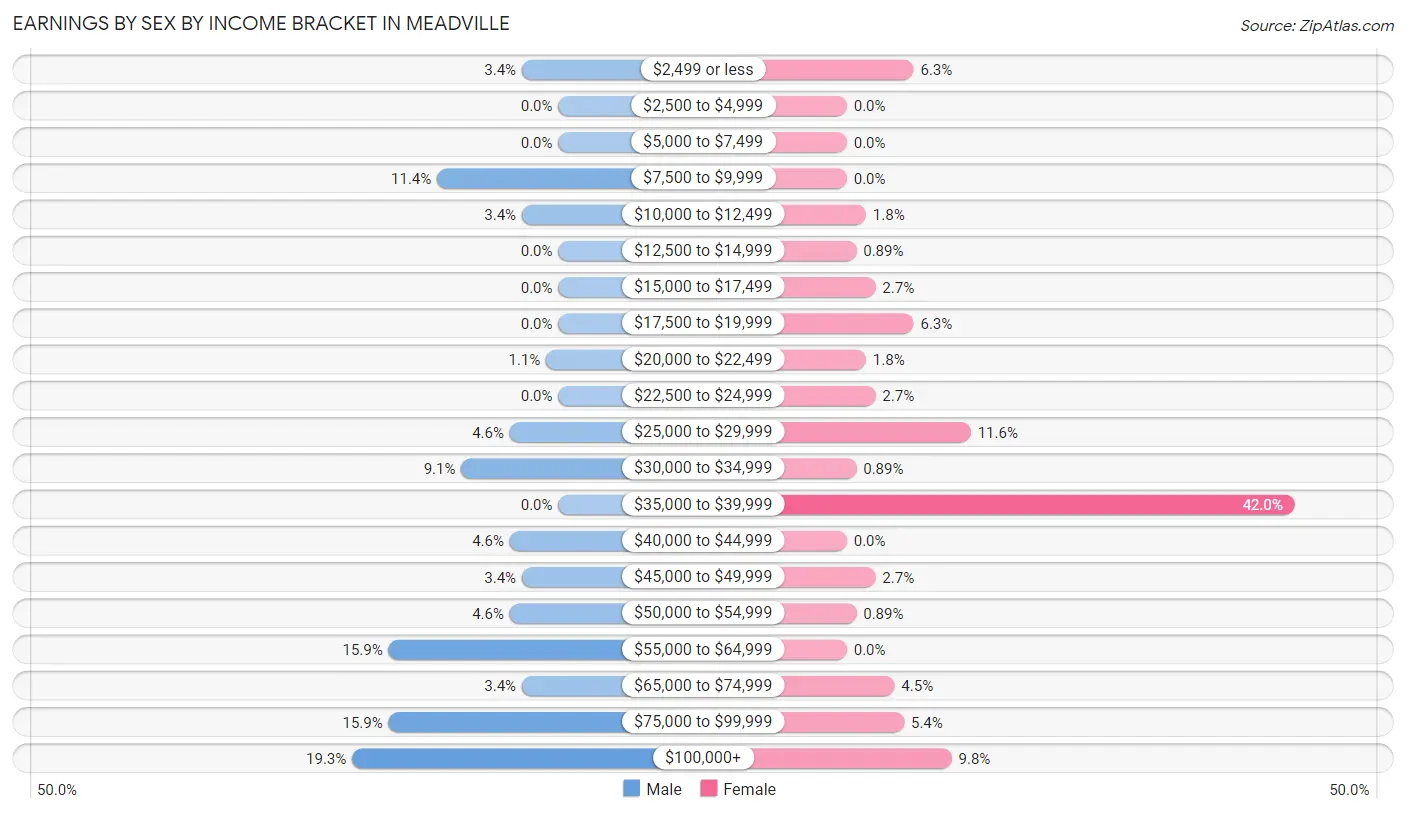
Earnings by Sex by Income Bracket in Meadville
The most common earnings brackets in Meadville are $100,000+ for men (17 | 19.3%) and $35,000 to $39,999 for women (47 | 42.0%).
| Income | Male | Female |
| $2,499 or less | 3 (3.4%) | 7 (6.2%) |
| $2,500 to $4,999 | 0 (0.0%) | 0 (0.0%) |
| $5,000 to $7,499 | 0 (0.0%) | 0 (0.0%) |
| $7,500 to $9,999 | 10 (11.4%) | 0 (0.0%) |
| $10,000 to $12,499 | 3 (3.4%) | 2 (1.8%) |
| $12,500 to $14,999 | 0 (0.0%) | 1 (0.9%) |
| $15,000 to $17,499 | 0 (0.0%) | 3 (2.7%) |
| $17,500 to $19,999 | 0 (0.0%) | 7 (6.2%) |
| $20,000 to $22,499 | 1 (1.1%) | 2 (1.8%) |
| $22,500 to $24,999 | 0 (0.0%) | 3 (2.7%) |
| $25,000 to $29,999 | 4 (4.5%) | 13 (11.6%) |
| $30,000 to $34,999 | 8 (9.1%) | 1 (0.9%) |
| $35,000 to $39,999 | 0 (0.0%) | 47 (42.0%) |
| $40,000 to $44,999 | 4 (4.5%) | 0 (0.0%) |
| $45,000 to $49,999 | 3 (3.4%) | 3 (2.7%) |
| $50,000 to $54,999 | 4 (4.5%) | 1 (0.9%) |
| $55,000 to $64,999 | 14 (15.9%) | 0 (0.0%) |
| $65,000 to $74,999 | 3 (3.4%) | 5 (4.5%) |
| $75,000 to $99,999 | 14 (15.9%) | 6 (5.4%) |
| $100,000+ | 17 (19.3%) | 11 (9.8%) |
| Total | 88 (100.0%) | 112 (100.0%) |
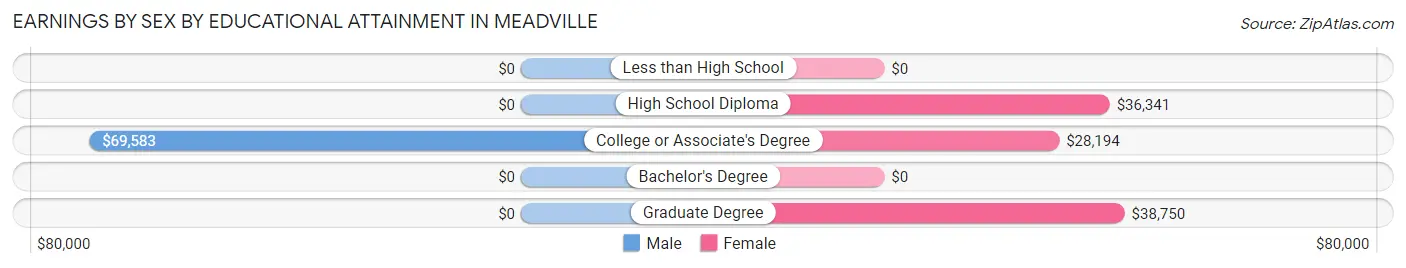
Earnings by Sex by Educational Attainment in Meadville
Average earnings in Meadville are $57,969 for men and $35,966 for women, a difference of 38.0%. Men with an educational attainment of college or associate's degree enjoy the highest average annual earnings of $69,583, while those with college or associate's degree education earn the least with $69,583. Women with an educational attainment of graduate degree earn the most with the average annual earnings of $38,750, while those with college or associate's degree education have the smallest earnings of $28,194.
| Educational Attainment | Male Income | Female Income |
| Less than High School | - | - |
| High School Diploma | - | - |
| College or Associate's Degree | $69,583 | $28,194 |
| Bachelor's Degree | - | - |
| Graduate Degree | - | - |
| Total | $57,969 | $35,966 |
Family Income in Meadville
Family Income Brackets in Meadville
According to the Meadville family income data, there are 84 families falling into the $50,000 to $74,999 income range, which is the most common income bracket and makes up 43.5% of all families.
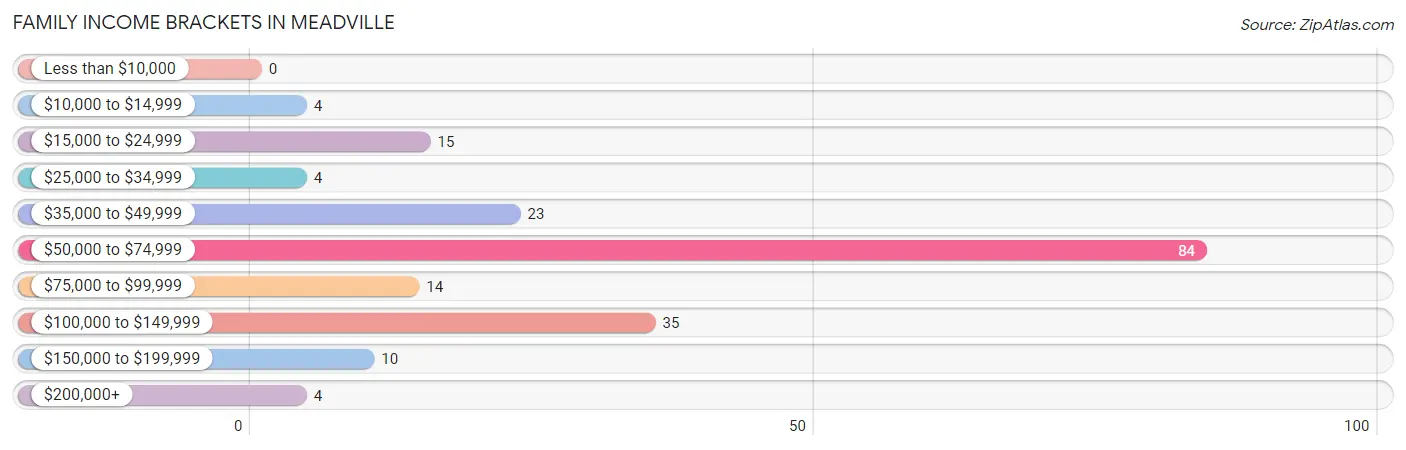
| Income Bracket | # Families | % Families |
| Less than $10,000 | 0 | 0.0% |
| $10,000 to $14,999 | 4 | 2.1% |
| $15,000 to $24,999 | 15 | 7.8% |
| $25,000 to $34,999 | 4 | 2.1% |
| $35,000 to $49,999 | 23 | 11.9% |
| $50,000 to $74,999 | 84 | 43.5% |
| $75,000 to $99,999 | 14 | 7.3% |
| $100,000 to $149,999 | 35 | 18.1% |
| $150,000 to $199,999 | 10 | 5.2% |
| $200,000+ | 4 | 2.1% |
Family Income by Famaliy Size in Meadville
4-person families (24 | 12.4%) account for the highest median family income in Meadville with $96,250 per family, while 2-person families (143 | 74.1%) have the highest median income of $26,966 per family member.
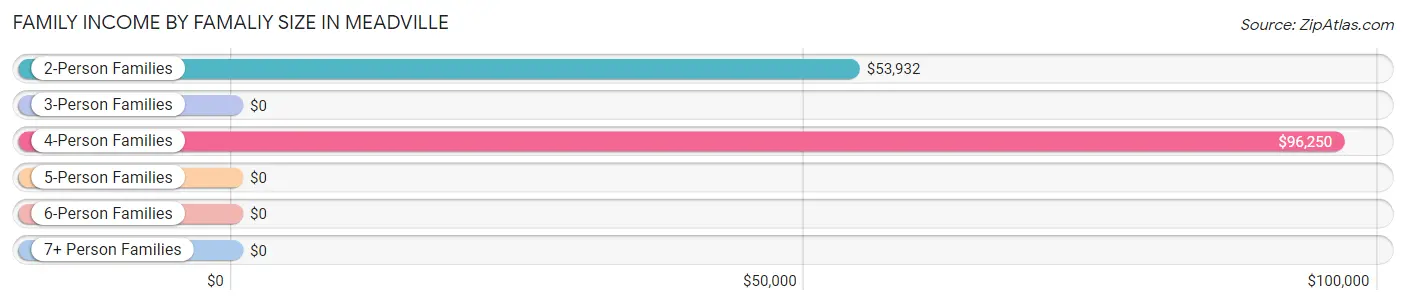
| Income Bracket | # Families | Median Income |
| 2-Person Families | 143 (74.1%) | $53,932 |
| 3-Person Families | 15 (7.8%) | $0 |
| 4-Person Families | 24 (12.4%) | $96,250 |
| 5-Person Families | 4 (2.1%) | $0 |
| 6-Person Families | 7 (3.6%) | $0 |
| 7+ Person Families | 0 (0.0%) | $0 |
| Total | 193 (100.0%) | $54,614 |
Family Income by Number of Earners in Meadville
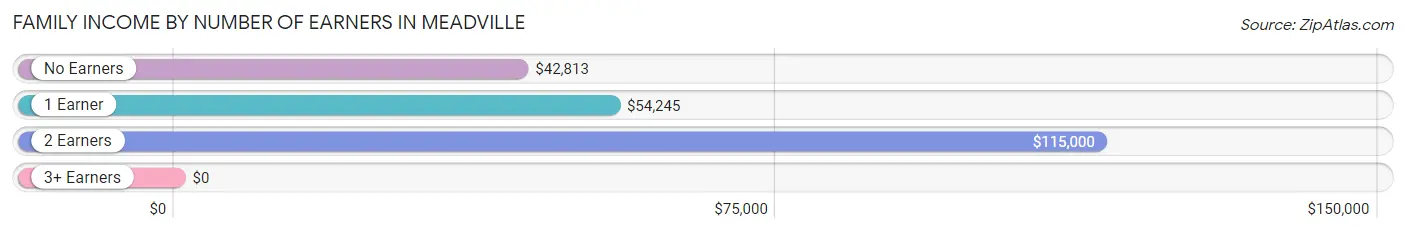
| Number of Earners | # Families | Median Income |
| No Earners | 59 (30.6%) | $42,813 |
| 1 Earner | 104 (53.9%) | $54,245 |
| 2 Earners | 30 (15.5%) | $115,000 |
| 3+ Earners | 0 (0.0%) | $0 |
| Total | 193 (100.0%) | $54,614 |
Household Income in Meadville
Household Income Brackets in Meadville
With 86 households falling in the category, the $50,000 to $74,999 income range is the most frequent in Meadville, accounting for 34.3% of all households. In contrast, only 5 households (2.0%) fall into the less than $10,000 income bracket, making it the least populous group.
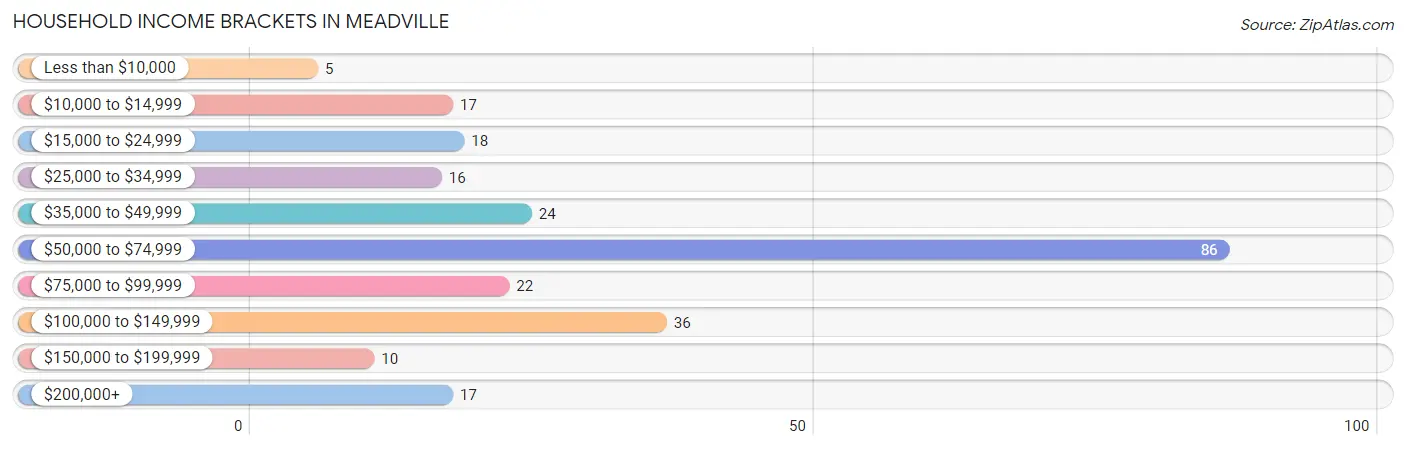
| Income Bracket | # Households | % Households |
| Less than $10,000 | 5 | 2.0% |
| $10,000 to $14,999 | 17 | 6.8% |
| $15,000 to $24,999 | 18 | 7.2% |
| $25,000 to $34,999 | 16 | 6.4% |
| $35,000 to $49,999 | 24 | 9.6% |
| $50,000 to $74,999 | 86 | 34.3% |
| $75,000 to $99,999 | 22 | 8.8% |
| $100,000 to $149,999 | 36 | 14.3% |
| $150,000 to $199,999 | 10 | 4.0% |
| $200,000+ | 17 | 6.8% |
Household Income by Householder Age in Meadville
The median household income in Meadville is $54,250, with the highest median household income of $59,167 found in the 65+ years age bracket for the primary householder. A total of 96 households (38.3%) fall into this category. Meanwhile, the 15 to 24 years age bracket for the primary householder has the lowest median household income of $0, with 3 households (1.2%) in this group.
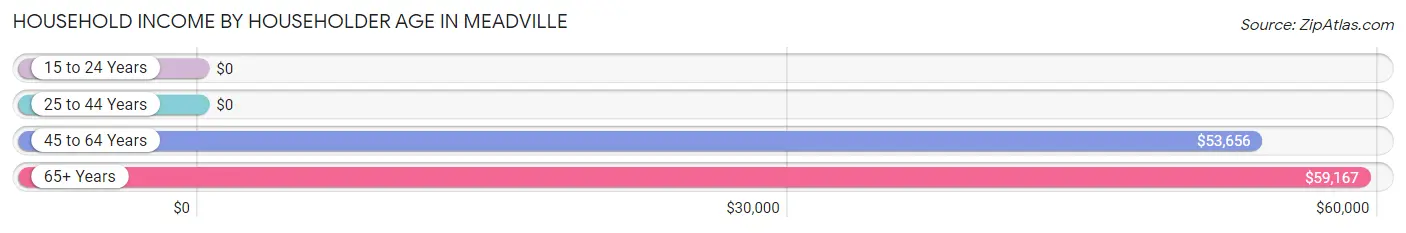
| Income Bracket | # Households | Median Income |
| 15 to 24 Years | 3 (1.2%) | $0 |
| 25 to 44 Years | 31 (12.3%) | $0 |
| 45 to 64 Years | 121 (48.2%) | $53,656 |
| 65+ Years | 96 (38.3%) | $59,167 |
| Total | 251 (100.0%) | $54,250 |
Poverty in Meadville
Income Below Poverty by Sex and Age in Meadville
With 8.3% poverty level for males and 22.9% for females among the residents of Meadville, 15 year old males and 55 to 64 year old females are the most vulnerable to poverty, with 2 males (100.0%) and 21 females (41.2%) in their respective age groups living below the poverty level.
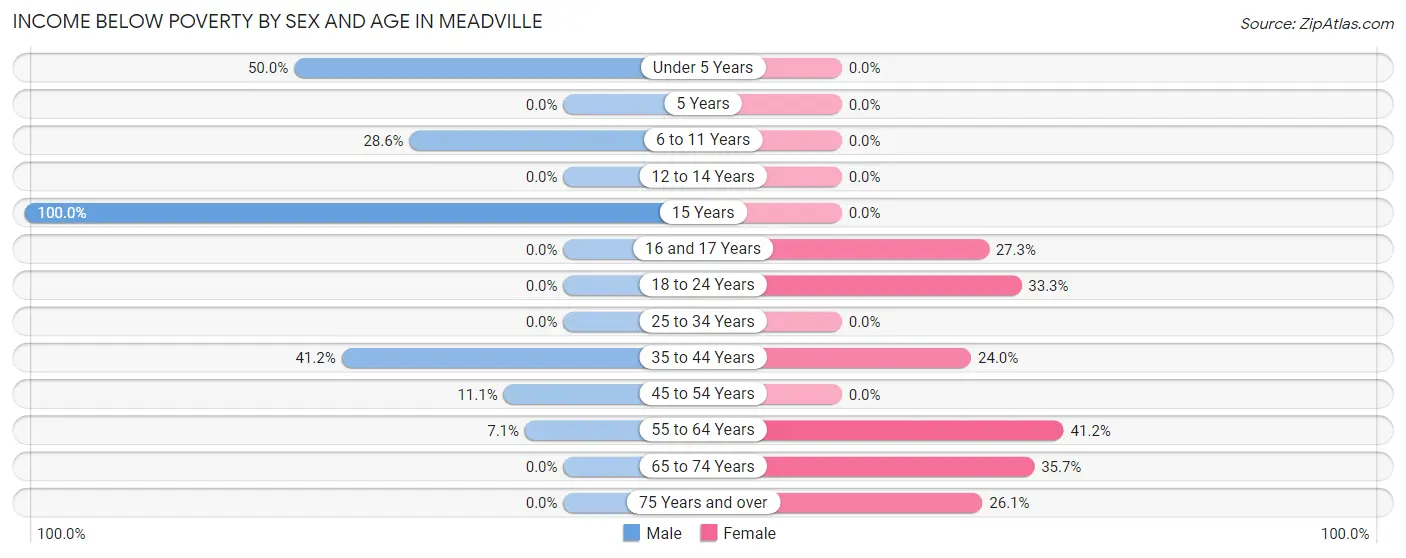
| Age Bracket | Male | Female |
| Under 5 Years | 7 (50.0%) | 0 (0.0%) |
| 5 Years | 0 (0.0%) | 0 (0.0%) |
| 6 to 11 Years | 2 (28.6%) | 0 (0.0%) |
| 12 to 14 Years | 0 (0.0%) | 0 (0.0%) |
| 15 Years | 2 (100.0%) | 0 (0.0%) |
| 16 and 17 Years | 0 (0.0%) | 3 (27.3%) |
| 18 to 24 Years | 0 (0.0%) | 8 (33.3%) |
| 25 to 34 Years | 0 (0.0%) | 0 (0.0%) |
| 35 to 44 Years | 7 (41.2%) | 6 (24.0%) |
| 45 to 54 Years | 1 (11.1%) | 0 (0.0%) |
| 55 to 64 Years | 6 (7.1%) | 21 (41.2%) |
| 65 to 74 Years | 0 (0.0%) | 25 (35.7%) |
| 75 Years and over | 0 (0.0%) | 6 (26.1%) |
| Total | 25 (8.3%) | 69 (22.9%) |
Income Above Poverty by Sex and Age in Meadville
According to the poverty statistics in Meadville, males aged 5 years and females aged under 5 years are the age groups that are most secure financially, with 100.0% of males and 100.0% of females in these age groups living above the poverty line.
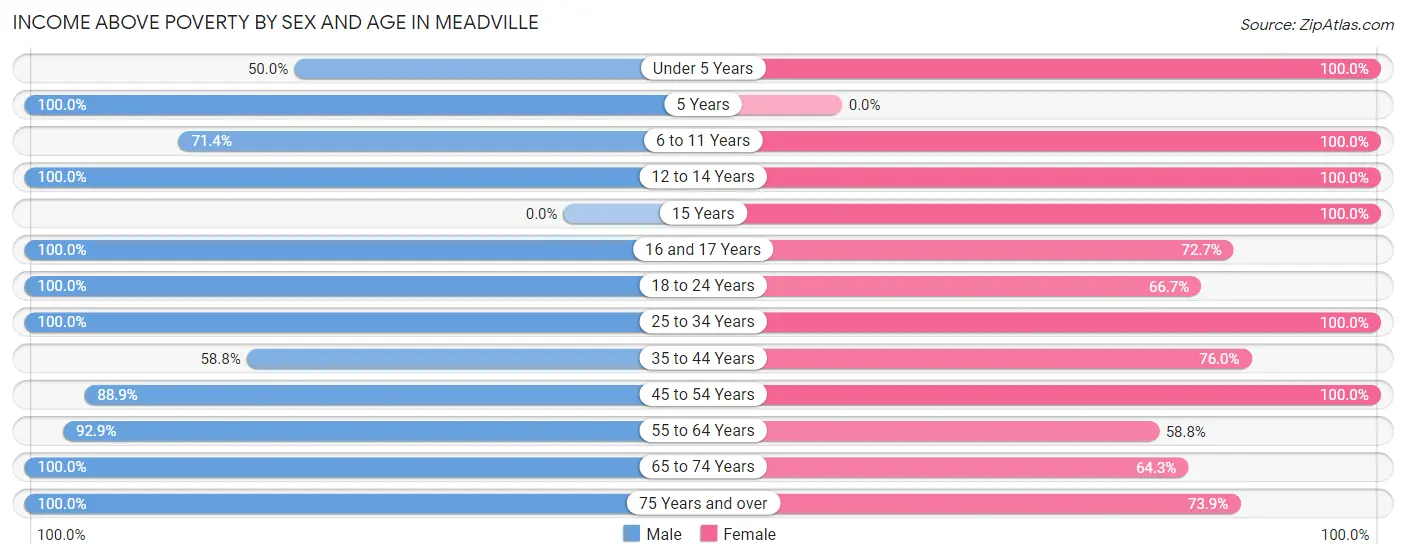
| Age Bracket | Male | Female |
| Under 5 Years | 7 (50.0%) | 11 (100.0%) |
| 5 Years | 3 (100.0%) | 0 (0.0%) |
| 6 to 11 Years | 5 (71.4%) | 12 (100.0%) |
| 12 to 14 Years | 3 (100.0%) | 4 (100.0%) |
| 15 Years | 0 (0.0%) | 3 (100.0%) |
| 16 and 17 Years | 3 (100.0%) | 8 (72.7%) |
| 18 to 24 Years | 53 (100.0%) | 16 (66.7%) |
| 25 to 34 Years | 32 (100.0%) | 14 (100.0%) |
| 35 to 44 Years | 10 (58.8%) | 19 (76.0%) |
| 45 to 54 Years | 8 (88.9%) | 54 (100.0%) |
| 55 to 64 Years | 78 (92.9%) | 30 (58.8%) |
| 65 to 74 Years | 54 (100.0%) | 45 (64.3%) |
| 75 Years and over | 19 (100.0%) | 17 (73.9%) |
| Total | 275 (91.7%) | 233 (77.1%) |
Income Below Poverty Among Married-Couple Families in Meadville
The poverty statistics for married-couple families in Meadville show that 0.7% or 1 of the total 148 families live below the poverty line. Families with 1 or 2 children have the highest poverty rate of 4.5%, comprising of 1 families. On the other hand, families with no children have the lowest poverty rate of 0.0%, which includes 0 families.
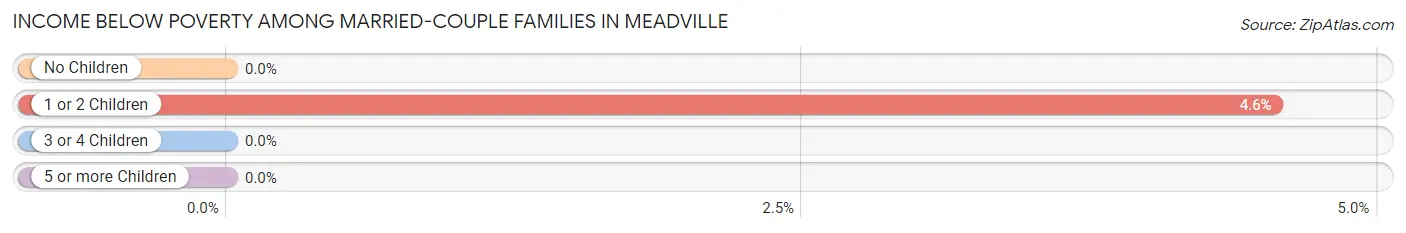
| Children | Above Poverty | Below Poverty |
| No Children | 122 (100.0%) | 0 (0.0%) |
| 1 or 2 Children | 21 (95.5%) | 1 (4.5%) |
| 3 or 4 Children | 4 (100.0%) | 0 (0.0%) |
| 5 or more Children | 0 (0.0%) | 0 (0.0%) |
| Total | 147 (99.3%) | 1 (0.7%) |
Income Below Poverty Among Single-Parent Households in Meadville
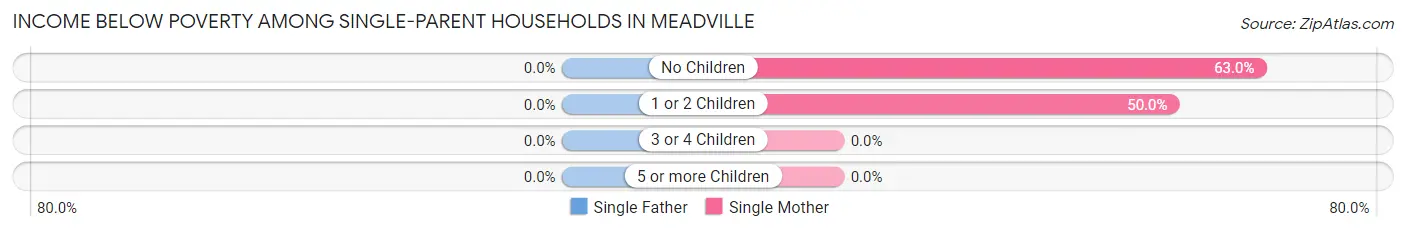
| Children | Single Father | Single Mother |
| No Children | 0 (0.0%) | 17 (63.0%) |
| 1 or 2 Children | 0 (0.0%) | 3 (50.0%) |
| 3 or 4 Children | 0 (0.0%) | 0 (0.0%) |
| 5 or more Children | 0 (0.0%) | 0 (0.0%) |
| Total | 0 (0.0%) | 20 (55.6%) |
Income Below Poverty Among Married-Couple vs Single-Parent Households in Meadville
The poverty data for Meadville shows that 1 of the married-couple family households (0.7%) and 20 of the single-parent households (44.4%) are living below the poverty level. Within the married-couple family households, those with 1 or 2 children have the highest poverty rate, with 1 households (4.5%) falling below the poverty line. Among the single-parent households, those with 1 or 2 children have the highest poverty rate, with 3 household (50.0%) living below poverty.
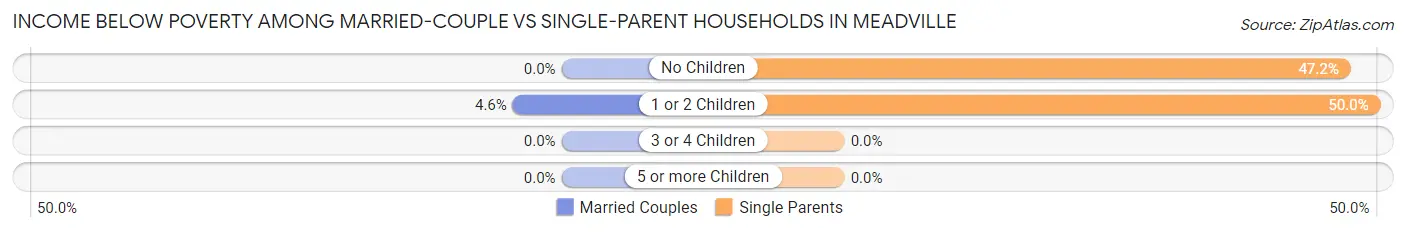
| Children | Married-Couple Families | Single-Parent Households |
| No Children | 0 (0.0%) | 17 (47.2%) |
| 1 or 2 Children | 1 (4.5%) | 3 (50.0%) |
| 3 or 4 Children | 0 (0.0%) | 0 (0.0%) |
| 5 or more Children | 0 (0.0%) | 0 (0.0%) |
| Total | 1 (0.7%) | 20 (44.4%) |
Race in Meadville
The most populous races in Meadville are White / Caucasian (579 | 83.9%), Black / African American (89 | 12.9%), and Some other Race (19 | 2.8%).
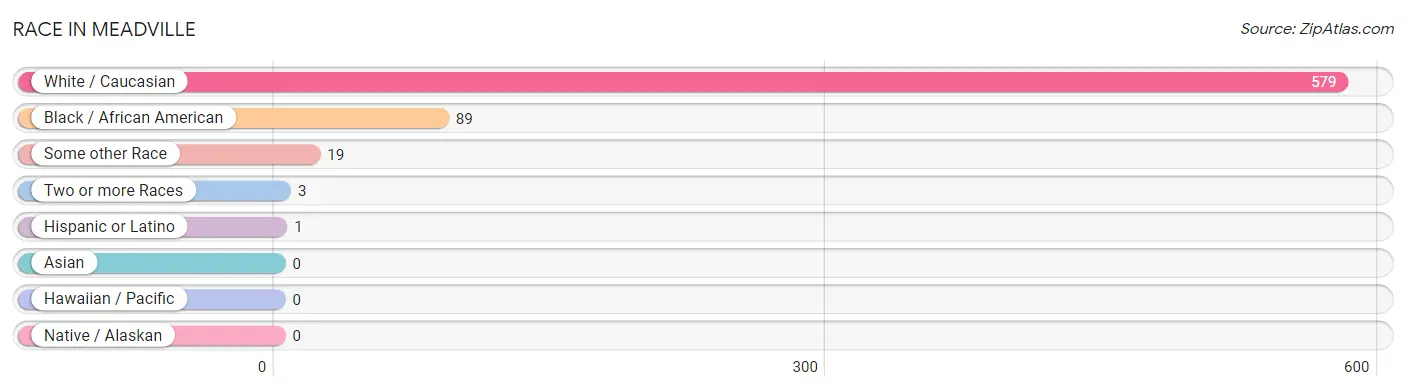
| Race | # Population | % Population |
| Asian | 0 | 0.0% |
| Black / African American | 89 | 12.9% |
| Hawaiian / Pacific | 0 | 0.0% |
| Hispanic or Latino | 1 | 0.1% |
| Native / Alaskan | 0 | 0.0% |
| White / Caucasian | 579 | 83.9% |
| Two or more Races | 3 | 0.4% |
| Some other Race | 19 | 2.8% |
| Total | 690 | 100.0% |
Ancestry in Meadville
The most populous ancestries reported in Meadville are German (85 | 12.3%), Irish (77 | 11.2%), Scotch-Irish (75 | 10.9%), English (53 | 7.7%), and American (52 | 7.5%), together accounting for 49.6% of all Meadville residents.
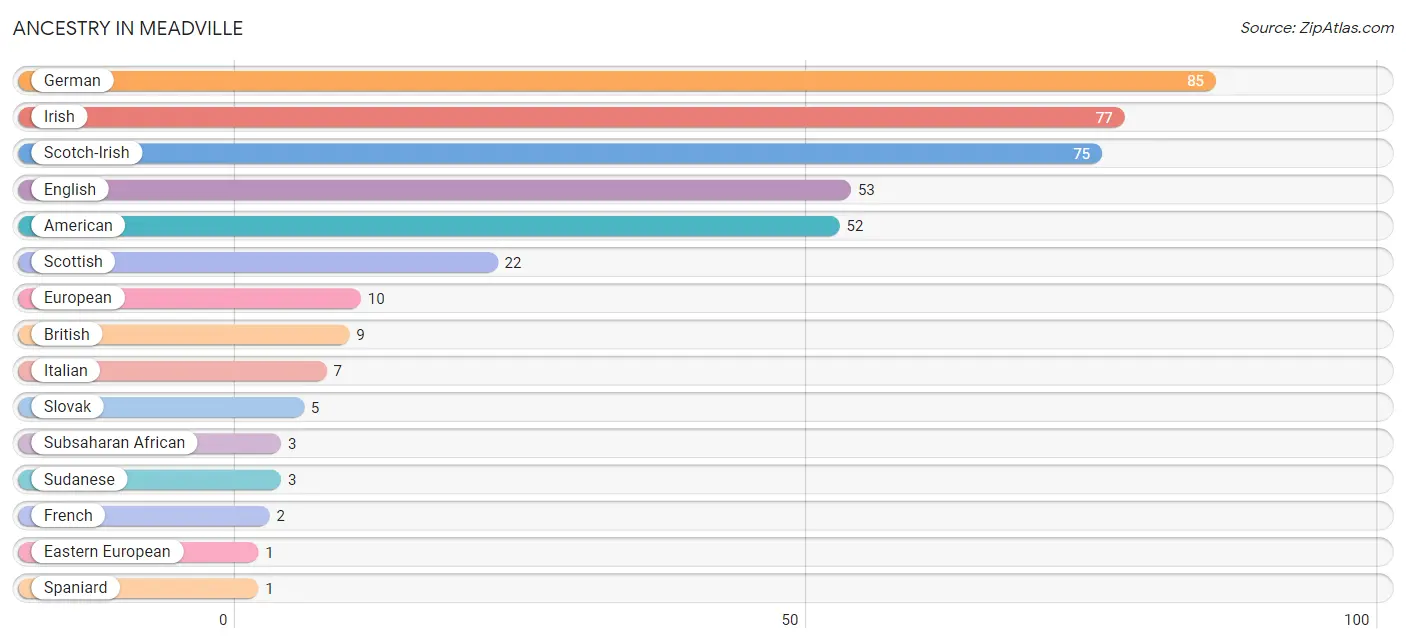
| Ancestry | # Population | % Population |
| American | 52 | 7.5% |
| British | 9 | 1.3% |
| Eastern European | 1 | 0.1% |
| English | 53 | 7.7% |
| European | 10 | 1.5% |
| French | 2 | 0.3% |
| German | 85 | 12.3% |
| Irish | 77 | 11.2% |
| Italian | 7 | 1.0% |
| Scotch-Irish | 75 | 10.9% |
| Scottish | 22 | 3.2% |
| Slovak | 5 | 0.7% |
| Spaniard | 1 | 0.1% |
| Subsaharan African | 3 | 0.4% |
| Sudanese | 3 | 0.4% | View All 15 Rows |
Immigrants in Meadville
The most numerous immigrant groups reported in Meadville came from Africa (3 | 0.4%), Northern Africa (3 | 0.4%), and Sudan (3 | 0.4%), together accounting for 1.3% of all Meadville residents.

| Immigration Origin | # Population | % Population |
| Africa | 3 | 0.4% |
| Northern Africa | 3 | 0.4% |
| Sudan | 3 | 0.4% | View All 3 Rows |
Sex and Age in Meadville
Sex and Age in Meadville
The most populous age groups in Meadville are 55 to 59 Years (66 | 17.5%) for men and 50 to 54 Years (61 | 19.4%) for women.
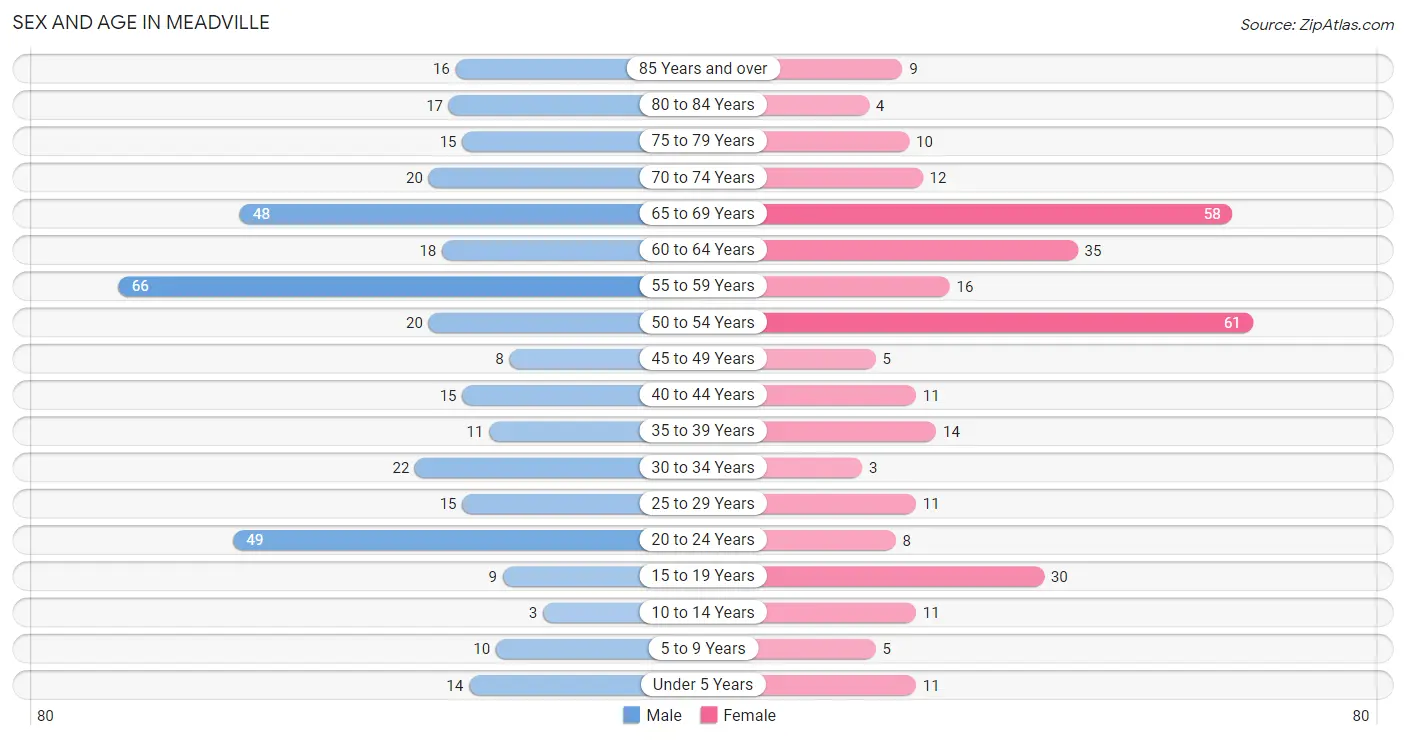
| Age Bracket | Male | Female |
| Under 5 Years | 14 (3.7%) | 11 (3.5%) |
| 5 to 9 Years | 10 (2.7%) | 5 (1.6%) |
| 10 to 14 Years | 3 (0.8%) | 11 (3.5%) |
| 15 to 19 Years | 9 (2.4%) | 30 (9.6%) |
| 20 to 24 Years | 49 (13.0%) | 8 (2.5%) |
| 25 to 29 Years | 15 (4.0%) | 11 (3.5%) |
| 30 to 34 Years | 22 (5.9%) | 3 (1.0%) |
| 35 to 39 Years | 11 (2.9%) | 14 (4.5%) |
| 40 to 44 Years | 15 (4.0%) | 11 (3.5%) |
| 45 to 49 Years | 8 (2.1%) | 5 (1.6%) |
| 50 to 54 Years | 20 (5.3%) | 61 (19.4%) |
| 55 to 59 Years | 66 (17.5%) | 16 (5.1%) |
| 60 to 64 Years | 18 (4.8%) | 35 (11.2%) |
| 65 to 69 Years | 48 (12.8%) | 58 (18.5%) |
| 70 to 74 Years | 20 (5.3%) | 12 (3.8%) |
| 75 to 79 Years | 15 (4.0%) | 10 (3.2%) |
| 80 to 84 Years | 17 (4.5%) | 4 (1.3%) |
| 85 Years and over | 16 (4.3%) | 9 (2.9%) |
| Total | 376 (100.0%) | 314 (100.0%) |
Families and Households in Meadville
Median Family Size in Meadville
The median family size in Meadville is 2.70 persons per family, with single female/mother families (36 | 18.6%) accounting for the largest median family size of 2.89 persons per family. On the other hand, single male/father families (9 | 4.7%) represent the smallest median family size with 1.56 persons per family.
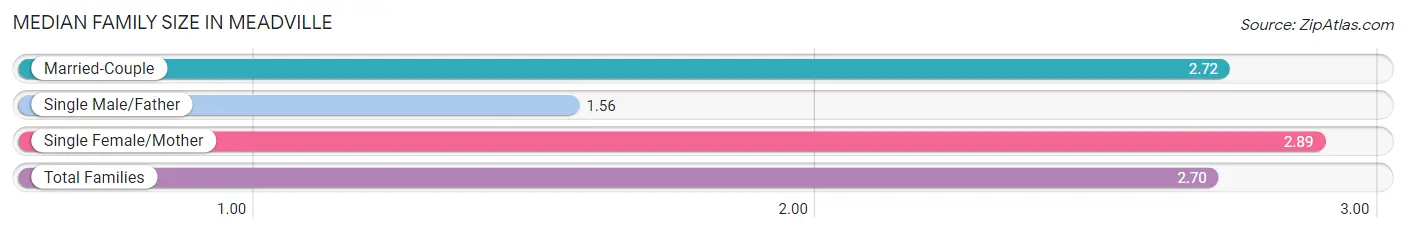
| Family Type | # Families | Family Size |
| Married-Couple | 148 (76.7%) | 2.72 |
| Single Male/Father | 9 (4.7%) | 1.56 |
| Single Female/Mother | 36 (18.6%) | 2.89 |
| Total Families | 193 (100.0%) | 2.70 |
Median Household Size in Meadville
The median household size in Meadville is 2.40 persons per household, with single female/mother households (36 | 14.3%) accounting for the largest median household size of 3 persons per household. non-family households (58 | 23.1%) represent the smallest median household size with 1.31 persons per household.
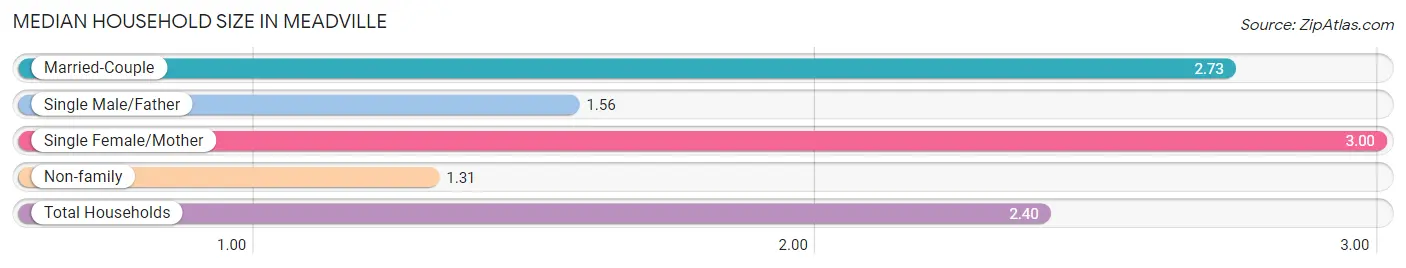
| Household Type | # Households | Household Size |
| Married-Couple | 148 (59.0%) | 2.73 |
| Single Male/Father | 9 (3.6%) | 1.56 |
| Single Female/Mother | 36 (14.3%) | 3.00 |
| Non-family | 58 (23.1%) | 1.31 |
| Total Households | 251 (100.0%) | 2.40 |
Household Size by Marriage Status in Meadville
Out of a total of 251 households in Meadville, 193 (76.9%) are family households, while 58 (23.1%) are nonfamily households. The most numerous type of family households are 2-person households, comprising 142, and the most common type of nonfamily households are 1-person households, comprising 40.
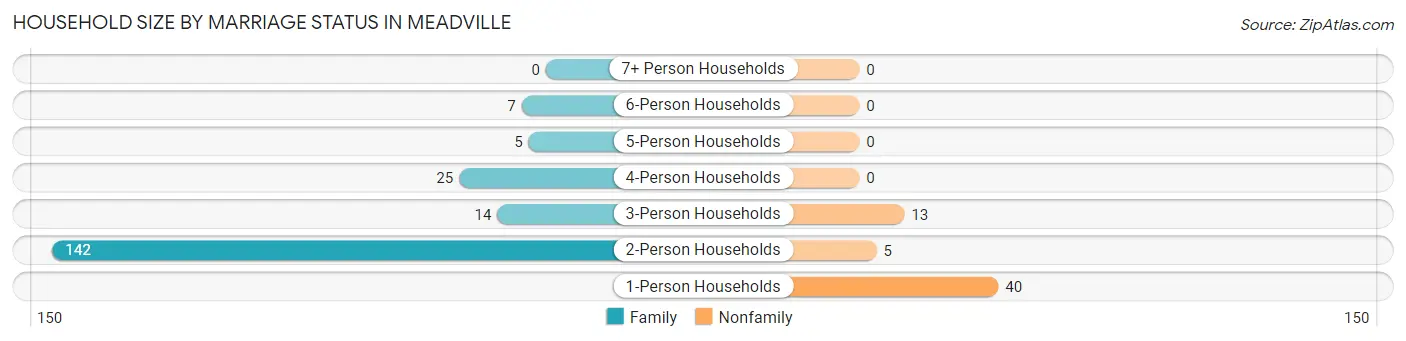
| Household Size | Family Households | Nonfamily Households |
| 1-Person Households | - | 40 (15.9%) |
| 2-Person Households | 142 (56.6%) | 5 (2.0%) |
| 3-Person Households | 14 (5.6%) | 13 (5.2%) |
| 4-Person Households | 25 (10.0%) | 0 (0.0%) |
| 5-Person Households | 5 (2.0%) | 0 (0.0%) |
| 6-Person Households | 7 (2.8%) | 0 (0.0%) |
| 7+ Person Households | 0 (0.0%) | 0 (0.0%) |
| Total | 193 (76.9%) | 58 (23.1%) |
Female Fertility in Meadville
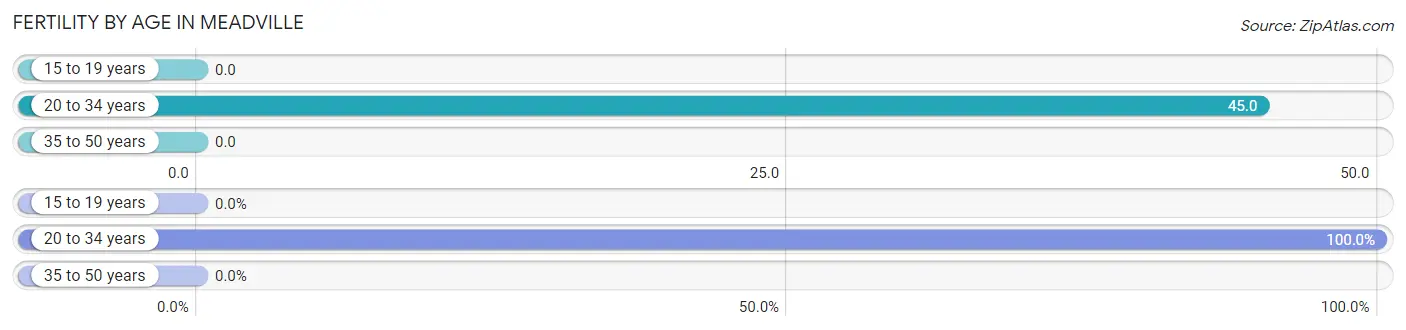
Fertility by Age in Meadville
Average fertility rate in Meadville is 12.0 births per 1,000 women. Women in the age bracket of 20 to 34 years have the highest fertility rate with 45.0 births per 1,000 women. Women in the age bracket of 20 to 34 years acount for 100.0% of all women with births.
| Age Bracket | Women with Births | Births / 1,000 Women |
| 15 to 19 years | 0 (0.0%) | 0.0 |
| 20 to 34 years | 1 (100.0%) | 45.0 |
| 35 to 50 years | 0 (0.0%) | 0.0 |
| Total | 1 (100.0%) | 12.0 |
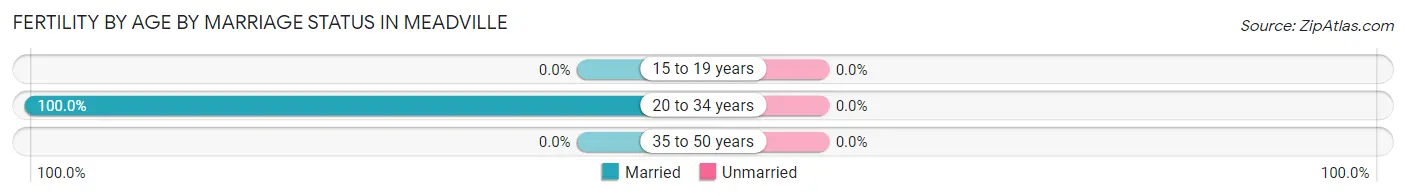
Fertility by Age by Marriage Status in Meadville
| Age Bracket | Married | Unmarried |
| 15 to 19 years | 0 (0.0%) | 0 (0.0%) |
| 20 to 34 years | 1 (100.0%) | 0 (0.0%) |
| 35 to 50 years | 0 (0.0%) | 0 (0.0%) |
| Total | 1 (100.0%) | 0 (0.0%) |
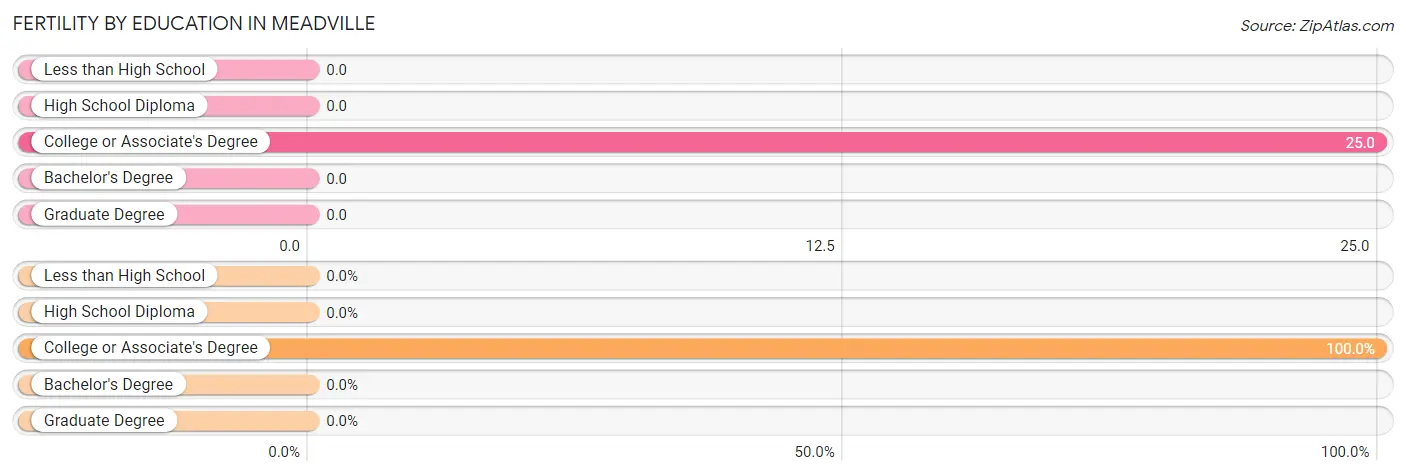
Fertility by Education in Meadville
| Educational Attainment | Women with Births | Births / 1,000 Women |
| Less than High School | 0 (0.0%) | 0.0 |
| High School Diploma | 0 (0.0%) | 0.0 |
| College or Associate's Degree | 1 (100.0%) | 25.0 |
| Bachelor's Degree | 0 (0.0%) | 0.0 |
| Graduate Degree | 0 (0.0%) | 0.0 |
| Total | 1 (100.0%) | 12.0 |
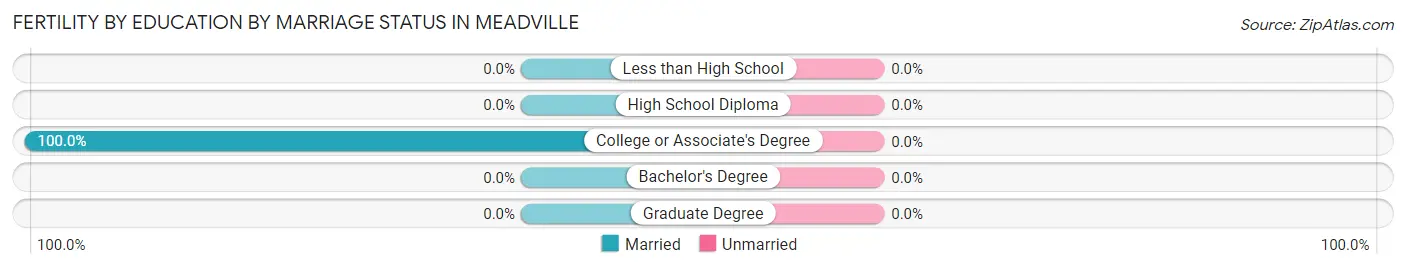
Fertility by Education by Marriage Status in Meadville
| Educational Attainment | Married | Unmarried |
| Less than High School | 0 (0.0%) | 0 (0.0%) |
| High School Diploma | 0 (0.0%) | 0 (0.0%) |
| College or Associate's Degree | 1 (100.0%) | 0 (0.0%) |
| Bachelor's Degree | 0 (0.0%) | 0 (0.0%) |
| Graduate Degree | 0 (0.0%) | 0 (0.0%) |
| Total | 1 (100.0%) | 0 (0.0%) |
Employment Characteristics in Meadville
Employment by Class of Employer in Meadville
Among the 181 employed individuals in Meadville, private company employees (105 | 58.0%), not-for-profit organizations (21 | 11.6%), and state government employees (18 | 9.9%) make up the most common classes of employment.
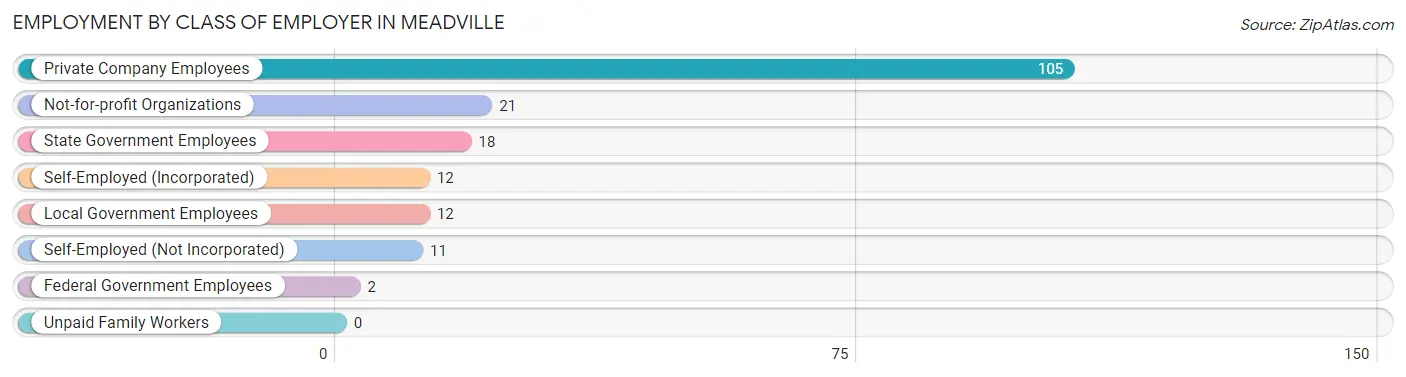
| Employer Class | # Employees | % Employees |
| Private Company Employees | 105 | 58.0% |
| Self-Employed (Incorporated) | 12 | 6.6% |
| Self-Employed (Not Incorporated) | 11 | 6.1% |
| Not-for-profit Organizations | 21 | 11.6% |
| Local Government Employees | 12 | 6.6% |
| State Government Employees | 18 | 9.9% |
| Federal Government Employees | 2 | 1.1% |
| Unpaid Family Workers | 0 | 0.0% |
| Total | 181 | 100.0% |
Employment Status by Age in Meadville
According to the labor force statistics for Meadville, out of the total population over 16 years of age (631), 29.6% or 187 individuals are in the labor force, with 1.6% or 3 of them unemployed. The age group with the highest labor force participation rate is 25 to 29 years, with 73.1% or 19 individuals in the labor force. Within the labor force, the 55 to 59 years age range has the highest percentage of unemployed individuals, with 13.0% or 3 of them being unemployed.
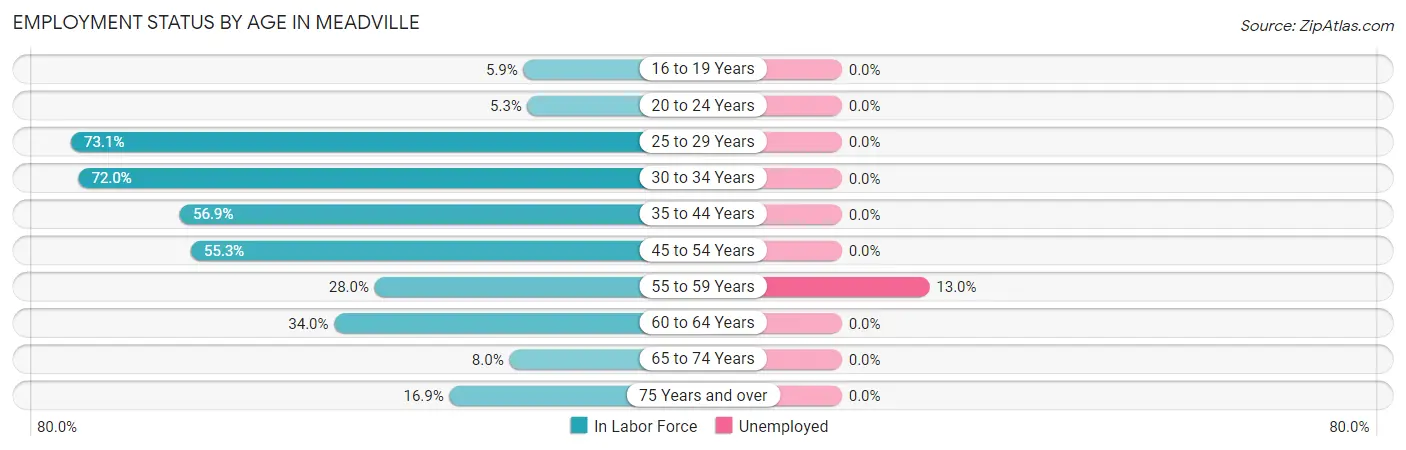
| Age Bracket | In Labor Force | Unemployed |
| 16 to 19 Years | 2 (5.9%) | 0 (0.0%) |
| 20 to 24 Years | 3 (5.3%) | 0 (0.0%) |
| 25 to 29 Years | 19 (73.1%) | 0 (0.0%) |
| 30 to 34 Years | 18 (72.0%) | 0 (0.0%) |
| 35 to 44 Years | 29 (56.9%) | 0 (0.0%) |
| 45 to 54 Years | 52 (55.3%) | 0 (0.0%) |
| 55 to 59 Years | 23 (28.0%) | 3 (13.0%) |
| 60 to 64 Years | 18 (34.0%) | 0 (0.0%) |
| 65 to 74 Years | 11 (8.0%) | 0 (0.0%) |
| 75 Years and over | 12 (16.9%) | 0 (0.0%) |
| Total | 187 (29.6%) | 3 (1.6%) |
Employment Status by Educational Attainment in Meadville
According to labor force statistics for Meadville, 48.0% of individuals (159) out of the total population between 25 and 64 years of age (331) are in the labor force, with 1.9% or 3 of them being unemployed. The group with the highest labor force participation rate are those with the educational attainment of bachelor's degree or higher, with 93.1% or 27 individuals in the labor force. Within the labor force, individuals with bachelor's degree or higher education have the highest percentage of unemployment, with 11.1% or 3 of them being unemployed.
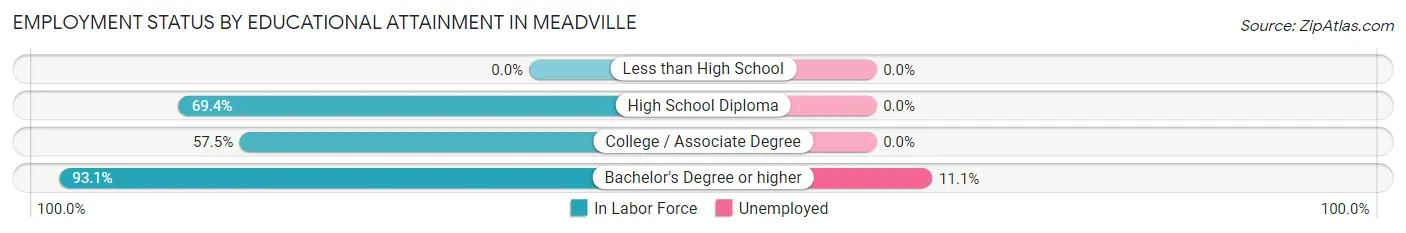
| Educational Attainment | In Labor Force | Unemployed |
| Less than High School | 0 (0.0%) | 0 (0.0%) |
| High School Diploma | 59 (69.4%) | 0 (0.0%) |
| College / Associate Degree | 73 (57.5%) | 0 (0.0%) |
| Bachelor's Degree or higher | 27 (93.1%) | 3 (11.1%) |
| Total | 159 (48.0%) | 6 (1.9%) |
Employment Occupations by Sex in Meadville
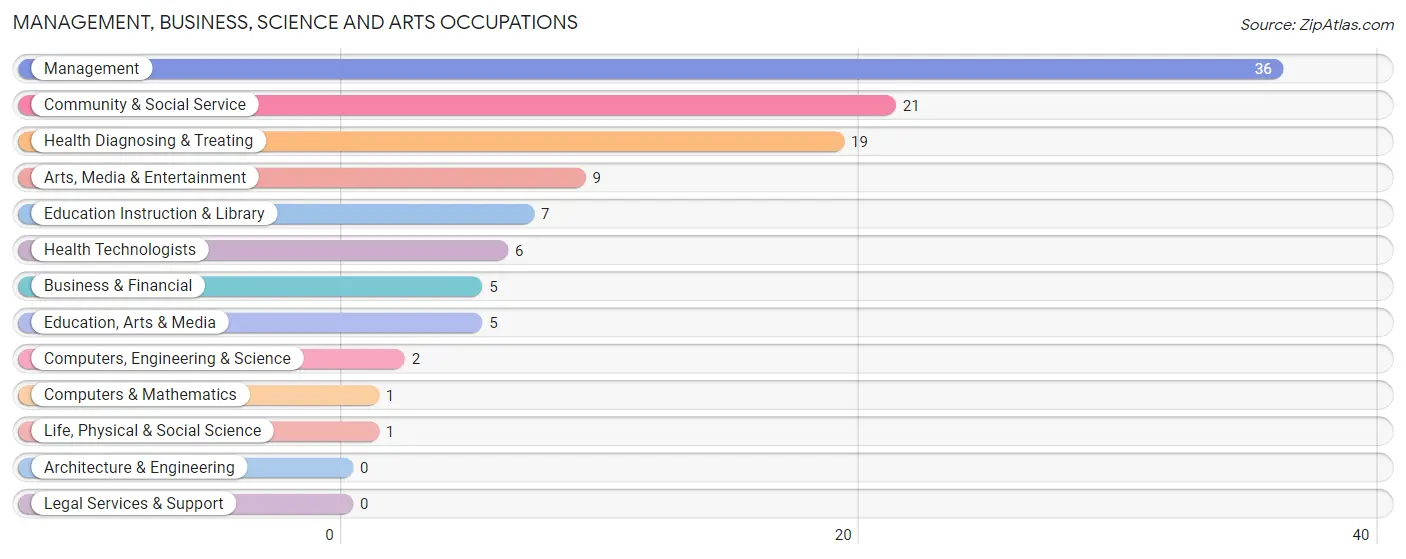
Management, Business, Science and Arts Occupations
The most common Management, Business, Science and Arts occupations in Meadville are Management (36 | 19.6%), Community & Social Service (21 | 11.4%), Health Diagnosing & Treating (19 | 10.3%), Arts, Media & Entertainment (9 | 4.9%), and Education Instruction & Library (7 | 3.8%).
Management, Business, Science and Arts Occupations by Sex
Within the Management, Business, Science and Arts occupations in Meadville, the most male-oriented occupations are Business & Financial (100.0%), Computers, Engineering & Science (100.0%), and Computers & Mathematics (100.0%), while the most female-oriented occupations are Education, Arts & Media (60.0%), Education Instruction & Library (57.1%), and Health Diagnosing & Treating (52.6%).
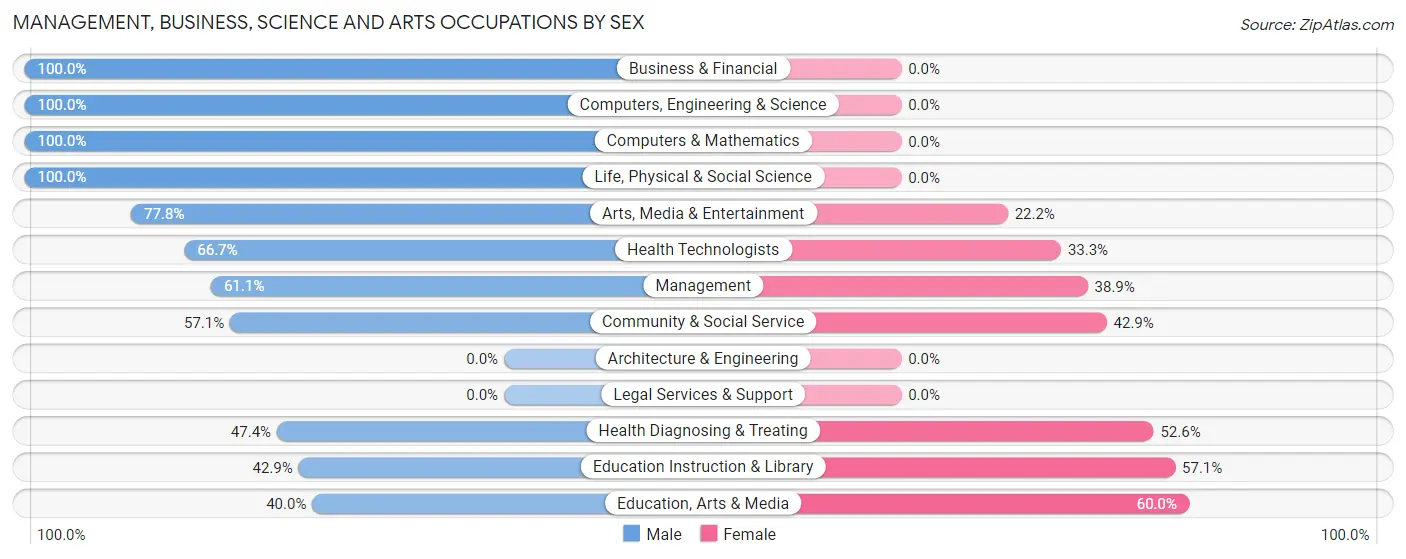
| Occupation | Male | Female |
| Management | 22 (61.1%) | 14 (38.9%) |
| Business & Financial | 5 (100.0%) | 0 (0.0%) |
| Computers, Engineering & Science | 2 (100.0%) | 0 (0.0%) |
| Computers & Mathematics | 1 (100.0%) | 0 (0.0%) |
| Architecture & Engineering | 0 (0.0%) | 0 (0.0%) |
| Life, Physical & Social Science | 1 (100.0%) | 0 (0.0%) |
| Community & Social Service | 12 (57.1%) | 9 (42.9%) |
| Education, Arts & Media | 2 (40.0%) | 3 (60.0%) |
| Legal Services & Support | 0 (0.0%) | 0 (0.0%) |
| Education Instruction & Library | 3 (42.9%) | 4 (57.1%) |
| Arts, Media & Entertainment | 7 (77.8%) | 2 (22.2%) |
| Health Diagnosing & Treating | 9 (47.4%) | 10 (52.6%) |
| Health Technologists | 4 (66.7%) | 2 (33.3%) |
| Total (Category) | 50 (60.2%) | 33 (39.8%) |
| Total (Overall) | 74 (40.2%) | 110 (59.8%) |
Services Occupations
The most common Services occupations in Meadville are Healthcare Support (3 | 1.6%), Personal Care & Service (2 | 1.1%), Security & Protection (1 | 0.5%), and Firefighting & Prevention (1 | 0.5%).
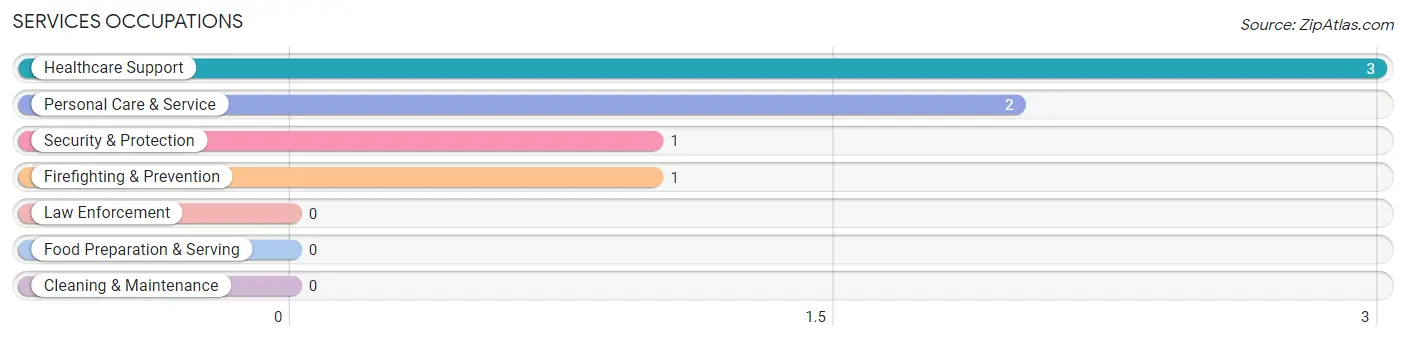
Services Occupations by Sex
Within the Services occupations in Meadville, the most male-oriented occupations are Security & Protection (100.0%), and Firefighting & Prevention (100.0%), while the most female-oriented occupations are Healthcare Support (100.0%), and Personal Care & Service (100.0%).
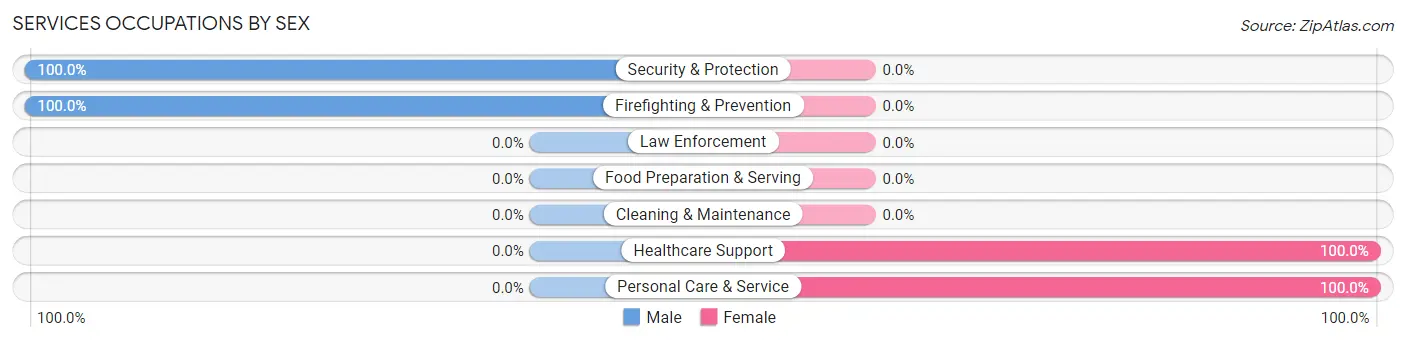
| Occupation | Male | Female |
| Healthcare Support | 0 (0.0%) | 3 (100.0%) |
| Security & Protection | 1 (100.0%) | 0 (0.0%) |
| Firefighting & Prevention | 1 (100.0%) | 0 (0.0%) |
| Law Enforcement | 0 (0.0%) | 0 (0.0%) |
| Food Preparation & Serving | 0 (0.0%) | 0 (0.0%) |
| Cleaning & Maintenance | 0 (0.0%) | 0 (0.0%) |
| Personal Care & Service | 0 (0.0%) | 2 (100.0%) |
| Total (Category) | 1 (16.7%) | 5 (83.3%) |
| Total (Overall) | 74 (40.2%) | 110 (59.8%) |
Sales and Office Occupations
The most common Sales and Office occupations in Meadville are Office & Administration (67 | 36.4%), and Sales & Related (6 | 3.3%).
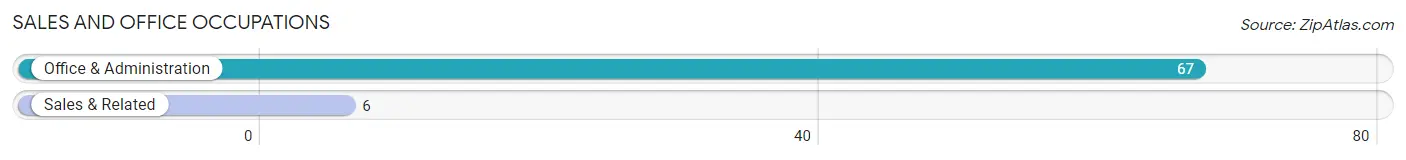
Sales and Office Occupations by Sex
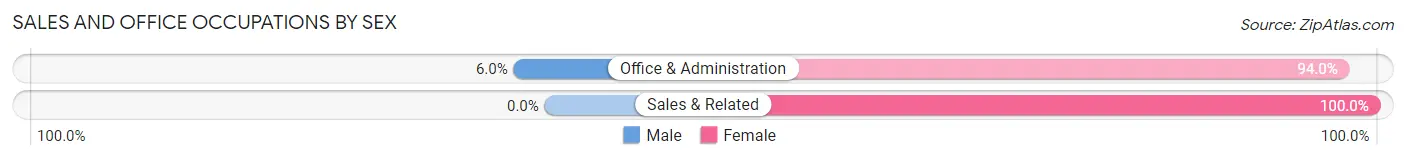
| Occupation | Male | Female |
| Sales & Related | 0 (0.0%) | 6 (100.0%) |
| Office & Administration | 4 (6.0%) | 63 (94.0%) |
| Total (Category) | 4 (5.5%) | 69 (94.5%) |
| Total (Overall) | 74 (40.2%) | 110 (59.8%) |
Natural Resources, Construction and Maintenance Occupations
The most common Natural Resources, Construction and Maintenance occupations in Meadville are Construction & Extraction (11 | 6.0%), and Installation, Maintenance & Repair (2 | 1.1%).

Natural Resources, Construction and Maintenance Occupations by Sex

| Occupation | Male | Female |
| Farming, Fishing & Forestry | 0 (0.0%) | 0 (0.0%) |
| Construction & Extraction | 11 (100.0%) | 0 (0.0%) |
| Installation, Maintenance & Repair | 2 (100.0%) | 0 (0.0%) |
| Total (Category) | 13 (100.0%) | 0 (0.0%) |
| Total (Overall) | 74 (40.2%) | 110 (59.8%) |
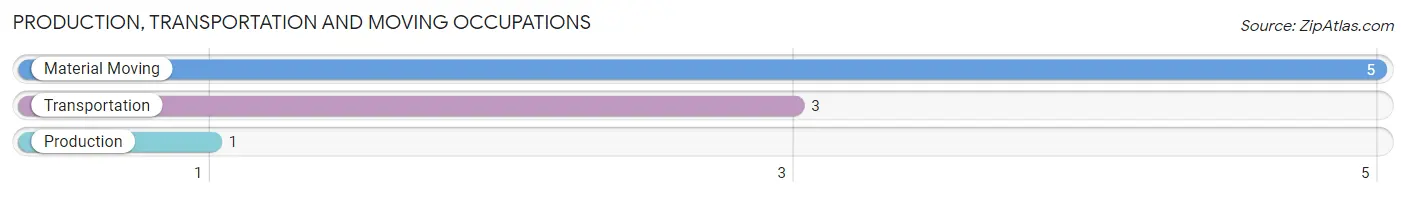
Production, Transportation and Moving Occupations
The most common Production, Transportation and Moving occupations in Meadville are Material Moving (5 | 2.7%), Transportation (3 | 1.6%), and Production (1 | 0.5%).
Production, Transportation and Moving Occupations by Sex
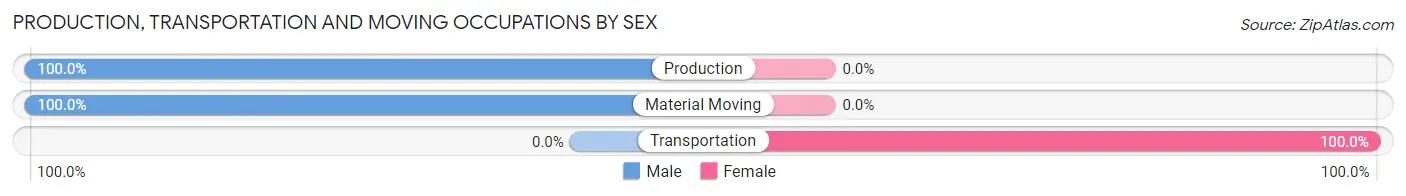
| Occupation | Male | Female |
| Production | 1 (100.0%) | 0 (0.0%) |
| Transportation | 0 (0.0%) | 3 (100.0%) |
| Material Moving | 5 (100.0%) | 0 (0.0%) |
| Total (Category) | 6 (66.7%) | 3 (33.3%) |
| Total (Overall) | 74 (40.2%) | 110 (59.8%) |
Employment Industries by Sex in Meadville
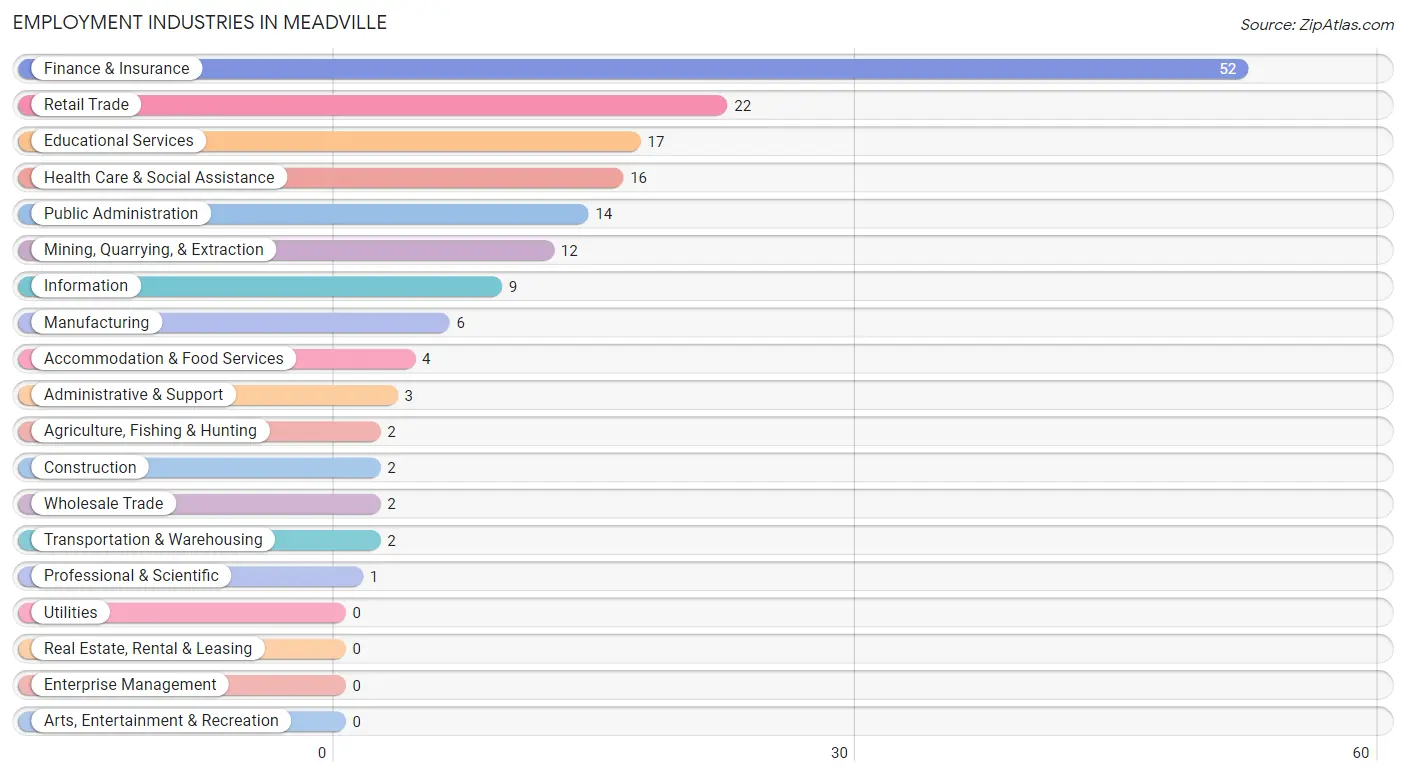
Employment Industries in Meadville
The major employment industries in Meadville include Finance & Insurance (52 | 28.3%), Retail Trade (22 | 12.0%), Educational Services (17 | 9.2%), Health Care & Social Assistance (16 | 8.7%), and Public Administration (14 | 7.6%).
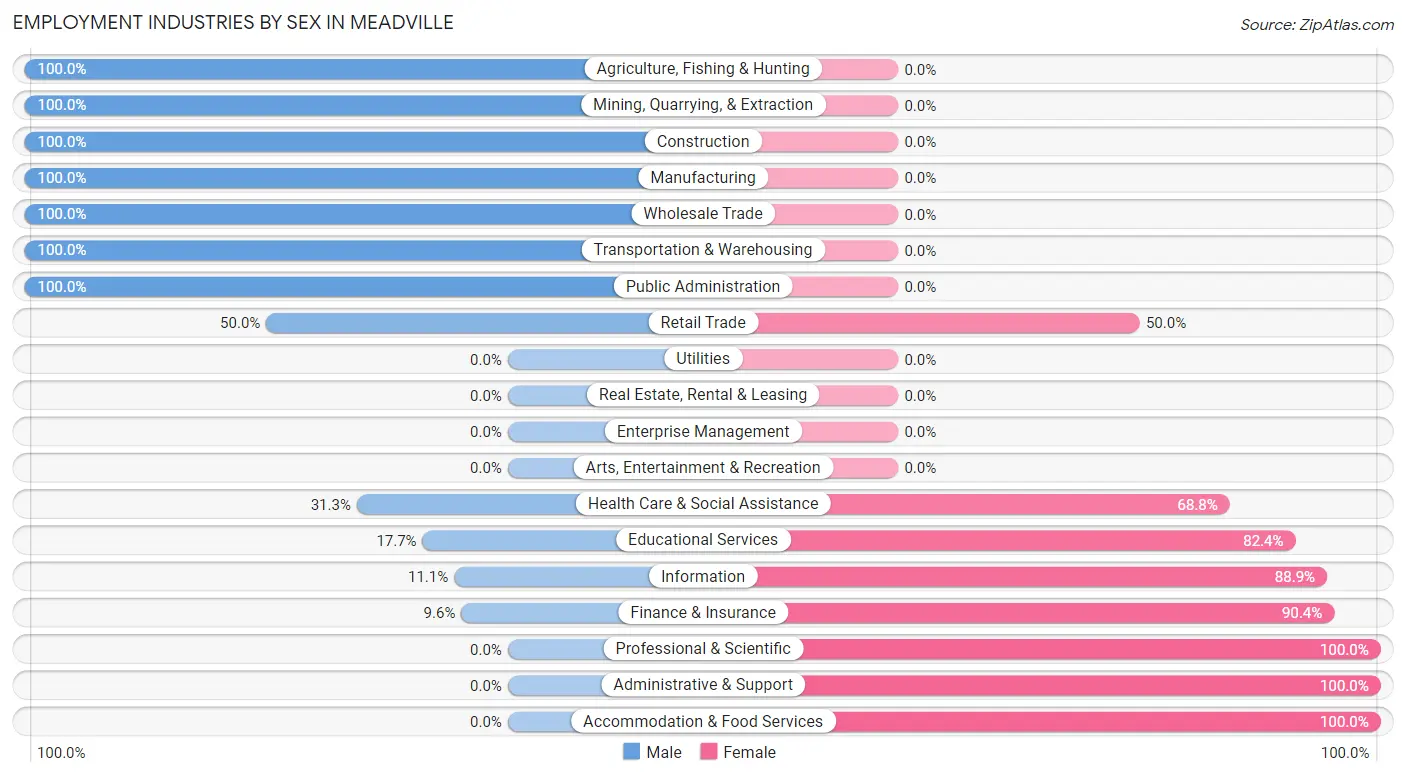
Employment Industries by Sex in Meadville
The Meadville industries that see more men than women are Agriculture, Fishing & Hunting (100.0%), Mining, Quarrying, & Extraction (100.0%), and Construction (100.0%), whereas the industries that tend to have a higher number of women are Professional & Scientific (100.0%), Administrative & Support (100.0%), and Accommodation & Food Services (100.0%).
| Industry | Male | Female |
| Agriculture, Fishing & Hunting | 2 (100.0%) | 0 (0.0%) |
| Mining, Quarrying, & Extraction | 12 (100.0%) | 0 (0.0%) |
| Construction | 2 (100.0%) | 0 (0.0%) |
| Manufacturing | 6 (100.0%) | 0 (0.0%) |
| Wholesale Trade | 2 (100.0%) | 0 (0.0%) |
| Retail Trade | 11 (50.0%) | 11 (50.0%) |
| Transportation & Warehousing | 2 (100.0%) | 0 (0.0%) |
| Utilities | 0 (0.0%) | 0 (0.0%) |
| Information | 1 (11.1%) | 8 (88.9%) |
| Finance & Insurance | 5 (9.6%) | 47 (90.4%) |
| Real Estate, Rental & Leasing | 0 (0.0%) | 0 (0.0%) |
| Professional & Scientific | 0 (0.0%) | 1 (100.0%) |
| Enterprise Management | 0 (0.0%) | 0 (0.0%) |
| Administrative & Support | 0 (0.0%) | 3 (100.0%) |
| Educational Services | 3 (17.6%) | 14 (82.4%) |
| Health Care & Social Assistance | 5 (31.2%) | 11 (68.8%) |
| Arts, Entertainment & Recreation | 0 (0.0%) | 0 (0.0%) |
| Accommodation & Food Services | 0 (0.0%) | 4 (100.0%) |
| Public Administration | 14 (100.0%) | 0 (0.0%) |
| Total | 74 (40.2%) | 110 (59.8%) |
Education in Meadville
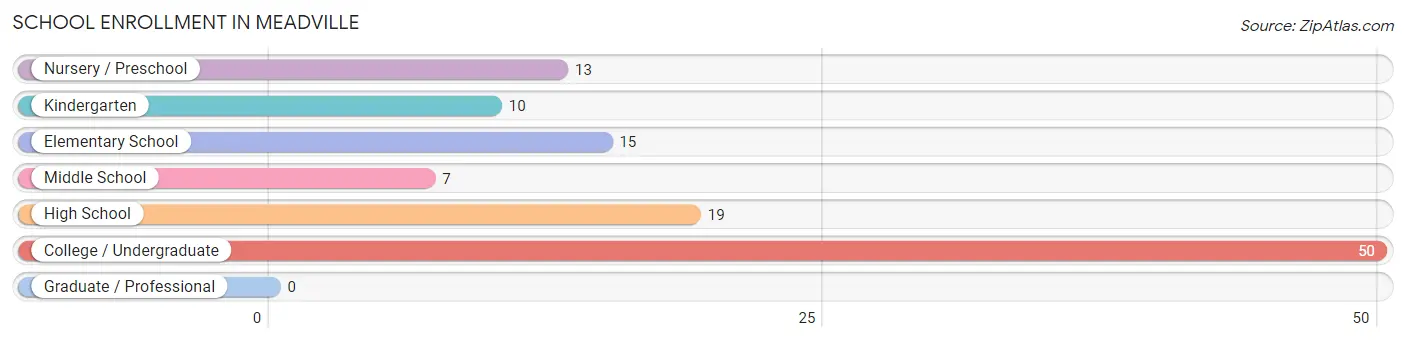
School Enrollment in Meadville
The most common levels of schooling among the 114 students in Meadville are college / undergraduate (50 | 43.9%), high school (19 | 16.7%), and elementary school (15 | 13.2%).
| School Level | # Students | % Students |
| Nursery / Preschool | 13 | 11.4% |
| Kindergarten | 10 | 8.8% |
| Elementary School | 15 | 13.2% |
| Middle School | 7 | 6.1% |
| High School | 19 | 16.7% |
| College / Undergraduate | 50 | 43.9% |
| Graduate / Professional | 0 | 0.0% |
| Total | 114 | 100.0% |
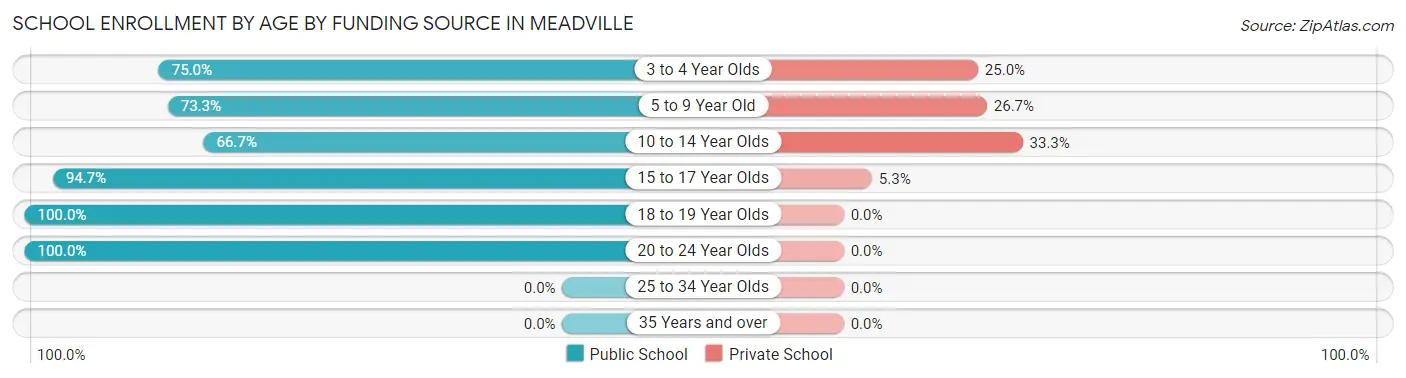
School Enrollment by Age by Funding Source in Meadville
Out of a total of 114 students who are enrolled in schools in Meadville, 13 (11.4%) attend a private institution, while the remaining 101 (88.6%) are enrolled in public schools. The age group of 10 to 14 year olds has the highest likelihood of being enrolled in private schools, with 4 (33.3% in the age bracket) enrolled. Conversely, the age group of 18 to 19 year olds has the lowest likelihood of being enrolled in a private school, with 19 (100.0% in the age bracket) attending a public institution.
| Age Bracket | Public School | Private School |
| 3 to 4 Year Olds | 12 (75.0%) | 4 (25.0%) |
| 5 to 9 Year Old | 11 (73.3%) | 4 (26.7%) |
| 10 to 14 Year Olds | 8 (66.7%) | 4 (33.3%) |
| 15 to 17 Year Olds | 18 (94.7%) | 1 (5.3%) |
| 18 to 19 Year Olds | 19 (100.0%) | 0 (0.0%) |
| 20 to 24 Year Olds | 33 (100.0%) | 0 (0.0%) |
| 25 to 34 Year Olds | 0 (0.0%) | 0 (0.0%) |
| 35 Years and over | 0 (0.0%) | 0 (0.0%) |
| Total | 101 (88.6%) | 13 (11.4%) |
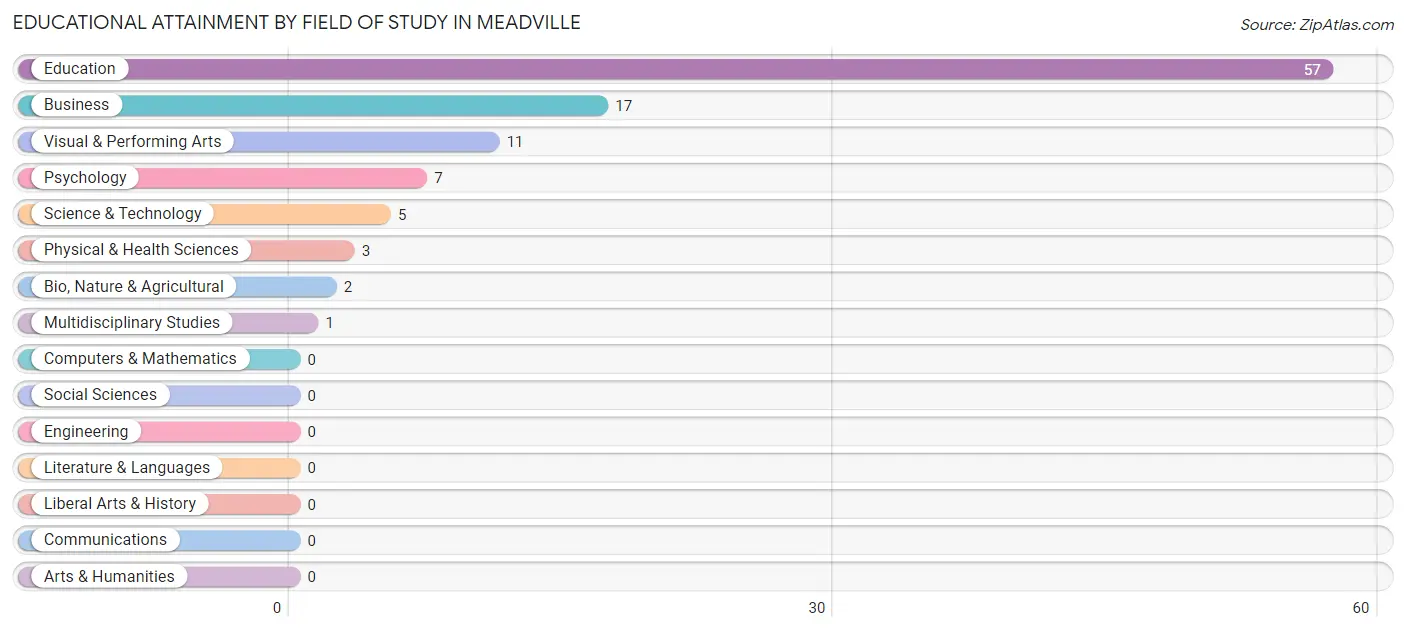
Educational Attainment by Field of Study in Meadville
Education (57 | 55.3%), business (17 | 16.5%), visual & performing arts (11 | 10.7%), psychology (7 | 6.8%), and science & technology (5 | 4.9%) are the most common fields of study among 103 individuals in Meadville who have obtained a bachelor's degree or higher.
| Field of Study | # Graduates | % Graduates |
| Computers & Mathematics | 0 | 0.0% |
| Bio, Nature & Agricultural | 2 | 1.9% |
| Physical & Health Sciences | 3 | 2.9% |
| Psychology | 7 | 6.8% |
| Social Sciences | 0 | 0.0% |
| Engineering | 0 | 0.0% |
| Multidisciplinary Studies | 1 | 1.0% |
| Science & Technology | 5 | 4.9% |
| Business | 17 | 16.5% |
| Education | 57 | 55.3% |
| Literature & Languages | 0 | 0.0% |
| Liberal Arts & History | 0 | 0.0% |
| Visual & Performing Arts | 11 | 10.7% |
| Communications | 0 | 0.0% |
| Arts & Humanities | 0 | 0.0% |
| Total | 103 | 100.0% |
Transportation & Commute in Meadville
Vehicle Availability by Sex in Meadville
The most prevalent vehicle ownership categories in Meadville are males with 2 vehicles (43, accounting for 58.1%) and females with 2 vehicles (65, making up 40.2%).
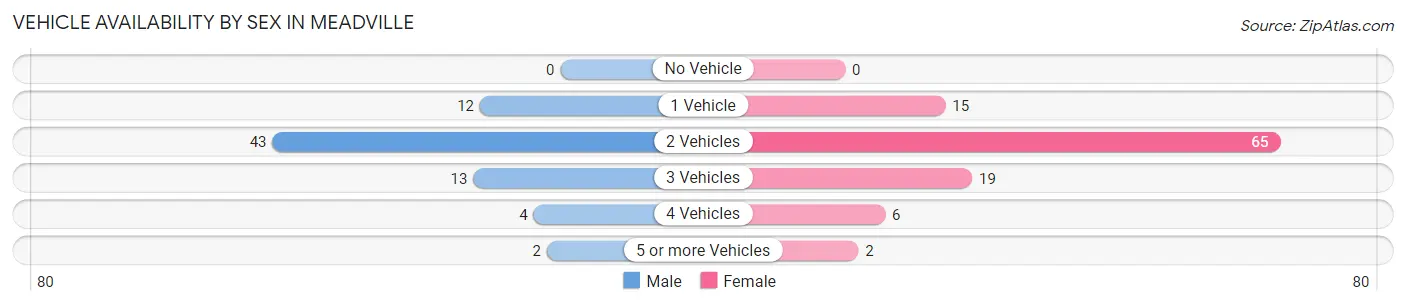
| Vehicles Available | Male | Female |
| No Vehicle | 0 (0.0%) | 0 (0.0%) |
| 1 Vehicle | 12 (16.2%) | 15 (14.0%) |
| 2 Vehicles | 43 (58.1%) | 65 (60.8%) |
| 3 Vehicles | 13 (17.6%) | 19 (17.8%) |
| 4 Vehicles | 4 (5.4%) | 6 (5.6%) |
| 5 or more Vehicles | 2 (2.7%) | 2 (1.9%) |
| Total | 74 (100.0%) | 107 (100.0%) |
Commute Time in Meadville
The most frequently occuring commute durations in Meadville are 5 to 9 minutes (75 commuters, 44.4%), 45 to 59 minutes (27 commuters, 16.0%), and less than 5 minutes (26 commuters, 15.4%).
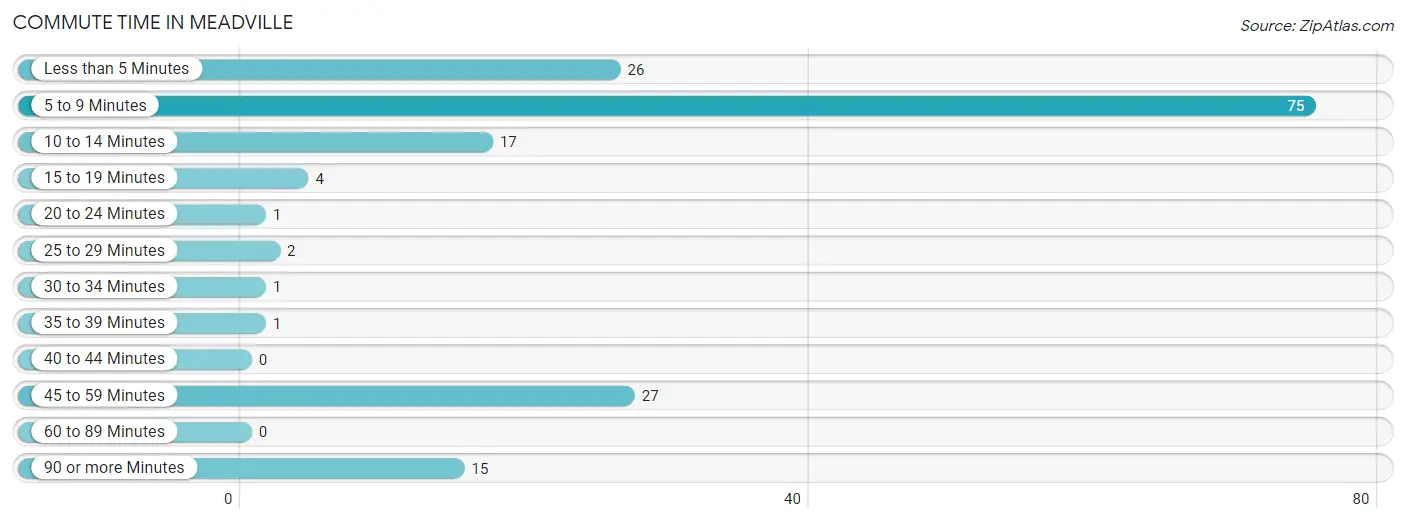
| Commute Time | # Commuters | % Commuters |
| Less than 5 Minutes | 26 | 15.4% |
| 5 to 9 Minutes | 75 | 44.4% |
| 10 to 14 Minutes | 17 | 10.1% |
| 15 to 19 Minutes | 4 | 2.4% |
| 20 to 24 Minutes | 1 | 0.6% |
| 25 to 29 Minutes | 2 | 1.2% |
| 30 to 34 Minutes | 1 | 0.6% |
| 35 to 39 Minutes | 1 | 0.6% |
| 40 to 44 Minutes | 0 | 0.0% |
| 45 to 59 Minutes | 27 | 16.0% |
| 60 to 89 Minutes | 0 | 0.0% |
| 90 or more Minutes | 15 | 8.9% |
Commute Time by Sex in Meadville
The most common commute times in Meadville are 5 to 9 minutes (24 commuters, 32.4%) for males and 5 to 9 minutes (51 commuters, 53.7%) for females.
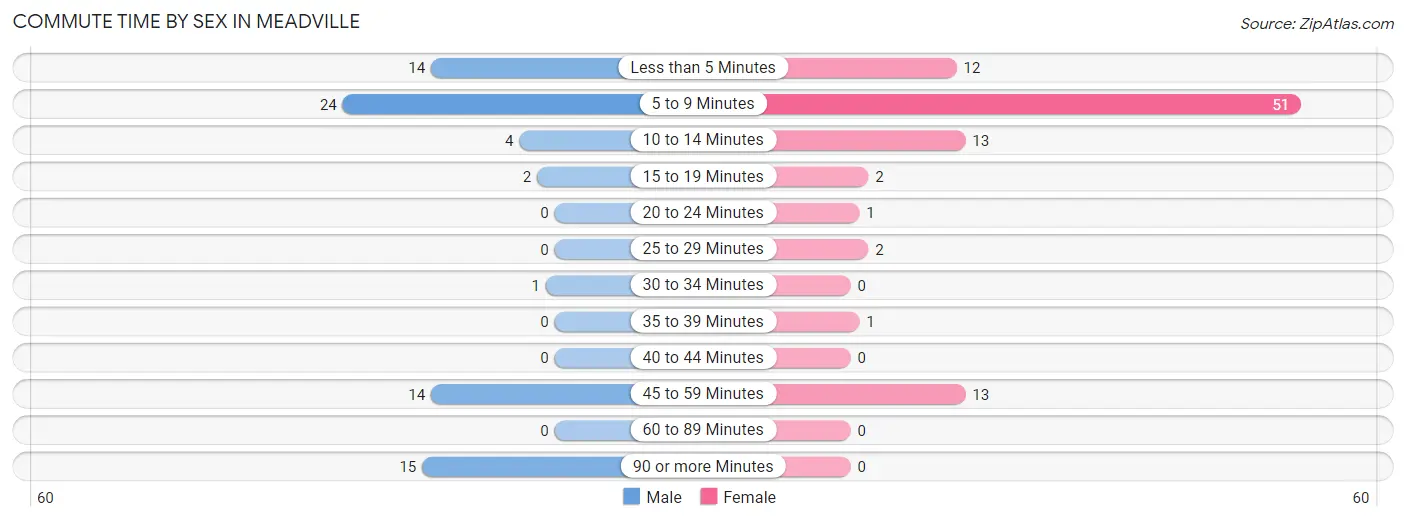
| Commute Time | Male | Female |
| Less than 5 Minutes | 14 (18.9%) | 12 (12.6%) |
| 5 to 9 Minutes | 24 (32.4%) | 51 (53.7%) |
| 10 to 14 Minutes | 4 (5.4%) | 13 (13.7%) |
| 15 to 19 Minutes | 2 (2.7%) | 2 (2.1%) |
| 20 to 24 Minutes | 0 (0.0%) | 1 (1.1%) |
| 25 to 29 Minutes | 0 (0.0%) | 2 (2.1%) |
| 30 to 34 Minutes | 1 (1.3%) | 0 (0.0%) |
| 35 to 39 Minutes | 0 (0.0%) | 1 (1.1%) |
| 40 to 44 Minutes | 0 (0.0%) | 0 (0.0%) |
| 45 to 59 Minutes | 14 (18.9%) | 13 (13.7%) |
| 60 to 89 Minutes | 0 (0.0%) | 0 (0.0%) |
| 90 or more Minutes | 15 (20.3%) | 0 (0.0%) |
Time of Departure to Work by Sex in Meadville
The most frequent times of departure to work in Meadville are 12:00 AM to 4:59 AM (31, 41.9%) for males and 7:30 AM to 7:59 AM (57, 60.0%) for females.
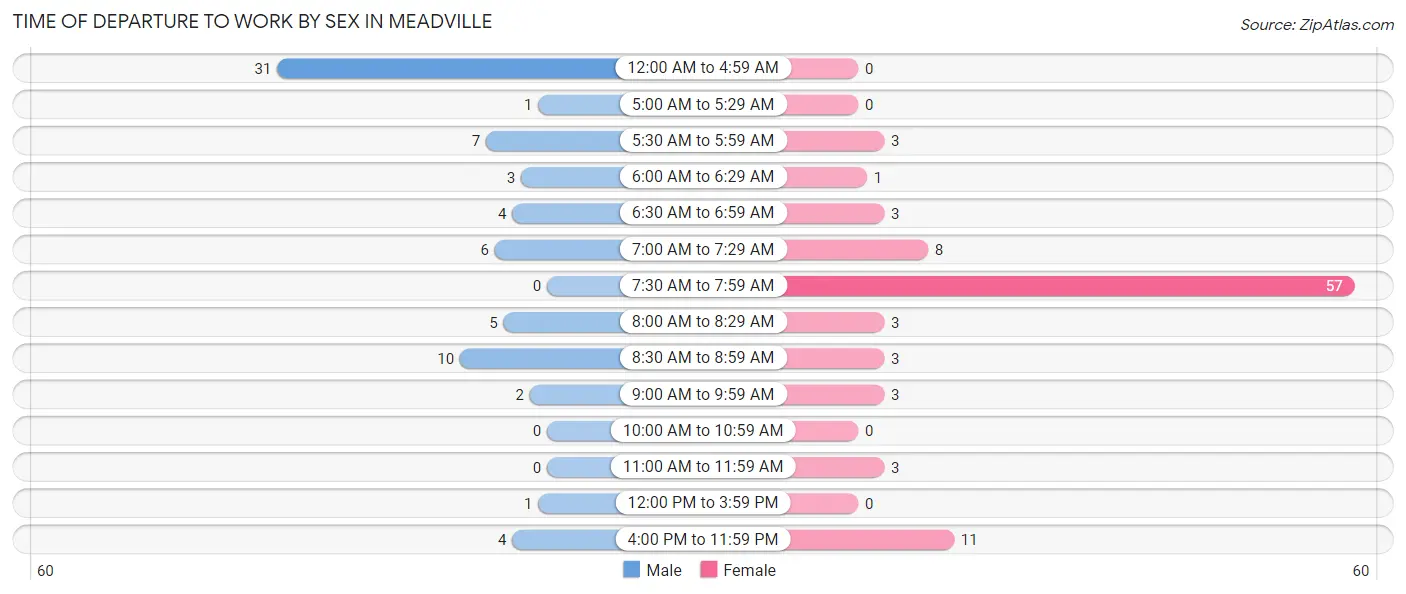
| Time of Departure | Male | Female |
| 12:00 AM to 4:59 AM | 31 (41.9%) | 0 (0.0%) |
| 5:00 AM to 5:29 AM | 1 (1.3%) | 0 (0.0%) |
| 5:30 AM to 5:59 AM | 7 (9.5%) | 3 (3.2%) |
| 6:00 AM to 6:29 AM | 3 (4.1%) | 1 (1.1%) |
| 6:30 AM to 6:59 AM | 4 (5.4%) | 3 (3.2%) |
| 7:00 AM to 7:29 AM | 6 (8.1%) | 8 (8.4%) |
| 7:30 AM to 7:59 AM | 0 (0.0%) | 57 (60.0%) |
| 8:00 AM to 8:29 AM | 5 (6.8%) | 3 (3.2%) |
| 8:30 AM to 8:59 AM | 10 (13.5%) | 3 (3.2%) |
| 9:00 AM to 9:59 AM | 2 (2.7%) | 3 (3.2%) |
| 10:00 AM to 10:59 AM | 0 (0.0%) | 0 (0.0%) |
| 11:00 AM to 11:59 AM | 0 (0.0%) | 3 (3.2%) |
| 12:00 PM to 3:59 PM | 1 (1.3%) | 0 (0.0%) |
| 4:00 PM to 11:59 PM | 4 (5.4%) | 11 (11.6%) |
| Total | 74 (100.0%) | 95 (100.0%) |
Housing Occupancy in Meadville
Occupancy by Ownership in Meadville
Of the total 251 dwellings in Meadville, owner-occupied units account for 219 (87.3%), while renter-occupied units make up 32 (12.8%).
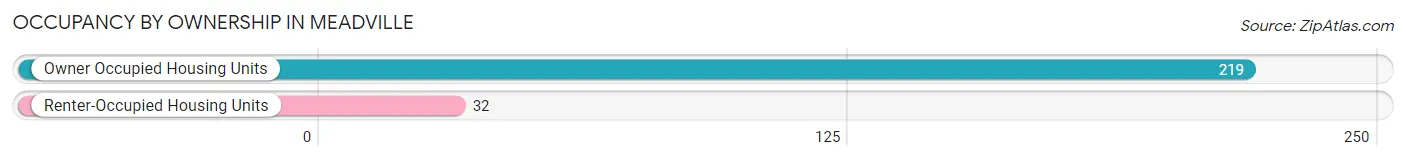
| Occupancy | # Housing Units | % Housing Units |
| Owner Occupied Housing Units | 219 | 87.3% |
| Renter-Occupied Housing Units | 32 | 12.8% |
| Total Occupied Housing Units | 251 | 100.0% |
Occupancy by Household Size in Meadville
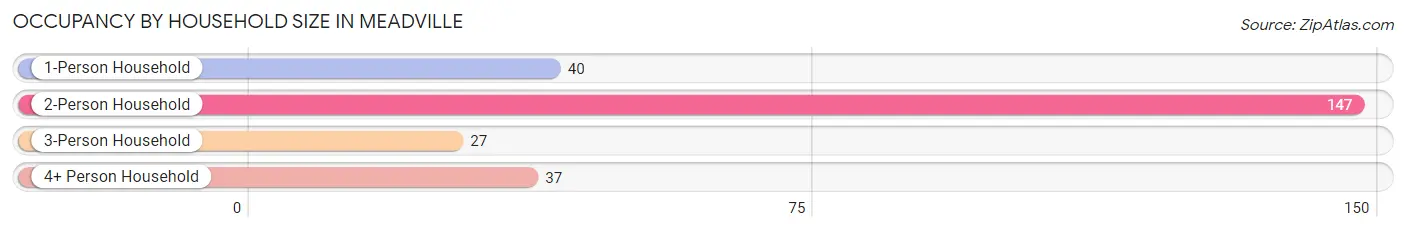
| Household Size | # Housing Units | % Housing Units |
| 1-Person Household | 40 | 15.9% |
| 2-Person Household | 147 | 58.6% |
| 3-Person Household | 27 | 10.8% |
| 4+ Person Household | 37 | 14.7% |
| Total Housing Units | 251 | 100.0% |
Occupancy by Ownership by Household Size in Meadville
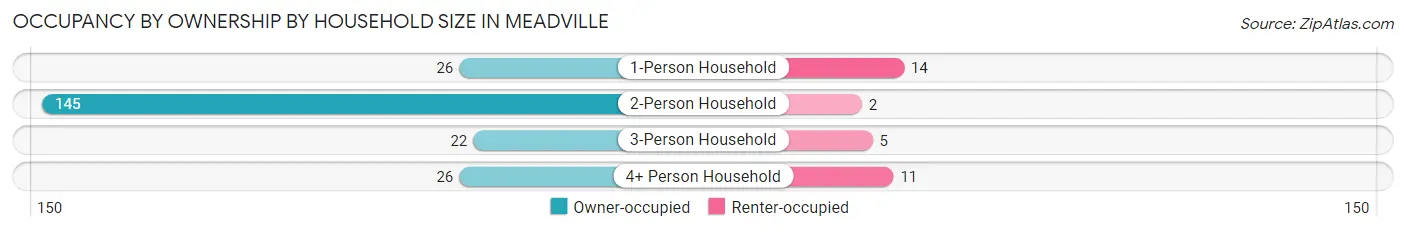
| Household Size | Owner-occupied | Renter-occupied |
| 1-Person Household | 26 (65.0%) | 14 (35.0%) |
| 2-Person Household | 145 (98.6%) | 2 (1.4%) |
| 3-Person Household | 22 (81.5%) | 5 (18.5%) |
| 4+ Person Household | 26 (70.3%) | 11 (29.7%) |
| Total Housing Units | 219 (87.3%) | 32 (12.8%) |
Occupancy by Educational Attainment in Meadville
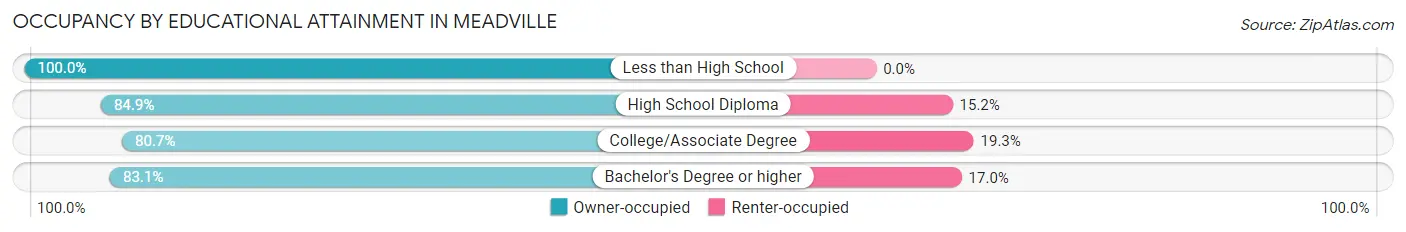
| Household Size | Owner-occupied | Renter-occupied |
| Less than High School | 71 (100.0%) | 0 (0.0%) |
| High School Diploma | 28 (84.9%) | 5 (15.1%) |
| College/Associate Degree | 71 (80.7%) | 17 (19.3%) |
| Bachelor's Degree or higher | 49 (83.1%) | 10 (17.0%) |
Occupancy by Age of Householder in Meadville
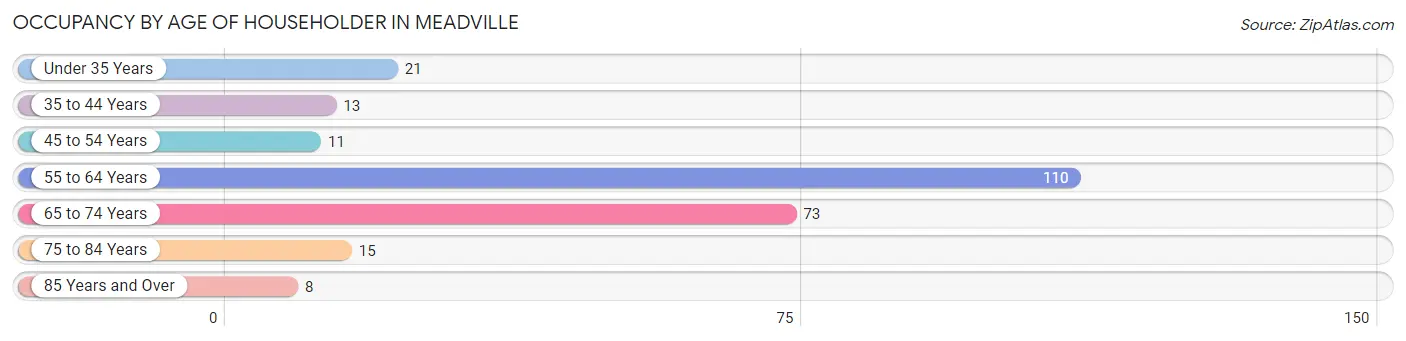
| Age Bracket | # Households | % Households |
| Under 35 Years | 21 | 8.4% |
| 35 to 44 Years | 13 | 5.2% |
| 45 to 54 Years | 11 | 4.4% |
| 55 to 64 Years | 110 | 43.8% |
| 65 to 74 Years | 73 | 29.1% |
| 75 to 84 Years | 15 | 6.0% |
| 85 Years and Over | 8 | 3.2% |
| Total | 251 | 100.0% |
Housing Finances in Meadville
Median Income by Occupancy in Meadville
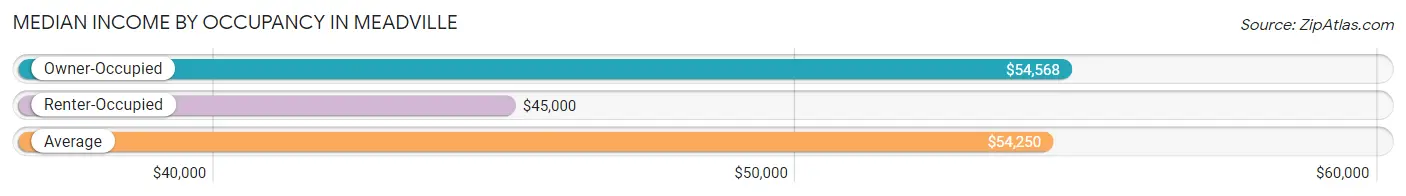
| Occupancy Type | # Households | Median Income |
| Owner-Occupied | 219 (87.3%) | $54,568 |
| Renter-Occupied | 32 (12.8%) | $45,000 |
| Average | 251 (100.0%) | $54,250 |
Occupancy by Householder Income Bracket in Meadville
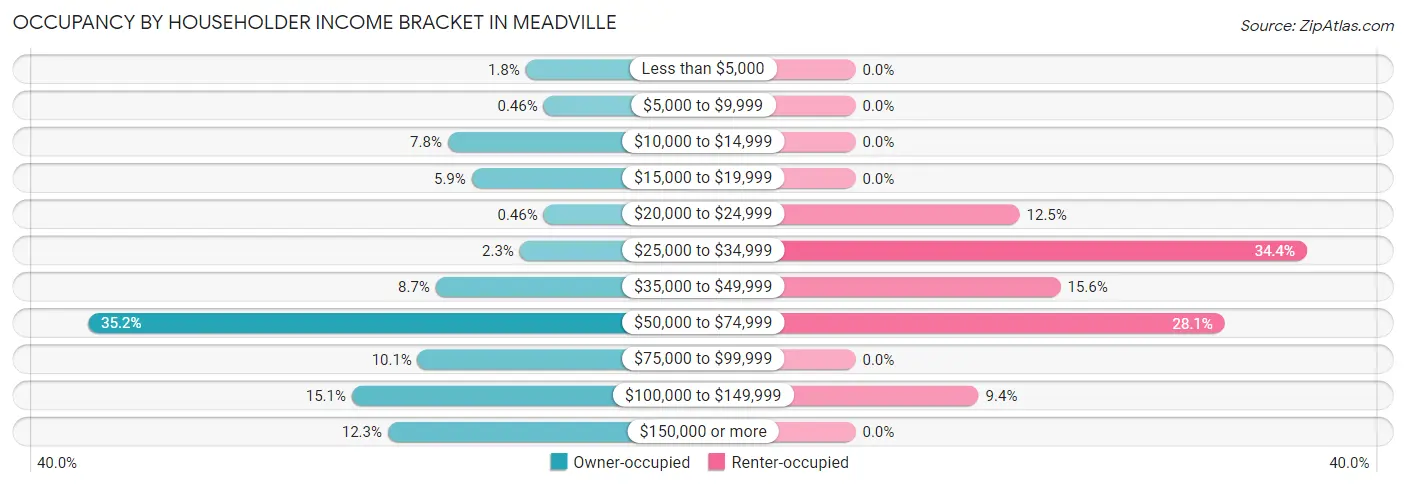
| Income Bracket | Owner-occupied | Renter-occupied |
| Less than $5,000 | 4 (1.8%) | 0 (0.0%) |
| $5,000 to $9,999 | 1 (0.5%) | 0 (0.0%) |
| $10,000 to $14,999 | 17 (7.8%) | 0 (0.0%) |
| $15,000 to $19,999 | 13 (5.9%) | 0 (0.0%) |
| $20,000 to $24,999 | 1 (0.5%) | 4 (12.5%) |
| $25,000 to $34,999 | 5 (2.3%) | 11 (34.4%) |
| $35,000 to $49,999 | 19 (8.7%) | 5 (15.6%) |
| $50,000 to $74,999 | 77 (35.2%) | 9 (28.1%) |
| $75,000 to $99,999 | 22 (10.1%) | 0 (0.0%) |
| $100,000 to $149,999 | 33 (15.1%) | 3 (9.4%) |
| $150,000 or more | 27 (12.3%) | 0 (0.0%) |
| Total | 219 (100.0%) | 32 (100.0%) |
Monthly Housing Cost Tiers in Meadville
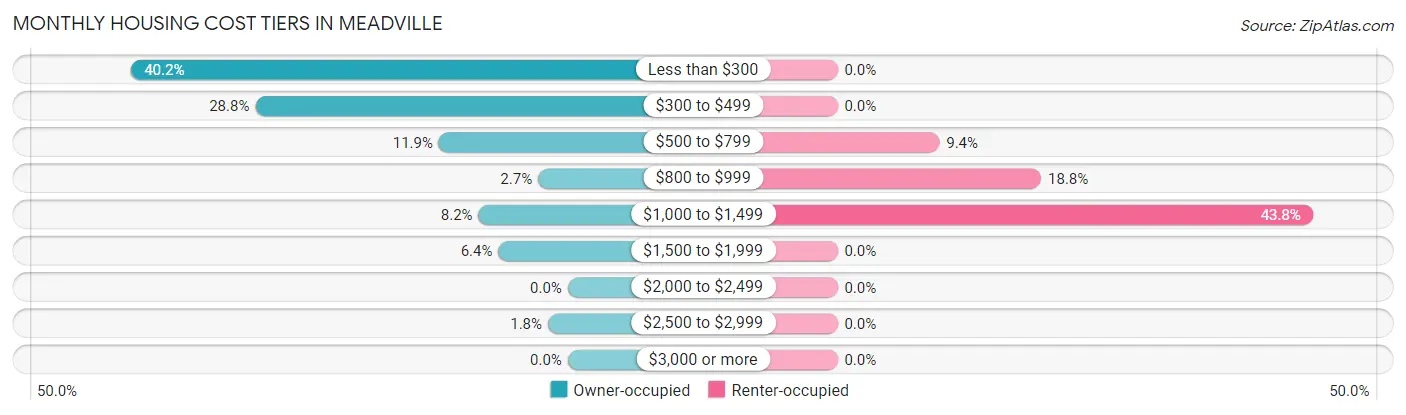
| Monthly Cost | Owner-occupied | Renter-occupied |
| Less than $300 | 88 (40.2%) | 0 (0.0%) |
| $300 to $499 | 63 (28.8%) | 0 (0.0%) |
| $500 to $799 | 26 (11.9%) | 3 (9.4%) |
| $800 to $999 | 6 (2.7%) | 6 (18.8%) |
| $1,000 to $1,499 | 18 (8.2%) | 14 (43.8%) |
| $1,500 to $1,999 | 14 (6.4%) | 0 (0.0%) |
| $2,000 to $2,499 | 0 (0.0%) | 0 (0.0%) |
| $2,500 to $2,999 | 4 (1.8%) | 0 (0.0%) |
| $3,000 or more | 0 (0.0%) | 0 (0.0%) |
| Total | 219 (100.0%) | 32 (100.0%) |
Physical Housing Characteristics in Meadville
Housing Structures in Meadville
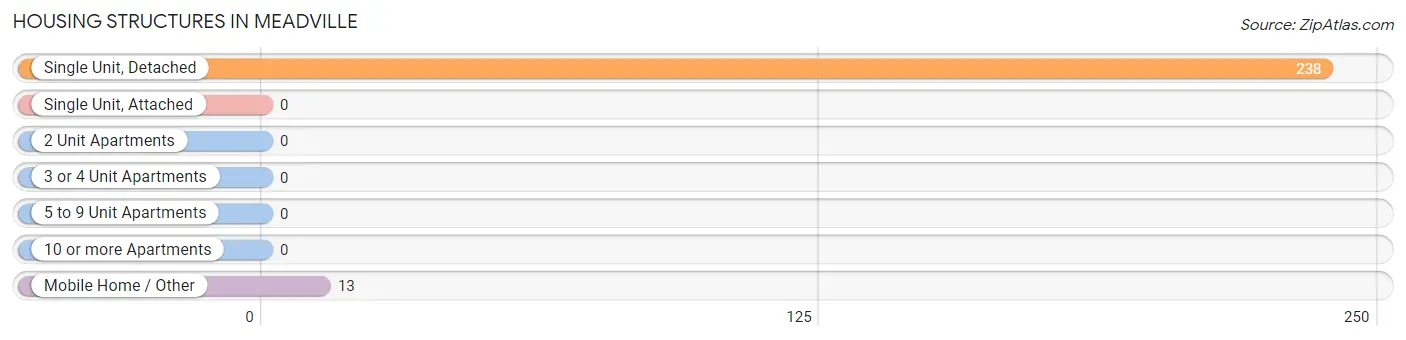
| Structure Type | # Housing Units | % Housing Units |
| Single Unit, Detached | 238 | 94.8% |
| Single Unit, Attached | 0 | 0.0% |
| 2 Unit Apartments | 0 | 0.0% |
| 3 or 4 Unit Apartments | 0 | 0.0% |
| 5 to 9 Unit Apartments | 0 | 0.0% |
| 10 or more Apartments | 0 | 0.0% |
| Mobile Home / Other | 13 | 5.2% |
| Total | 251 | 100.0% |
Housing Structures by Occupancy in Meadville
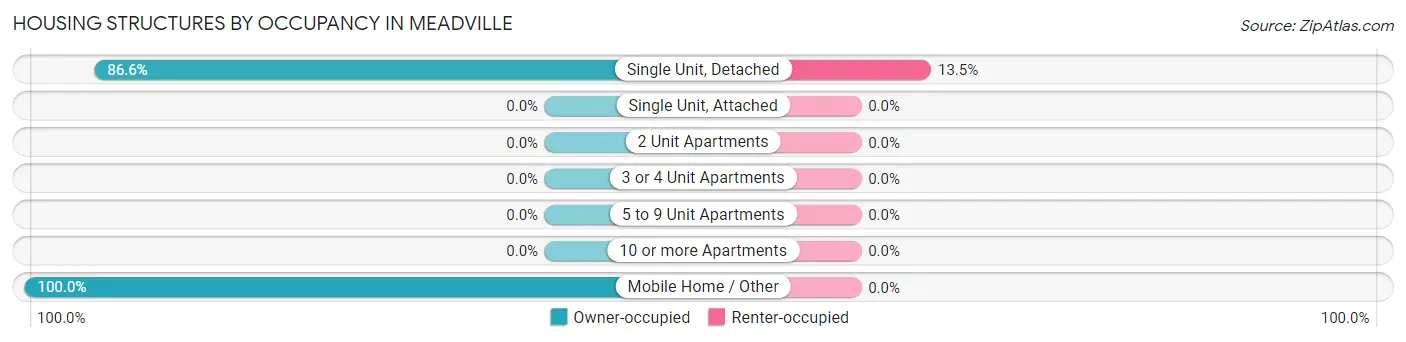
| Structure Type | Owner-occupied | Renter-occupied |
| Single Unit, Detached | 206 (86.6%) | 32 (13.5%) |
| Single Unit, Attached | 0 (0.0%) | 0 (0.0%) |
| 2 Unit Apartments | 0 (0.0%) | 0 (0.0%) |
| 3 or 4 Unit Apartments | 0 (0.0%) | 0 (0.0%) |
| 5 to 9 Unit Apartments | 0 (0.0%) | 0 (0.0%) |
| 10 or more Apartments | 0 (0.0%) | 0 (0.0%) |
| Mobile Home / Other | 13 (100.0%) | 0 (0.0%) |
| Total | 219 (87.3%) | 32 (12.8%) |
Housing Structures by Number of Rooms in Meadville
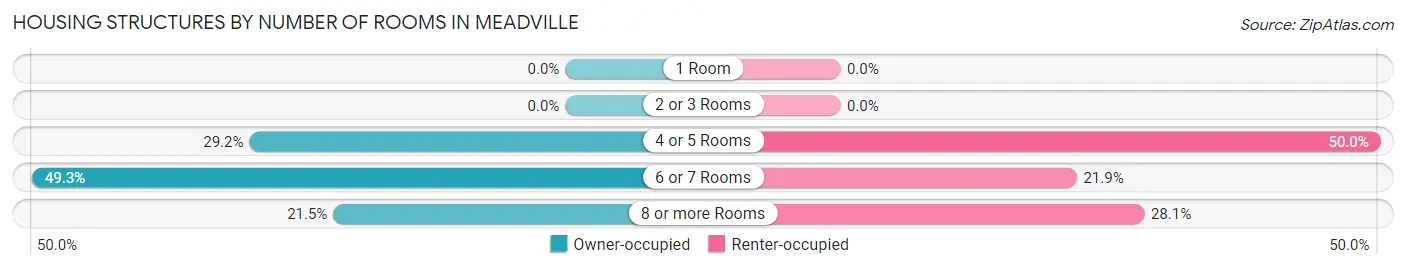
| Number of Rooms | Owner-occupied | Renter-occupied |
| 1 Room | 0 (0.0%) | 0 (0.0%) |
| 2 or 3 Rooms | 0 (0.0%) | 0 (0.0%) |
| 4 or 5 Rooms | 64 (29.2%) | 16 (50.0%) |
| 6 or 7 Rooms | 108 (49.3%) | 7 (21.9%) |
| 8 or more Rooms | 47 (21.5%) | 9 (28.1%) |
| Total | 219 (100.0%) | 32 (100.0%) |
Housing Structure by Heating Type in Meadville
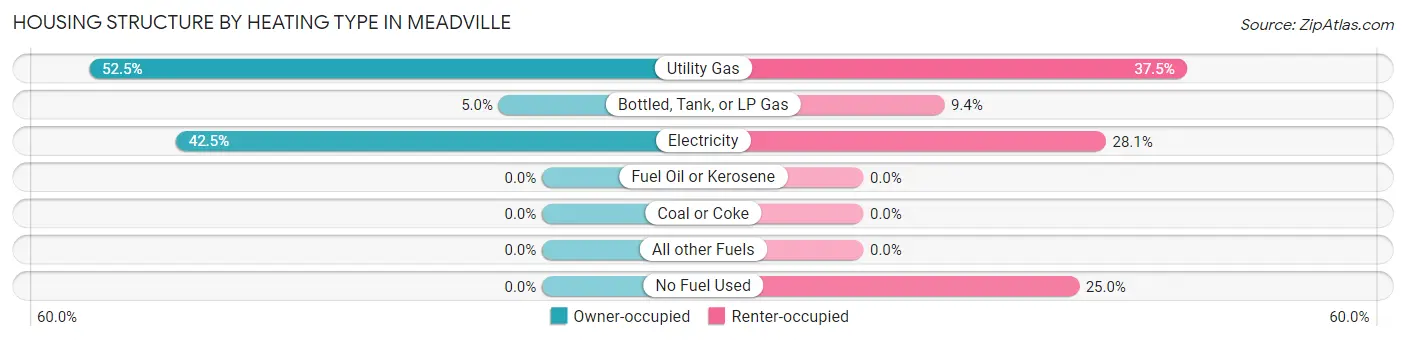
| Heating Type | Owner-occupied | Renter-occupied |
| Utility Gas | 115 (52.5%) | 12 (37.5%) |
| Bottled, Tank, or LP Gas | 11 (5.0%) | 3 (9.4%) |
| Electricity | 93 (42.5%) | 9 (28.1%) |
| Fuel Oil or Kerosene | 0 (0.0%) | 0 (0.0%) |
| Coal or Coke | 0 (0.0%) | 0 (0.0%) |
| All other Fuels | 0 (0.0%) | 0 (0.0%) |
| No Fuel Used | 0 (0.0%) | 8 (25.0%) |
| Total | 219 (100.0%) | 32 (100.0%) |
Household Vehicle Usage in Meadville
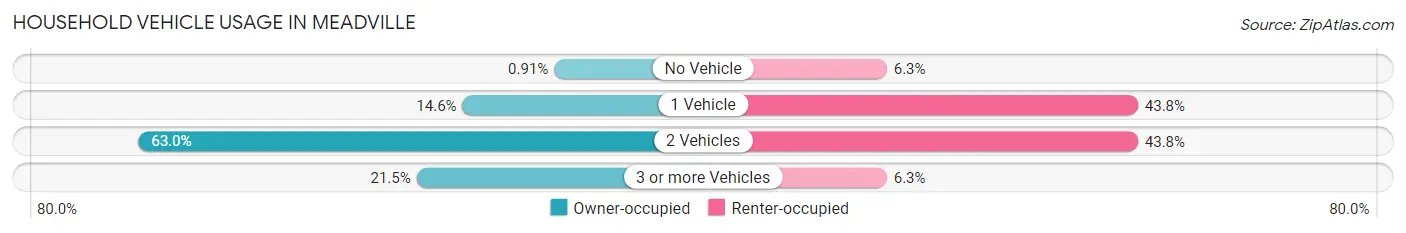
| Vehicles per Household | Owner-occupied | Renter-occupied |
| No Vehicle | 2 (0.9%) | 2 (6.2%) |
| 1 Vehicle | 32 (14.6%) | 14 (43.8%) |
| 2 Vehicles | 138 (63.0%) | 14 (43.8%) |
| 3 or more Vehicles | 47 (21.5%) | 2 (6.2%) |
| Total | 219 (100.0%) | 32 (100.0%) |
Real Estate & Mortgages in Meadville
Real Estate and Mortgage Overview in Meadville
| Characteristic | Without Mortgage | With Mortgage |
| Housing Units | 180 | 39 |
| Median Property Value | $79,300 | $131,300 |
| Median Household Income | $54,182 | $5 |
| Monthly Housing Costs | $313 | $0 |
| Real Estate Taxes | $528 | $15 |
Property Value by Mortgage Status in Meadville
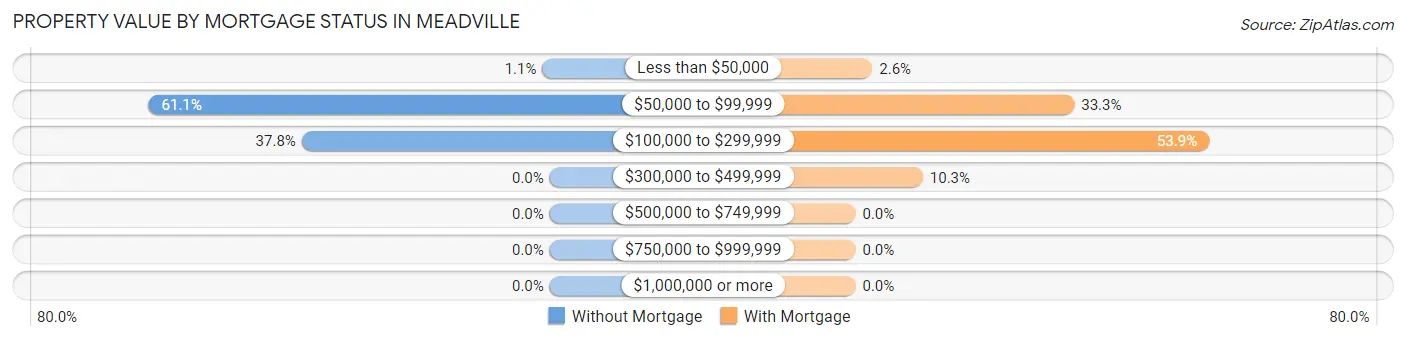
| Property Value | Without Mortgage | With Mortgage |
| Less than $50,000 | 2 (1.1%) | 1 (2.6%) |
| $50,000 to $99,999 | 110 (61.1%) | 13 (33.3%) |
| $100,000 to $299,999 | 68 (37.8%) | 21 (53.8%) |
| $300,000 to $499,999 | 0 (0.0%) | 4 (10.3%) |
| $500,000 to $749,999 | 0 (0.0%) | 0 (0.0%) |
| $750,000 to $999,999 | 0 (0.0%) | 0 (0.0%) |
| $1,000,000 or more | 0 (0.0%) | 0 (0.0%) |
| Total | 180 (100.0%) | 39 (100.0%) |
Household Income by Mortgage Status in Meadville
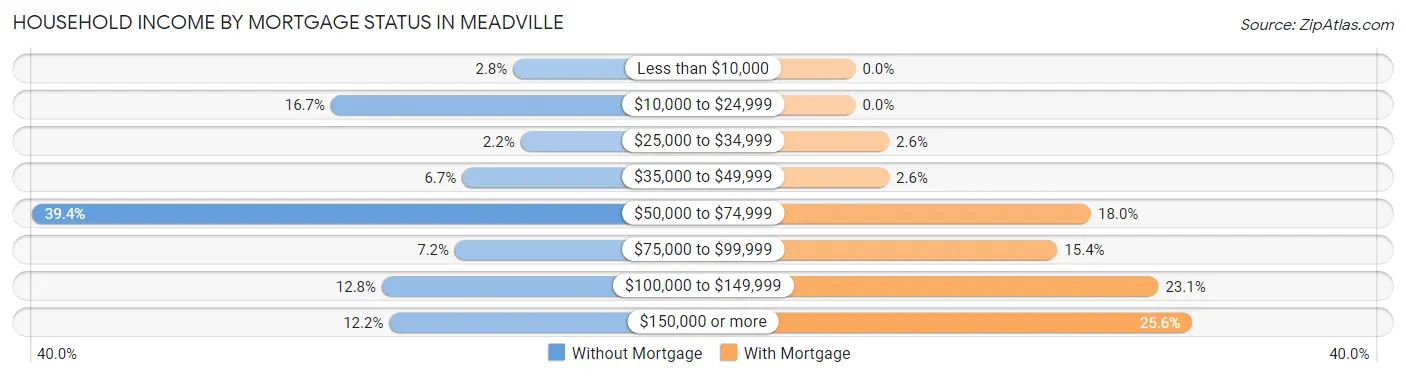
| Household Income | Without Mortgage | With Mortgage |
| Less than $10,000 | 5 (2.8%) | 0 (0.0%) |
| $10,000 to $24,999 | 30 (16.7%) | 0 (0.0%) |
| $25,000 to $34,999 | 4 (2.2%) | 1 (2.6%) |
| $35,000 to $49,999 | 12 (6.7%) | 1 (2.6%) |
| $50,000 to $74,999 | 71 (39.4%) | 7 (17.9%) |
| $75,000 to $99,999 | 13 (7.2%) | 6 (15.4%) |
| $100,000 to $149,999 | 23 (12.8%) | 9 (23.1%) |
| $150,000 or more | 22 (12.2%) | 10 (25.6%) |
| Total | 180 (100.0%) | 39 (100.0%) |
Property Value to Household Income Ratio in Meadville
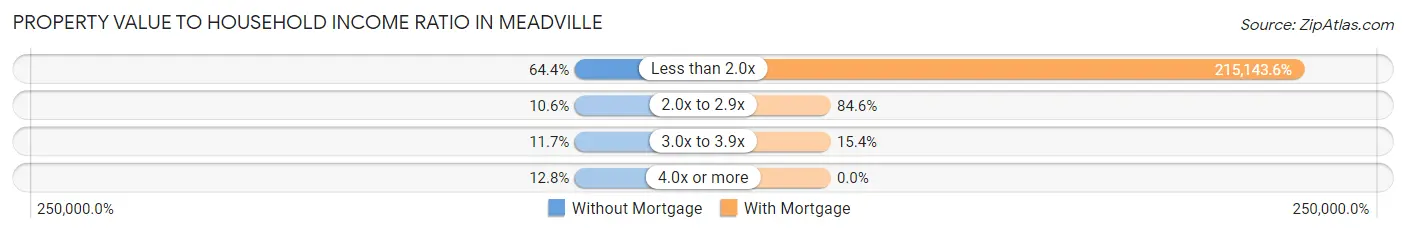
| Value-to-Income Ratio | Without Mortgage | With Mortgage |
| Less than 2.0x | 116 (64.4%) | 83,906 (215,143.6%) |
| 2.0x to 2.9x | 19 (10.6%) | 33 (84.6%) |
| 3.0x to 3.9x | 21 (11.7%) | 6 (15.4%) |
| 4.0x or more | 23 (12.8%) | 0 (0.0%) |
| Total | 180 (100.0%) | 39 (100.0%) |
Real Estate Taxes by Mortgage Status in Meadville
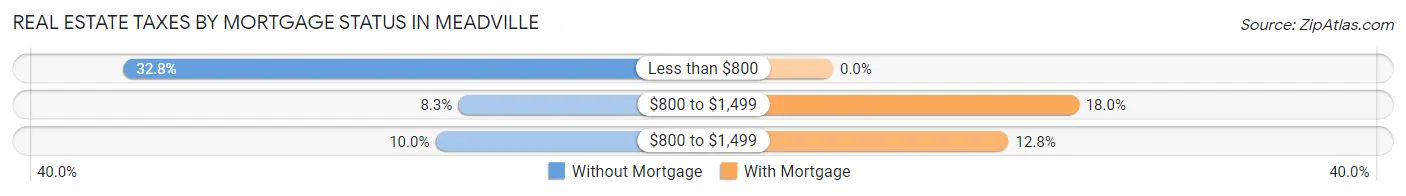
| Property Taxes | Without Mortgage | With Mortgage |
| Less than $800 | 59 (32.8%) | 0 (0.0%) |
| $800 to $1,499 | 15 (8.3%) | 7 (17.9%) |
| $800 to $1,499 | 18 (10.0%) | 5 (12.8%) |
| Total | 180 (100.0%) | 39 (100.0%) |
Health & Disability in Meadville
Health Insurance Coverage by Age in Meadville
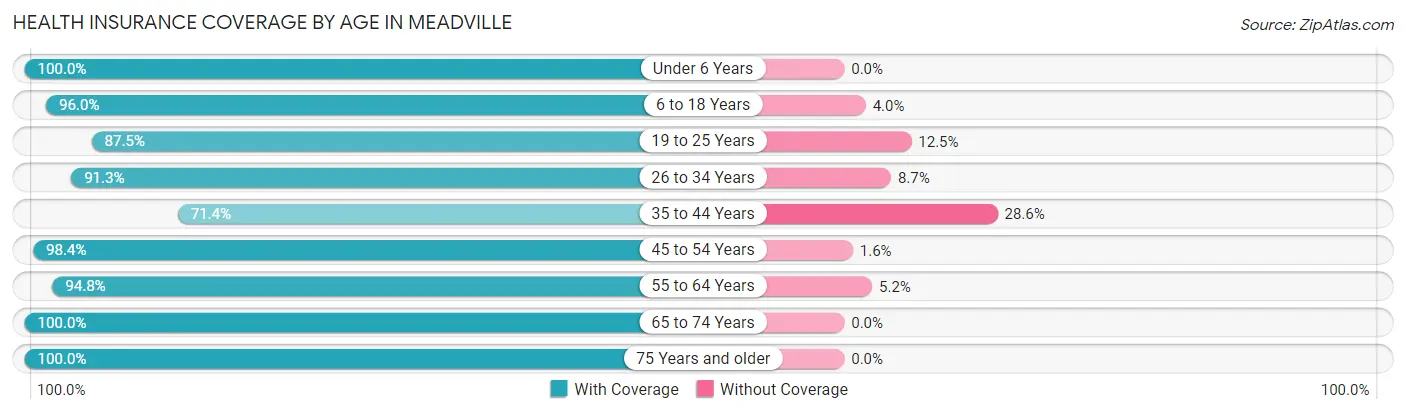
| Age Bracket | With Coverage | Without Coverage |
| Under 6 Years | 28 (100.0%) | 0 (0.0%) |
| 6 to 18 Years | 48 (96.0%) | 2 (4.0%) |
| 19 to 25 Years | 63 (87.5%) | 9 (12.5%) |
| 26 to 34 Years | 42 (91.3%) | 4 (8.7%) |
| 35 to 44 Years | 30 (71.4%) | 12 (28.6%) |
| 45 to 54 Years | 62 (98.4%) | 1 (1.6%) |
| 55 to 64 Years | 128 (94.8%) | 7 (5.2%) |
| 65 to 74 Years | 124 (100.0%) | 0 (0.0%) |
| 75 Years and older | 42 (100.0%) | 0 (0.0%) |
| Total | 567 (94.2%) | 35 (5.8%) |
Health Insurance Coverage by Citizenship Status in Meadville
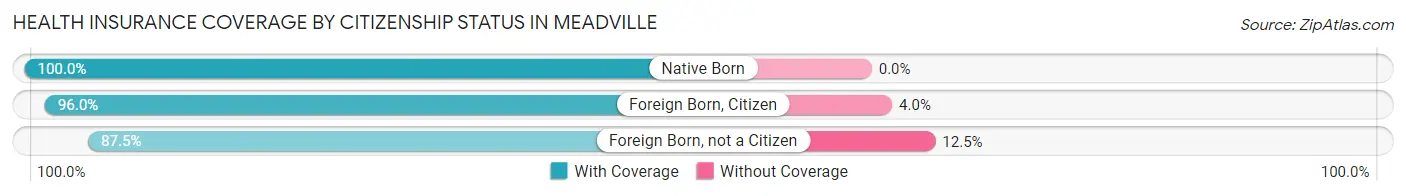
| Citizenship Status | With Coverage | Without Coverage |
| Native Born | 28 (100.0%) | 0 (0.0%) |
| Foreign Born, Citizen | 48 (96.0%) | 2 (4.0%) |
| Foreign Born, not a Citizen | 63 (87.5%) | 9 (12.5%) |
Health Insurance Coverage by Household Income in Meadville
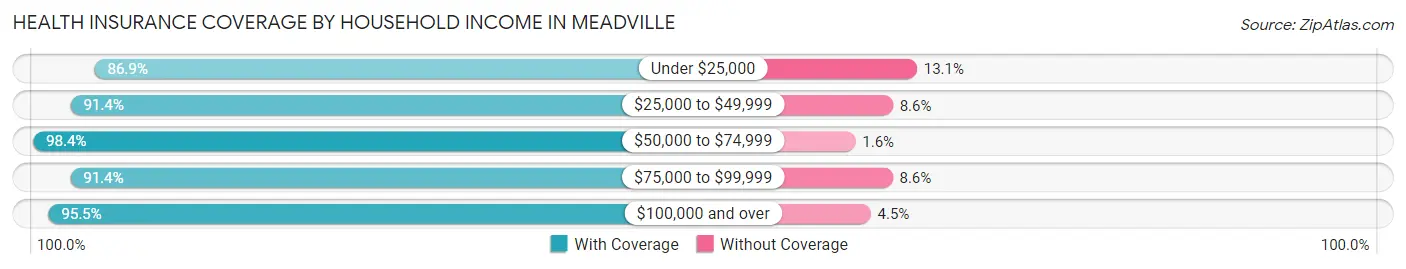
| Household Income | With Coverage | Without Coverage |
| Under $25,000 | 53 (86.9%) | 8 (13.1%) |
| $25,000 to $49,999 | 85 (91.4%) | 8 (8.6%) |
| $50,000 to $74,999 | 183 (98.4%) | 3 (1.6%) |
| $75,000 to $99,999 | 96 (91.4%) | 9 (8.6%) |
| $100,000 and over | 150 (95.5%) | 7 (4.5%) |
Public vs Private Health Insurance Coverage by Age in Meadville
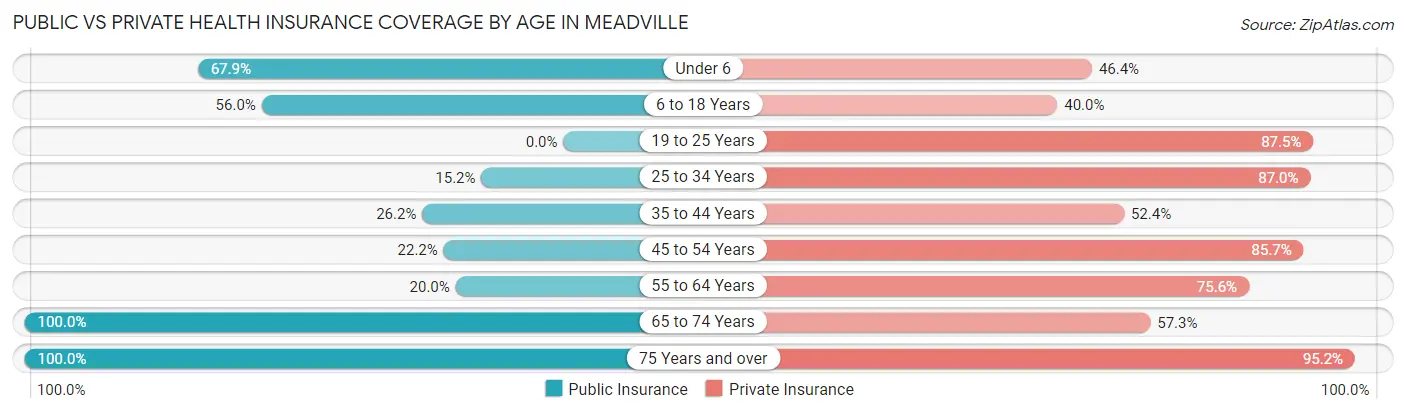
| Age Bracket | Public Insurance | Private Insurance |
| Under 6 | 19 (67.9%) | 13 (46.4%) |
| 6 to 18 Years | 28 (56.0%) | 20 (40.0%) |
| 19 to 25 Years | 0 (0.0%) | 63 (87.5%) |
| 25 to 34 Years | 7 (15.2%) | 40 (87.0%) |
| 35 to 44 Years | 11 (26.2%) | 22 (52.4%) |
| 45 to 54 Years | 14 (22.2%) | 54 (85.7%) |
| 55 to 64 Years | 27 (20.0%) | 102 (75.6%) |
| 65 to 74 Years | 124 (100.0%) | 71 (57.3%) |
| 75 Years and over | 42 (100.0%) | 40 (95.2%) |
| Total | 272 (45.2%) | 425 (70.6%) |
Disability Status by Sex by Age in Meadville
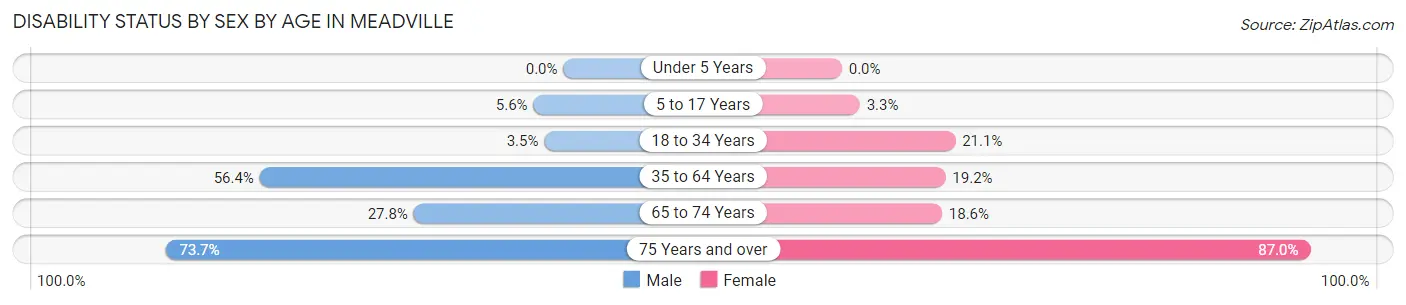
| Age Bracket | Male | Female |
| Under 5 Years | 0 (0.0%) | 0 (0.0%) |
| 5 to 17 Years | 1 (5.6%) | 1 (3.3%) |
| 18 to 34 Years | 3 (3.5%) | 8 (21.0%) |
| 35 to 64 Years | 62 (56.4%) | 25 (19.2%) |
| 65 to 74 Years | 15 (27.8%) | 13 (18.6%) |
| 75 Years and over | 14 (73.7%) | 20 (87.0%) |
Disability Class by Sex by Age in Meadville
Disability Class: Hearing Difficulty
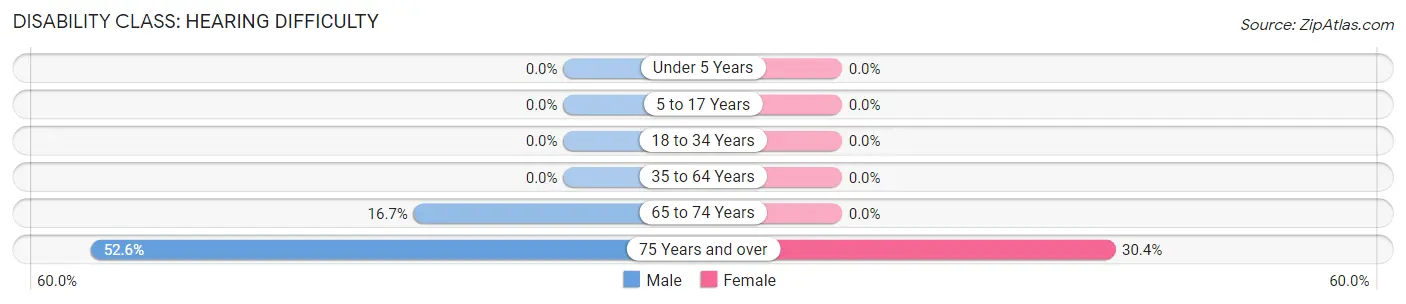
| Age Bracket | Male | Female |
| Under 5 Years | 0 (0.0%) | 0 (0.0%) |
| 5 to 17 Years | 0 (0.0%) | 0 (0.0%) |
| 18 to 34 Years | 0 (0.0%) | 0 (0.0%) |
| 35 to 64 Years | 0 (0.0%) | 0 (0.0%) |
| 65 to 74 Years | 9 (16.7%) | 0 (0.0%) |
| 75 Years and over | 10 (52.6%) | 7 (30.4%) |
Disability Class: Vision Difficulty
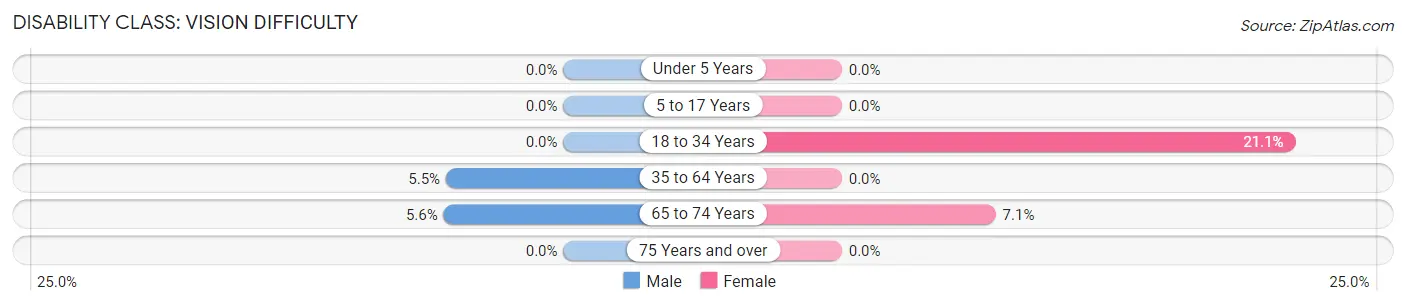
| Age Bracket | Male | Female |
| Under 5 Years | 0 (0.0%) | 0 (0.0%) |
| 5 to 17 Years | 0 (0.0%) | 0 (0.0%) |
| 18 to 34 Years | 0 (0.0%) | 8 (21.0%) |
| 35 to 64 Years | 6 (5.4%) | 0 (0.0%) |
| 65 to 74 Years | 3 (5.6%) | 5 (7.1%) |
| 75 Years and over | 0 (0.0%) | 0 (0.0%) |
Disability Class: Cognitive Difficulty
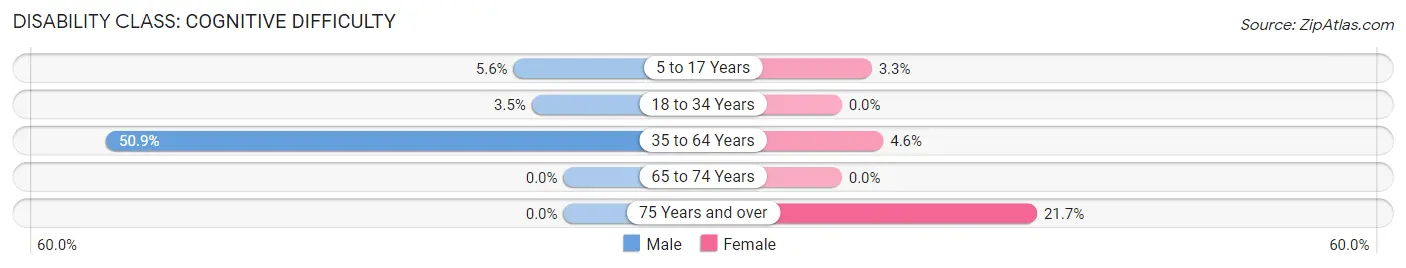
| Age Bracket | Male | Female |
| 5 to 17 Years | 1 (5.6%) | 1 (3.3%) |
| 18 to 34 Years | 3 (3.5%) | 0 (0.0%) |
| 35 to 64 Years | 56 (50.9%) | 6 (4.6%) |
| 65 to 74 Years | 0 (0.0%) | 0 (0.0%) |
| 75 Years and over | 0 (0.0%) | 5 (21.7%) |
Disability Class: Ambulatory Difficulty
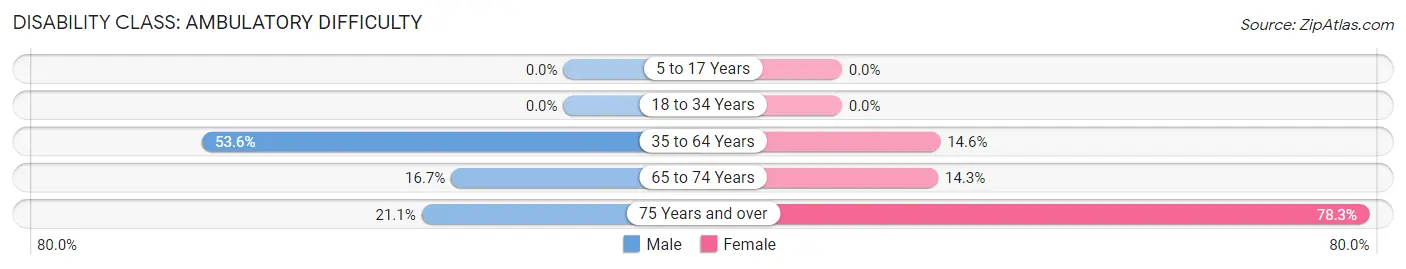
| Age Bracket | Male | Female |
| 5 to 17 Years | 0 (0.0%) | 0 (0.0%) |
| 18 to 34 Years | 0 (0.0%) | 0 (0.0%) |
| 35 to 64 Years | 59 (53.6%) | 19 (14.6%) |
| 65 to 74 Years | 9 (16.7%) | 10 (14.3%) |
| 75 Years and over | 4 (21.0%) | 18 (78.3%) |
Disability Class: Self-Care Difficulty
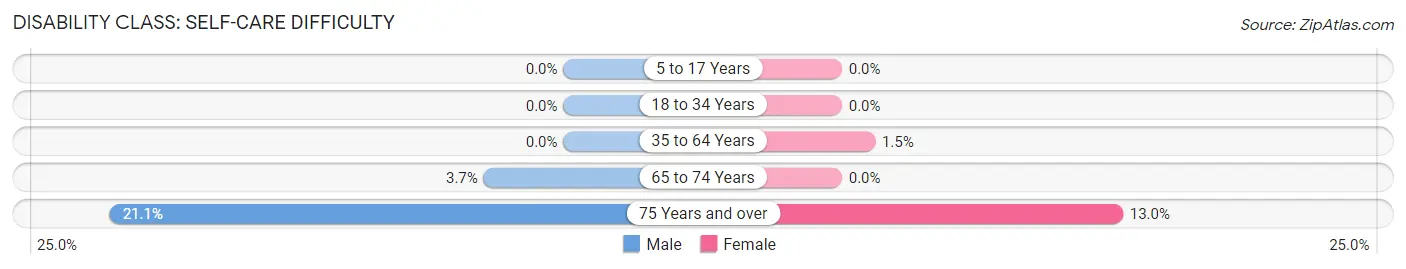
| Age Bracket | Male | Female |
| 5 to 17 Years | 0 (0.0%) | 0 (0.0%) |
| 18 to 34 Years | 0 (0.0%) | 0 (0.0%) |
| 35 to 64 Years | 0 (0.0%) | 2 (1.5%) |
| 65 to 74 Years | 2 (3.7%) | 0 (0.0%) |
| 75 Years and over | 4 (21.0%) | 3 (13.0%) |
Technology Access in Meadville
Computing Device Access in Meadville
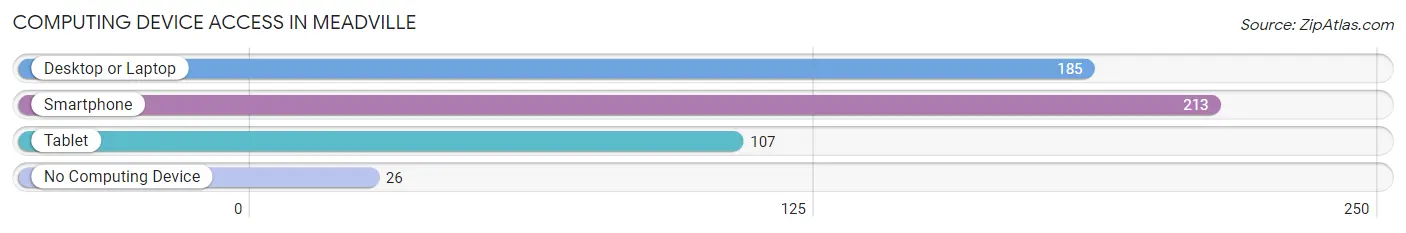
| Device Type | # Households | % Households |
| Desktop or Laptop | 185 | 73.7% |
| Smartphone | 213 | 84.9% |
| Tablet | 107 | 42.6% |
| No Computing Device | 26 | 10.4% |
| Total | 251 | 100.0% |
Internet Access in Meadville
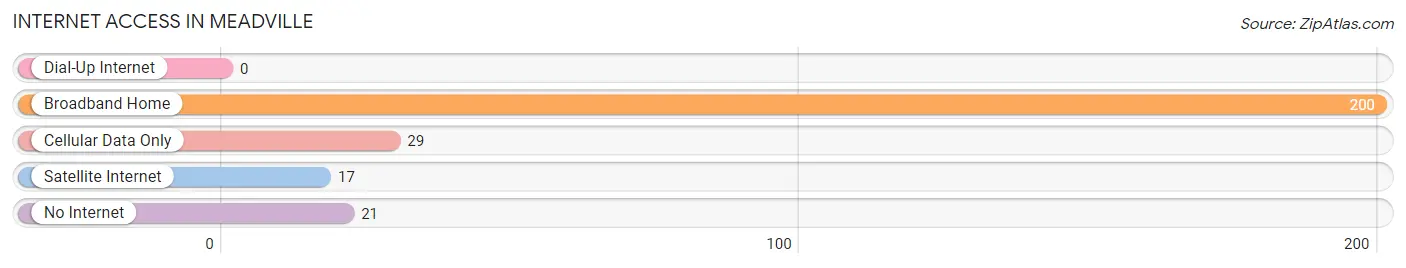
| Internet Type | # Households | % Households |
| Dial-Up Internet | 0 | 0.0% |
| Broadband Home | 200 | 79.7% |
| Cellular Data Only | 29 | 11.6% |
| Satellite Internet | 17 | 6.8% |
| No Internet | 21 | 8.4% |
| Total | 251 | 100.0% |
Meadville Summary
Meadville is a small town located in Franklin County, Mississippi. It is situated in the northeastern part of the state, approximately 40 miles south of Jackson. The town has a population of approximately 1,000 people and is part of the McComb, Mississippi Metropolitan Statistical Area.
History
Meadville was founded in 1837 by a group of settlers from North Carolina. The town was named after the nearby creek, which was named after a local settler, William Mead. The town was incorporated in 1839 and was the first town in Franklin County.
In the late 1800s, the town was a major center for the timber industry. The town was also home to several sawmills and a cotton gin. The town was also home to a number of stores and businesses, including a hotel, a bank, and a post office.
In the early 1900s, the town began to decline due to the decline of the timber industry. The town was also affected by the Great Depression and World War II. After the war, the town began to slowly recover and by the 1950s, the town had regained its former prosperity.
Geography
Meadville is located in the northeastern part of Franklin County, Mississippi. The town is situated on the banks of the Big Black River, which is a tributary of the Mississippi River. The town is surrounded by rolling hills and is located approximately 40 miles south of Jackson.
The climate in Meadville is humid subtropical, with hot, humid summers and mild winters. The average annual temperature is around 70 degrees Fahrenheit. The average annual precipitation is around 50 inches.
Economy
Meadville’s economy is largely based on agriculture and timber. The town is home to several farms, which produce a variety of crops, including corn, soybeans, cotton, and wheat. The town is also home to several timber companies, which harvest timber from the surrounding forests.
The town is also home to several small businesses, including restaurants, stores, and service providers. The town is also home to a number of manufacturing companies, which produce a variety of products, including furniture, clothing, and electronics.
Demographics
As of the 2010 census, the population of Meadville was 1,000 people. The racial makeup of the town was 95.2% White, 2.2% African American, 0.2% Native American, 0.2% Asian, 0.2% from other races, and 1.9% from two or more races. Hispanic or Latino of any race were 0.7% of the population.
The median income for a household in Meadville was $30,000, and the median income for a family was $35,000. The per capita income for the town was $14,000. About 17.2% of families and 20.2% of the population were below the poverty line, including 28.2% of those under age 18 and 11.2% of those age 65 or over.
Common Questions
What is Per Capita Income in Meadville?
Per Capita income in Meadville is $28,261.
What is the Median Family Income in Meadville?
Median Family Income in Meadville is $54,614.
What is the Median Household income in Meadville?
Median Household Income in Meadville is $54,250.
What is Income or Wage Gap in Meadville?
Income or Wage Gap in Meadville is 36.9%.
Women in Meadville earn 63.1 cents for every dollar earned by a man.
What is Inequality or Gini Index in Meadville?
Inequality or Gini Index in Meadville is 0.42.
What is the Total Population of Meadville?
Total Population of Meadville is 690.
What is the Total Male Population of Meadville?
Total Male Population of Meadville is 376.
What is the Total Female Population of Meadville?
Total Female Population of Meadville is 314.
What is the Ratio of Males per 100 Females in Meadville?
There are 119.75 Males per 100 Females in Meadville.
What is the Ratio of Females per 100 Males in Meadville?
There are 83.51 Females per 100 Males in Meadville.
What is the Median Population Age in Meadville?
Median Population Age in Meadville is 55.0 Years.
What is the Average Family Size in Meadville
Average Family Size in Meadville is 2.7 People.
What is the Average Household Size in Meadville
Average Household Size in Meadville is 2.4 People.
How Large is the Labor Force in Meadville?
There are 187 People in the Labor Forcein in Meadville.
What is the Percentage of People in the Labor Force in Meadville?
29.6% of People are in the Labor Force in Meadville.
What is the Unemployment Rate in Meadville?
Unemployment Rate in Meadville is 1.6%.