Skagway, AK Map & Demographics
Skagway Map
Skagway Overview
$46,997
PER CAPITA INCOME
$115,000
AVG FAMILY INCOME
$88,000
AVG HOUSEHOLD INCOME
33.6%
WAGE / INCOME GAP [ % ]
66.4¢/ $1
WAGE / INCOME GAP [ $ ]
0.33
INEQUALITY / GINI INDEX
1,179
TOTAL POPULATION
473
MALE POPULATION
706
FEMALE POPULATION
67.00
MALES / 100 FEMALES
149.26
FEMALES / 100 MALES
35.8
MEDIAN AGE
3.7
AVG FAMILY SIZE
2.7
AVG HOUSEHOLD SIZE
827
LABOR FORCE [ PEOPLE ]
82.5%
PERCENT IN LABOR FORCE
11.4%
UNEMPLOYMENT RATE
Skagway Zip Codes
Skagway Area Codes
Income in Skagway
Income Overview in Skagway
Per Capita Income in Skagway is $46,997, while median incomes of families and households are $115,000 and $88,000 respectively.
| Characteristic | Number | Measure |
| Per Capita Income | 1,179 | $46,997 |
| Median Family Income | 182 | $115,000 |
| Mean Family Income | 182 | $119,316 |
| Median Household Income | 346 | $88,000 |
| Mean Household Income | 346 | $98,569 |
| Income Deficit | 182 | $0 |
| Wage / Income Gap (%) | 1,179 | 33.59% |
| Wage / Income Gap ($) | 1,179 | 66.41¢ per $1 |
| Gini / Inequality Index | 1,179 | 0.33 |
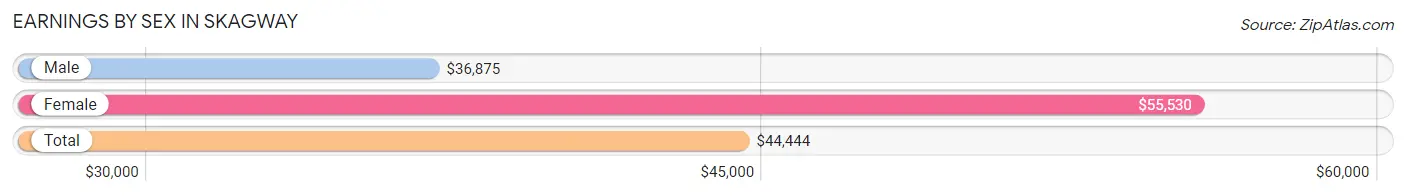
Earnings by Sex in Skagway
Average Earnings in Skagway are $44,444, $36,875 for men and $55,530 for women, a difference of 33.6%.
| Sex | Number | Average Earnings |
| Male | 347 (43.2%) | $36,875 |
| Female | 457 (56.8%) | $55,530 |
| Total | 804 (100.0%) | $44,444 |
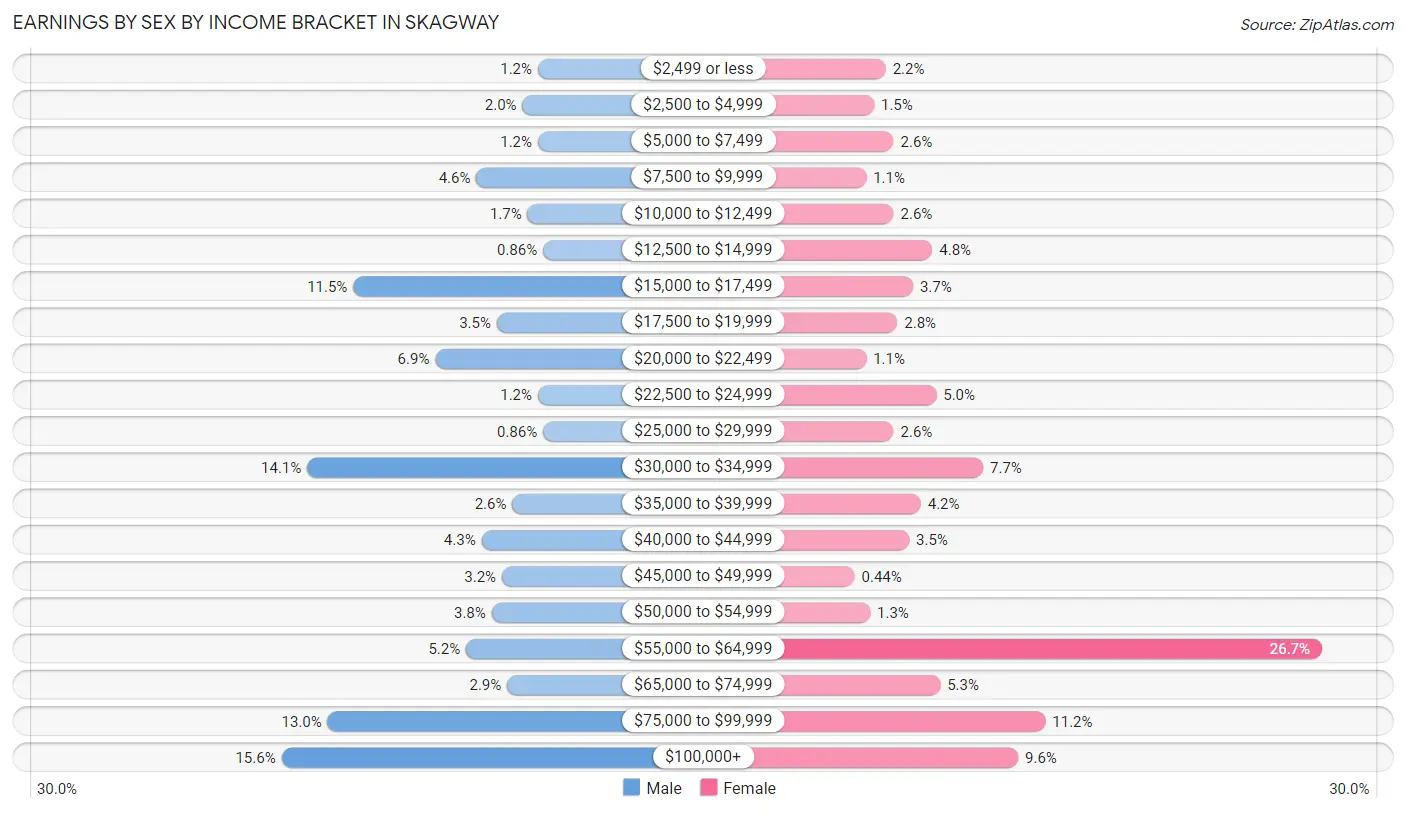
Earnings by Sex by Income Bracket in Skagway
The most common earnings brackets in Skagway are $100,000+ for men (54 | 15.6%) and $55,000 to $64,999 for women (122 | 26.7%).
| Income | Male | Female |
| $2,499 or less | 4 (1.1%) | 10 (2.2%) |
| $2,500 to $4,999 | 7 (2.0%) | 7 (1.5%) |
| $5,000 to $7,499 | 4 (1.1%) | 12 (2.6%) |
| $7,500 to $9,999 | 16 (4.6%) | 5 (1.1%) |
| $10,000 to $12,499 | 6 (1.7%) | 12 (2.6%) |
| $12,500 to $14,999 | 3 (0.9%) | 22 (4.8%) |
| $15,000 to $17,499 | 40 (11.5%) | 17 (3.7%) |
| $17,500 to $19,999 | 12 (3.5%) | 13 (2.8%) |
| $20,000 to $22,499 | 24 (6.9%) | 5 (1.1%) |
| $22,500 to $24,999 | 4 (1.1%) | 23 (5.0%) |
| $25,000 to $29,999 | 3 (0.9%) | 12 (2.6%) |
| $30,000 to $34,999 | 49 (14.1%) | 35 (7.7%) |
| $35,000 to $39,999 | 9 (2.6%) | 19 (4.2%) |
| $40,000 to $44,999 | 15 (4.3%) | 16 (3.5%) |
| $45,000 to $49,999 | 11 (3.2%) | 2 (0.4%) |
| $50,000 to $54,999 | 13 (3.7%) | 6 (1.3%) |
| $55,000 to $64,999 | 18 (5.2%) | 122 (26.7%) |
| $65,000 to $74,999 | 10 (2.9%) | 24 (5.2%) |
| $75,000 to $99,999 | 45 (13.0%) | 51 (11.2%) |
| $100,000+ | 54 (15.6%) | 44 (9.6%) |
| Total | 347 (100.0%) | 457 (100.0%) |
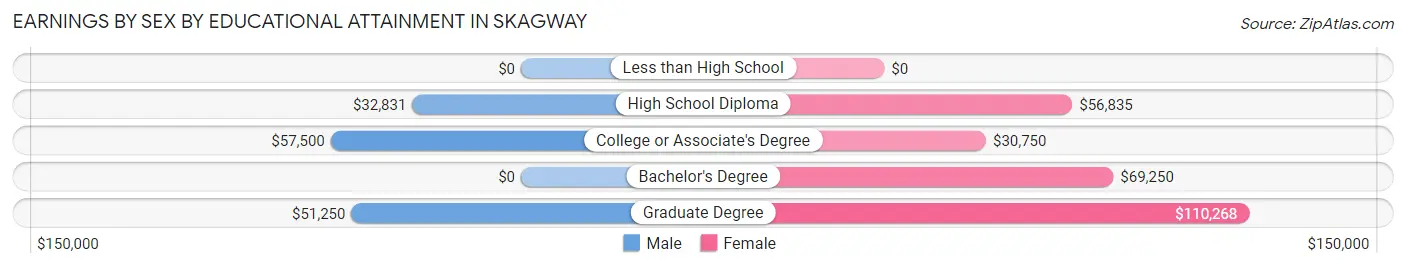
Earnings by Sex by Educational Attainment in Skagway
Average earnings in Skagway are $43,750 for men and $56,695 for women, a difference of 22.8%. Men with an educational attainment of college or associate's degree enjoy the highest average annual earnings of $57,500, while those with high school diploma education earn the least with $32,831. Women with an educational attainment of graduate degree earn the most with the average annual earnings of $110,268, while those with college or associate's degree education have the smallest earnings of $30,750.
| Educational Attainment | Male Income | Female Income |
| Less than High School | - | - |
| High School Diploma | $32,831 | $56,835 |
| College or Associate's Degree | $57,500 | $30,750 |
| Bachelor's Degree | - | - |
| Graduate Degree | $51,250 | $110,268 |
| Total | $43,750 | $56,695 |
Family Income in Skagway
Family Income Brackets in Skagway
According to the Skagway family income data, there are 55 families falling into the $100,000 to $149,999 income range, which is the most common income bracket and makes up 30.2% of all families.
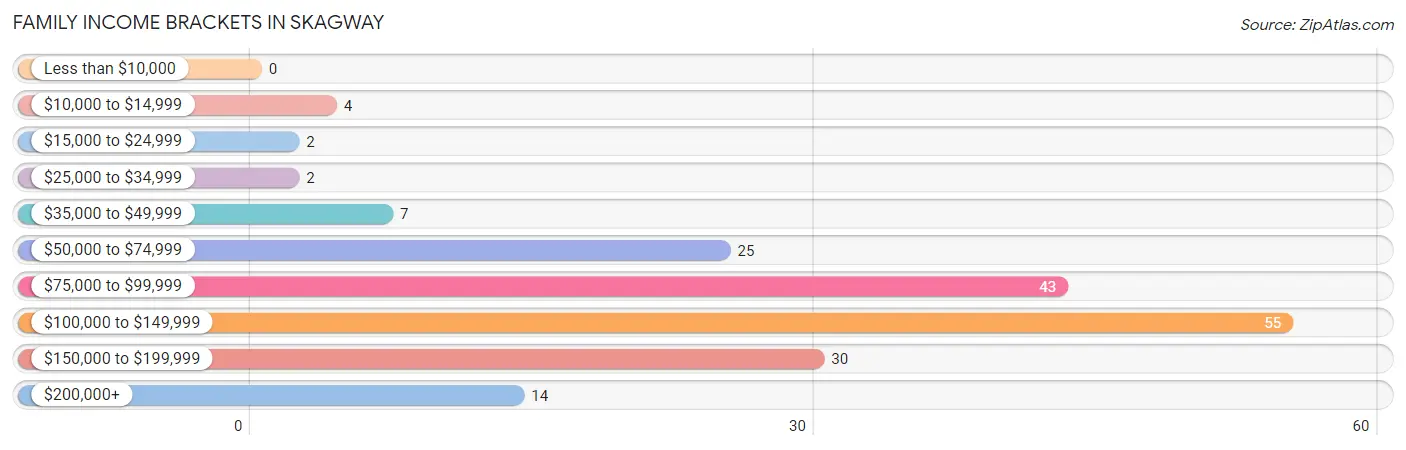
| Income Bracket | # Families | % Families |
| Less than $10,000 | 0 | 0.0% |
| $10,000 to $14,999 | 4 | 2.2% |
| $15,000 to $24,999 | 2 | 1.1% |
| $25,000 to $34,999 | 2 | 1.1% |
| $35,000 to $49,999 | 7 | 3.8% |
| $50,000 to $74,999 | 25 | 13.7% |
| $75,000 to $99,999 | 43 | 23.6% |
| $100,000 to $149,999 | 55 | 30.2% |
| $150,000 to $199,999 | 30 | 16.5% |
| $200,000+ | 14 | 7.7% |
Family Income by Famaliy Size in Skagway
4-person families (25 | 13.7%) account for the highest median family income in Skagway with $137,917 per family, while 2-person families (107 | 58.8%) have the highest median income of $57,656 per family member.
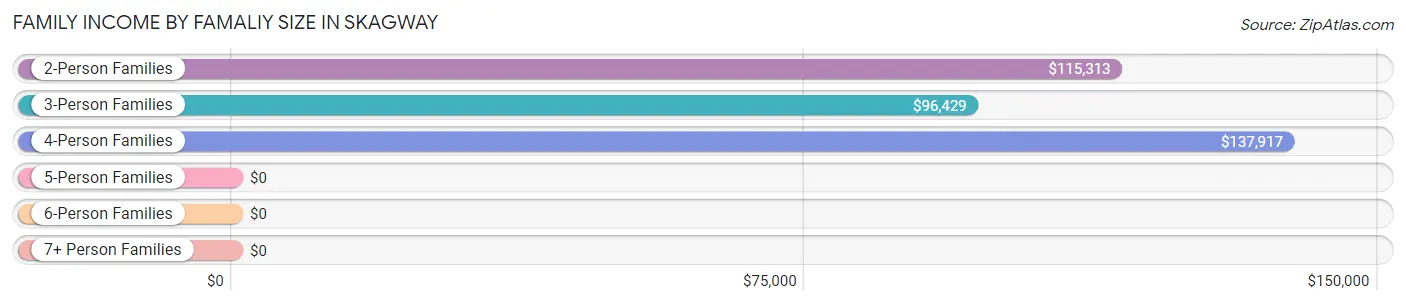
| Income Bracket | # Families | Median Income |
| 2-Person Families | 107 (58.8%) | $115,313 |
| 3-Person Families | 44 (24.2%) | $96,429 |
| 4-Person Families | 25 (13.7%) | $137,917 |
| 5-Person Families | 3 (1.7%) | $0 |
| 6-Person Families | 2 (1.1%) | $0 |
| 7+ Person Families | 1 (0.5%) | $0 |
| Total | 182 (100.0%) | $115,000 |
Family Income by Number of Earners in Skagway
The median family income in Skagway is $115,000, with families comprising 2 earners (99) having the highest median family income of $132,750, while families with no earners (17) have the lowest median family income of $77,917, accounting for 54.4% and 9.3% of families, respectively.
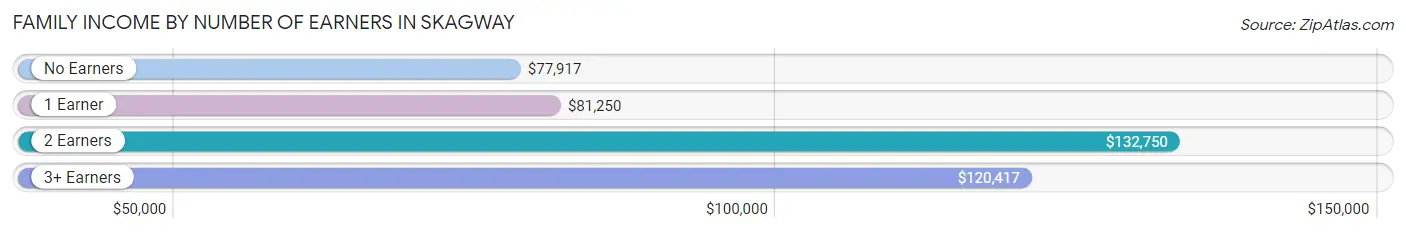
| Number of Earners | # Families | Median Income |
| No Earners | 17 (9.3%) | $77,917 |
| 1 Earner | 55 (30.2%) | $81,250 |
| 2 Earners | 99 (54.4%) | $132,750 |
| 3+ Earners | 11 (6.0%) | $120,417 |
| Total | 182 (100.0%) | $115,000 |
Household Income in Skagway
Household Income Brackets in Skagway
With 85 households falling in the category, the $100,000 to $149,999 income range is the most frequent in Skagway, accounting for 24.6% of all households. In contrast, only 5 households (1.5%) fall into the less than $10,000 income bracket, making it the least populous group.
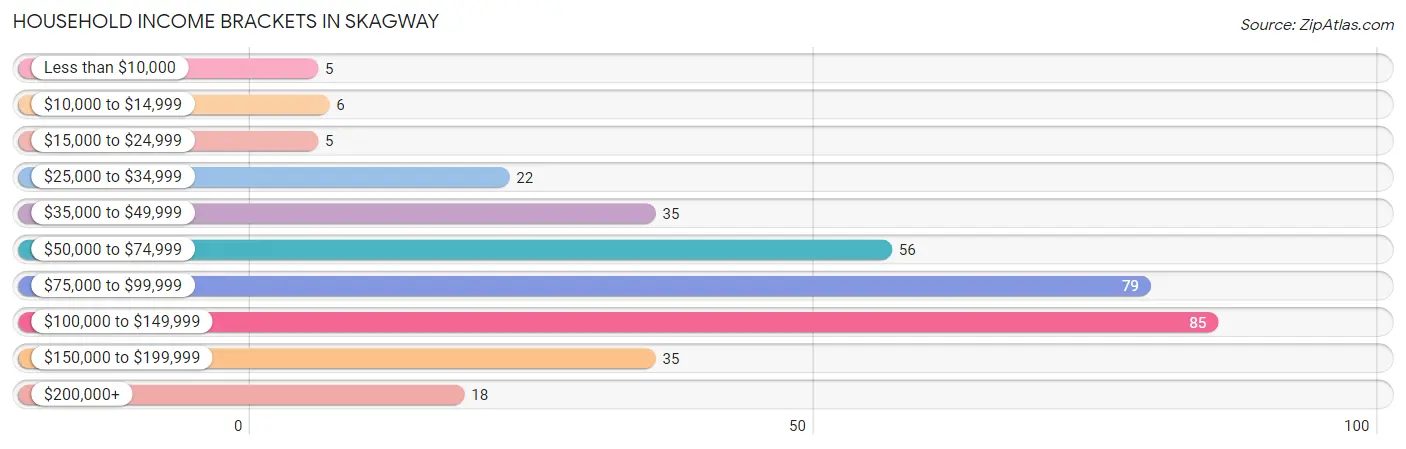
| Income Bracket | # Households | % Households |
| Less than $10,000 | 5 | 1.4% |
| $10,000 to $14,999 | 6 | 1.7% |
| $15,000 to $24,999 | 5 | 1.4% |
| $25,000 to $34,999 | 22 | 6.4% |
| $35,000 to $49,999 | 35 | 10.1% |
| $50,000 to $74,999 | 56 | 16.2% |
| $75,000 to $99,999 | 79 | 22.8% |
| $100,000 to $149,999 | 85 | 24.6% |
| $150,000 to $199,999 | 35 | 10.1% |
| $200,000+ | 18 | 5.2% |
Household Income by Householder Age in Skagway
The median household income in Skagway is $88,000, with the highest median household income of $92,083 found in the 25 to 44 years age bracket for the primary householder. A total of 107 households (30.9%) fall into this category. Meanwhile, the 15 to 24 years age bracket for the primary householder has the lowest median household income of $0, with 22 households (6.4%) in this group.
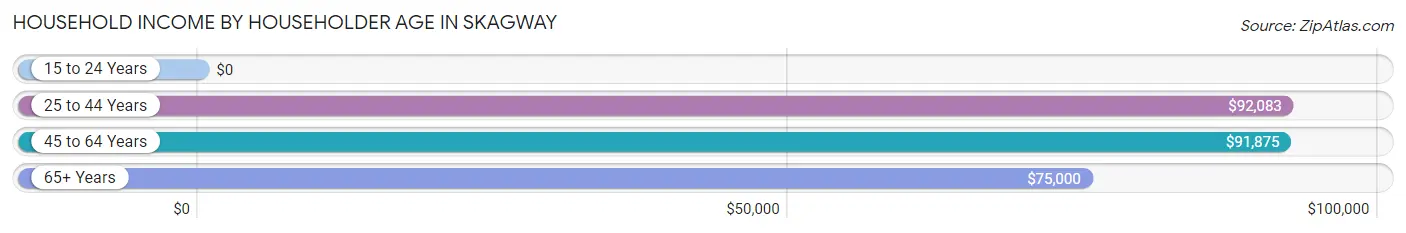
| Income Bracket | # Households | Median Income |
| 15 to 24 Years | 22 (6.4%) | $0 |
| 25 to 44 Years | 107 (30.9%) | $92,083 |
| 45 to 64 Years | 135 (39.0%) | $91,875 |
| 65+ Years | 82 (23.7%) | $75,000 |
| Total | 346 (100.0%) | $88,000 |
Poverty in Skagway
Income Below Poverty by Sex and Age in Skagway
With 5.1% poverty level for males and 8.1% for females among the residents of Skagway, 25 to 34 year old males and 18 to 24 year old females are the most vulnerable to poverty, with 13 males (14.3%) and 19 females (26.0%) in their respective age groups living below the poverty level.
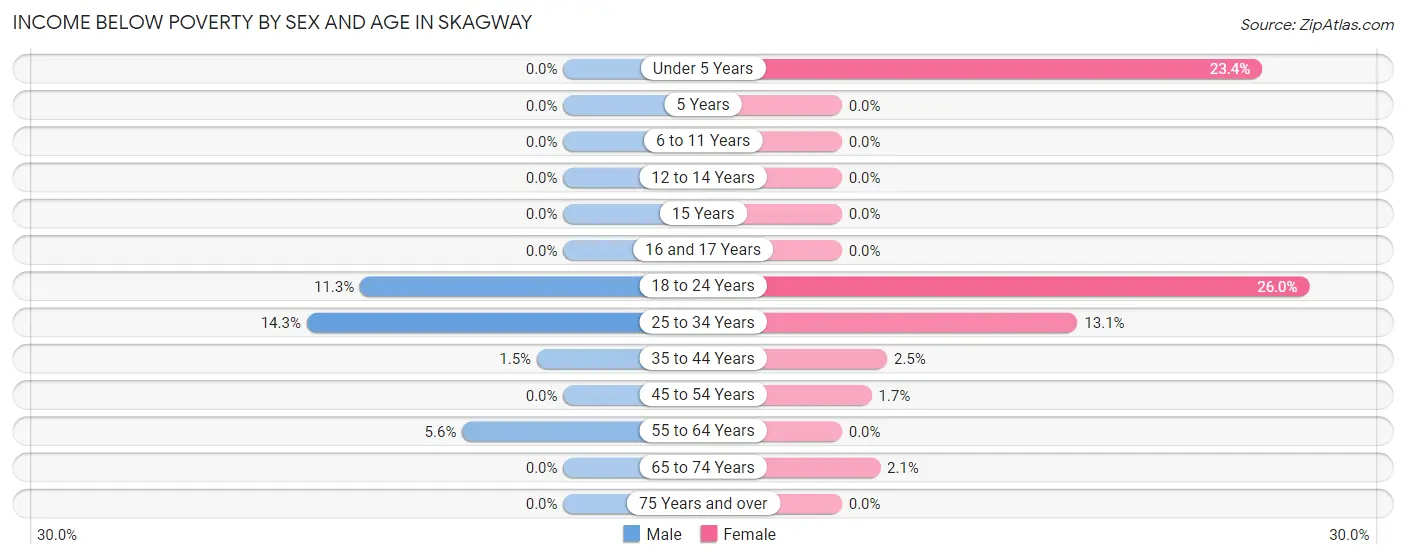
| Age Bracket | Male | Female |
| Under 5 Years | 0 (0.0%) | 11 (23.4%) |
| 5 Years | 0 (0.0%) | 0 (0.0%) |
| 6 to 11 Years | 0 (0.0%) | 0 (0.0%) |
| 12 to 14 Years | 0 (0.0%) | 0 (0.0%) |
| 15 Years | 0 (0.0%) | 0 (0.0%) |
| 16 and 17 Years | 0 (0.0%) | 0 (0.0%) |
| 18 to 24 Years | 6 (11.3%) | 19 (26.0%) |
| 25 to 34 Years | 13 (14.3%) | 21 (13.1%) |
| 35 to 44 Years | 1 (1.5%) | 3 (2.5%) |
| 45 to 54 Years | 0 (0.0%) | 2 (1.7%) |
| 55 to 64 Years | 4 (5.6%) | 0 (0.0%) |
| 65 to 74 Years | 0 (0.0%) | 1 (2.1%) |
| 75 Years and over | 0 (0.0%) | 0 (0.0%) |
| Total | 24 (5.1%) | 57 (8.1%) |
Income Above Poverty by Sex and Age in Skagway
According to the poverty statistics in Skagway, males aged under 5 years and females aged 5 years are the age groups that are most secure financially, with 100.0% of males and 100.0% of females in these age groups living above the poverty line.
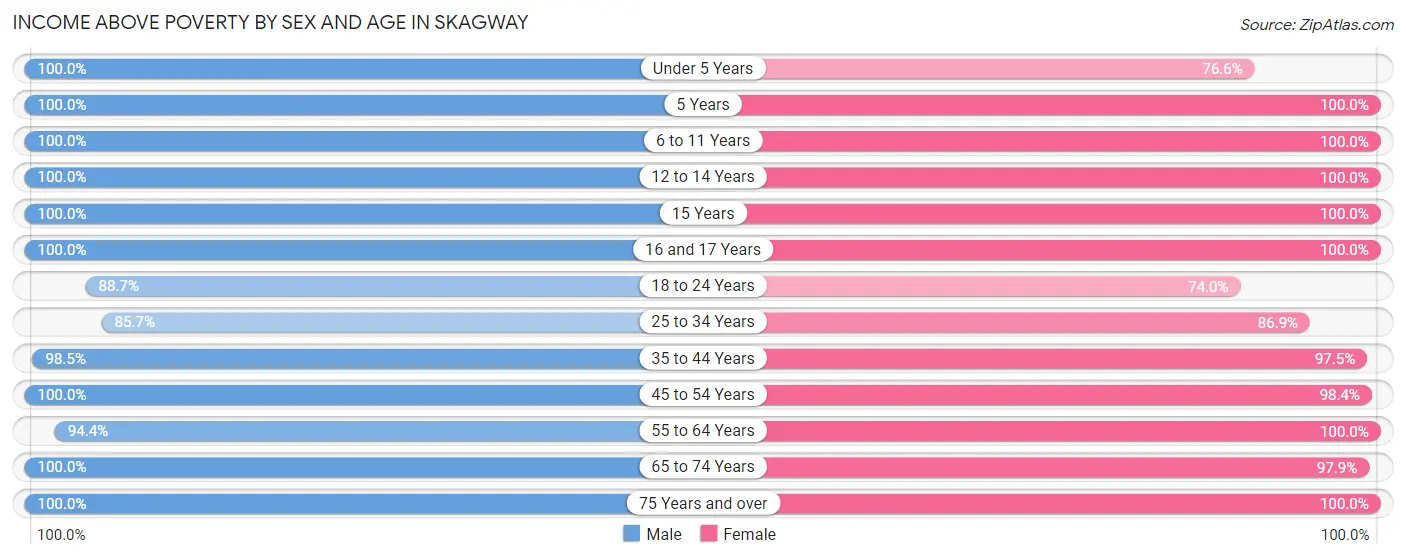
| Age Bracket | Male | Female |
| Under 5 Years | 28 (100.0%) | 36 (76.6%) |
| 5 Years | 3 (100.0%) | 3 (100.0%) |
| 6 to 11 Years | 25 (100.0%) | 28 (100.0%) |
| 12 to 14 Years | 11 (100.0%) | 22 (100.0%) |
| 15 Years | 6 (100.0%) | 4 (100.0%) |
| 16 and 17 Years | 4 (100.0%) | 10 (100.0%) |
| 18 to 24 Years | 47 (88.7%) | 54 (74.0%) |
| 25 to 34 Years | 78 (85.7%) | 139 (86.9%) |
| 35 to 44 Years | 67 (98.5%) | 116 (97.5%) |
| 45 to 54 Years | 67 (100.0%) | 119 (98.4%) |
| 55 to 64 Years | 67 (94.4%) | 44 (100.0%) |
| 65 to 74 Years | 33 (100.0%) | 46 (97.9%) |
| 75 Years and over | 13 (100.0%) | 28 (100.0%) |
| Total | 449 (94.9%) | 649 (91.9%) |
Income Below Poverty Among Married-Couple Families in Skagway
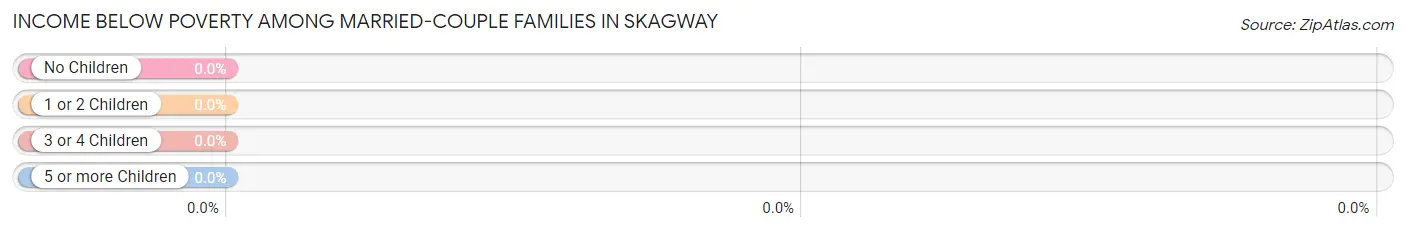
| Children | Above Poverty | Below Poverty |
| No Children | 95 (100.0%) | 0 (0.0%) |
| 1 or 2 Children | 40 (100.0%) | 0 (0.0%) |
| 3 or 4 Children | 2 (100.0%) | 0 (0.0%) |
| 5 or more Children | 1 (100.0%) | 0 (0.0%) |
| Total | 138 (100.0%) | 0 (0.0%) |
Income Below Poverty Among Single-Parent Households in Skagway
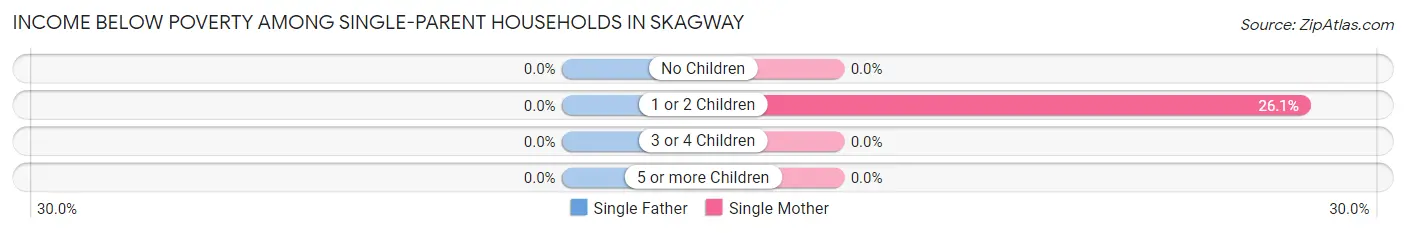
| Children | Single Father | Single Mother |
| No Children | 0 (0.0%) | 0 (0.0%) |
| 1 or 2 Children | 0 (0.0%) | 6 (26.1%) |
| 3 or 4 Children | 0 (0.0%) | 0 (0.0%) |
| 5 or more Children | 0 (0.0%) | 0 (0.0%) |
| Total | 0 (0.0%) | 6 (17.1%) |
Income Below Poverty Among Married-Couple vs Single-Parent Households in Skagway
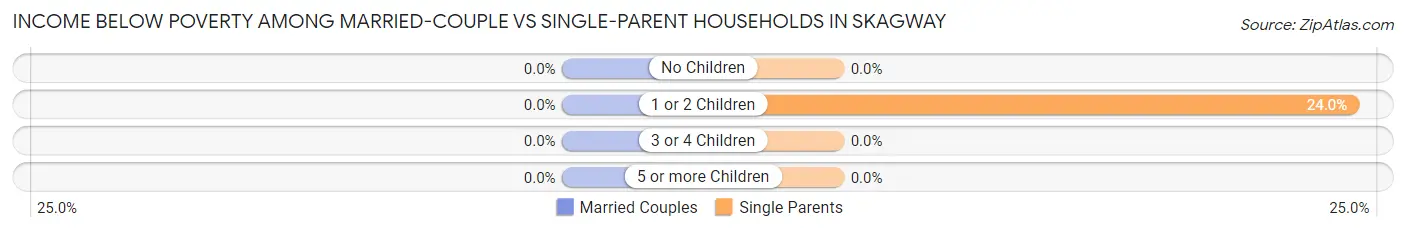
| Children | Married-Couple Families | Single-Parent Households |
| No Children | 0 (0.0%) | 0 (0.0%) |
| 1 or 2 Children | 0 (0.0%) | 6 (24.0%) |
| 3 or 4 Children | 0 (0.0%) | 0 (0.0%) |
| 5 or more Children | 0 (0.0%) | 0 (0.0%) |
| Total | 0 (0.0%) | 6 (13.6%) |
Race in Skagway
The most populous races in Skagway are White / Caucasian (933 | 79.1%), Two or more Races (115 | 9.8%), and Native / Alaskan (62 | 5.3%).
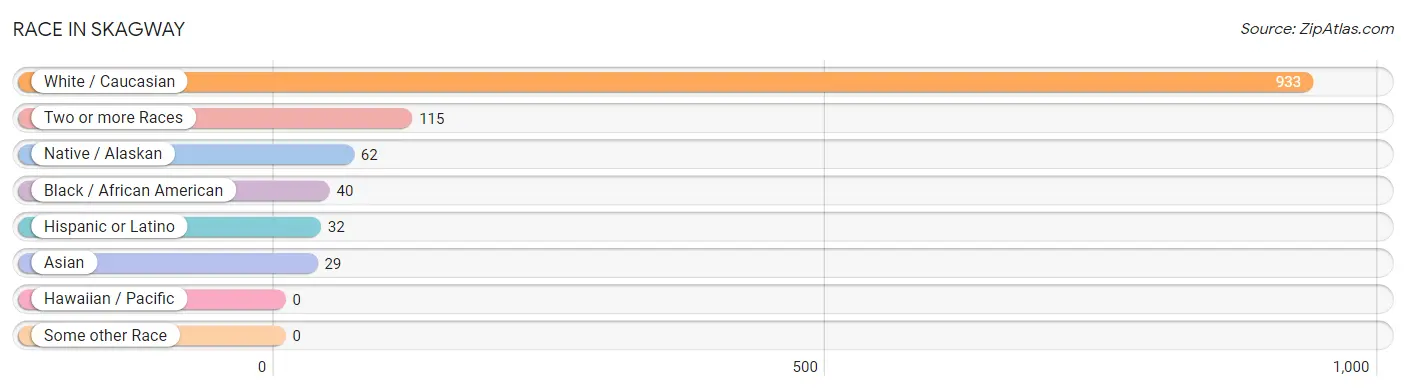
| Race | # Population | % Population |
| Asian | 29 | 2.5% |
| Black / African American | 40 | 3.4% |
| Hawaiian / Pacific | 0 | 0.0% |
| Hispanic or Latino | 32 | 2.7% |
| Native / Alaskan | 62 | 5.3% |
| White / Caucasian | 933 | 79.1% |
| Two or more Races | 115 | 9.8% |
| Some other Race | 0 | 0.0% |
| Total | 1,179 | 100.0% |
Ancestry in Skagway
The most populous ancestries reported in Skagway are Irish (175 | 14.8%), German (133 | 11.3%), English (101 | 8.6%), Bhutanese (92 | 7.8%), and Norwegian (50 | 4.2%), together accounting for 46.7% of all Skagway residents.
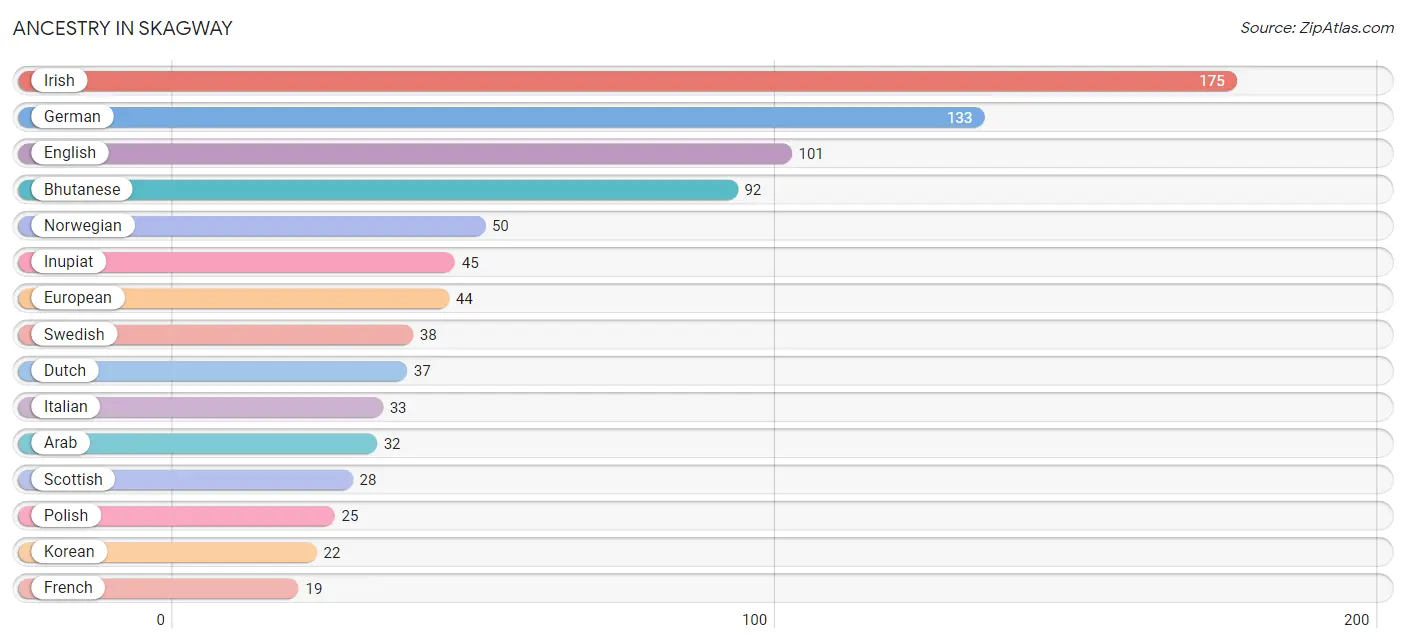
| Ancestry | # Population | % Population |
| African | 2 | 0.2% |
| Alaska Native | 5 | 0.4% |
| Aleut | 6 | 0.5% |
| American | 9 | 0.8% |
| Arab | 32 | 2.7% |
| Armenian | 2 | 0.2% |
| Belgian | 2 | 0.2% |
| Bhutanese | 92 | 7.8% |
| British | 6 | 0.5% |
| Bulgarian | 3 | 0.3% |
| Canadian | 1 | 0.1% |
| Chickasaw | 1 | 0.1% |
| Croatian | 2 | 0.2% |
| Czech | 10 | 0.9% |
| Czechoslovakian | 6 | 0.5% |
| Danish | 3 | 0.3% |
| Dutch | 37 | 3.1% |
| English | 101 | 8.6% |
| European | 44 | 3.7% |
| Finnish | 6 | 0.5% |
| French | 19 | 1.6% |
| French Canadian | 7 | 0.6% |
| German | 133 | 11.3% |
| Indian (Asian) | 5 | 0.4% |
| Inupiat | 45 | 3.8% |
| Iranian | 3 | 0.3% |
| Irish | 175 | 14.8% |
| Italian | 33 | 2.8% |
| Jamaican | 4 | 0.3% |
| Korean | 22 | 1.9% |
| Mexican | 19 | 1.6% |
| Moroccan | 3 | 0.3% |
| Northern European | 4 | 0.3% |
| Norwegian | 50 | 4.2% |
| Pennsylvania German | 1 | 0.1% |
| Peruvian | 4 | 0.3% |
| Polish | 25 | 2.1% |
| Portuguese | 7 | 0.6% |
| Russian | 4 | 0.3% |
| Scandinavian | 14 | 1.2% |
| Scotch-Irish | 13 | 1.1% |
| Scottish | 28 | 2.4% |
| Slovene | 14 | 1.2% |
| South American | 4 | 0.3% |
| Spaniard | 9 | 0.8% |
| Subsaharan African | 2 | 0.2% |
| Swedish | 38 | 3.2% |
| Swiss | 7 | 0.6% |
| Tlingit-Haida | 14 | 1.2% |
| Welsh | 1 | 0.1% |
| Yugoslavian | 4 | 0.3% | View All 51 Rows |
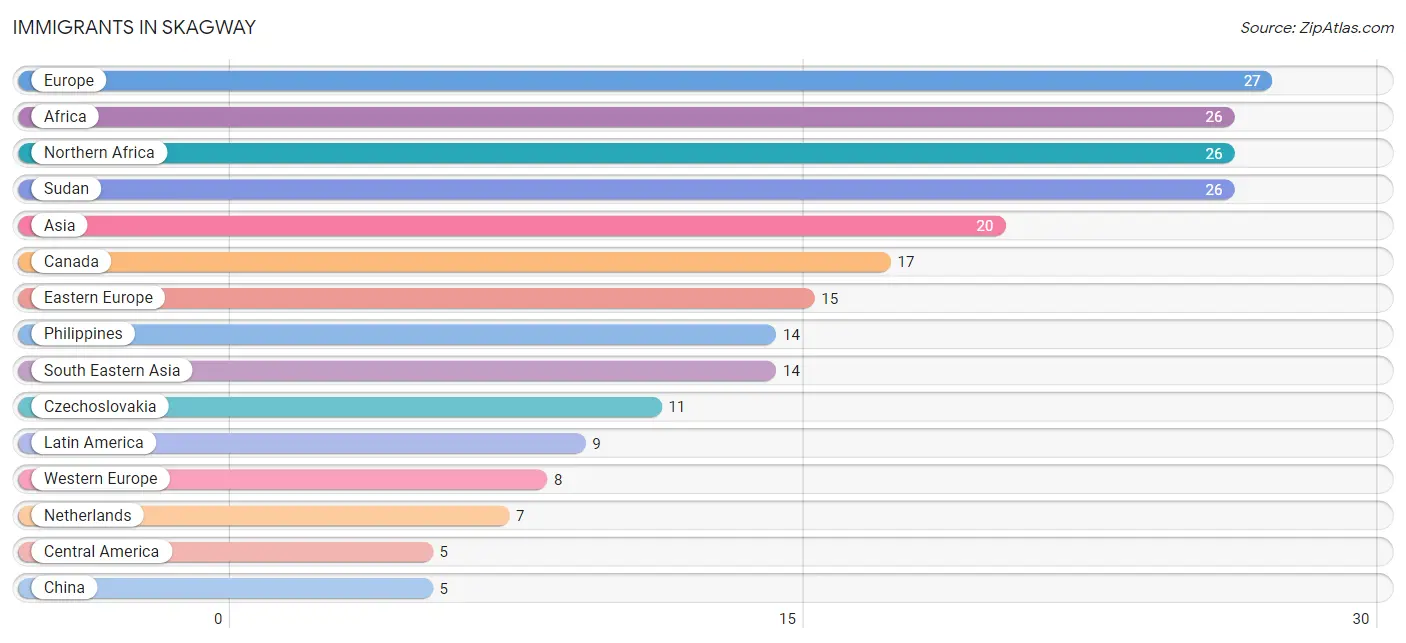
Immigrants in Skagway
The most numerous immigrant groups reported in Skagway came from Europe (27 | 2.3%), Africa (26 | 2.2%), Northern Africa (26 | 2.2%), Sudan (26 | 2.2%), and Asia (20 | 1.7%), together accounting for 10.6% of all Skagway residents.
| Immigration Origin | # Population | % Population |
| Africa | 26 | 2.2% |
| Asia | 20 | 1.7% |
| Belarus | 1 | 0.1% |
| Bulgaria | 3 | 0.3% |
| Canada | 17 | 1.4% |
| Caribbean | 4 | 0.3% |
| Central America | 5 | 0.4% |
| China | 5 | 0.4% |
| Czechoslovakia | 11 | 0.9% |
| Eastern Asia | 5 | 0.4% |
| Eastern Europe | 15 | 1.3% |
| Europe | 27 | 2.3% |
| Germany | 1 | 0.1% |
| Jamaica | 4 | 0.3% |
| Latin America | 9 | 0.8% |
| Mexico | 5 | 0.4% |
| Netherlands | 7 | 0.6% |
| Northern Africa | 26 | 2.2% |
| Northern Europe | 2 | 0.2% |
| Philippines | 14 | 1.2% |
| South Eastern Asia | 14 | 1.2% |
| Sudan | 26 | 2.2% |
| Sweden | 2 | 0.2% |
| Turkey | 1 | 0.1% |
| Western Asia | 1 | 0.1% |
| Western Europe | 8 | 0.7% | View All 26 Rows |
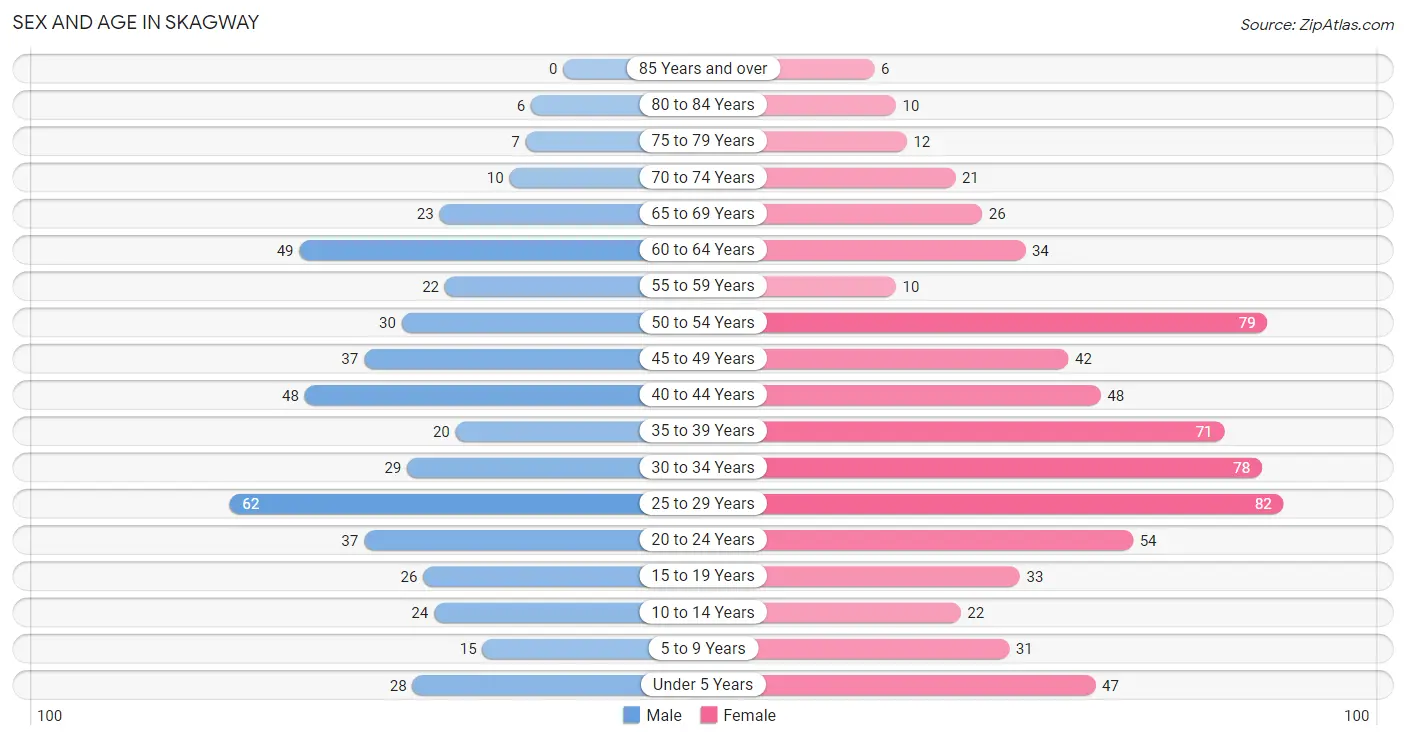
Sex and Age in Skagway
Sex and Age in Skagway
The most populous age groups in Skagway are 25 to 29 Years (62 | 13.1%) for men and 25 to 29 Years (82 | 11.6%) for women.
| Age Bracket | Male | Female |
| Under 5 Years | 28 (5.9%) | 47 (6.7%) |
| 5 to 9 Years | 15 (3.2%) | 31 (4.4%) |
| 10 to 14 Years | 24 (5.1%) | 22 (3.1%) |
| 15 to 19 Years | 26 (5.5%) | 33 (4.7%) |
| 20 to 24 Years | 37 (7.8%) | 54 (7.6%) |
| 25 to 29 Years | 62 (13.1%) | 82 (11.6%) |
| 30 to 34 Years | 29 (6.1%) | 78 (11.1%) |
| 35 to 39 Years | 20 (4.2%) | 71 (10.1%) |
| 40 to 44 Years | 48 (10.2%) | 48 (6.8%) |
| 45 to 49 Years | 37 (7.8%) | 42 (5.9%) |
| 50 to 54 Years | 30 (6.3%) | 79 (11.2%) |
| 55 to 59 Years | 22 (4.6%) | 10 (1.4%) |
| 60 to 64 Years | 49 (10.4%) | 34 (4.8%) |
| 65 to 69 Years | 23 (4.9%) | 26 (3.7%) |
| 70 to 74 Years | 10 (2.1%) | 21 (3.0%) |
| 75 to 79 Years | 7 (1.5%) | 12 (1.7%) |
| 80 to 84 Years | 6 (1.3%) | 10 (1.4%) |
| 85 Years and over | 0 (0.0%) | 6 (0.9%) |
| Total | 473 (100.0%) | 706 (100.0%) |
Families and Households in Skagway
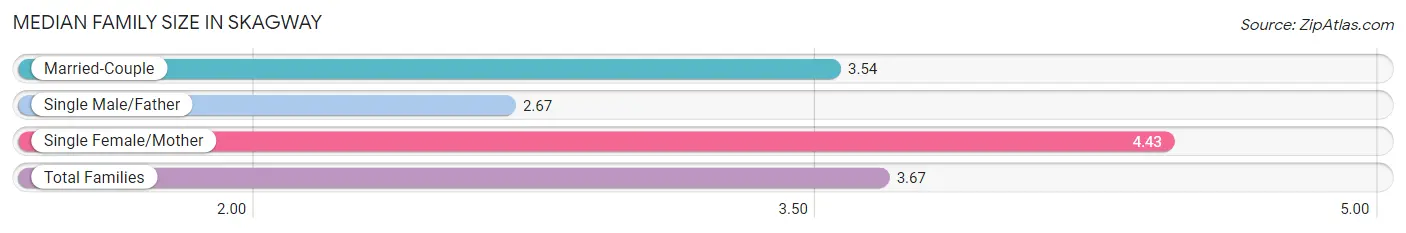
Median Family Size in Skagway
The median family size in Skagway is 3.67 persons per family, with single female/mother families (35 | 19.2%) accounting for the largest median family size of 4.43 persons per family. On the other hand, single male/father families (9 | 5.0%) represent the smallest median family size with 2.67 persons per family.
| Family Type | # Families | Family Size |
| Married-Couple | 138 (75.8%) | 3.54 |
| Single Male/Father | 9 (5.0%) | 2.67 |
| Single Female/Mother | 35 (19.2%) | 4.43 |
| Total Families | 182 (100.0%) | 3.67 |
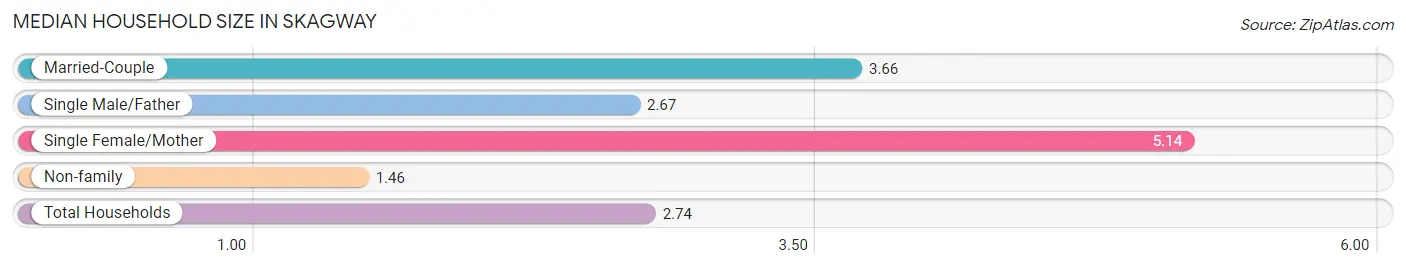
Median Household Size in Skagway
The median household size in Skagway is 2.74 persons per household, with single female/mother households (35 | 10.1%) accounting for the largest median household size of 5.14 persons per household. non-family households (164 | 47.4%) represent the smallest median household size with 1.46 persons per household.
| Household Type | # Households | Household Size |
| Married-Couple | 138 (39.9%) | 3.66 |
| Single Male/Father | 9 (2.6%) | 2.67 |
| Single Female/Mother | 35 (10.1%) | 5.14 |
| Non-family | 164 (47.4%) | 1.46 |
| Total Households | 346 (100.0%) | 2.74 |
Household Size by Marriage Status in Skagway
Out of a total of 346 households in Skagway, 182 (52.6%) are family households, while 164 (47.4%) are nonfamily households. The most numerous type of family households are 2-person households, comprising 102, and the most common type of nonfamily households are 1-person households, comprising 129.
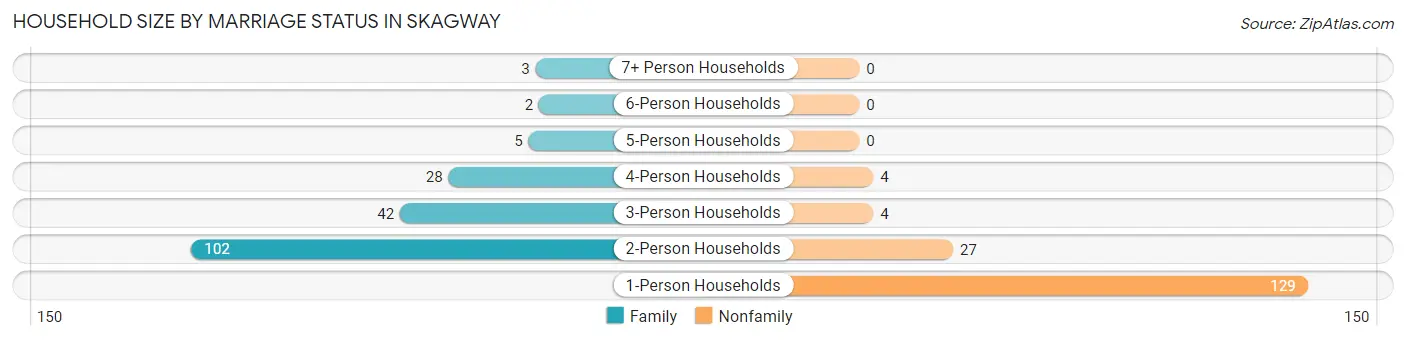
| Household Size | Family Households | Nonfamily Households |
| 1-Person Households | - | 129 (37.3%) |
| 2-Person Households | 102 (29.5%) | 27 (7.8%) |
| 3-Person Households | 42 (12.1%) | 4 (1.2%) |
| 4-Person Households | 28 (8.1%) | 4 (1.2%) |
| 5-Person Households | 5 (1.5%) | 0 (0.0%) |
| 6-Person Households | 2 (0.6%) | 0 (0.0%) |
| 7+ Person Households | 3 (0.9%) | 0 (0.0%) |
| Total | 182 (52.6%) | 164 (47.4%) |
Female Fertility in Skagway
Fertility by Age in Skagway
Average fertility rate in Skagway is 74.0 births per 1,000 women. Women in the age bracket of 20 to 34 years have the highest fertility rate with 84.0 births per 1,000 women. Women in the age bracket of 20 to 34 years acount for 60.0% of all women with births.
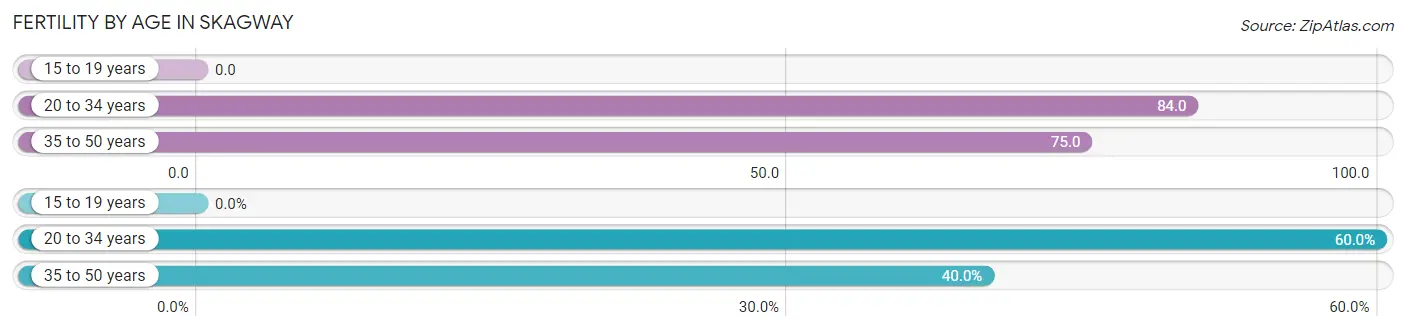
| Age Bracket | Women with Births | Births / 1,000 Women |
| 15 to 19 years | 0 (0.0%) | 0.0 |
| 20 to 34 years | 18 (60.0%) | 84.0 |
| 35 to 50 years | 12 (40.0%) | 75.0 |
| Total | 30 (100.0%) | 74.0 |
Fertility by Age by Marriage Status in Skagway
43.3% of women with births (30) in Skagway are married. The highest percentage of unmarried women with births falls into 20 to 34 years age bracket with 94.4% of them unmarried at the time of birth, while the lowest percentage of unmarried women with births belong to 35 to 50 years age bracket with 0.0% of them unmarried.
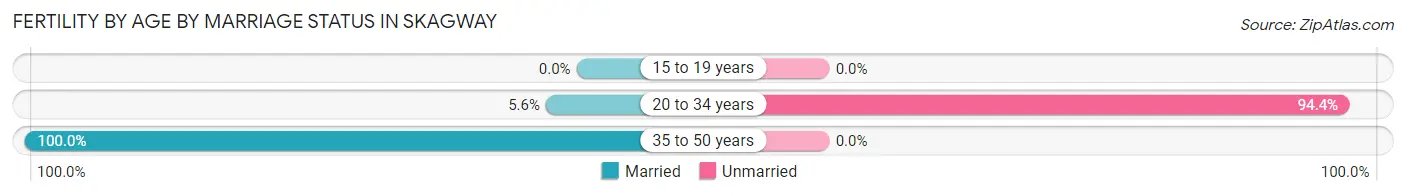
| Age Bracket | Married | Unmarried |
| 15 to 19 years | 0 (0.0%) | 0 (0.0%) |
| 20 to 34 years | 1 (5.6%) | 17 (94.4%) |
| 35 to 50 years | 12 (100.0%) | 0 (0.0%) |
| Total | 13 (43.3%) | 17 (56.7%) |
Fertility by Education in Skagway
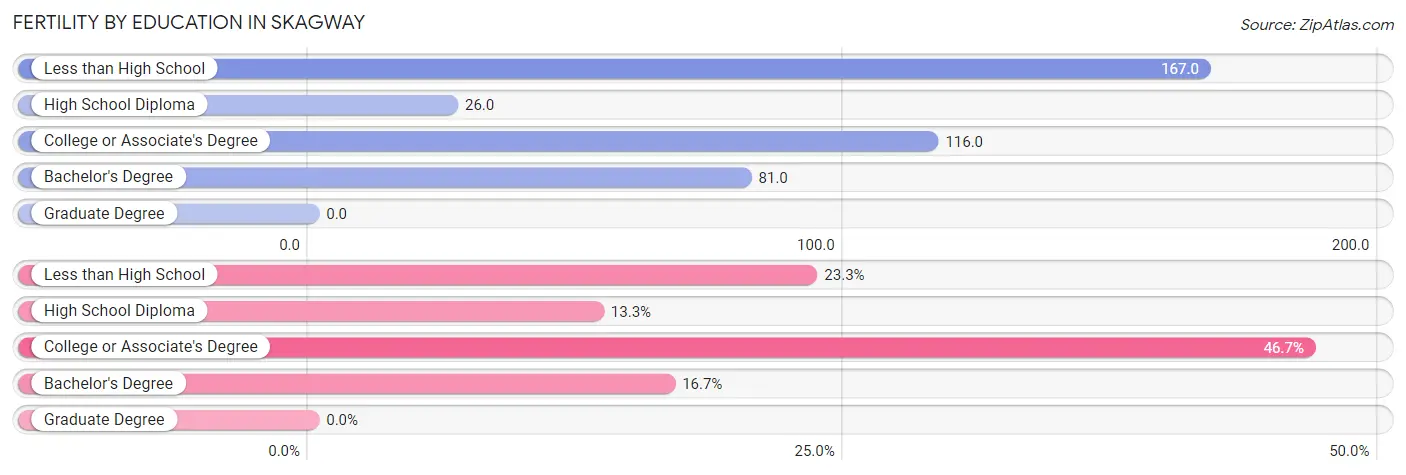
| Educational Attainment | Women with Births | Births / 1,000 Women |
| Less than High School | 7 (23.3%) | 167.0 |
| High School Diploma | 4 (13.3%) | 26.0 |
| College or Associate's Degree | 14 (46.7%) | 116.0 |
| Bachelor's Degree | 5 (16.7%) | 81.0 |
| Graduate Degree | 0 (0.0%) | 0.0 |
| Total | 30 (100.0%) | 74.0 |
Fertility by Education by Marriage Status in Skagway
56.7% of women with births in Skagway are unmarried. Women with the educational attainment of high school diploma are most likely to be married with 100.0% of them married at childbirth, while women with the educational attainment of less than high school are least likely to be married with 100.0% of them unmarried at childbirth.
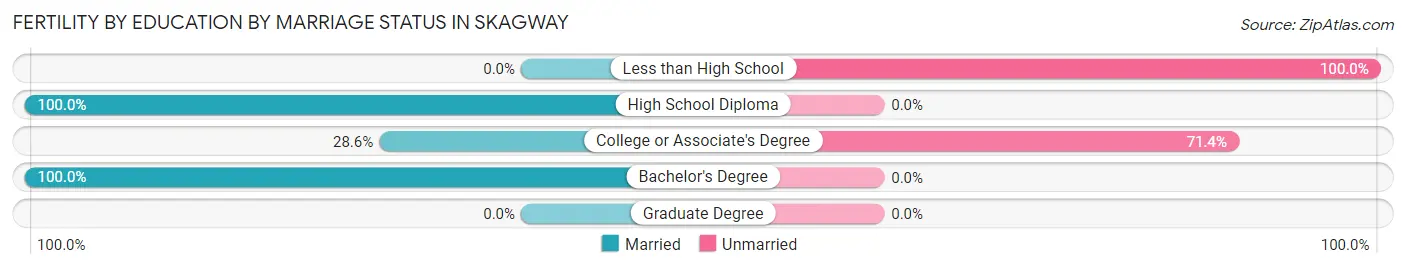
| Educational Attainment | Married | Unmarried |
| Less than High School | 0 (0.0%) | 7 (100.0%) |
| High School Diploma | 4 (100.0%) | 0 (0.0%) |
| College or Associate's Degree | 4 (28.6%) | 10 (71.4%) |
| Bachelor's Degree | 5 (100.0%) | 0 (0.0%) |
| Graduate Degree | 0 (0.0%) | 0 (0.0%) |
| Total | 13 (43.3%) | 17 (56.7%) |
Employment Characteristics in Skagway
Employment by Class of Employer in Skagway
Among the 724 employed individuals in Skagway, private company employees (379 | 52.3%), local government employees (133 | 18.4%), and federal government employees (66 | 9.1%) make up the most common classes of employment.
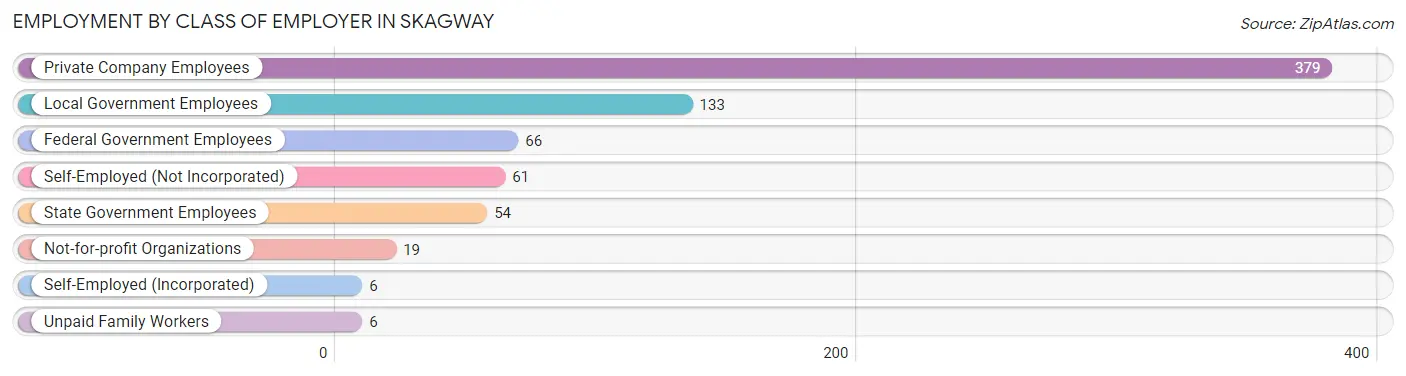
| Employer Class | # Employees | % Employees |
| Private Company Employees | 379 | 52.3% |
| Self-Employed (Incorporated) | 6 | 0.8% |
| Self-Employed (Not Incorporated) | 61 | 8.4% |
| Not-for-profit Organizations | 19 | 2.6% |
| Local Government Employees | 133 | 18.4% |
| State Government Employees | 54 | 7.5% |
| Federal Government Employees | 66 | 9.1% |
| Unpaid Family Workers | 6 | 0.8% |
| Total | 724 | 100.0% |
Employment Status by Age in Skagway
According to the labor force statistics for Skagway, out of the total population over 16 years of age (1,002), 82.5% or 827 individuals are in the labor force, with 11.4% or 94 of them unemployed. The age group with the highest labor force participation rate is 30 to 34 years, with 100.0% or 107 individuals in the labor force. Within the labor force, the 45 to 54 years age range has the highest percentage of unemployed individuals, with 26.8% or 48 of them being unemployed.
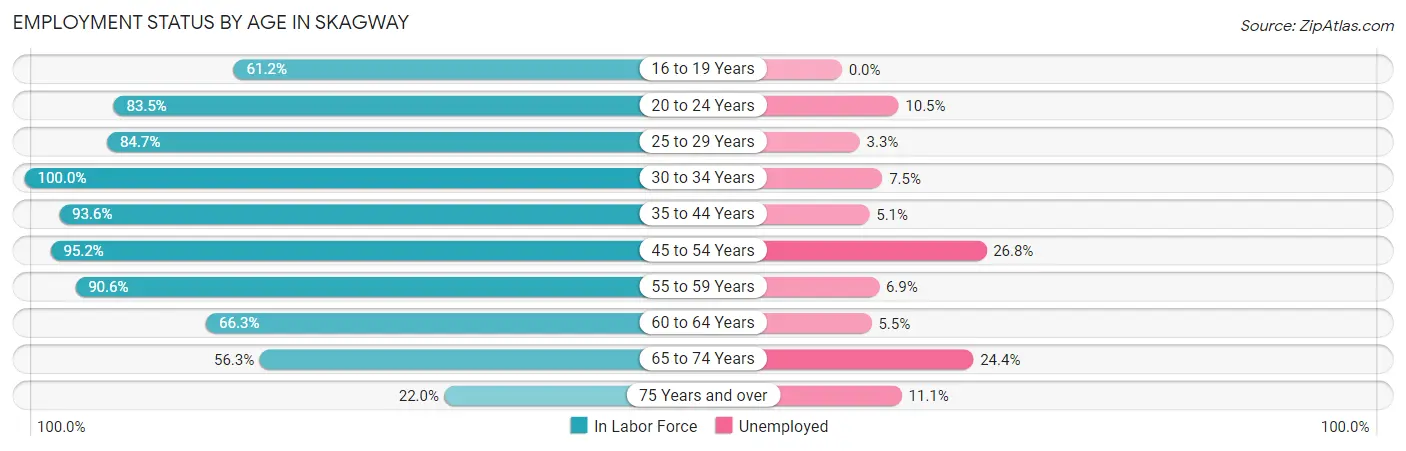
| Age Bracket | In Labor Force | Unemployed |
| 16 to 19 Years | 30 (61.2%) | 0 (0.0%) |
| 20 to 24 Years | 76 (83.5%) | 8 (10.5%) |
| 25 to 29 Years | 122 (84.7%) | 4 (3.3%) |
| 30 to 34 Years | 107 (100.0%) | 8 (7.5%) |
| 35 to 44 Years | 175 (93.6%) | 9 (5.1%) |
| 45 to 54 Years | 179 (95.2%) | 48 (26.8%) |
| 55 to 59 Years | 29 (90.6%) | 2 (6.9%) |
| 60 to 64 Years | 55 (66.3%) | 3 (5.5%) |
| 65 to 74 Years | 45 (56.3%) | 11 (24.4%) |
| 75 Years and over | 9 (22.0%) | 1 (11.1%) |
| Total | 827 (82.5%) | 94 (11.4%) |
Employment Status by Educational Attainment in Skagway
According to labor force statistics for Skagway, 90.0% of individuals (667) out of the total population between 25 and 64 years of age (741) are in the labor force, with 11.1% or 74 of them being unemployed. The group with the highest labor force participation rate are those with the educational attainment of high school diploma, with 92.4% or 257 individuals in the labor force. Within the labor force, individuals with college / associate degree education have the highest percentage of unemployment, with 26.7% or 59 of them being unemployed.
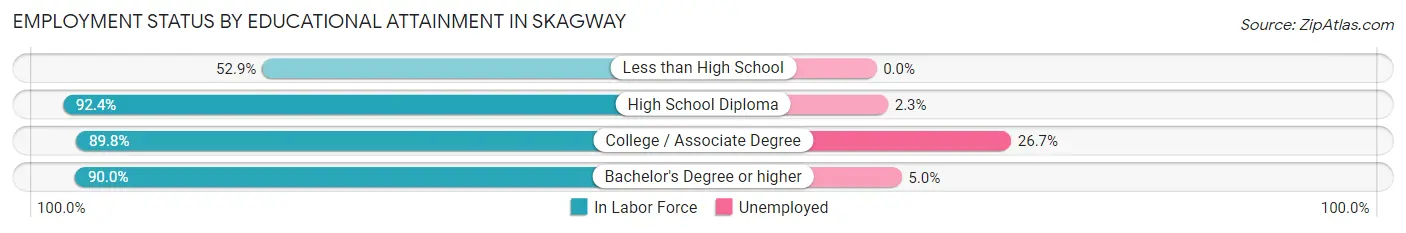
| Educational Attainment | In Labor Force | Unemployed |
| Less than High School | 9 (52.9%) | 0 (0.0%) |
| High School Diploma | 257 (92.4%) | 6 (2.3%) |
| College / Associate Degree | 221 (89.8%) | 66 (26.7%) |
| Bachelor's Degree or higher | 180 (90.0%) | 10 (5.0%) |
| Total | 667 (90.0%) | 82 (11.1%) |
Employment Occupations by Sex in Skagway
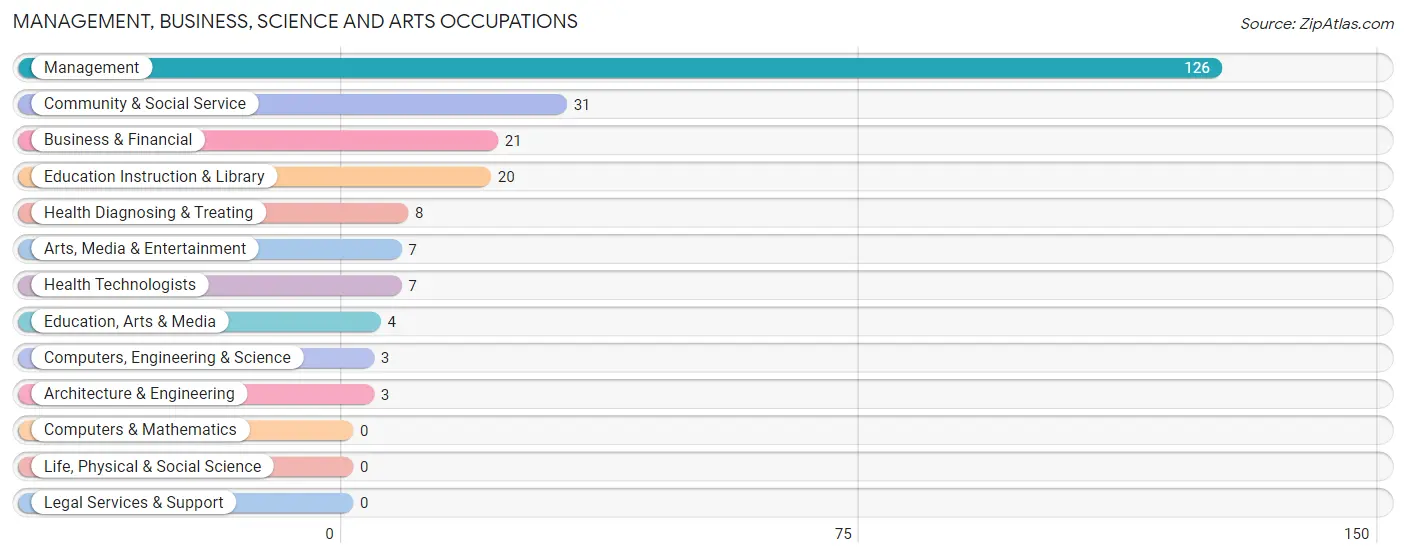
Management, Business, Science and Arts Occupations
The most common Management, Business, Science and Arts occupations in Skagway are Management (126 | 17.2%), Community & Social Service (31 | 4.2%), Business & Financial (21 | 2.9%), Education Instruction & Library (20 | 2.7%), and Health Diagnosing & Treating (8 | 1.1%).
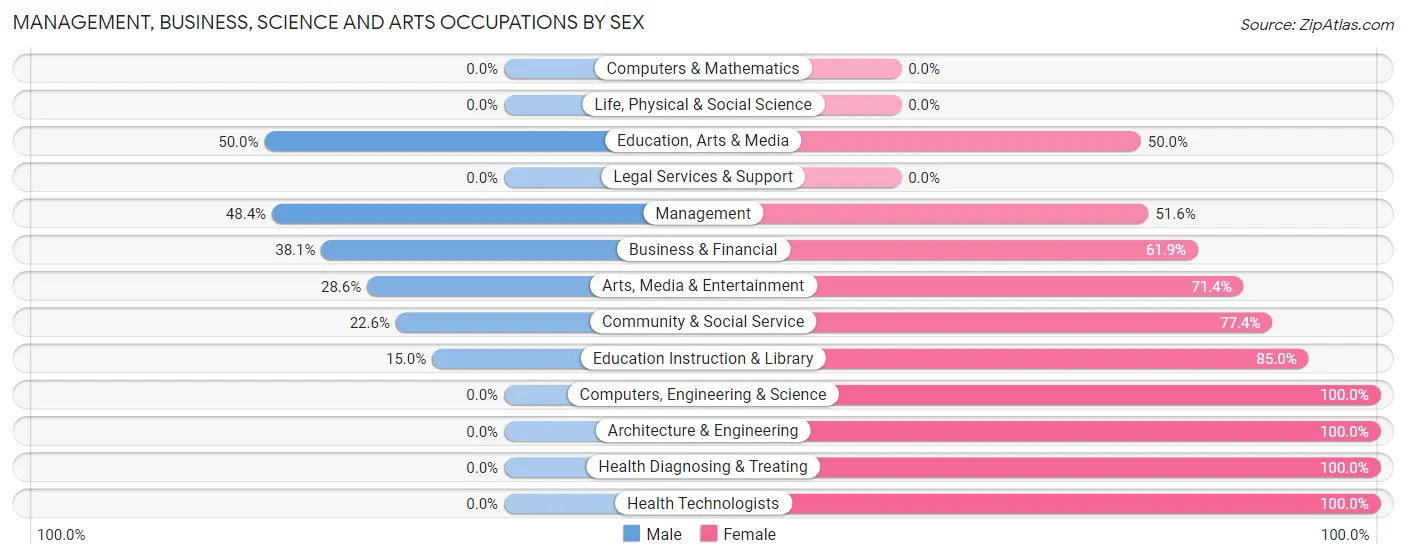
Management, Business, Science and Arts Occupations by Sex
Within the Management, Business, Science and Arts occupations in Skagway, the most male-oriented occupations are Education, Arts & Media (50.0%), Management (48.4%), and Business & Financial (38.1%), while the most female-oriented occupations are Computers, Engineering & Science (100.0%), Architecture & Engineering (100.0%), and Health Diagnosing & Treating (100.0%).
| Occupation | Male | Female |
| Management | 61 (48.4%) | 65 (51.6%) |
| Business & Financial | 8 (38.1%) | 13 (61.9%) |
| Computers, Engineering & Science | 0 (0.0%) | 3 (100.0%) |
| Computers & Mathematics | 0 (0.0%) | 0 (0.0%) |
| Architecture & Engineering | 0 (0.0%) | 3 (100.0%) |
| Life, Physical & Social Science | 0 (0.0%) | 0 (0.0%) |
| Community & Social Service | 7 (22.6%) | 24 (77.4%) |
| Education, Arts & Media | 2 (50.0%) | 2 (50.0%) |
| Legal Services & Support | 0 (0.0%) | 0 (0.0%) |
| Education Instruction & Library | 3 (15.0%) | 17 (85.0%) |
| Arts, Media & Entertainment | 2 (28.6%) | 5 (71.4%) |
| Health Diagnosing & Treating | 0 (0.0%) | 8 (100.0%) |
| Health Technologists | 0 (0.0%) | 7 (100.0%) |
| Total (Category) | 76 (40.2%) | 113 (59.8%) |
| Total (Overall) | 322 (43.9%) | 411 (56.1%) |
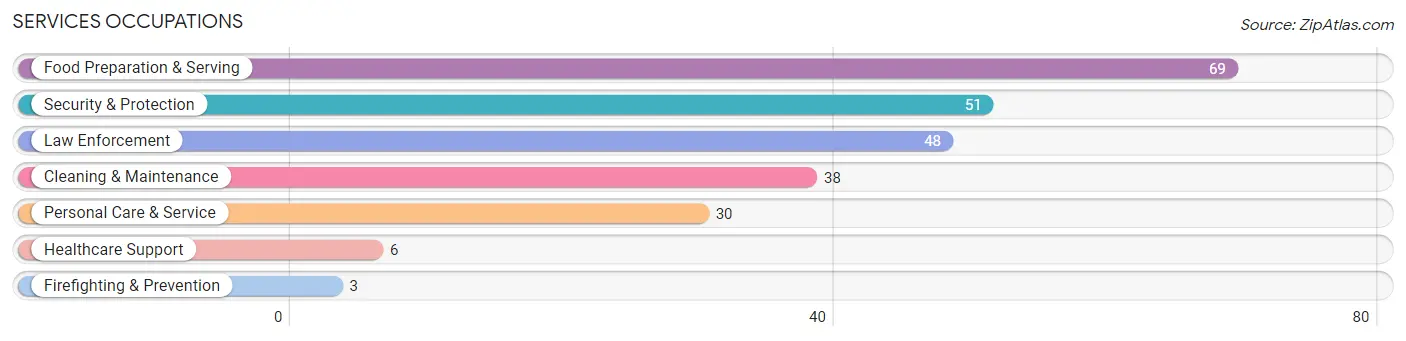
Services Occupations
The most common Services occupations in Skagway are Food Preparation & Serving (69 | 9.4%), Security & Protection (51 | 7.0%), Law Enforcement (48 | 6.6%), Cleaning & Maintenance (38 | 5.2%), and Personal Care & Service (30 | 4.1%).
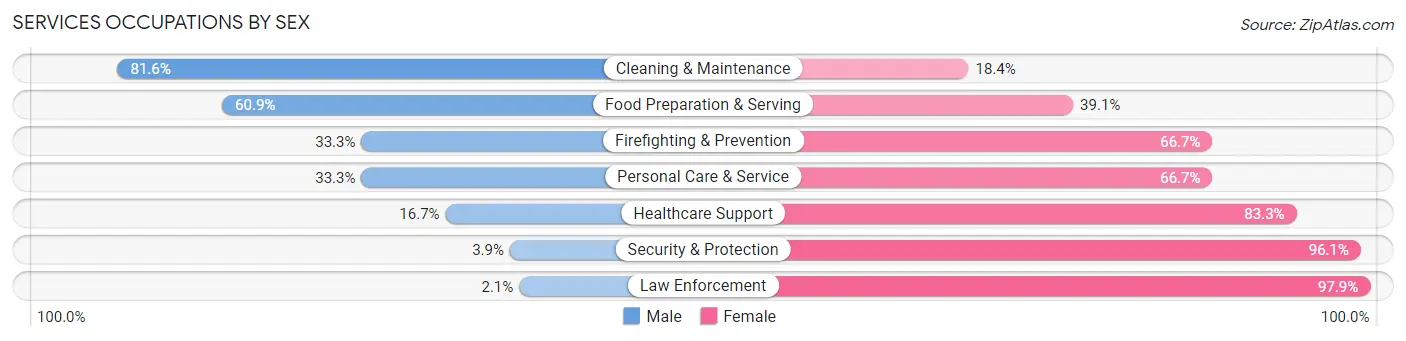
Services Occupations by Sex
Within the Services occupations in Skagway, the most male-oriented occupations are Cleaning & Maintenance (81.6%), Food Preparation & Serving (60.9%), and Firefighting & Prevention (33.3%), while the most female-oriented occupations are Law Enforcement (97.9%), Security & Protection (96.1%), and Healthcare Support (83.3%).
| Occupation | Male | Female |
| Healthcare Support | 1 (16.7%) | 5 (83.3%) |
| Security & Protection | 2 (3.9%) | 49 (96.1%) |
| Firefighting & Prevention | 1 (33.3%) | 2 (66.7%) |
| Law Enforcement | 1 (2.1%) | 47 (97.9%) |
| Food Preparation & Serving | 42 (60.9%) | 27 (39.1%) |
| Cleaning & Maintenance | 31 (81.6%) | 7 (18.4%) |
| Personal Care & Service | 10 (33.3%) | 20 (66.7%) |
| Total (Category) | 86 (44.3%) | 108 (55.7%) |
| Total (Overall) | 322 (43.9%) | 411 (56.1%) |
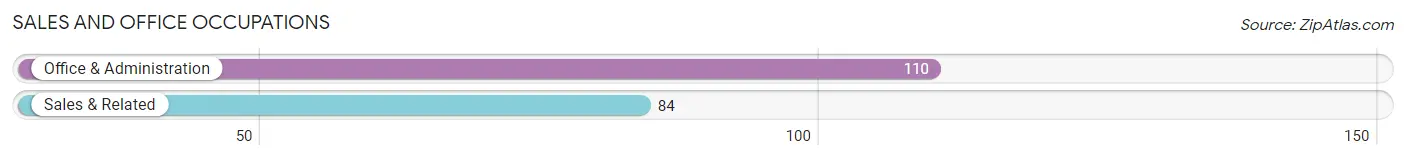
Sales and Office Occupations
The most common Sales and Office occupations in Skagway are Office & Administration (110 | 15.0%), and Sales & Related (84 | 11.5%).
Sales and Office Occupations by Sex
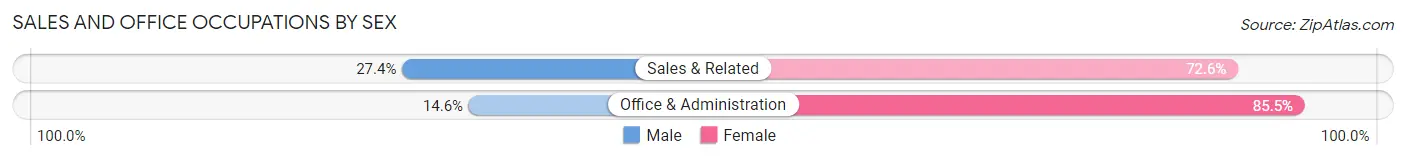
| Occupation | Male | Female |
| Sales & Related | 23 (27.4%) | 61 (72.6%) |
| Office & Administration | 16 (14.5%) | 94 (85.5%) |
| Total (Category) | 39 (20.1%) | 155 (79.9%) |
| Total (Overall) | 322 (43.9%) | 411 (56.1%) |
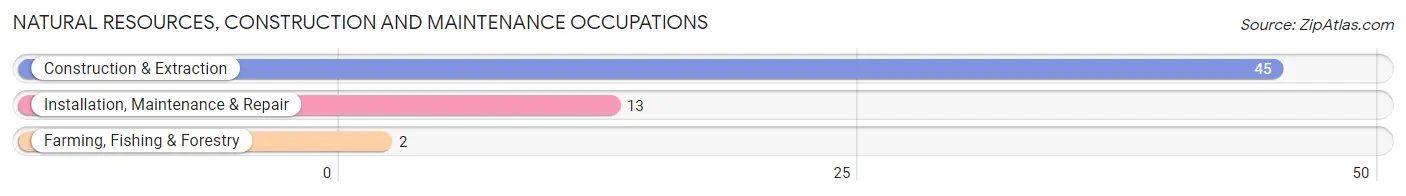
Natural Resources, Construction and Maintenance Occupations
The most common Natural Resources, Construction and Maintenance occupations in Skagway are Construction & Extraction (45 | 6.1%), Installation, Maintenance & Repair (13 | 1.8%), and Farming, Fishing & Forestry (2 | 0.3%).
Natural Resources, Construction and Maintenance Occupations by Sex
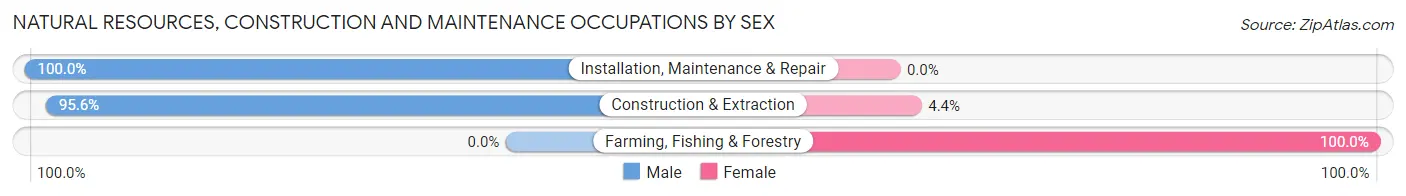
| Occupation | Male | Female |
| Farming, Fishing & Forestry | 0 (0.0%) | 2 (100.0%) |
| Construction & Extraction | 43 (95.6%) | 2 (4.4%) |
| Installation, Maintenance & Repair | 13 (100.0%) | 0 (0.0%) |
| Total (Category) | 56 (93.3%) | 4 (6.7%) |
| Total (Overall) | 322 (43.9%) | 411 (56.1%) |
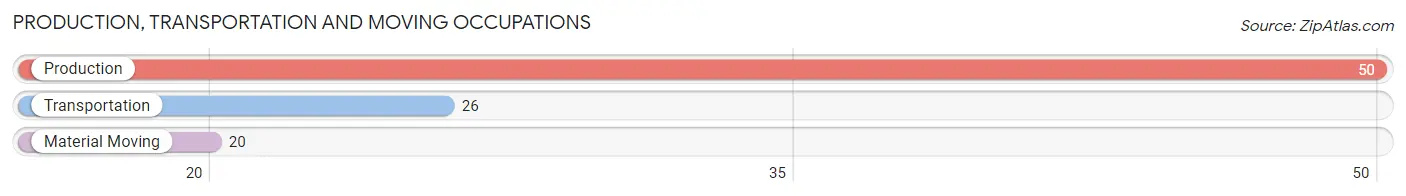
Production, Transportation and Moving Occupations
The most common Production, Transportation and Moving occupations in Skagway are Production (50 | 6.8%), Transportation (26 | 3.5%), and Material Moving (20 | 2.7%).
Production, Transportation and Moving Occupations by Sex
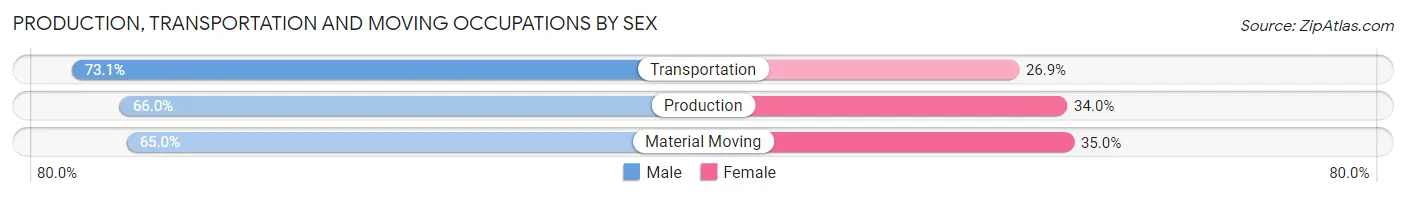
| Occupation | Male | Female |
| Production | 33 (66.0%) | 17 (34.0%) |
| Transportation | 19 (73.1%) | 7 (26.9%) |
| Material Moving | 13 (65.0%) | 7 (35.0%) |
| Total (Category) | 65 (67.7%) | 31 (32.3%) |
| Total (Overall) | 322 (43.9%) | 411 (56.1%) |
Employment Industries by Sex in Skagway
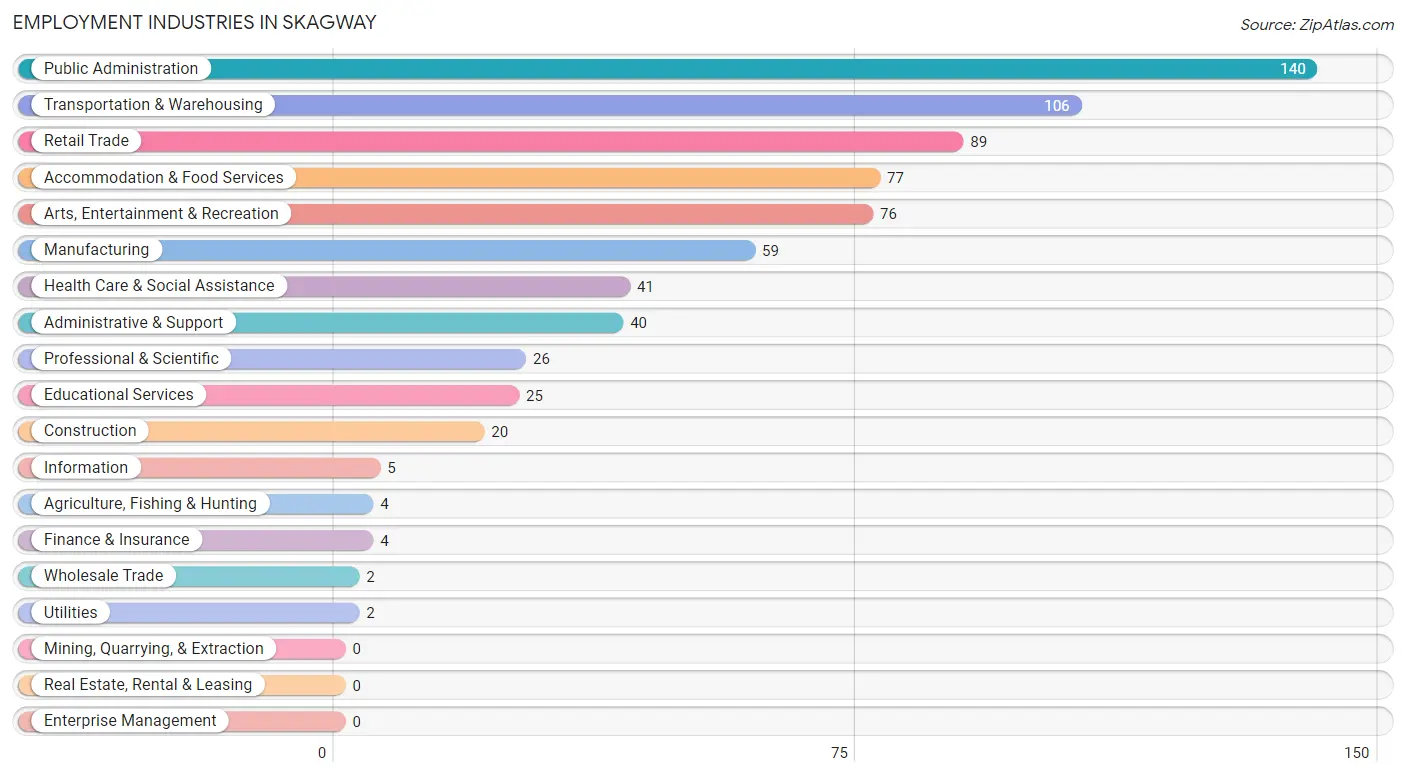
Employment Industries in Skagway
The major employment industries in Skagway include Public Administration (140 | 19.1%), Transportation & Warehousing (106 | 14.5%), Retail Trade (89 | 12.1%), Accommodation & Food Services (77 | 10.5%), and Arts, Entertainment & Recreation (76 | 10.4%).
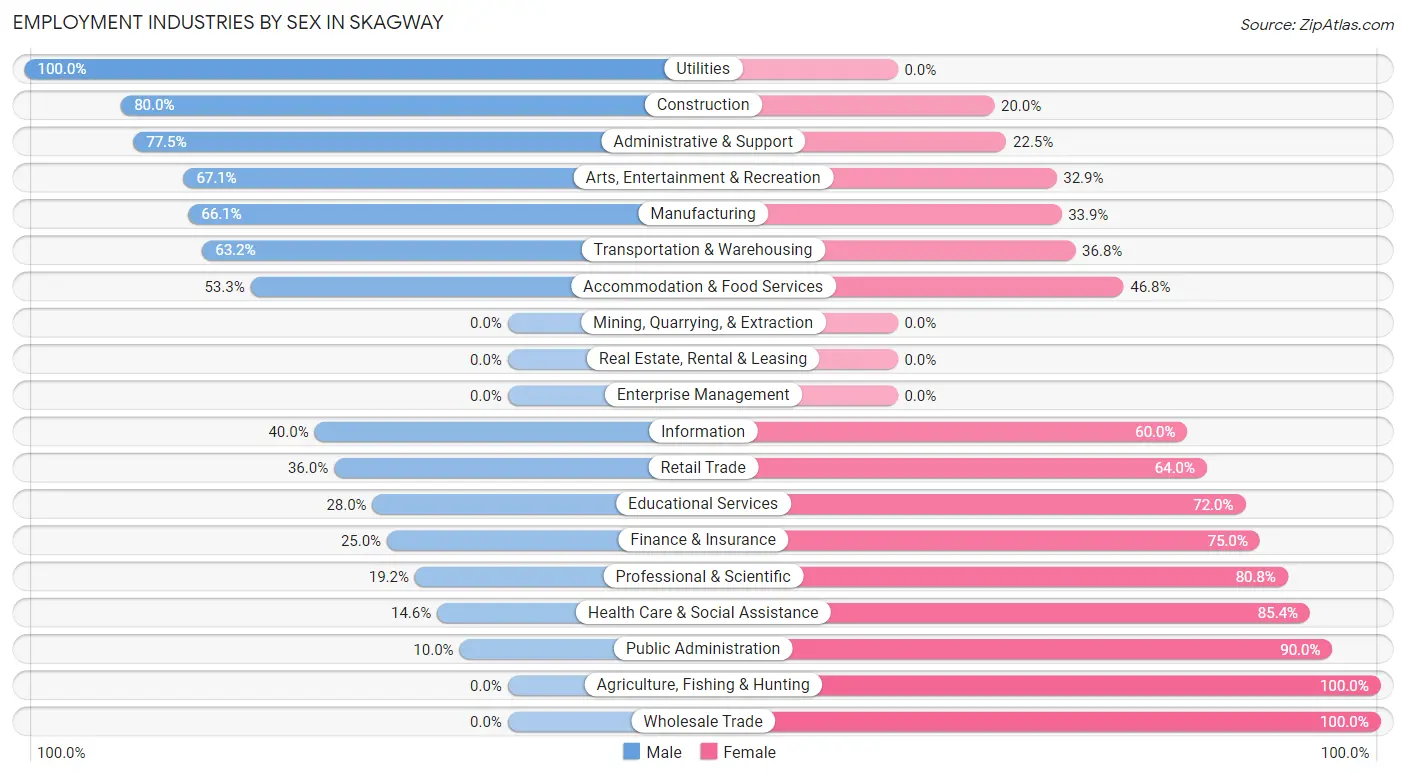
Employment Industries by Sex in Skagway
The Skagway industries that see more men than women are Utilities (100.0%), Construction (80.0%), and Administrative & Support (77.5%), whereas the industries that tend to have a higher number of women are Agriculture, Fishing & Hunting (100.0%), Wholesale Trade (100.0%), and Public Administration (90.0%).
| Industry | Male | Female |
| Agriculture, Fishing & Hunting | 0 (0.0%) | 4 (100.0%) |
| Mining, Quarrying, & Extraction | 0 (0.0%) | 0 (0.0%) |
| Construction | 16 (80.0%) | 4 (20.0%) |
| Manufacturing | 39 (66.1%) | 20 (33.9%) |
| Wholesale Trade | 0 (0.0%) | 2 (100.0%) |
| Retail Trade | 32 (36.0%) | 57 (64.0%) |
| Transportation & Warehousing | 67 (63.2%) | 39 (36.8%) |
| Utilities | 2 (100.0%) | 0 (0.0%) |
| Information | 2 (40.0%) | 3 (60.0%) |
| Finance & Insurance | 1 (25.0%) | 3 (75.0%) |
| Real Estate, Rental & Leasing | 0 (0.0%) | 0 (0.0%) |
| Professional & Scientific | 5 (19.2%) | 21 (80.8%) |
| Enterprise Management | 0 (0.0%) | 0 (0.0%) |
| Administrative & Support | 31 (77.5%) | 9 (22.5%) |
| Educational Services | 7 (28.0%) | 18 (72.0%) |
| Health Care & Social Assistance | 6 (14.6%) | 35 (85.4%) |
| Arts, Entertainment & Recreation | 51 (67.1%) | 25 (32.9%) |
| Accommodation & Food Services | 41 (53.2%) | 36 (46.8%) |
| Public Administration | 14 (10.0%) | 126 (90.0%) |
| Total | 322 (43.9%) | 411 (56.1%) |
Education in Skagway
School Enrollment in Skagway
The most common levels of schooling among the 208 students in Skagway are college / undergraduate (69 | 33.2%), high school (50 | 24.0%), and elementary school (34 | 16.4%).
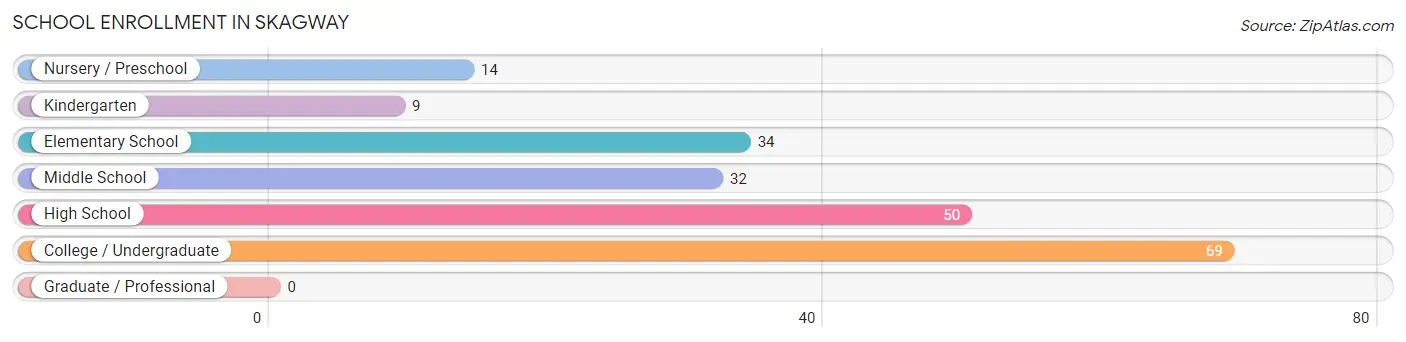
| School Level | # Students | % Students |
| Nursery / Preschool | 14 | 6.7% |
| Kindergarten | 9 | 4.3% |
| Elementary School | 34 | 16.4% |
| Middle School | 32 | 15.4% |
| High School | 50 | 24.0% |
| College / Undergraduate | 69 | 33.2% |
| Graduate / Professional | 0 | 0.0% |
| Total | 208 | 100.0% |
School Enrollment by Age by Funding Source in Skagway
Out of a total of 208 students who are enrolled in schools in Skagway, 2 (1.0%) attend a private institution, while the remaining 206 (99.0%) are enrolled in public schools. The age group of 18 to 19 year olds has the highest likelihood of being enrolled in private schools, with 2 (9.5% in the age bracket) enrolled. Conversely, the age group of 3 to 4 year olds has the lowest likelihood of being enrolled in a private school, with 11 (100.0% in the age bracket) attending a public institution.
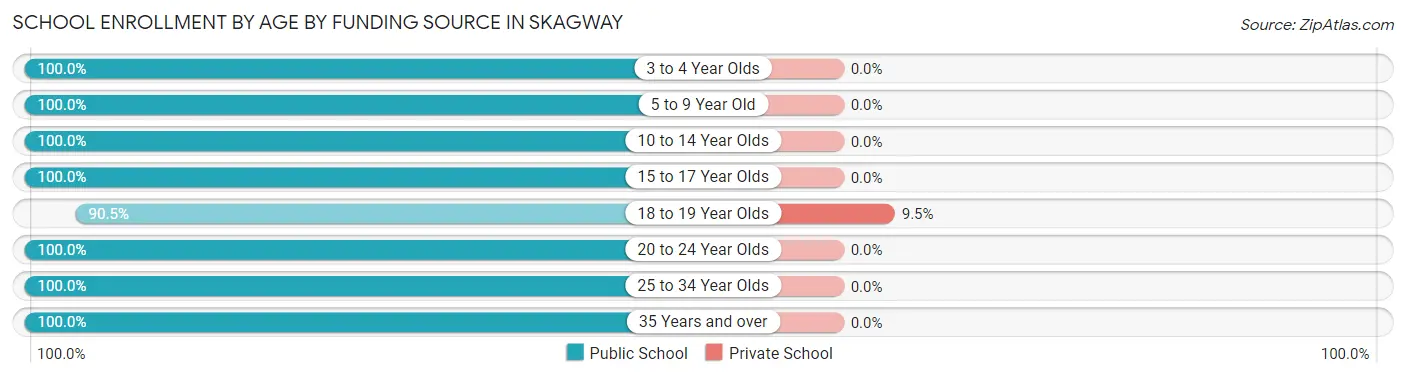
| Age Bracket | Public School | Private School |
| 3 to 4 Year Olds | 11 (100.0%) | 0 (0.0%) |
| 5 to 9 Year Old | 46 (100.0%) | 0 (0.0%) |
| 10 to 14 Year Olds | 46 (100.0%) | 0 (0.0%) |
| 15 to 17 Year Olds | 22 (100.0%) | 0 (0.0%) |
| 18 to 19 Year Olds | 19 (90.5%) | 2 (9.5%) |
| 20 to 24 Year Olds | 14 (100.0%) | 0 (0.0%) |
| 25 to 34 Year Olds | 3 (100.0%) | 0 (0.0%) |
| 35 Years and over | 45 (100.0%) | 0 (0.0%) |
| Total | 206 (99.0%) | 2 (1.0%) |
Educational Attainment by Field of Study in Skagway
Physical & health sciences (42 | 16.5%), business (32 | 12.6%), bio, nature & agricultural (29 | 11.4%), arts & humanities (25 | 9.8%), and education (21 | 8.2%) are the most common fields of study among 255 individuals in Skagway who have obtained a bachelor's degree or higher.
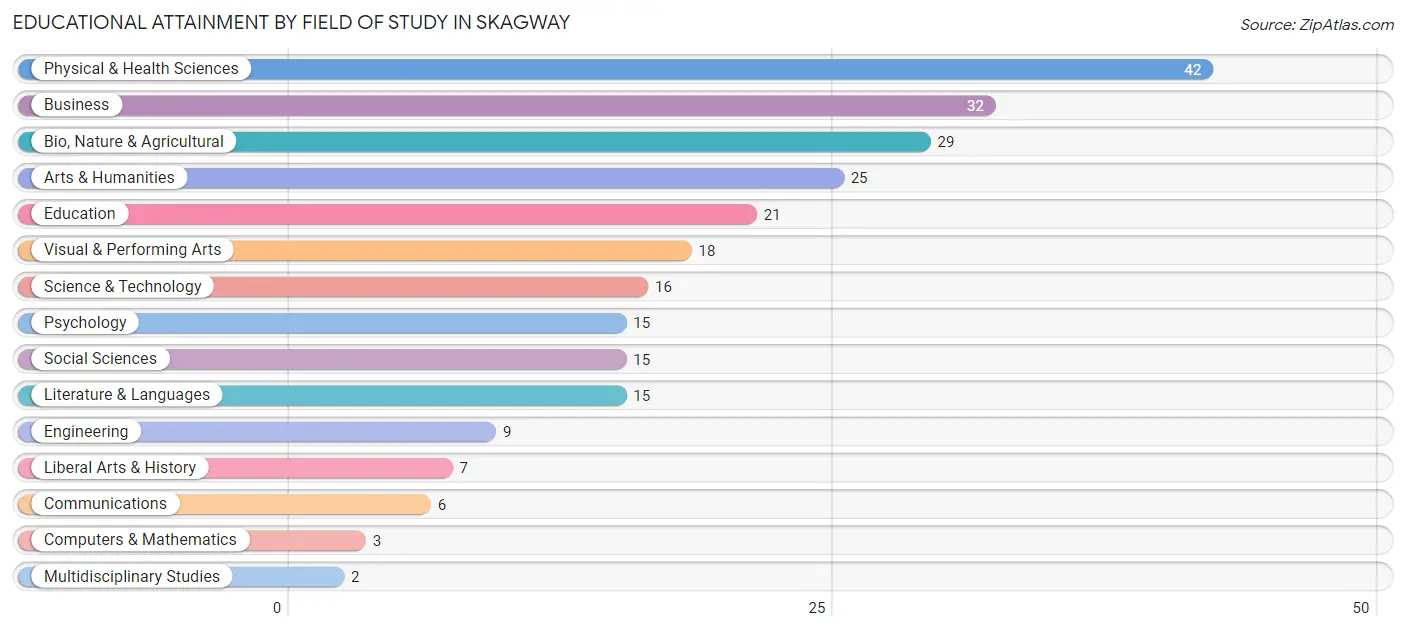
| Field of Study | # Graduates | % Graduates |
| Computers & Mathematics | 3 | 1.2% |
| Bio, Nature & Agricultural | 29 | 11.4% |
| Physical & Health Sciences | 42 | 16.5% |
| Psychology | 15 | 5.9% |
| Social Sciences | 15 | 5.9% |
| Engineering | 9 | 3.5% |
| Multidisciplinary Studies | 2 | 0.8% |
| Science & Technology | 16 | 6.3% |
| Business | 32 | 12.6% |
| Education | 21 | 8.2% |
| Literature & Languages | 15 | 5.9% |
| Liberal Arts & History | 7 | 2.8% |
| Visual & Performing Arts | 18 | 7.1% |
| Communications | 6 | 2.4% |
| Arts & Humanities | 25 | 9.8% |
| Total | 255 | 100.0% |
Transportation & Commute in Skagway
Vehicle Availability by Sex in Skagway
The most prevalent vehicle ownership categories in Skagway are males with 1 vehicle (69, accounting for 27.9%) and females with 1 vehicle (97, making up 24.2%).
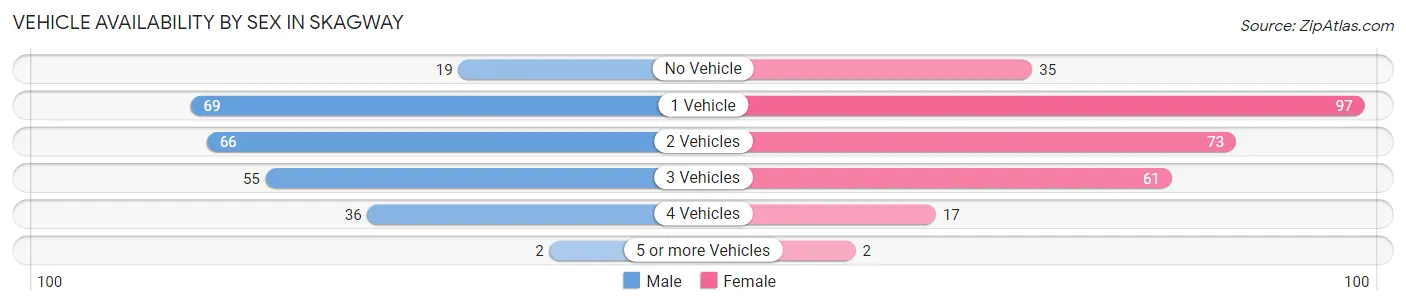
| Vehicles Available | Male | Female |
| No Vehicle | 19 (7.7%) | 35 (12.3%) |
| 1 Vehicle | 69 (27.9%) | 97 (34.0%) |
| 2 Vehicles | 66 (26.7%) | 73 (25.6%) |
| 3 Vehicles | 55 (22.3%) | 61 (21.4%) |
| 4 Vehicles | 36 (14.6%) | 17 (6.0%) |
| 5 or more Vehicles | 2 (0.8%) | 2 (0.7%) |
| Total | 247 (100.0%) | 285 (100.0%) |
Commute Time in Skagway
The most frequently occuring commute durations in Skagway are less than 5 minutes (296 commuters, 42.9%), 5 to 9 minutes (269 commuters, 39.0%), and 10 to 14 minutes (104 commuters, 15.1%).
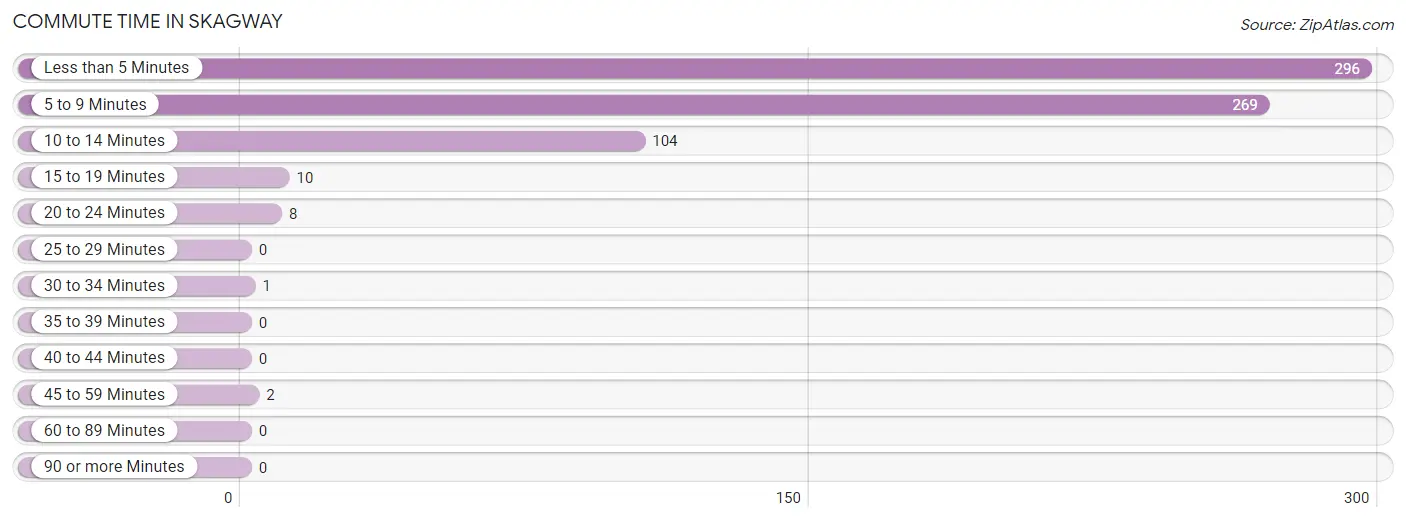
| Commute Time | # Commuters | % Commuters |
| Less than 5 Minutes | 296 | 42.9% |
| 5 to 9 Minutes | 269 | 39.0% |
| 10 to 14 Minutes | 104 | 15.1% |
| 15 to 19 Minutes | 10 | 1.5% |
| 20 to 24 Minutes | 8 | 1.2% |
| 25 to 29 Minutes | 0 | 0.0% |
| 30 to 34 Minutes | 1 | 0.1% |
| 35 to 39 Minutes | 0 | 0.0% |
| 40 to 44 Minutes | 0 | 0.0% |
| 45 to 59 Minutes | 2 | 0.3% |
| 60 to 89 Minutes | 0 | 0.0% |
| 90 or more Minutes | 0 | 0.0% |
Commute Time by Sex in Skagway
The most common commute times in Skagway are 5 to 9 minutes (138 commuters, 44.8%) for males and less than 5 minutes (164 commuters, 42.9%) for females.
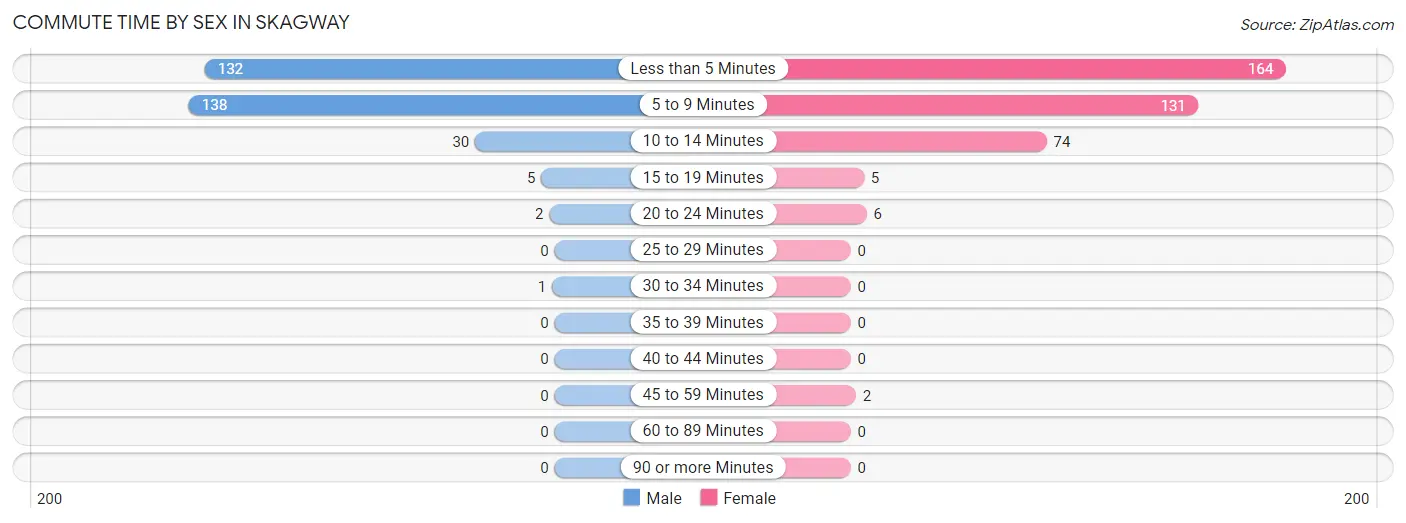
| Commute Time | Male | Female |
| Less than 5 Minutes | 132 (42.9%) | 164 (42.9%) |
| 5 to 9 Minutes | 138 (44.8%) | 131 (34.3%) |
| 10 to 14 Minutes | 30 (9.7%) | 74 (19.4%) |
| 15 to 19 Minutes | 5 (1.6%) | 5 (1.3%) |
| 20 to 24 Minutes | 2 (0.6%) | 6 (1.6%) |
| 25 to 29 Minutes | 0 (0.0%) | 0 (0.0%) |
| 30 to 34 Minutes | 1 (0.3%) | 0 (0.0%) |
| 35 to 39 Minutes | 0 (0.0%) | 0 (0.0%) |
| 40 to 44 Minutes | 0 (0.0%) | 0 (0.0%) |
| 45 to 59 Minutes | 0 (0.0%) | 2 (0.5%) |
| 60 to 89 Minutes | 0 (0.0%) | 0 (0.0%) |
| 90 or more Minutes | 0 (0.0%) | 0 (0.0%) |
Time of Departure to Work by Sex in Skagway
The most frequent times of departure to work in Skagway are 6:30 AM to 6:59 AM (98, 31.8%) for males and 7:30 AM to 7:59 AM (71, 18.6%) for females.
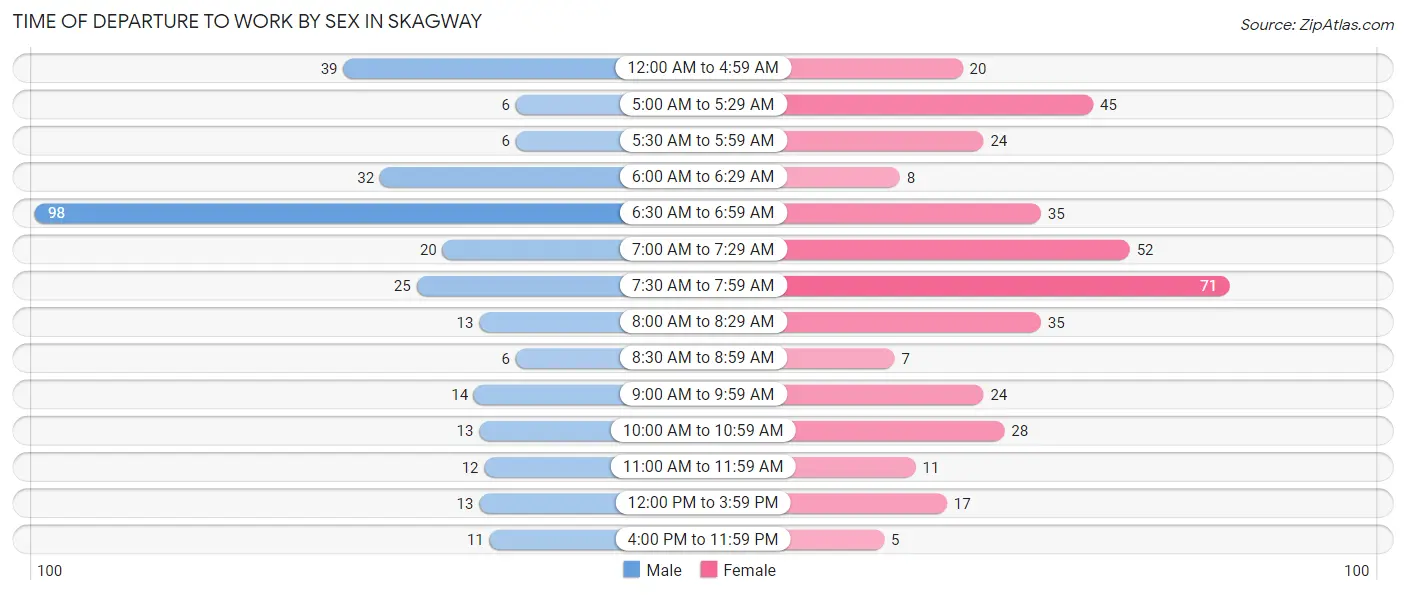
| Time of Departure | Male | Female |
| 12:00 AM to 4:59 AM | 39 (12.7%) | 20 (5.2%) |
| 5:00 AM to 5:29 AM | 6 (1.9%) | 45 (11.8%) |
| 5:30 AM to 5:59 AM | 6 (1.9%) | 24 (6.3%) |
| 6:00 AM to 6:29 AM | 32 (10.4%) | 8 (2.1%) |
| 6:30 AM to 6:59 AM | 98 (31.8%) | 35 (9.2%) |
| 7:00 AM to 7:29 AM | 20 (6.5%) | 52 (13.6%) |
| 7:30 AM to 7:59 AM | 25 (8.1%) | 71 (18.6%) |
| 8:00 AM to 8:29 AM | 13 (4.2%) | 35 (9.2%) |
| 8:30 AM to 8:59 AM | 6 (1.9%) | 7 (1.8%) |
| 9:00 AM to 9:59 AM | 14 (4.5%) | 24 (6.3%) |
| 10:00 AM to 10:59 AM | 13 (4.2%) | 28 (7.3%) |
| 11:00 AM to 11:59 AM | 12 (3.9%) | 11 (2.9%) |
| 12:00 PM to 3:59 PM | 13 (4.2%) | 17 (4.4%) |
| 4:00 PM to 11:59 PM | 11 (3.6%) | 5 (1.3%) |
| Total | 308 (100.0%) | 382 (100.0%) |
Housing Occupancy in Skagway
Occupancy by Ownership in Skagway
Of the total 346 dwellings in Skagway, owner-occupied units account for 211 (61.0%), while renter-occupied units make up 135 (39.0%).
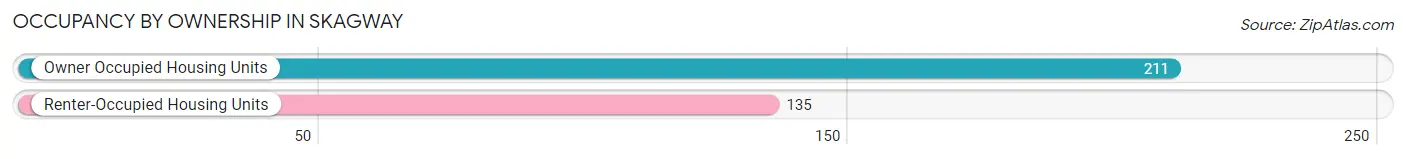
| Occupancy | # Housing Units | % Housing Units |
| Owner Occupied Housing Units | 211 | 61.0% |
| Renter-Occupied Housing Units | 135 | 39.0% |
| Total Occupied Housing Units | 346 | 100.0% |
Occupancy by Household Size in Skagway
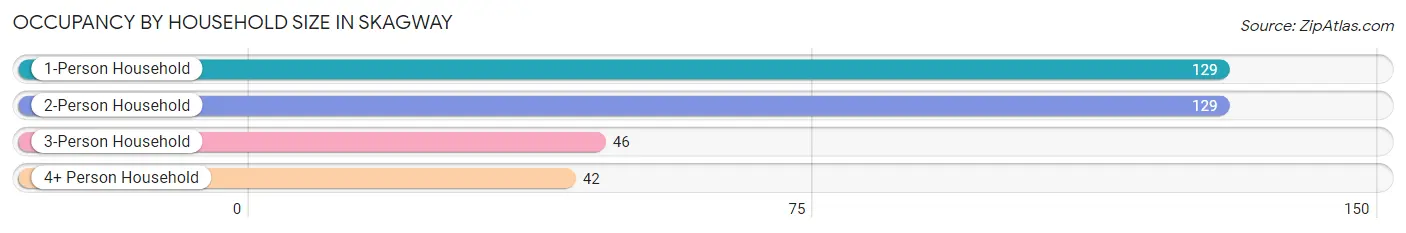
| Household Size | # Housing Units | % Housing Units |
| 1-Person Household | 129 | 37.3% |
| 2-Person Household | 129 | 37.3% |
| 3-Person Household | 46 | 13.3% |
| 4+ Person Household | 42 | 12.1% |
| Total Housing Units | 346 | 100.0% |
Occupancy by Ownership by Household Size in Skagway
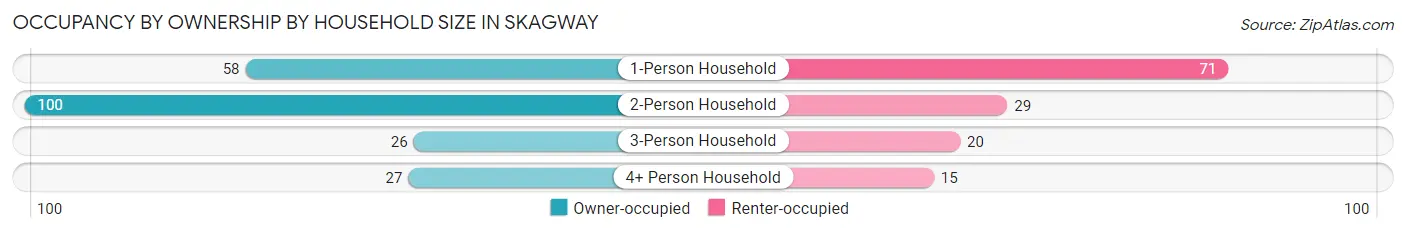
| Household Size | Owner-occupied | Renter-occupied |
| 1-Person Household | 58 (45.0%) | 71 (55.0%) |
| 2-Person Household | 100 (77.5%) | 29 (22.5%) |
| 3-Person Household | 26 (56.5%) | 20 (43.5%) |
| 4+ Person Household | 27 (64.3%) | 15 (35.7%) |
| Total Housing Units | 211 (61.0%) | 135 (39.0%) |
Occupancy by Educational Attainment in Skagway
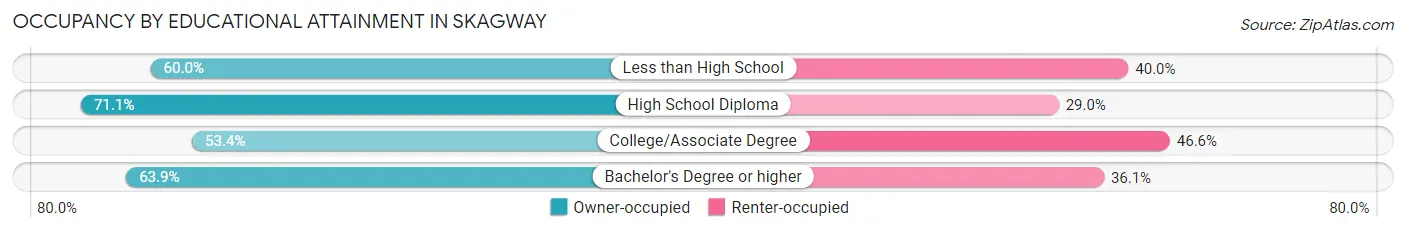
| Household Size | Owner-occupied | Renter-occupied |
| Less than High School | 3 (60.0%) | 2 (40.0%) |
| High School Diploma | 54 (71.1%) | 22 (28.9%) |
| College/Associate Degree | 78 (53.4%) | 68 (46.6%) |
| Bachelor's Degree or higher | 76 (63.9%) | 43 (36.1%) |
Occupancy by Age of Householder in Skagway
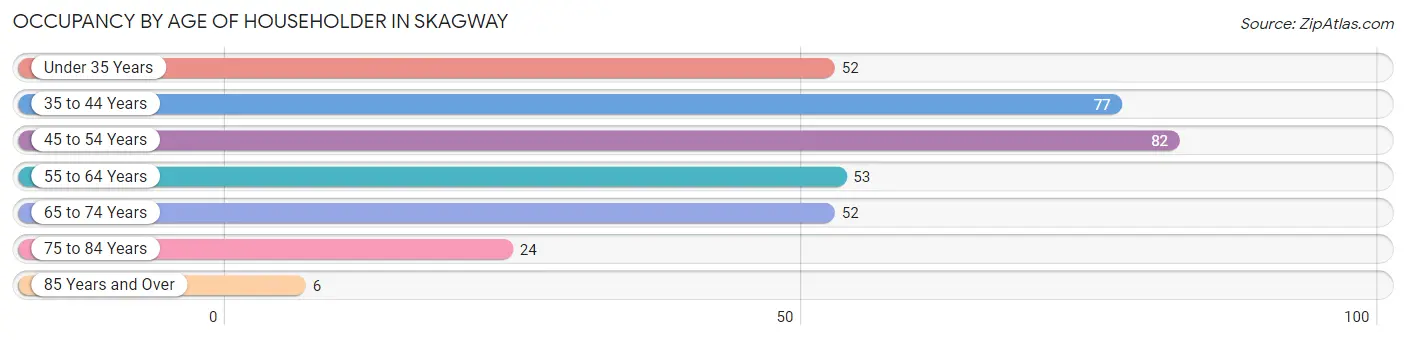
| Age Bracket | # Households | % Households |
| Under 35 Years | 52 | 15.0% |
| 35 to 44 Years | 77 | 22.3% |
| 45 to 54 Years | 82 | 23.7% |
| 55 to 64 Years | 53 | 15.3% |
| 65 to 74 Years | 52 | 15.0% |
| 75 to 84 Years | 24 | 6.9% |
| 85 Years and Over | 6 | 1.7% |
| Total | 346 | 100.0% |
Housing Finances in Skagway
Median Income by Occupancy in Skagway
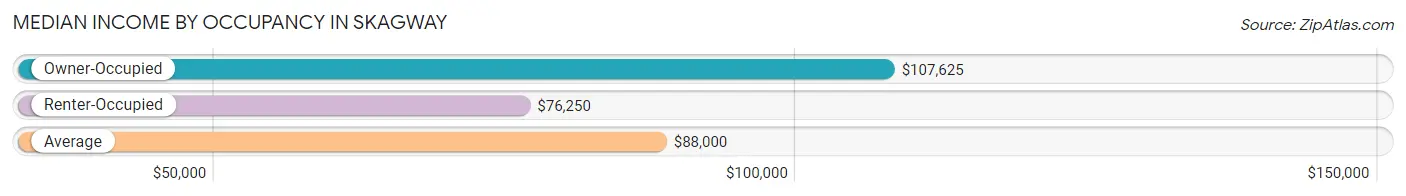
| Occupancy Type | # Households | Median Income |
| Owner-Occupied | 211 (61.0%) | $107,625 |
| Renter-Occupied | 135 (39.0%) | $76,250 |
| Average | 346 (100.0%) | $88,000 |
Occupancy by Householder Income Bracket in Skagway
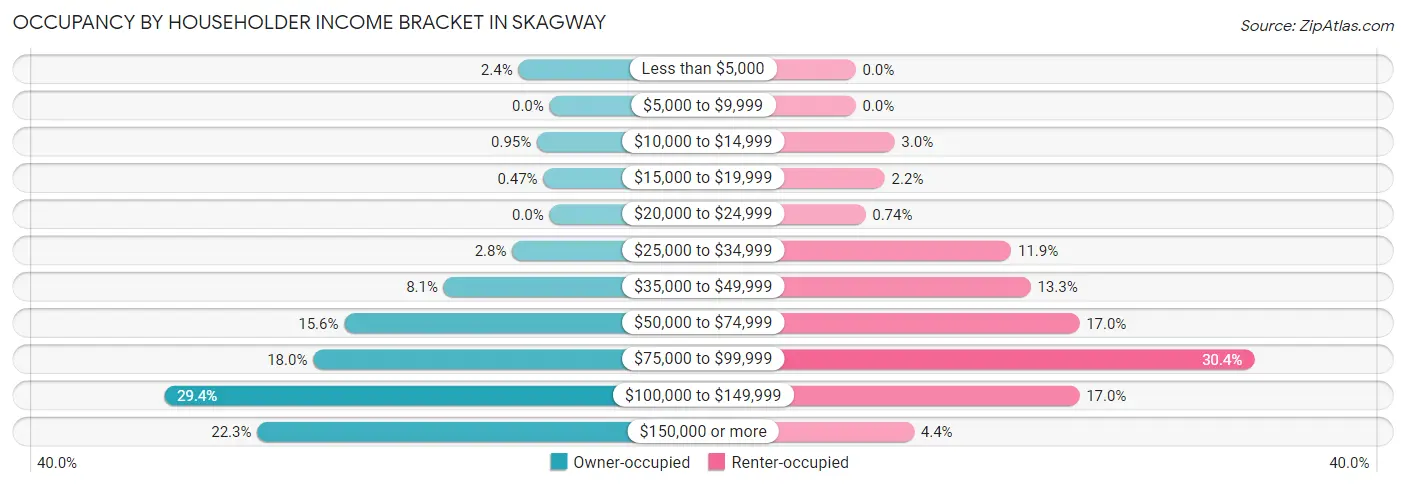
| Income Bracket | Owner-occupied | Renter-occupied |
| Less than $5,000 | 5 (2.4%) | 0 (0.0%) |
| $5,000 to $9,999 | 0 (0.0%) | 0 (0.0%) |
| $10,000 to $14,999 | 2 (0.9%) | 4 (3.0%) |
| $15,000 to $19,999 | 1 (0.5%) | 3 (2.2%) |
| $20,000 to $24,999 | 0 (0.0%) | 1 (0.7%) |
| $25,000 to $34,999 | 6 (2.8%) | 16 (11.8%) |
| $35,000 to $49,999 | 17 (8.1%) | 18 (13.3%) |
| $50,000 to $74,999 | 33 (15.6%) | 23 (17.0%) |
| $75,000 to $99,999 | 38 (18.0%) | 41 (30.4%) |
| $100,000 to $149,999 | 62 (29.4%) | 23 (17.0%) |
| $150,000 or more | 47 (22.3%) | 6 (4.4%) |
| Total | 211 (100.0%) | 135 (100.0%) |
Monthly Housing Cost Tiers in Skagway
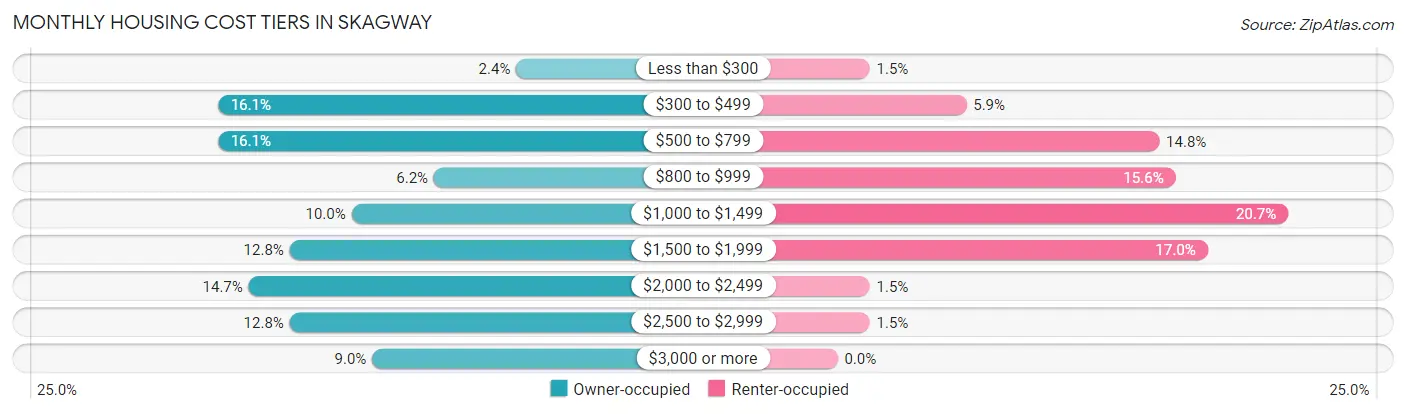
| Monthly Cost | Owner-occupied | Renter-occupied |
| Less than $300 | 5 (2.4%) | 2 (1.5%) |
| $300 to $499 | 34 (16.1%) | 8 (5.9%) |
| $500 to $799 | 34 (16.1%) | 20 (14.8%) |
| $800 to $999 | 13 (6.2%) | 21 (15.6%) |
| $1,000 to $1,499 | 21 (10.0%) | 28 (20.7%) |
| $1,500 to $1,999 | 27 (12.8%) | 23 (17.0%) |
| $2,000 to $2,499 | 31 (14.7%) | 2 (1.5%) |
| $2,500 to $2,999 | 27 (12.8%) | 2 (1.5%) |
| $3,000 or more | 19 (9.0%) | 0 (0.0%) |
| Total | 211 (100.0%) | 135 (100.0%) |
Physical Housing Characteristics in Skagway
Housing Structures in Skagway
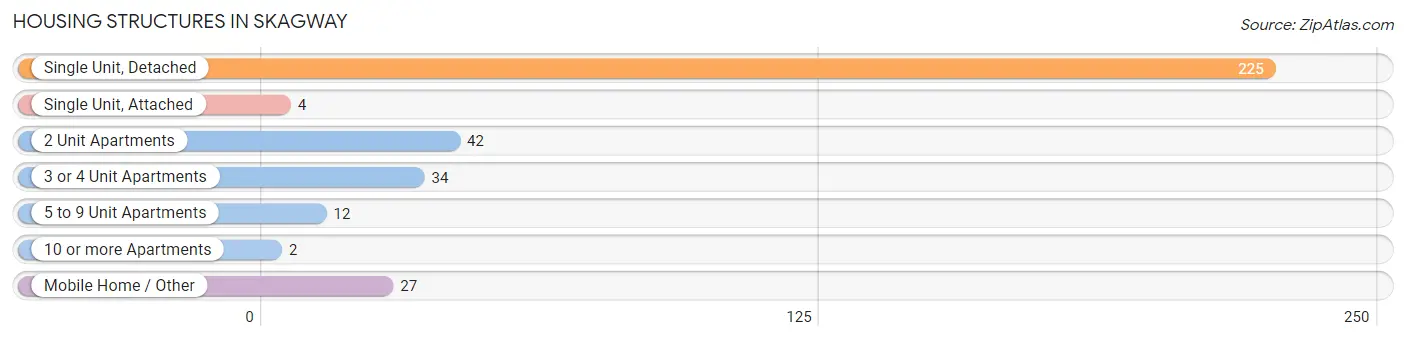
| Structure Type | # Housing Units | % Housing Units |
| Single Unit, Detached | 225 | 65.0% |
| Single Unit, Attached | 4 | 1.2% |
| 2 Unit Apartments | 42 | 12.1% |
| 3 or 4 Unit Apartments | 34 | 9.8% |
| 5 to 9 Unit Apartments | 12 | 3.5% |
| 10 or more Apartments | 2 | 0.6% |
| Mobile Home / Other | 27 | 7.8% |
| Total | 346 | 100.0% |
Housing Structures by Occupancy in Skagway
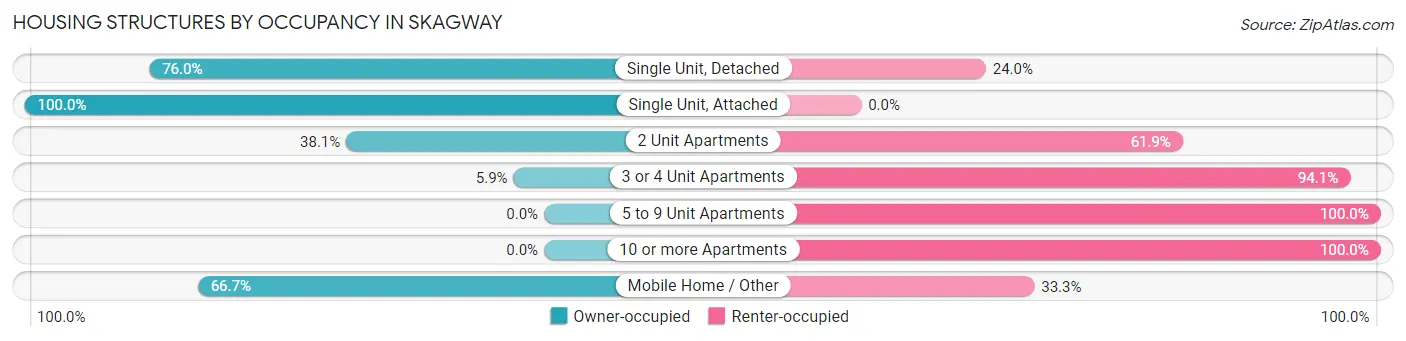
| Structure Type | Owner-occupied | Renter-occupied |
| Single Unit, Detached | 171 (76.0%) | 54 (24.0%) |
| Single Unit, Attached | 4 (100.0%) | 0 (0.0%) |
| 2 Unit Apartments | 16 (38.1%) | 26 (61.9%) |
| 3 or 4 Unit Apartments | 2 (5.9%) | 32 (94.1%) |
| 5 to 9 Unit Apartments | 0 (0.0%) | 12 (100.0%) |
| 10 or more Apartments | 0 (0.0%) | 2 (100.0%) |
| Mobile Home / Other | 18 (66.7%) | 9 (33.3%) |
| Total | 211 (61.0%) | 135 (39.0%) |
Housing Structures by Number of Rooms in Skagway
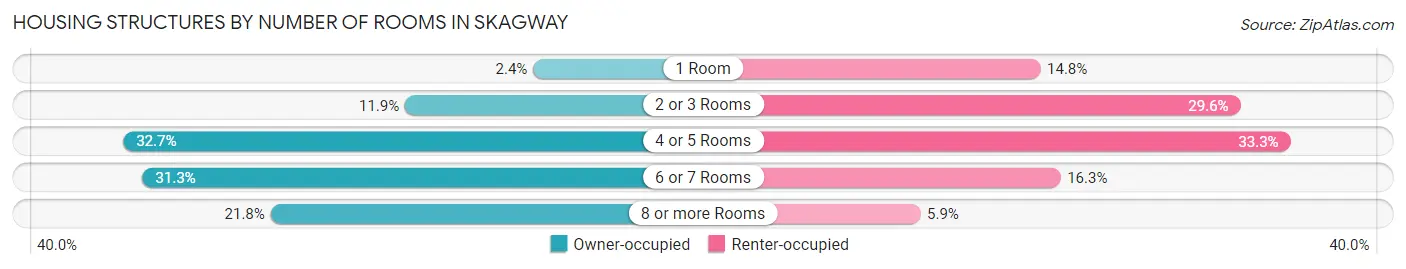
| Number of Rooms | Owner-occupied | Renter-occupied |
| 1 Room | 5 (2.4%) | 20 (14.8%) |
| 2 or 3 Rooms | 25 (11.8%) | 40 (29.6%) |
| 4 or 5 Rooms | 69 (32.7%) | 45 (33.3%) |
| 6 or 7 Rooms | 66 (31.3%) | 22 (16.3%) |
| 8 or more Rooms | 46 (21.8%) | 8 (5.9%) |
| Total | 211 (100.0%) | 135 (100.0%) |
Housing Structure by Heating Type in Skagway
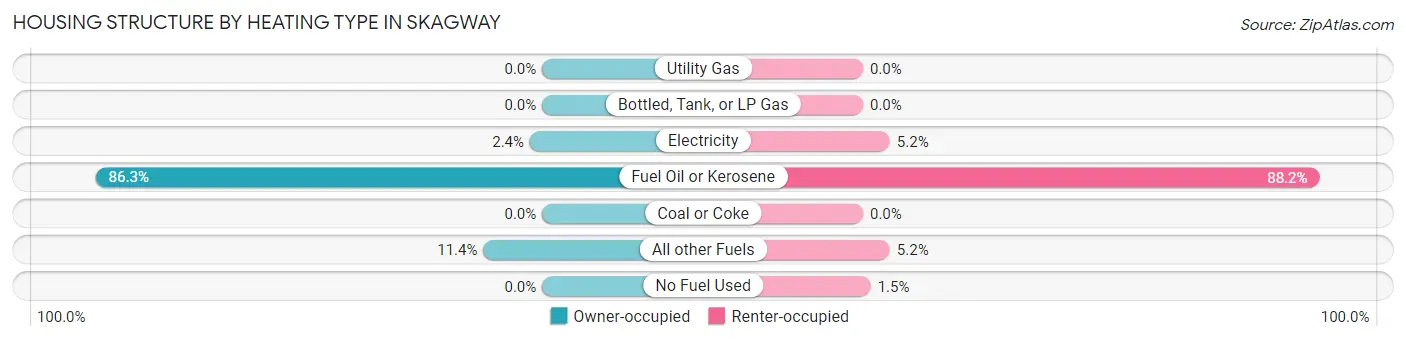
| Heating Type | Owner-occupied | Renter-occupied |
| Utility Gas | 0 (0.0%) | 0 (0.0%) |
| Bottled, Tank, or LP Gas | 0 (0.0%) | 0 (0.0%) |
| Electricity | 5 (2.4%) | 7 (5.2%) |
| Fuel Oil or Kerosene | 182 (86.3%) | 119 (88.1%) |
| Coal or Coke | 0 (0.0%) | 0 (0.0%) |
| All other Fuels | 24 (11.4%) | 7 (5.2%) |
| No Fuel Used | 0 (0.0%) | 2 (1.5%) |
| Total | 211 (100.0%) | 135 (100.0%) |
Household Vehicle Usage in Skagway
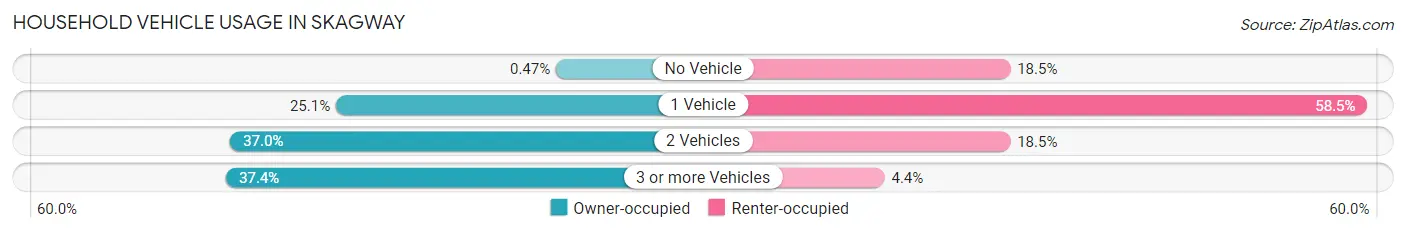
| Vehicles per Household | Owner-occupied | Renter-occupied |
| No Vehicle | 1 (0.5%) | 25 (18.5%) |
| 1 Vehicle | 53 (25.1%) | 79 (58.5%) |
| 2 Vehicles | 78 (37.0%) | 25 (18.5%) |
| 3 or more Vehicles | 79 (37.4%) | 6 (4.4%) |
| Total | 211 (100.0%) | 135 (100.0%) |
Real Estate & Mortgages in Skagway
Real Estate and Mortgage Overview in Skagway
| Characteristic | Without Mortgage | With Mortgage |
| Housing Units | 93 | 118 |
| Median Property Value | $406,000 | $431,900 |
| Median Household Income | $79,531 | $31 |
| Monthly Housing Costs | $544 | $19 |
| Real Estate Taxes | $1,554 | $0 |
Property Value by Mortgage Status in Skagway
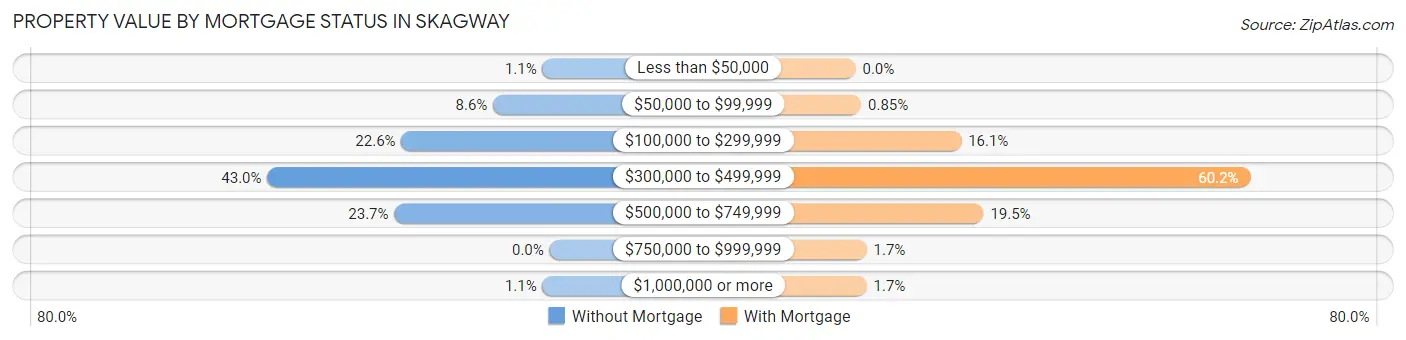
| Property Value | Without Mortgage | With Mortgage |
| Less than $50,000 | 1 (1.1%) | 0 (0.0%) |
| $50,000 to $99,999 | 8 (8.6%) | 1 (0.9%) |
| $100,000 to $299,999 | 21 (22.6%) | 19 (16.1%) |
| $300,000 to $499,999 | 40 (43.0%) | 71 (60.2%) |
| $500,000 to $749,999 | 22 (23.7%) | 23 (19.5%) |
| $750,000 to $999,999 | 0 (0.0%) | 2 (1.7%) |
| $1,000,000 or more | 1 (1.1%) | 2 (1.7%) |
| Total | 93 (100.0%) | 118 (100.0%) |
Household Income by Mortgage Status in Skagway
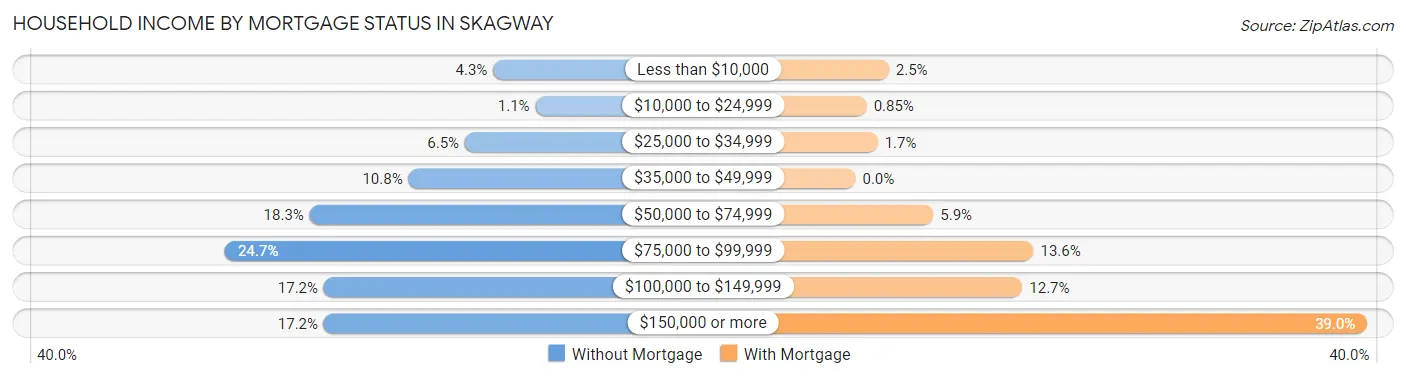
| Household Income | Without Mortgage | With Mortgage |
| Less than $10,000 | 4 (4.3%) | 3 (2.5%) |
| $10,000 to $24,999 | 1 (1.1%) | 1 (0.9%) |
| $25,000 to $34,999 | 6 (6.5%) | 2 (1.7%) |
| $35,000 to $49,999 | 10 (10.7%) | 0 (0.0%) |
| $50,000 to $74,999 | 17 (18.3%) | 7 (5.9%) |
| $75,000 to $99,999 | 23 (24.7%) | 16 (13.6%) |
| $100,000 to $149,999 | 16 (17.2%) | 15 (12.7%) |
| $150,000 or more | 16 (17.2%) | 46 (39.0%) |
| Total | 93 (100.0%) | 118 (100.0%) |
Property Value to Household Income Ratio in Skagway
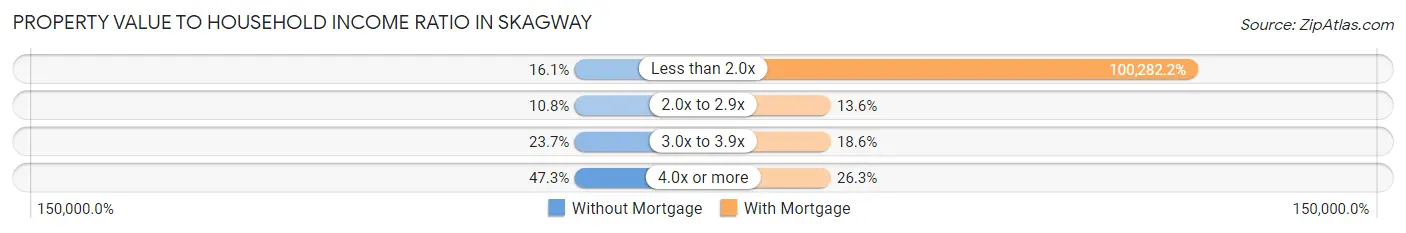
| Value-to-Income Ratio | Without Mortgage | With Mortgage |
| Less than 2.0x | 15 (16.1%) | 118,333 (100,282.2%) |
| 2.0x to 2.9x | 10 (10.7%) | 16 (13.6%) |
| 3.0x to 3.9x | 22 (23.7%) | 22 (18.6%) |
| 4.0x or more | 44 (47.3%) | 31 (26.3%) |
| Total | 93 (100.0%) | 118 (100.0%) |
Real Estate Taxes by Mortgage Status in Skagway
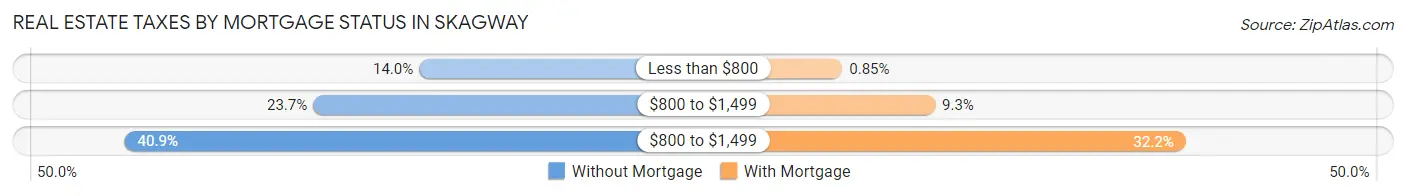
| Property Taxes | Without Mortgage | With Mortgage |
| Less than $800 | 13 (14.0%) | 1 (0.9%) |
| $800 to $1,499 | 22 (23.7%) | 11 (9.3%) |
| $800 to $1,499 | 38 (40.9%) | 38 (32.2%) |
| Total | 93 (100.0%) | 118 (100.0%) |
Health & Disability in Skagway
Health Insurance Coverage by Age in Skagway
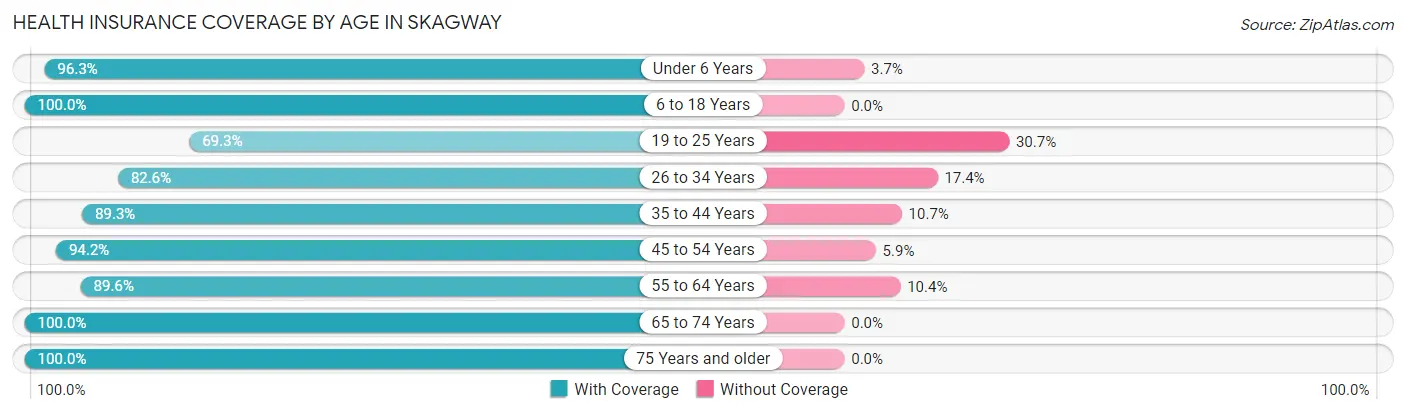
| Age Bracket | With Coverage | Without Coverage |
| Under 6 Years | 78 (96.3%) | 3 (3.7%) |
| 6 to 18 Years | 124 (100.0%) | 0 (0.0%) |
| 19 to 25 Years | 88 (69.3%) | 39 (30.7%) |
| 26 to 34 Years | 195 (82.6%) | 41 (17.4%) |
| 35 to 44 Years | 167 (89.3%) | 20 (10.7%) |
| 45 to 54 Years | 177 (94.2%) | 11 (5.9%) |
| 55 to 64 Years | 103 (89.6%) | 12 (10.4%) |
| 65 to 74 Years | 80 (100.0%) | 0 (0.0%) |
| 75 Years and older | 41 (100.0%) | 0 (0.0%) |
| Total | 1,053 (89.3%) | 126 (10.7%) |
Health Insurance Coverage by Citizenship Status in Skagway
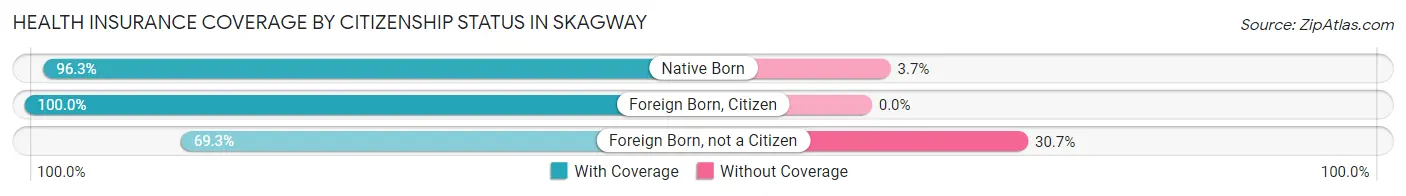
| Citizenship Status | With Coverage | Without Coverage |
| Native Born | 78 (96.3%) | 3 (3.7%) |
| Foreign Born, Citizen | 124 (100.0%) | 0 (0.0%) |
| Foreign Born, not a Citizen | 88 (69.3%) | 39 (30.7%) |
Health Insurance Coverage by Household Income in Skagway
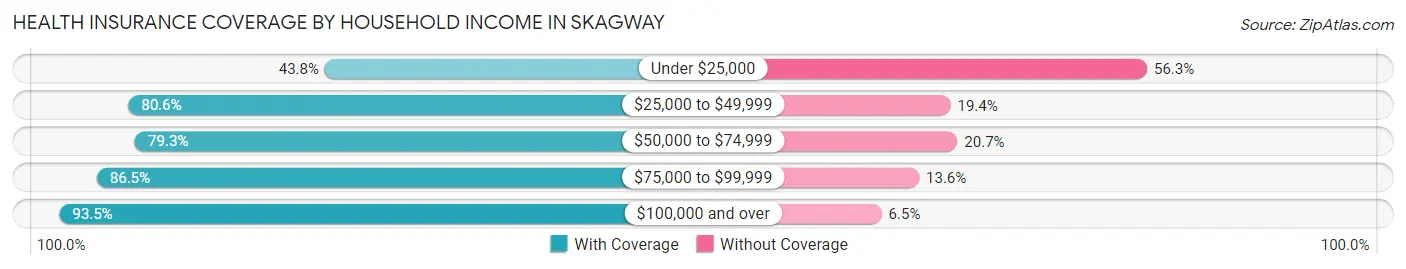
| Household Income | With Coverage | Without Coverage |
| Under $25,000 | 7 (43.8%) | 9 (56.2%) |
| $25,000 to $49,999 | 58 (80.6%) | 14 (19.4%) |
| $50,000 to $74,999 | 88 (79.3%) | 23 (20.7%) |
| $75,000 to $99,999 | 185 (86.5%) | 29 (13.6%) |
| $100,000 and over | 501 (93.5%) | 35 (6.5%) |
Public vs Private Health Insurance Coverage by Age in Skagway
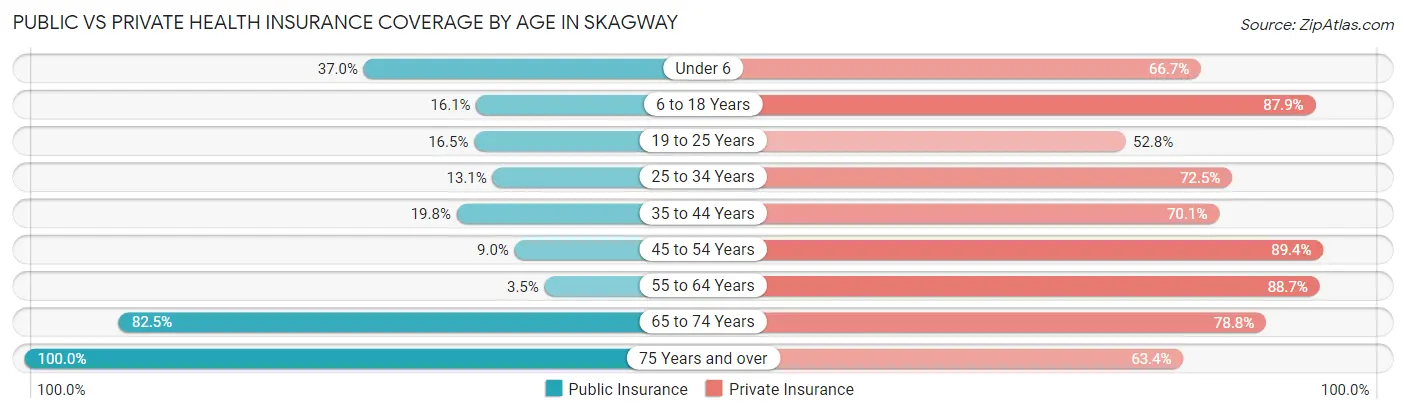
| Age Bracket | Public Insurance | Private Insurance |
| Under 6 | 30 (37.0%) | 54 (66.7%) |
| 6 to 18 Years | 20 (16.1%) | 109 (87.9%) |
| 19 to 25 Years | 21 (16.5%) | 67 (52.8%) |
| 25 to 34 Years | 31 (13.1%) | 171 (72.5%) |
| 35 to 44 Years | 37 (19.8%) | 131 (70.1%) |
| 45 to 54 Years | 17 (9.0%) | 168 (89.4%) |
| 55 to 64 Years | 4 (3.5%) | 102 (88.7%) |
| 65 to 74 Years | 66 (82.5%) | 63 (78.7%) |
| 75 Years and over | 41 (100.0%) | 26 (63.4%) |
| Total | 267 (22.7%) | 891 (75.6%) |
Disability Status by Sex by Age in Skagway
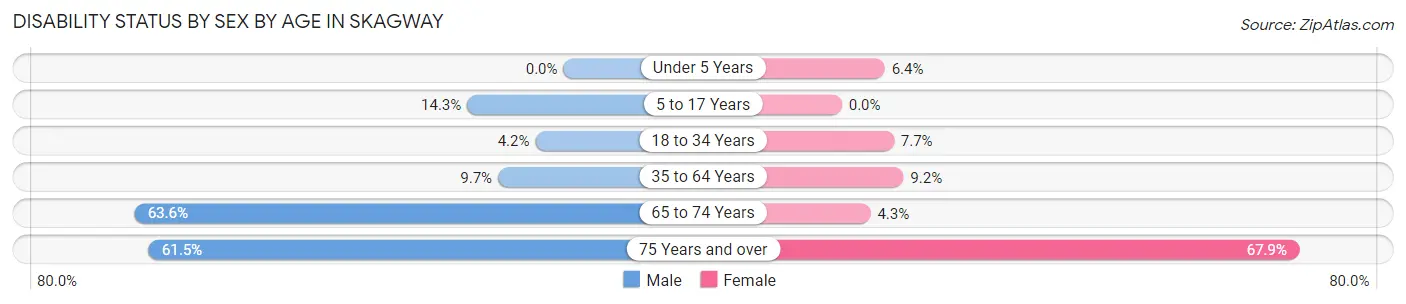
| Age Bracket | Male | Female |
| Under 5 Years | 0 (0.0%) | 3 (6.4%) |
| 5 to 17 Years | 7 (14.3%) | 0 (0.0%) |
| 18 to 34 Years | 6 (4.2%) | 18 (7.7%) |
| 35 to 64 Years | 20 (9.7%) | 26 (9.1%) |
| 65 to 74 Years | 21 (63.6%) | 2 (4.3%) |
| 75 Years and over | 8 (61.5%) | 19 (67.9%) |
Disability Class by Sex by Age in Skagway
Disability Class: Hearing Difficulty
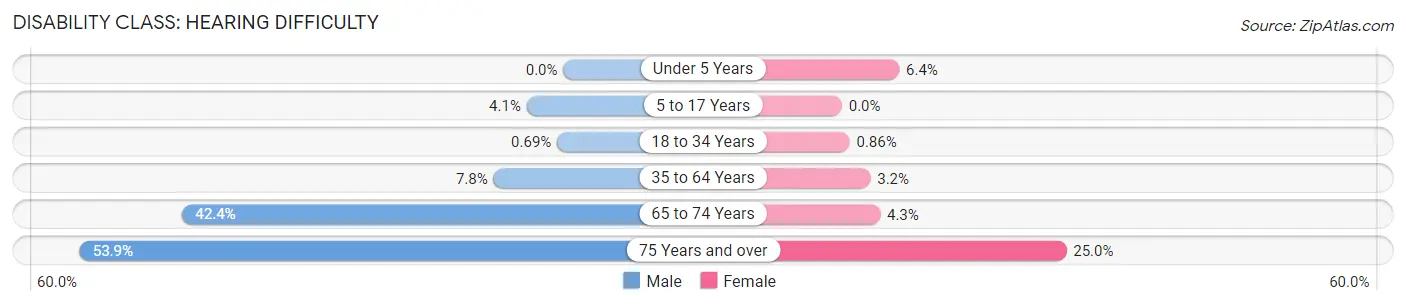
| Age Bracket | Male | Female |
| Under 5 Years | 0 (0.0%) | 3 (6.4%) |
| 5 to 17 Years | 2 (4.1%) | 0 (0.0%) |
| 18 to 34 Years | 1 (0.7%) | 2 (0.9%) |
| 35 to 64 Years | 16 (7.8%) | 9 (3.2%) |
| 65 to 74 Years | 14 (42.4%) | 2 (4.3%) |
| 75 Years and over | 7 (53.8%) | 7 (25.0%) |
Disability Class: Vision Difficulty
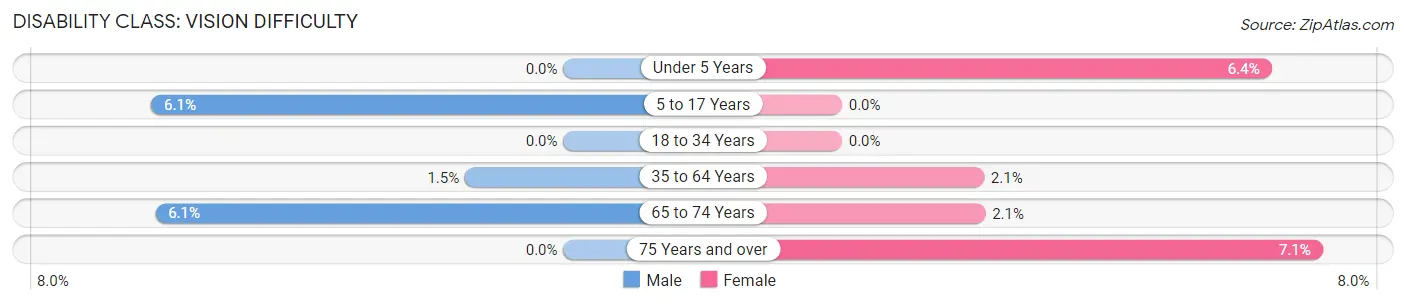
| Age Bracket | Male | Female |
| Under 5 Years | 0 (0.0%) | 3 (6.4%) |
| 5 to 17 Years | 3 (6.1%) | 0 (0.0%) |
| 18 to 34 Years | 0 (0.0%) | 0 (0.0%) |
| 35 to 64 Years | 3 (1.5%) | 6 (2.1%) |
| 65 to 74 Years | 2 (6.1%) | 1 (2.1%) |
| 75 Years and over | 0 (0.0%) | 2 (7.1%) |
Disability Class: Cognitive Difficulty
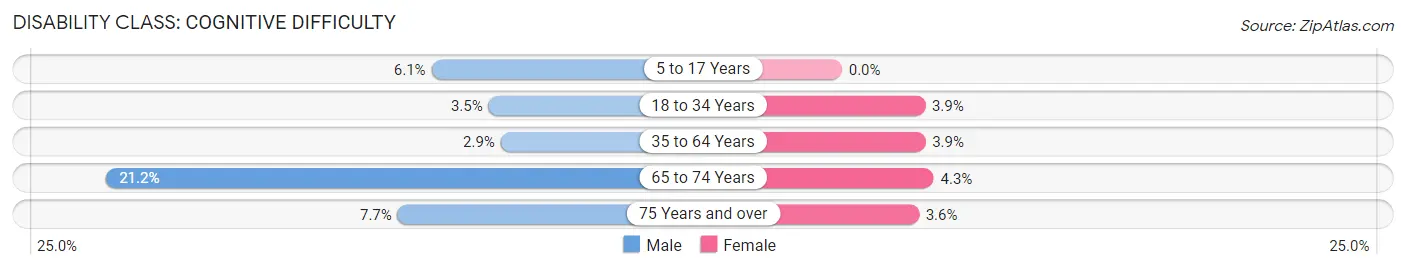
| Age Bracket | Male | Female |
| 5 to 17 Years | 3 (6.1%) | 0 (0.0%) |
| 18 to 34 Years | 5 (3.5%) | 9 (3.9%) |
| 35 to 64 Years | 6 (2.9%) | 11 (3.9%) |
| 65 to 74 Years | 7 (21.2%) | 2 (4.3%) |
| 75 Years and over | 1 (7.7%) | 1 (3.6%) |
Disability Class: Ambulatory Difficulty
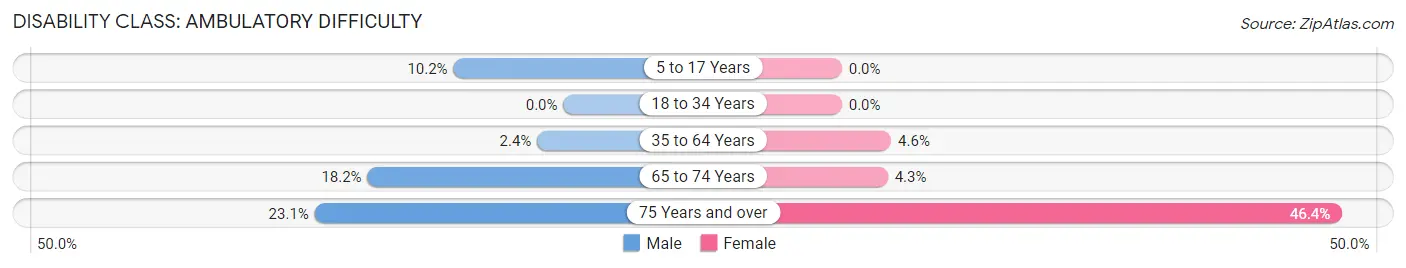
| Age Bracket | Male | Female |
| 5 to 17 Years | 5 (10.2%) | 0 (0.0%) |
| 18 to 34 Years | 0 (0.0%) | 0 (0.0%) |
| 35 to 64 Years | 5 (2.4%) | 13 (4.6%) |
| 65 to 74 Years | 6 (18.2%) | 2 (4.3%) |
| 75 Years and over | 3 (23.1%) | 13 (46.4%) |
Disability Class: Self-Care Difficulty
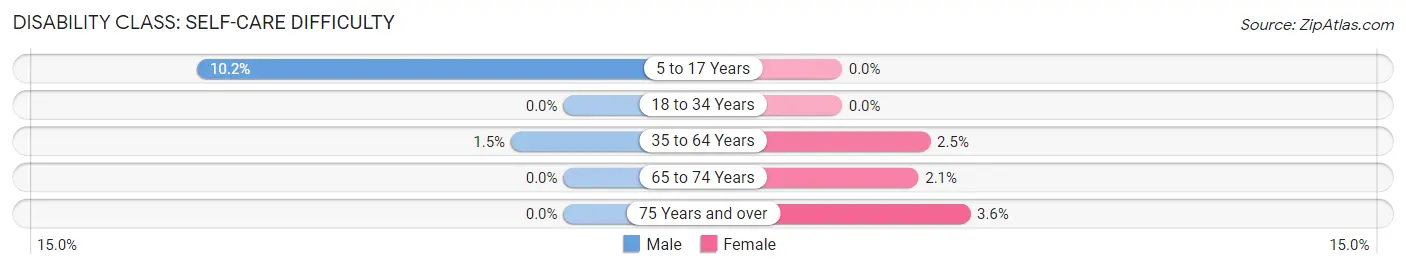
| Age Bracket | Male | Female |
| 5 to 17 Years | 5 (10.2%) | 0 (0.0%) |
| 18 to 34 Years | 0 (0.0%) | 0 (0.0%) |
| 35 to 64 Years | 3 (1.5%) | 7 (2.5%) |
| 65 to 74 Years | 0 (0.0%) | 1 (2.1%) |
| 75 Years and over | 0 (0.0%) | 1 (3.6%) |
Technology Access in Skagway
Computing Device Access in Skagway
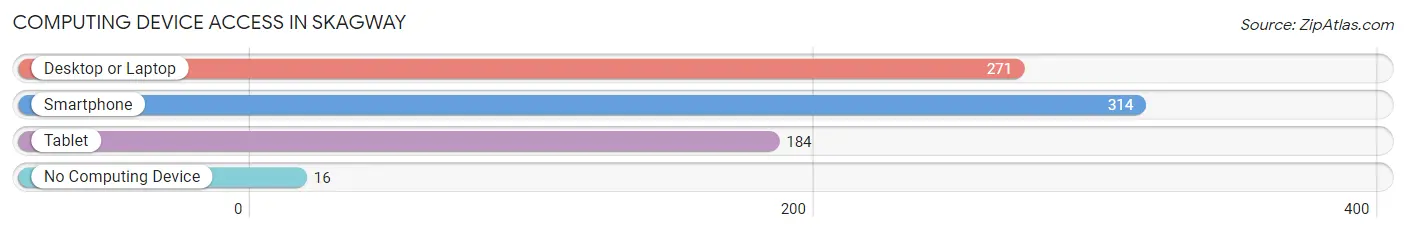
| Device Type | # Households | % Households |
| Desktop or Laptop | 271 | 78.3% |
| Smartphone | 314 | 90.7% |
| Tablet | 184 | 53.2% |
| No Computing Device | 16 | 4.6% |
| Total | 346 | 100.0% |
Internet Access in Skagway
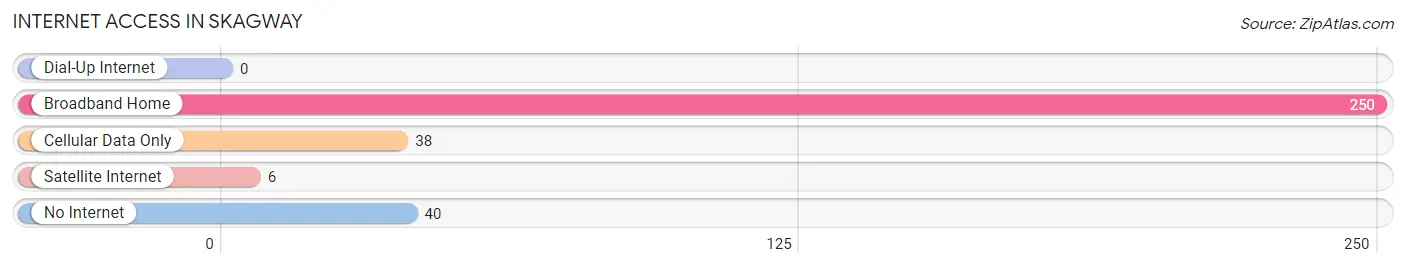
| Internet Type | # Households | % Households |
| Dial-Up Internet | 0 | 0.0% |
| Broadband Home | 250 | 72.3% |
| Cellular Data Only | 38 | 11.0% |
| Satellite Internet | 6 | 1.7% |
| No Internet | 40 | 11.6% |
| Total | 346 | 100.0% |
Skagway Summary
Skagway, Alaska is a small town located in the southeastern corner of the state, near the border of Canada. It is the northernmost port of the Inside Passage, a popular tourist destination for cruise ships and other vessels. The town has a population of about 1,000 people and is the gateway to the Klondike Gold Rush National Historical Park.
History
Skagway was founded in 1897 during the Klondike Gold Rush. It was originally a trading post for prospectors heading to the gold fields of the Yukon. The town quickly grew to become the largest port in Alaska, with a population of over 20,000 people. It was a major hub for the gold rush, with many businesses and services catering to the miners.
The town was also a major center for organized crime, with the infamous Soapy Smith and his gang controlling much of the town. The town was eventually taken over by the US Army in 1898, and the crime rate dropped significantly.
In the early 1900s, the town began to decline as the gold rush ended and the population decreased. The town was eventually incorporated in 1907 and has remained a small town ever since.
Geography
Skagway is located in the southeastern corner of Alaska, near the border of Canada. It is situated on the Taiya Inlet, a deep fjord that is part of the Inside Passage. The town is surrounded by mountains and is located at the northern end of the Lynn Canal, the longest fjord in North America.
The climate in Skagway is mild and wet, with temperatures rarely dropping below freezing. The town receives an average of over 100 inches of precipitation each year, making it one of the wettest places in Alaska.
Economy
Skagway’s economy is largely based on tourism. The town is a popular destination for cruise ships and other vessels, and is the gateway to the Klondike Gold Rush National Historical Park. The town also has a number of shops and restaurants catering to tourists.
The town also has a small fishing industry, with several commercial fishing boats operating out of the harbor. The town also has a small timber industry, with several sawmills located in the area.
Demographics
As of the 2010 census, Skagway had a population of 968 people. The racial makeup of the town was 95.3% White, 0.7% Native American, 0.3% Asian, 0.2% Pacific Islander, 0.1% from other races, and 3.4% from two or more races.
The median income for a household in Skagway was $45,000, and the median income for a family was $50,000. The per capita income for the town was $20,000. About 10.3% of the population was below the poverty line.
Skagway is a small town with a rich history and a unique culture. It is a popular tourist destination and is the gateway to the Klondike Gold Rush National Historical Park. The town has a mild climate and a diverse economy, with tourism, fishing, and timber being the main industries. The town has a population of about 1,000 people, with a median income of $45,000.
Common Questions
What is Per Capita Income in Skagway?
Per Capita income in Skagway is $46,997.
What is the Median Family Income in Skagway?
Median Family Income in Skagway is $115,000.
What is the Median Household income in Skagway?
Median Household Income in Skagway is $88,000.
What is Income or Wage Gap in Skagway?
Income or Wage Gap in Skagway is 33.6%.
Women in Skagway earn 66.4 cents for every dollar earned by a man.
What is Inequality or Gini Index in Skagway?
Inequality or Gini Index in Skagway is 0.33.
What is the Total Population of Skagway?
Total Population of Skagway is 1,179.
What is the Total Male Population of Skagway?
Total Male Population of Skagway is 473.
What is the Total Female Population of Skagway?
Total Female Population of Skagway is 706.
What is the Ratio of Males per 100 Females in Skagway?
There are 67.00 Males per 100 Females in Skagway.
What is the Ratio of Females per 100 Males in Skagway?
There are 149.26 Females per 100 Males in Skagway.
What is the Median Population Age in Skagway?
Median Population Age in Skagway is 35.8 Years.
What is the Average Family Size in Skagway
Average Family Size in Skagway is 3.7 People.
What is the Average Household Size in Skagway
Average Household Size in Skagway is 2.7 People.
How Large is the Labor Force in Skagway?
There are 827 People in the Labor Forcein in Skagway.
What is the Percentage of People in the Labor Force in Skagway?
82.5% of People are in the Labor Force in Skagway.
What is the Unemployment Rate in Skagway?
Unemployment Rate in Skagway is 11.4%.