Speculator, NY Map & Demographics
Speculator Map
Speculator Overview
$38,531
PER CAPITA INCOME
$95,536
AVG FAMILY INCOME
$71,563
AVG HOUSEHOLD INCOME
21.4%
WAGE / INCOME GAP [ % ]
78.6¢/ $1
WAGE / INCOME GAP [ $ ]
0.37
INEQUALITY / GINI INDEX
388
TOTAL POPULATION
177
MALE POPULATION
211
FEMALE POPULATION
83.89
MALES / 100 FEMALES
119.21
FEMALES / 100 MALES
59.7
MEDIAN AGE
3.5
AVG FAMILY SIZE
2.7
AVG HOUSEHOLD SIZE
170
LABOR FORCE [ PEOPLE ]
48.3%
PERCENT IN LABOR FORCE
5.3%
UNEMPLOYMENT RATE
Speculator Zip Codes
Speculator Area Codes
Income in Speculator
Income Overview in Speculator
Per Capita Income in Speculator is $38,531, while median incomes of families and households are $95,536 and $71,563 respectively.
| Characteristic | Number | Measure |
| Per Capita Income | 388 | $38,531 |
| Median Family Income | 77 | $95,536 |
| Mean Family Income | 77 | $107,656 |
| Median Household Income | 116 | $71,563 |
| Mean Household Income | 116 | $88,912 |
| Income Deficit | 77 | $0 |
| Wage / Income Gap (%) | 388 | 21.43% |
| Wage / Income Gap ($) | 388 | 78.57¢ per $1 |
| Gini / Inequality Index | 388 | 0.37 |
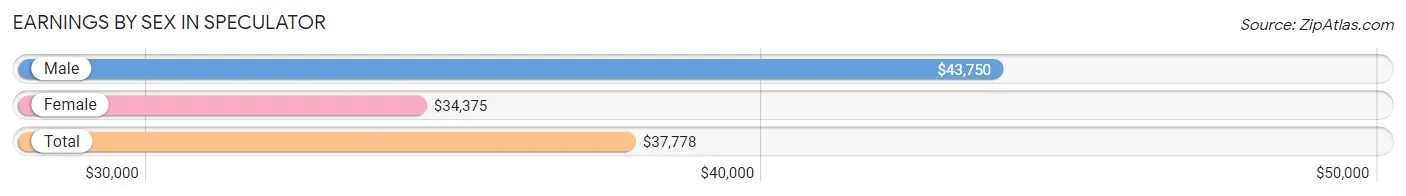
Earnings by Sex in Speculator
Average Earnings in Speculator are $37,778, $43,750 for men and $34,375 for women, a difference of 21.4%.
| Sex | Number | Average Earnings |
| Male | 106 (55.8%) | $43,750 |
| Female | 84 (44.2%) | $34,375 |
| Total | 190 (100.0%) | $37,778 |
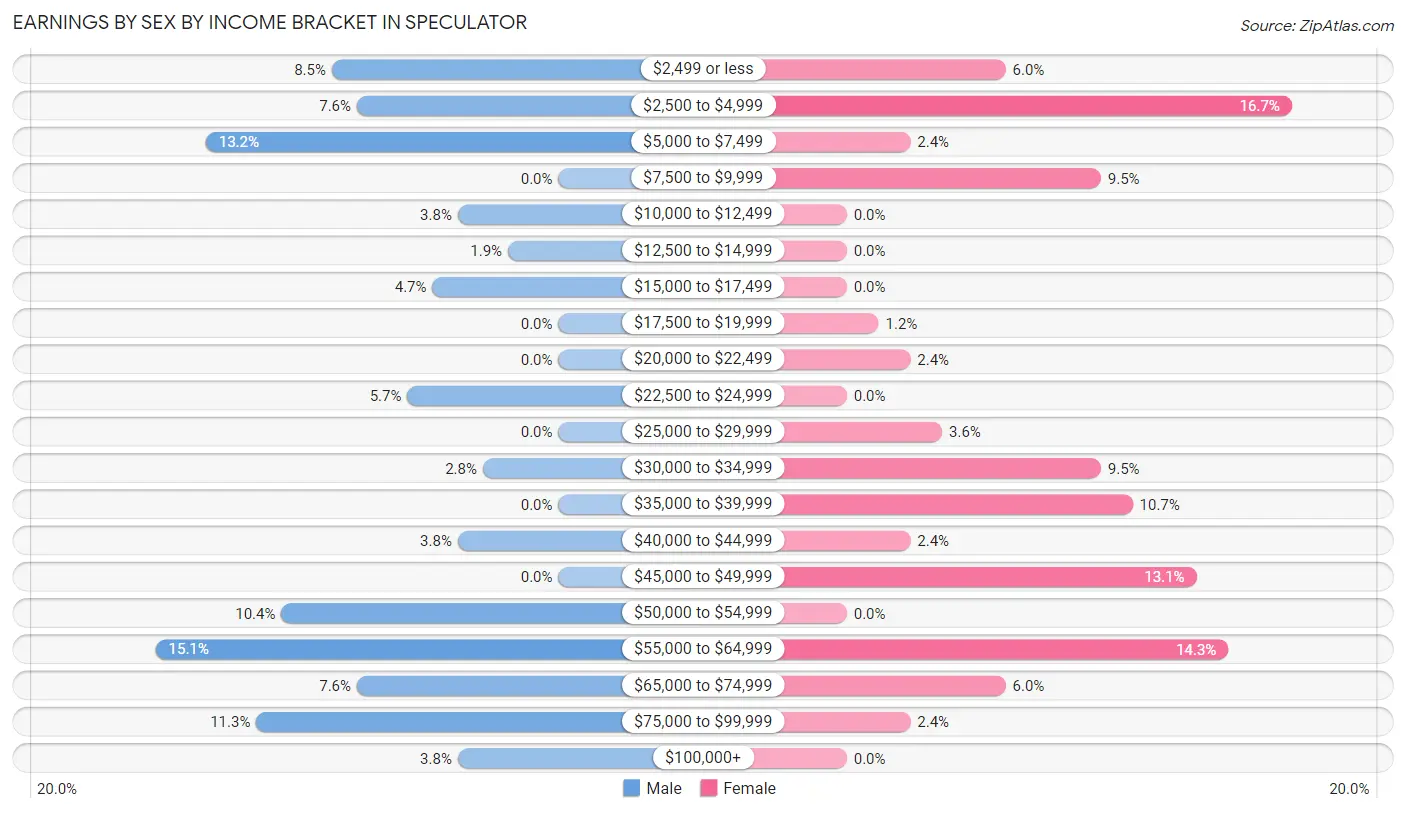
Earnings by Sex by Income Bracket in Speculator
The most common earnings brackets in Speculator are $55,000 to $64,999 for men (16 | 15.1%) and $2,500 to $4,999 for women (14 | 16.7%).
| Income | Male | Female |
| $2,499 or less | 9 (8.5%) | 5 (5.9%) |
| $2,500 to $4,999 | 8 (7.5%) | 14 (16.7%) |
| $5,000 to $7,499 | 14 (13.2%) | 2 (2.4%) |
| $7,500 to $9,999 | 0 (0.0%) | 8 (9.5%) |
| $10,000 to $12,499 | 4 (3.8%) | 0 (0.0%) |
| $12,500 to $14,999 | 2 (1.9%) | 0 (0.0%) |
| $15,000 to $17,499 | 5 (4.7%) | 0 (0.0%) |
| $17,500 to $19,999 | 0 (0.0%) | 1 (1.2%) |
| $20,000 to $22,499 | 0 (0.0%) | 2 (2.4%) |
| $22,500 to $24,999 | 6 (5.7%) | 0 (0.0%) |
| $25,000 to $29,999 | 0 (0.0%) | 3 (3.6%) |
| $30,000 to $34,999 | 3 (2.8%) | 8 (9.5%) |
| $35,000 to $39,999 | 0 (0.0%) | 9 (10.7%) |
| $40,000 to $44,999 | 4 (3.8%) | 2 (2.4%) |
| $45,000 to $49,999 | 0 (0.0%) | 11 (13.1%) |
| $50,000 to $54,999 | 11 (10.4%) | 0 (0.0%) |
| $55,000 to $64,999 | 16 (15.1%) | 12 (14.3%) |
| $65,000 to $74,999 | 8 (7.5%) | 5 (5.9%) |
| $75,000 to $99,999 | 12 (11.3%) | 2 (2.4%) |
| $100,000+ | 4 (3.8%) | 0 (0.0%) |
| Total | 106 (100.0%) | 84 (100.0%) |
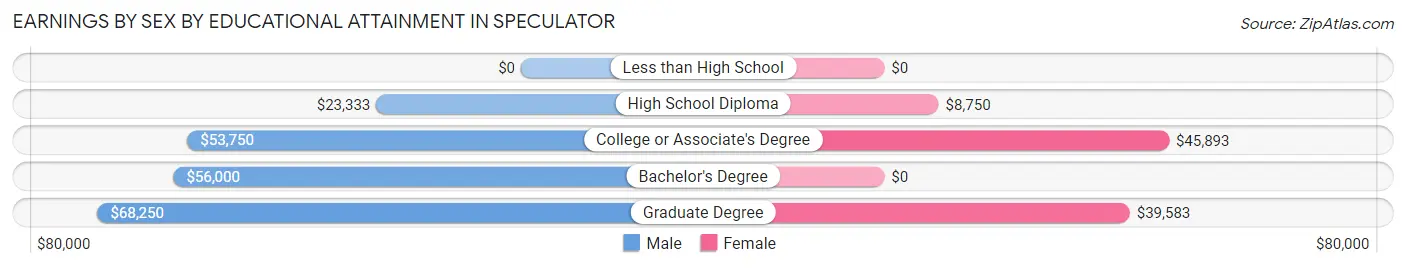
Earnings by Sex by Educational Attainment in Speculator
Average earnings in Speculator are $54,219 for men and $39,028 for women, a difference of 28.0%. Men with an educational attainment of graduate degree enjoy the highest average annual earnings of $68,250, while those with high school diploma education earn the least with $23,333. Women with an educational attainment of college or associate's degree earn the most with the average annual earnings of $45,893, while those with high school diploma education have the smallest earnings of $8,750.
| Educational Attainment | Male Income | Female Income |
| Less than High School | - | - |
| High School Diploma | $23,333 | $8,750 |
| College or Associate's Degree | $53,750 | $45,893 |
| Bachelor's Degree | $56,000 | $0 |
| Graduate Degree | $68,250 | $39,583 |
| Total | $54,219 | $39,028 |
Family Income in Speculator
Family Income Brackets in Speculator
According to the Speculator family income data, there are 20 families falling into the $100,000 to $149,999 income range, which is the most common income bracket and makes up 26.0% of all families.
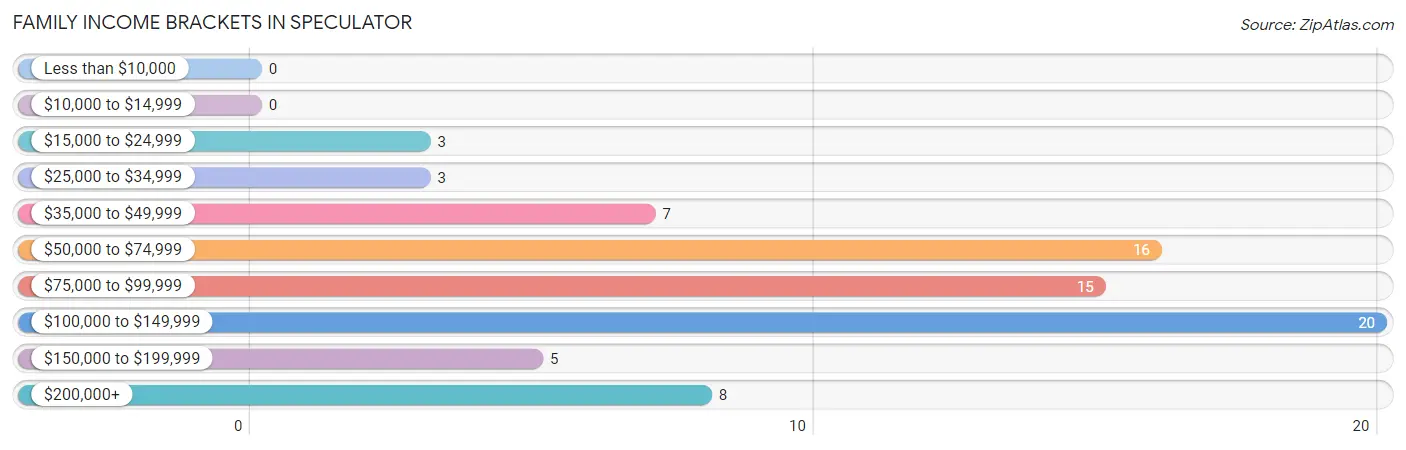
| Income Bracket | # Families | % Families |
| Less than $10,000 | 0 | 0.0% |
| $10,000 to $14,999 | 0 | 0.0% |
| $15,000 to $24,999 | 3 | 3.9% |
| $25,000 to $34,999 | 3 | 3.9% |
| $35,000 to $49,999 | 7 | 9.1% |
| $50,000 to $74,999 | 16 | 20.8% |
| $75,000 to $99,999 | 15 | 19.5% |
| $100,000 to $149,999 | 20 | 26.0% |
| $150,000 to $199,999 | 5 | 6.5% |
| $200,000+ | 8 | 10.4% |
Family Income by Famaliy Size in Speculator
4-person families (9 | 11.7%) account for the highest median family income in Speculator with $130,250 per family, while 2-person families (54 | 70.1%) have the highest median income of $43,125 per family member.
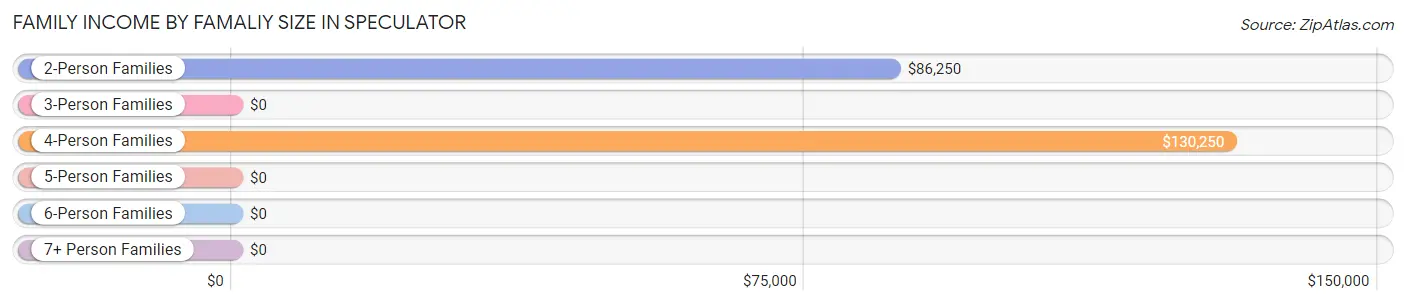
| Income Bracket | # Families | Median Income |
| 2-Person Families | 54 (70.1%) | $86,250 |
| 3-Person Families | 8 (10.4%) | $0 |
| 4-Person Families | 9 (11.7%) | $130,250 |
| 5-Person Families | 5 (6.5%) | $0 |
| 6-Person Families | 1 (1.3%) | $0 |
| 7+ Person Families | 0 (0.0%) | $0 |
| Total | 77 (100.0%) | $95,536 |
Family Income by Number of Earners in Speculator
The median family income in Speculator is $95,536, with families comprising 3+ earners (12) having the highest median family income of $130,500, while families with 1 earner (21) have the lowest median family income of $56,250, accounting for 15.6% and 27.3% of families, respectively.
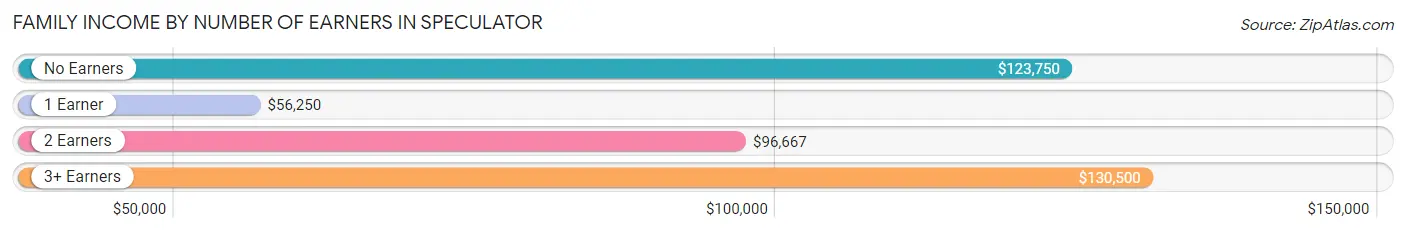
| Number of Earners | # Families | Median Income |
| No Earners | 18 (23.4%) | $123,750 |
| 1 Earner | 21 (27.3%) | $56,250 |
| 2 Earners | 26 (33.8%) | $96,667 |
| 3+ Earners | 12 (15.6%) | $130,500 |
| Total | 77 (100.0%) | $95,536 |
Household Income in Speculator
Household Income Brackets in Speculator
With 33 households falling in the category, the $50,000 to $74,999 income range is the most frequent in Speculator, accounting for 28.4% of all households. In contrast, only 1 households (0.9%) fall into the $10,000 to $14,999 income bracket, making it the least populous group.
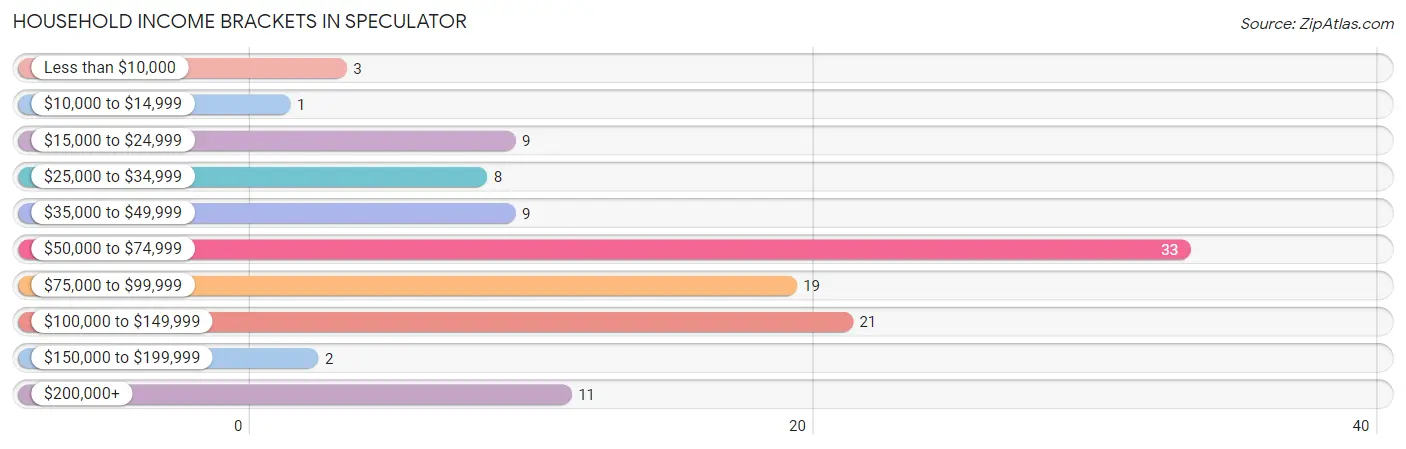
| Income Bracket | # Households | % Households |
| Less than $10,000 | 3 | 2.6% |
| $10,000 to $14,999 | 1 | 0.9% |
| $15,000 to $24,999 | 9 | 7.8% |
| $25,000 to $34,999 | 8 | 6.9% |
| $35,000 to $49,999 | 9 | 7.8% |
| $50,000 to $74,999 | 33 | 28.4% |
| $75,000 to $99,999 | 19 | 16.4% |
| $100,000 to $149,999 | 21 | 18.1% |
| $150,000 to $199,999 | 2 | 1.7% |
| $200,000+ | 11 | 9.5% |
Household Income by Householder Age in Speculator
The median household income in Speculator is $71,563, with the highest median household income of $80,625 found in the 65+ years age bracket for the primary householder. A total of 47 households (40.5%) fall into this category.
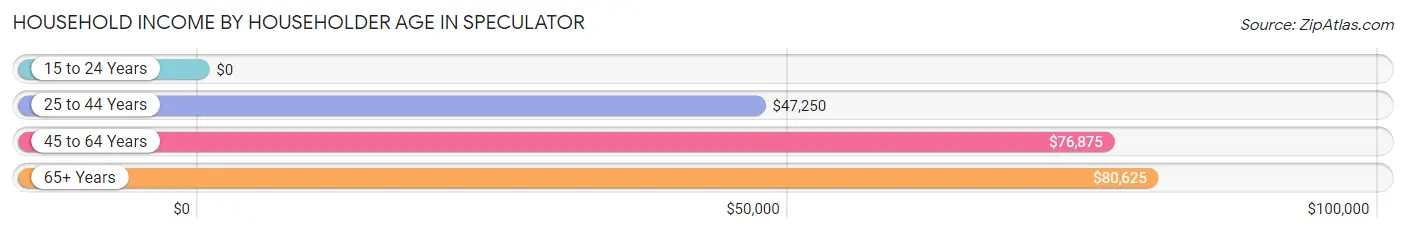
| Income Bracket | # Households | Median Income |
| 15 to 24 Years | 0 (0.0%) | $0 |
| 25 to 44 Years | 25 (21.5%) | $47,250 |
| 45 to 64 Years | 44 (37.9%) | $76,875 |
| 65+ Years | 47 (40.5%) | $80,625 |
| Total | 116 (100.0%) | $71,563 |
Poverty in Speculator
Income Below Poverty by Sex and Age in Speculator
With 5.1% poverty level for males and 21.3% for females among the residents of Speculator, 12 to 14 year old males and 15 year old females are the most vulnerable to poverty, with 3 males (60.0%) and 1 females (100.0%) in their respective age groups living below the poverty level.
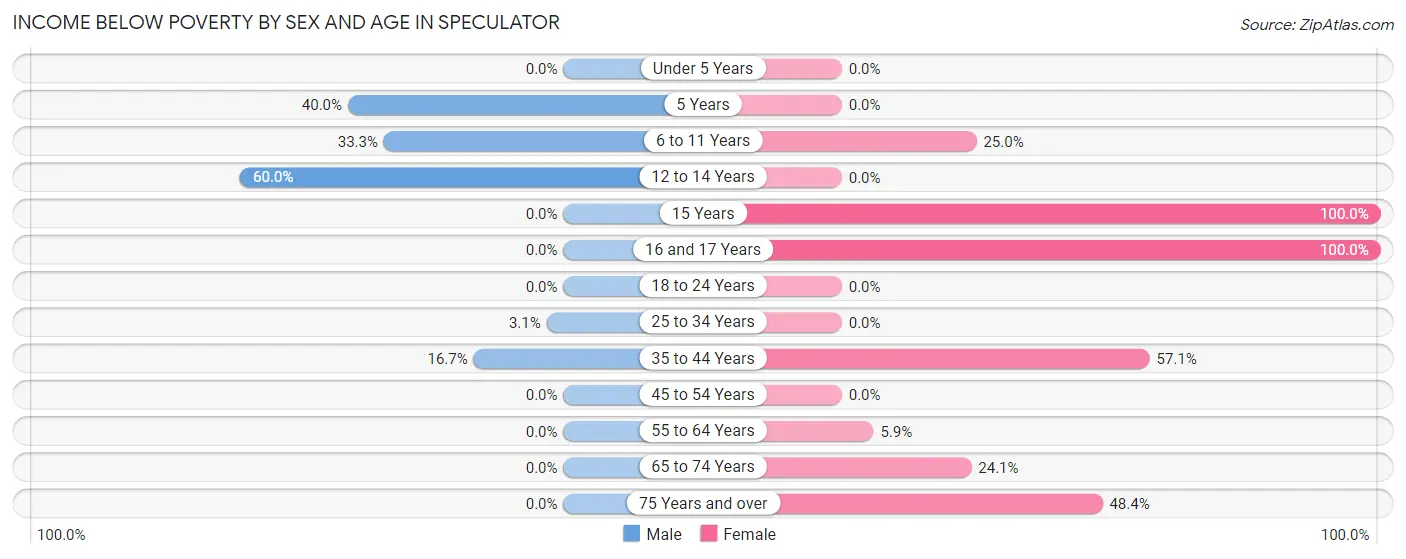
| Age Bracket | Male | Female |
| Under 5 Years | 0 (0.0%) | 0 (0.0%) |
| 5 Years | 2 (40.0%) | 0 (0.0%) |
| 6 to 11 Years | 2 (33.3%) | 2 (25.0%) |
| 12 to 14 Years | 3 (60.0%) | 0 (0.0%) |
| 15 Years | 0 (0.0%) | 1 (100.0%) |
| 16 and 17 Years | 0 (0.0%) | 2 (100.0%) |
| 18 to 24 Years | 0 (0.0%) | 0 (0.0%) |
| 25 to 34 Years | 1 (3.1%) | 0 (0.0%) |
| 35 to 44 Years | 1 (16.7%) | 4 (57.1%) |
| 45 to 54 Years | 0 (0.0%) | 0 (0.0%) |
| 55 to 64 Years | 0 (0.0%) | 2 (5.9%) |
| 65 to 74 Years | 0 (0.0%) | 19 (24.0%) |
| 75 Years and over | 0 (0.0%) | 15 (48.4%) |
| Total | 9 (5.1%) | 45 (21.3%) |
Income Above Poverty by Sex and Age in Speculator
According to the poverty statistics in Speculator, males aged 15 years and females aged under 5 years are the age groups that are most secure financially, with 100.0% of males and 100.0% of females in these age groups living above the poverty line.
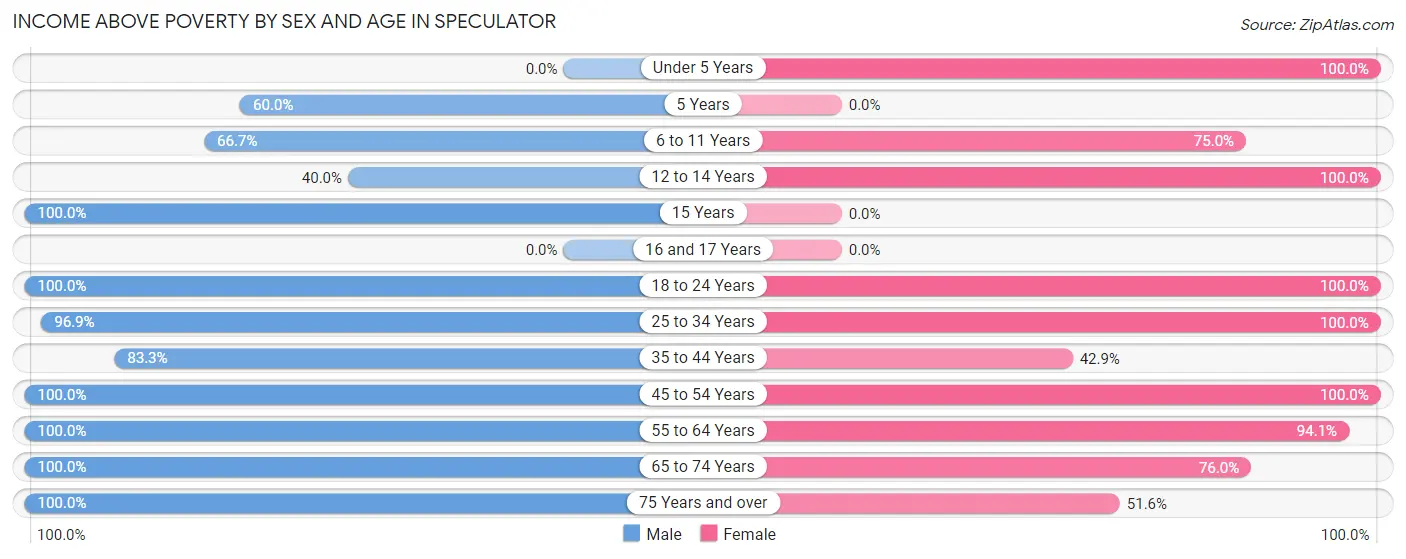
| Age Bracket | Male | Female |
| Under 5 Years | 0 (0.0%) | 7 (100.0%) |
| 5 Years | 3 (60.0%) | 0 (0.0%) |
| 6 to 11 Years | 4 (66.7%) | 6 (75.0%) |
| 12 to 14 Years | 2 (40.0%) | 2 (100.0%) |
| 15 Years | 2 (100.0%) | 0 (0.0%) |
| 16 and 17 Years | 0 (0.0%) | 0 (0.0%) |
| 18 to 24 Years | 21 (100.0%) | 11 (100.0%) |
| 25 to 34 Years | 31 (96.9%) | 10 (100.0%) |
| 35 to 44 Years | 5 (83.3%) | 3 (42.9%) |
| 45 to 54 Years | 8 (100.0%) | 19 (100.0%) |
| 55 to 64 Years | 35 (100.0%) | 32 (94.1%) |
| 65 to 74 Years | 39 (100.0%) | 60 (75.9%) |
| 75 Years and over | 18 (100.0%) | 16 (51.6%) |
| Total | 168 (94.9%) | 166 (78.7%) |
Income Below Poverty Among Married-Couple Families in Speculator
The poverty statistics for married-couple families in Speculator show that 1.7% or 1 of the total 60 families live below the poverty line. Families with 3 or 4 children have the highest poverty rate of 25.0%, comprising of 1 families. On the other hand, families with no children have the lowest poverty rate of 0.0%, which includes 0 families.
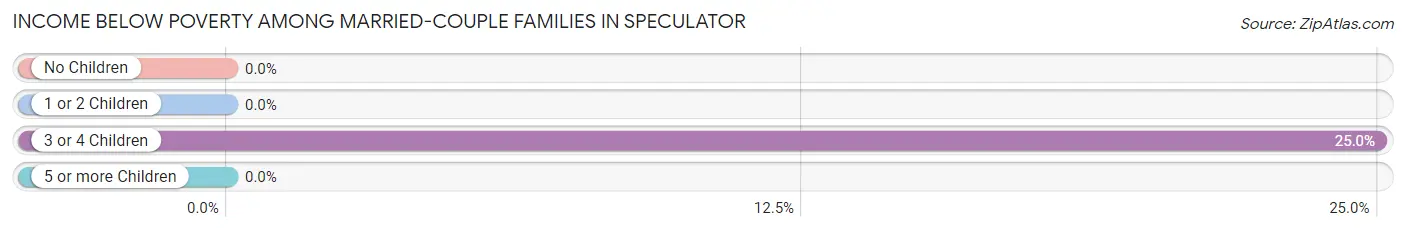
| Children | Above Poverty | Below Poverty |
| No Children | 53 (100.0%) | 0 (0.0%) |
| 1 or 2 Children | 3 (100.0%) | 0 (0.0%) |
| 3 or 4 Children | 3 (75.0%) | 1 (25.0%) |
| 5 or more Children | 0 (0.0%) | 0 (0.0%) |
| Total | 59 (98.3%) | 1 (1.7%) |
Income Below Poverty Among Single-Parent Households in Speculator
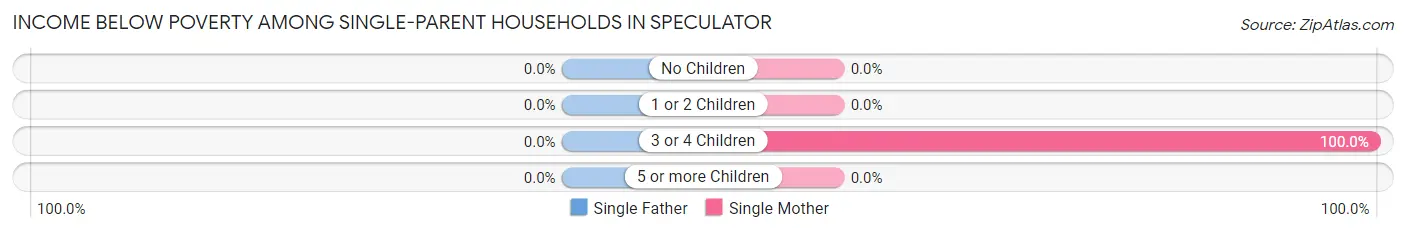
| Children | Single Father | Single Mother |
| No Children | 0 (0.0%) | 0 (0.0%) |
| 1 or 2 Children | 0 (0.0%) | 0 (0.0%) |
| 3 or 4 Children | 0 (0.0%) | 3 (100.0%) |
| 5 or more Children | 0 (0.0%) | 0 (0.0%) |
| Total | 0 (0.0%) | 3 (30.0%) |
Income Below Poverty Among Married-Couple vs Single-Parent Households in Speculator
The poverty data for Speculator shows that 1 of the married-couple family households (1.7%) and 3 of the single-parent households (17.6%) are living below the poverty level. Within the married-couple family households, those with 3 or 4 children have the highest poverty rate, with 1 households (25.0%) falling below the poverty line. Among the single-parent households, those with 3 or 4 children have the highest poverty rate, with 3 household (100.0%) living below poverty.
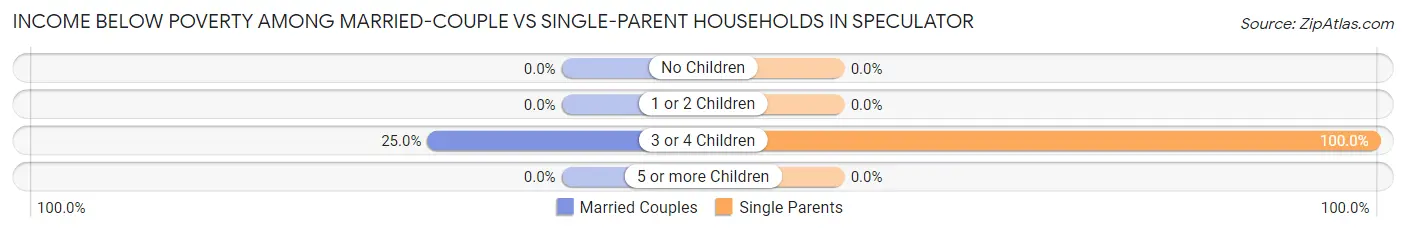
| Children | Married-Couple Families | Single-Parent Households |
| No Children | 0 (0.0%) | 0 (0.0%) |
| 1 or 2 Children | 0 (0.0%) | 0 (0.0%) |
| 3 or 4 Children | 1 (25.0%) | 3 (100.0%) |
| 5 or more Children | 0 (0.0%) | 0 (0.0%) |
| Total | 1 (1.7%) | 3 (17.6%) |
Race in Speculator
The most populous races in Speculator are White / Caucasian (379 | 97.7%), Hispanic or Latino (6 | 1.5%), and Two or more Races (6 | 1.5%).
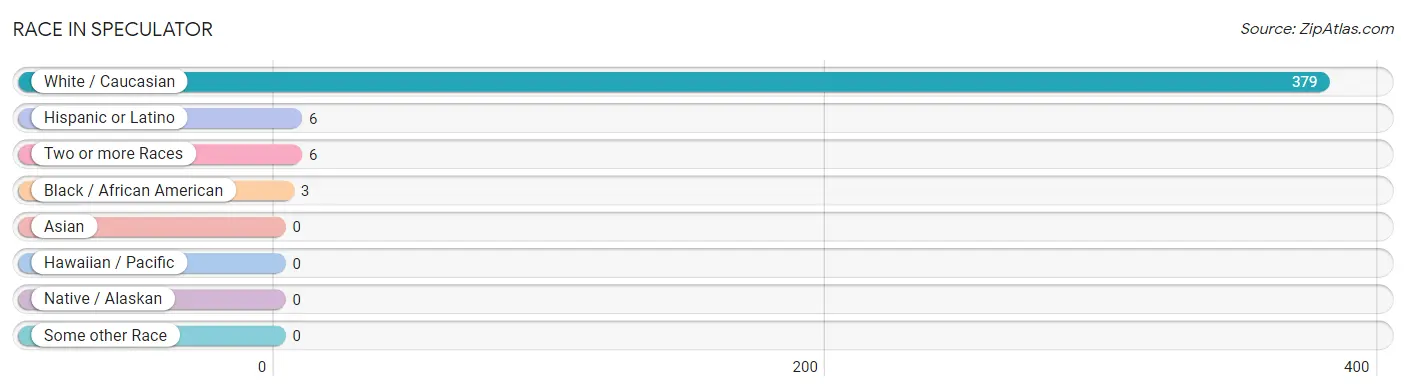
| Race | # Population | % Population |
| Asian | 0 | 0.0% |
| Black / African American | 3 | 0.8% |
| Hawaiian / Pacific | 0 | 0.0% |
| Hispanic or Latino | 6 | 1.5% |
| Native / Alaskan | 0 | 0.0% |
| White / Caucasian | 379 | 97.7% |
| Two or more Races | 6 | 1.5% |
| Some other Race | 0 | 0.0% |
| Total | 388 | 100.0% |
Ancestry in Speculator
The most populous ancestries reported in Speculator are English (124 | 32.0%), American (61 | 15.7%), Irish (56 | 14.4%), German (46 | 11.9%), and Italian (35 | 9.0%), together accounting for 83.0% of all Speculator residents.
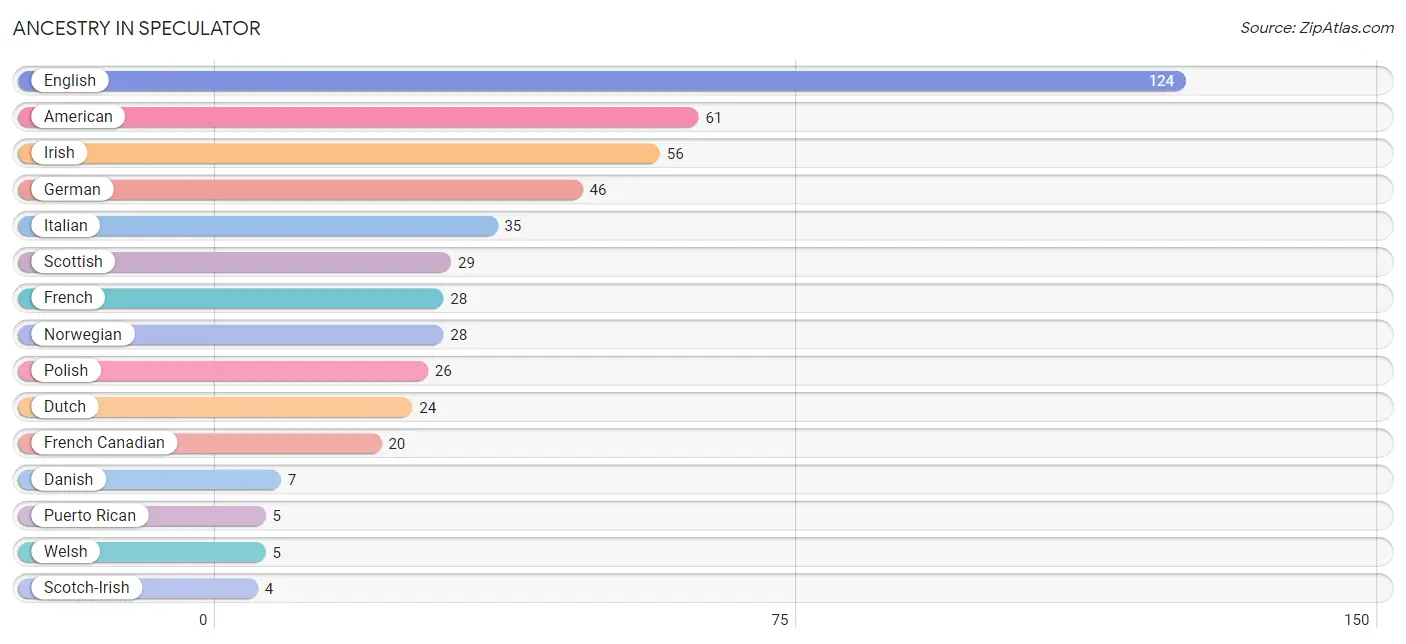
| Ancestry | # Population | % Population |
| American | 61 | 15.7% |
| Czech | 1 | 0.3% |
| Danish | 7 | 1.8% |
| Dutch | 24 | 6.2% |
| English | 124 | 32.0% |
| French | 28 | 7.2% |
| French Canadian | 20 | 5.1% |
| German | 46 | 11.9% |
| Greek | 2 | 0.5% |
| Hungarian | 2 | 0.5% |
| Irish | 56 | 14.4% |
| Italian | 35 | 9.0% |
| Maltese | 2 | 0.5% |
| Norwegian | 28 | 7.2% |
| Polish | 26 | 6.7% |
| Puerto Rican | 5 | 1.3% |
| Scotch-Irish | 4 | 1.0% |
| Scottish | 29 | 7.5% |
| Spanish | 1 | 0.3% |
| Ukrainian | 4 | 1.0% |
| Welsh | 5 | 1.3% | View All 21 Rows |
Immigrants in Speculator
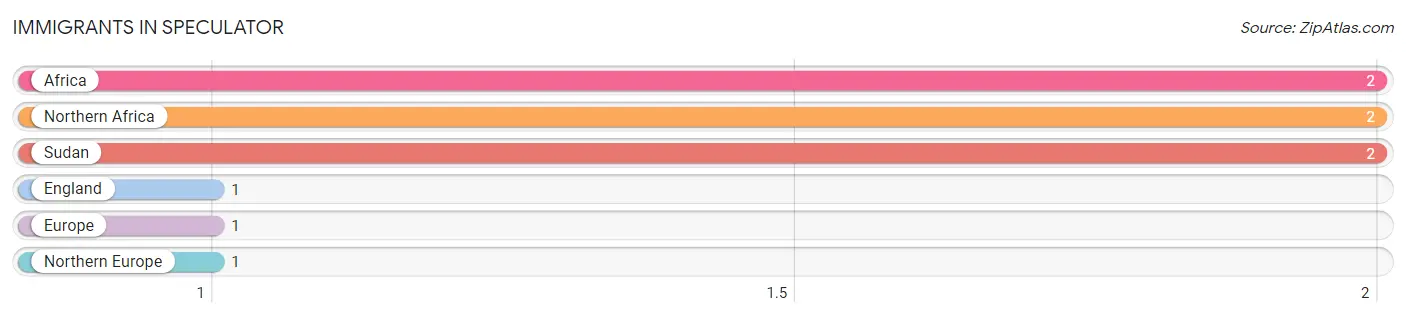
The most numerous immigrant groups reported in Speculator came from Africa (2 | 0.5%), Northern Africa (2 | 0.5%), Sudan (2 | 0.5%), England (1 | 0.3%), and Europe (1 | 0.3%), together accounting for 2.1% of all Speculator residents.
| Immigration Origin | # Population | % Population |
| Africa | 2 | 0.5% |
| England | 1 | 0.3% |
| Europe | 1 | 0.3% |
| Northern Africa | 2 | 0.5% |
| Northern Europe | 1 | 0.3% |
| Sudan | 2 | 0.5% | View All 6 Rows |
Sex and Age in Speculator
Sex and Age in Speculator
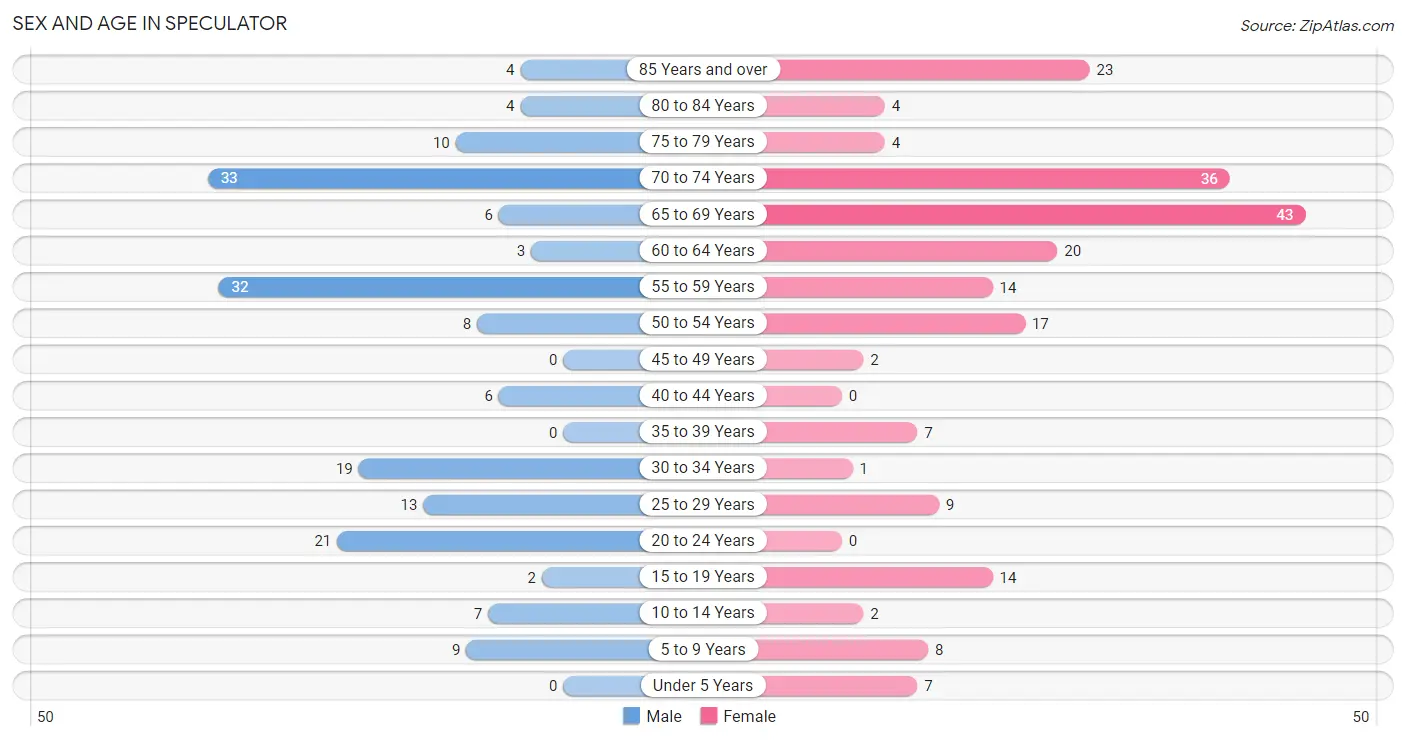
The most populous age groups in Speculator are 70 to 74 Years (33 | 18.6%) for men and 65 to 69 Years (43 | 20.4%) for women.
| Age Bracket | Male | Female |
| Under 5 Years | 0 (0.0%) | 7 (3.3%) |
| 5 to 9 Years | 9 (5.1%) | 8 (3.8%) |
| 10 to 14 Years | 7 (4.0%) | 2 (0.9%) |
| 15 to 19 Years | 2 (1.1%) | 14 (6.6%) |
| 20 to 24 Years | 21 (11.9%) | 0 (0.0%) |
| 25 to 29 Years | 13 (7.3%) | 9 (4.3%) |
| 30 to 34 Years | 19 (10.7%) | 1 (0.5%) |
| 35 to 39 Years | 0 (0.0%) | 7 (3.3%) |
| 40 to 44 Years | 6 (3.4%) | 0 (0.0%) |
| 45 to 49 Years | 0 (0.0%) | 2 (0.9%) |
| 50 to 54 Years | 8 (4.5%) | 17 (8.1%) |
| 55 to 59 Years | 32 (18.1%) | 14 (6.6%) |
| 60 to 64 Years | 3 (1.7%) | 20 (9.5%) |
| 65 to 69 Years | 6 (3.4%) | 43 (20.4%) |
| 70 to 74 Years | 33 (18.6%) | 36 (17.1%) |
| 75 to 79 Years | 10 (5.7%) | 4 (1.9%) |
| 80 to 84 Years | 4 (2.3%) | 4 (1.9%) |
| 85 Years and over | 4 (2.3%) | 23 (10.9%) |
| Total | 177 (100.0%) | 211 (100.0%) |
Families and Households in Speculator
Median Family Size in Speculator
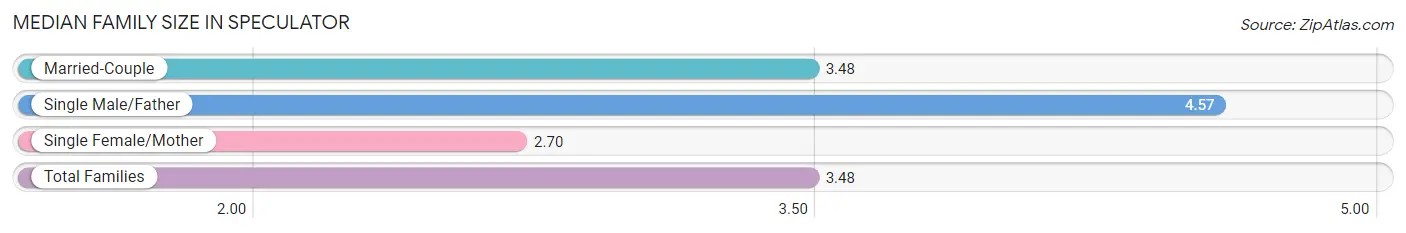
The median family size in Speculator is 3.48 persons per family, with single male/father families (7 | 9.1%) accounting for the largest median family size of 4.57 persons per family. On the other hand, single female/mother families (10 | 13.0%) represent the smallest median family size with 2.70 persons per family.
| Family Type | # Families | Family Size |
| Married-Couple | 60 (77.9%) | 3.48 |
| Single Male/Father | 7 (9.1%) | 4.57 |
| Single Female/Mother | 10 (13.0%) | 2.70 |
| Total Families | 77 (100.0%) | 3.48 |
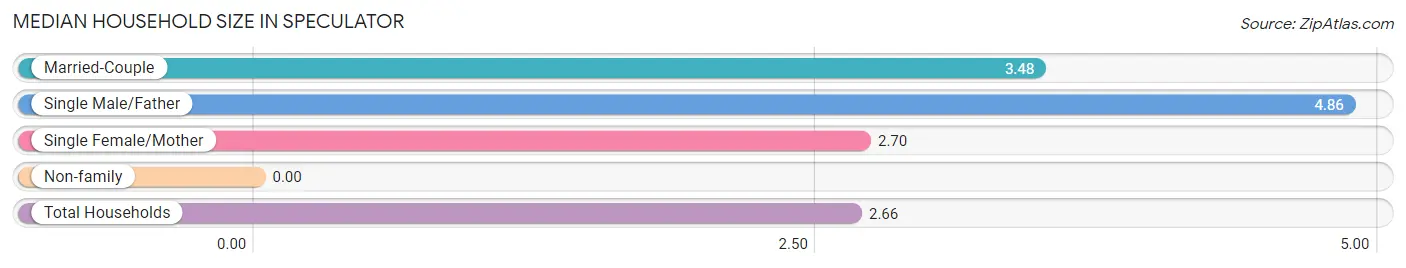
Median Household Size in Speculator
| Household Type | # Households | Household Size |
| Married-Couple | 60 (51.7%) | 3.48 |
| Single Male/Father | 7 (6.0%) | 4.86 |
| Single Female/Mother | 10 (8.6%) | 2.70 |
| Non-family | 39 (33.6%) | - |
| Total Households | 116 (100.0%) | 2.66 |
Household Size by Marriage Status in Speculator
Out of a total of 116 households in Speculator, 77 (66.4%) are family households, while 39 (33.6%) are nonfamily households. The most numerous type of family households are 2-person households, comprising 51, and the most common type of nonfamily households are 1-person households, comprising 39.
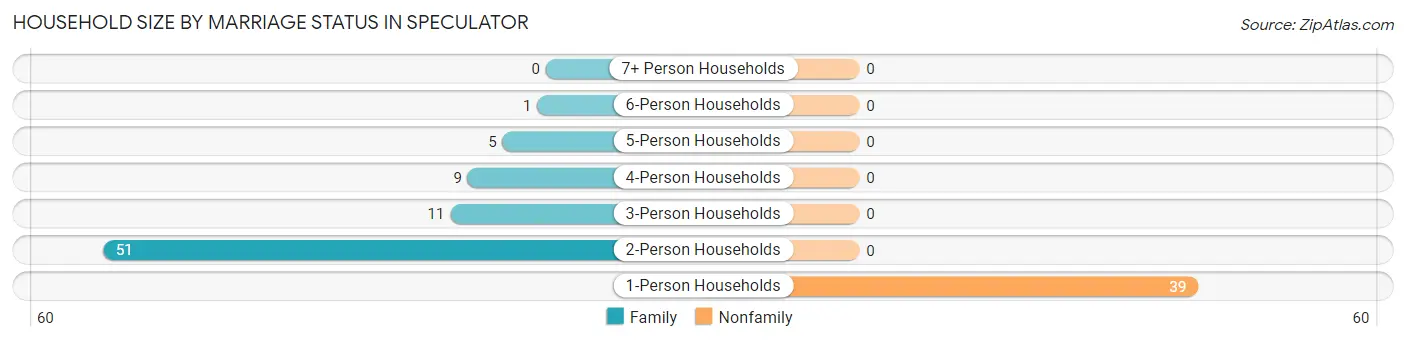
| Household Size | Family Households | Nonfamily Households |
| 1-Person Households | - | 39 (33.6%) |
| 2-Person Households | 51 (44.0%) | 0 (0.0%) |
| 3-Person Households | 11 (9.5%) | 0 (0.0%) |
| 4-Person Households | 9 (7.8%) | 0 (0.0%) |
| 5-Person Households | 5 (4.3%) | 0 (0.0%) |
| 6-Person Households | 1 (0.9%) | 0 (0.0%) |
| 7+ Person Households | 0 (0.0%) | 0 (0.0%) |
| Total | 77 (66.4%) | 39 (33.6%) |
Female Fertility in Speculator
Fertility by Age in Speculator
Average fertility rate in Speculator is 61.0 births per 1,000 women. Women in the age bracket of 20 to 34 years have the highest fertility rate with 200.0 births per 1,000 women. Women in the age bracket of 20 to 34 years acount for 100.0% of all women with births.
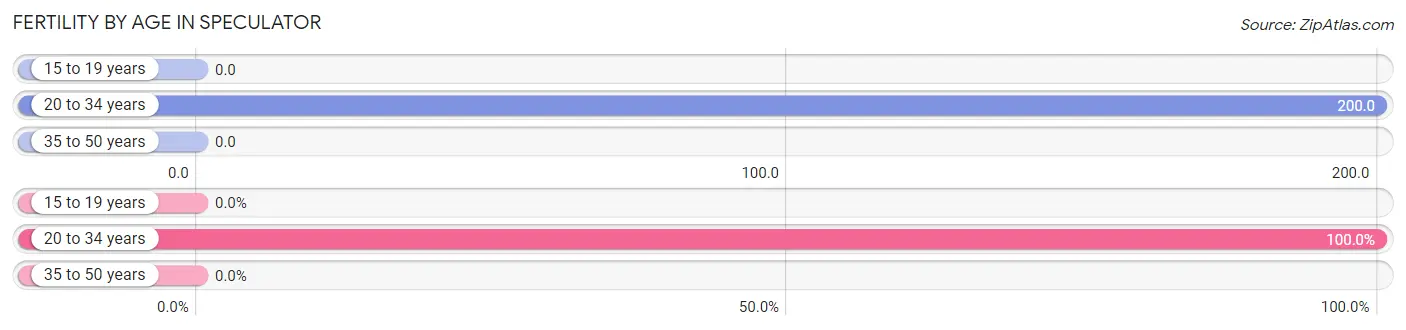
| Age Bracket | Women with Births | Births / 1,000 Women |
| 15 to 19 years | 0 (0.0%) | 0.0 |
| 20 to 34 years | 2 (100.0%) | 200.0 |
| 35 to 50 years | 0 (0.0%) | 0.0 |
| Total | 2 (100.0%) | 61.0 |
Fertility by Age by Marriage Status in Speculator
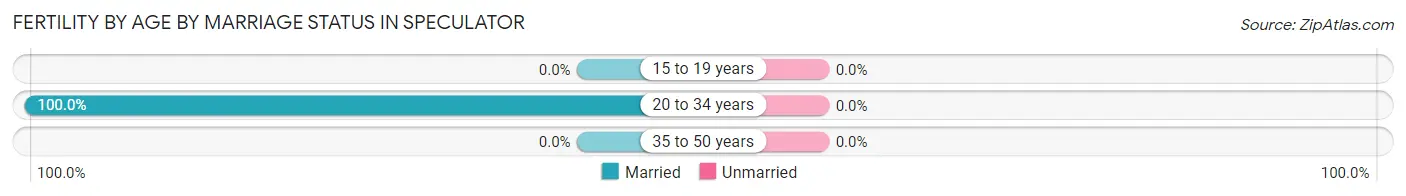
| Age Bracket | Married | Unmarried |
| 15 to 19 years | 0 (0.0%) | 0 (0.0%) |
| 20 to 34 years | 2 (100.0%) | 0 (0.0%) |
| 35 to 50 years | 0 (0.0%) | 0 (0.0%) |
| Total | 2 (100.0%) | 0 (0.0%) |
Fertility by Education in Speculator
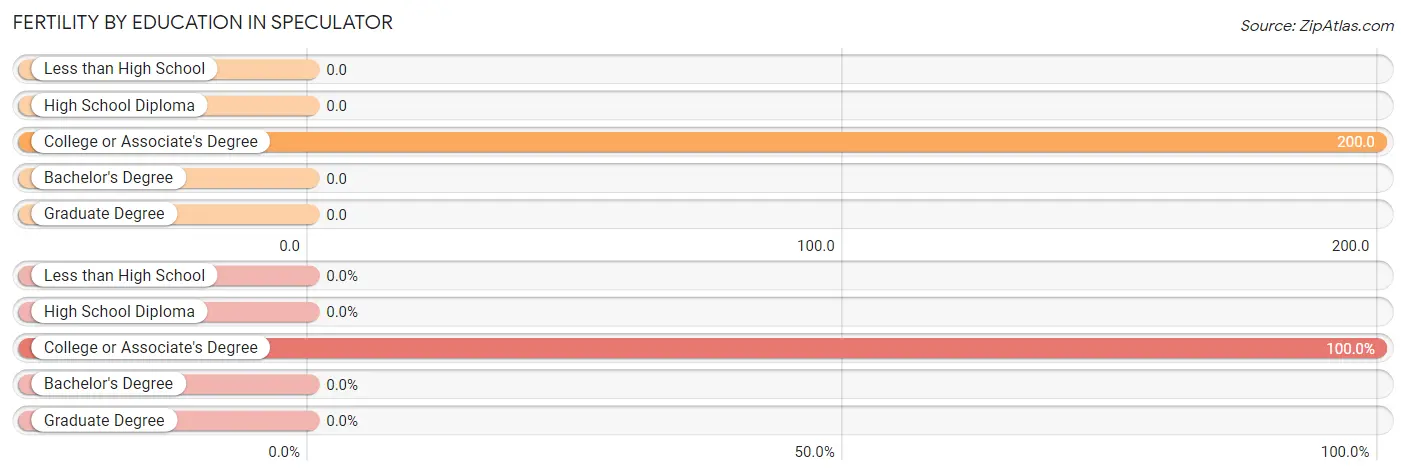
| Educational Attainment | Women with Births | Births / 1,000 Women |
| Less than High School | 0 (0.0%) | 0.0 |
| High School Diploma | 0 (0.0%) | 0.0 |
| College or Associate's Degree | 2 (100.0%) | 200.0 |
| Bachelor's Degree | 0 (0.0%) | 0.0 |
| Graduate Degree | 0 (0.0%) | 0.0 |
| Total | 2 (100.0%) | 61.0 |
Fertility by Education by Marriage Status in Speculator
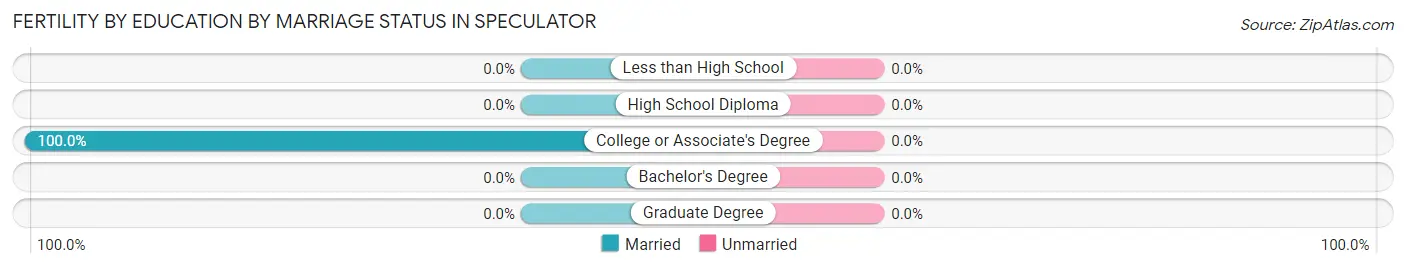
| Educational Attainment | Married | Unmarried |
| Less than High School | 0 (0.0%) | 0 (0.0%) |
| High School Diploma | 0 (0.0%) | 0 (0.0%) |
| College or Associate's Degree | 2 (100.0%) | 0 (0.0%) |
| Bachelor's Degree | 0 (0.0%) | 0 (0.0%) |
| Graduate Degree | 0 (0.0%) | 0 (0.0%) |
| Total | 2 (100.0%) | 0 (0.0%) |
Employment Characteristics in Speculator
Employment by Class of Employer in Speculator
Among the 161 employed individuals in Speculator, private company employees (70 | 43.5%), not-for-profit organizations (32 | 19.9%), and local government employees (32 | 19.9%) make up the most common classes of employment.
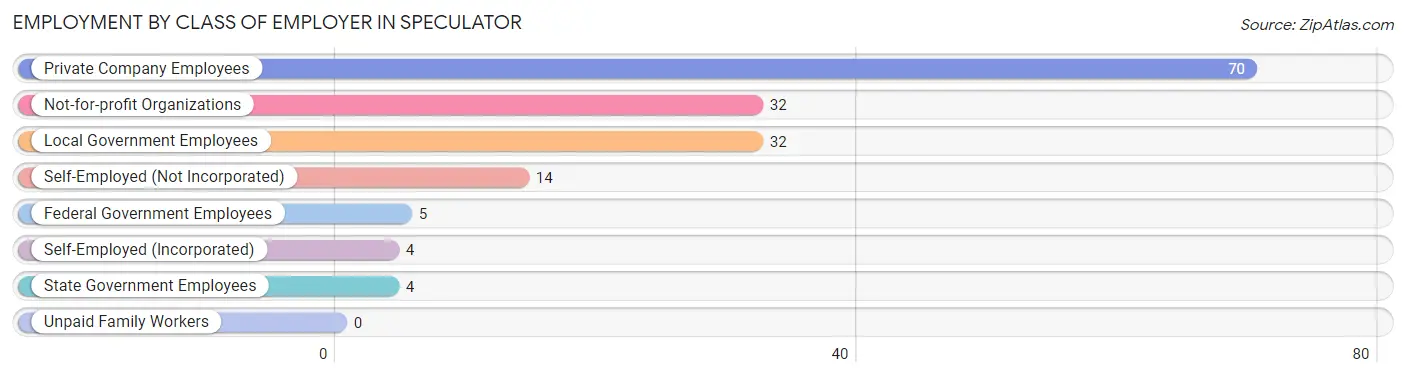
| Employer Class | # Employees | % Employees |
| Private Company Employees | 70 | 43.5% |
| Self-Employed (Incorporated) | 4 | 2.5% |
| Self-Employed (Not Incorporated) | 14 | 8.7% |
| Not-for-profit Organizations | 32 | 19.9% |
| Local Government Employees | 32 | 19.9% |
| State Government Employees | 4 | 2.5% |
| Federal Government Employees | 5 | 3.1% |
| Unpaid Family Workers | 0 | 0.0% |
| Total | 161 | 100.0% |
Employment Status by Age in Speculator
According to the labor force statistics for Speculator, out of the total population over 16 years of age (352), 48.3% or 170 individuals are in the labor force, with 5.3% or 9 of them unemployed. The age group with the highest labor force participation rate is 45 to 54 years, with 100.0% or 27 individuals in the labor force. Within the labor force, the 75 years and over age range has the highest percentage of unemployed individuals, with 71.4% or 5 of them being unemployed.
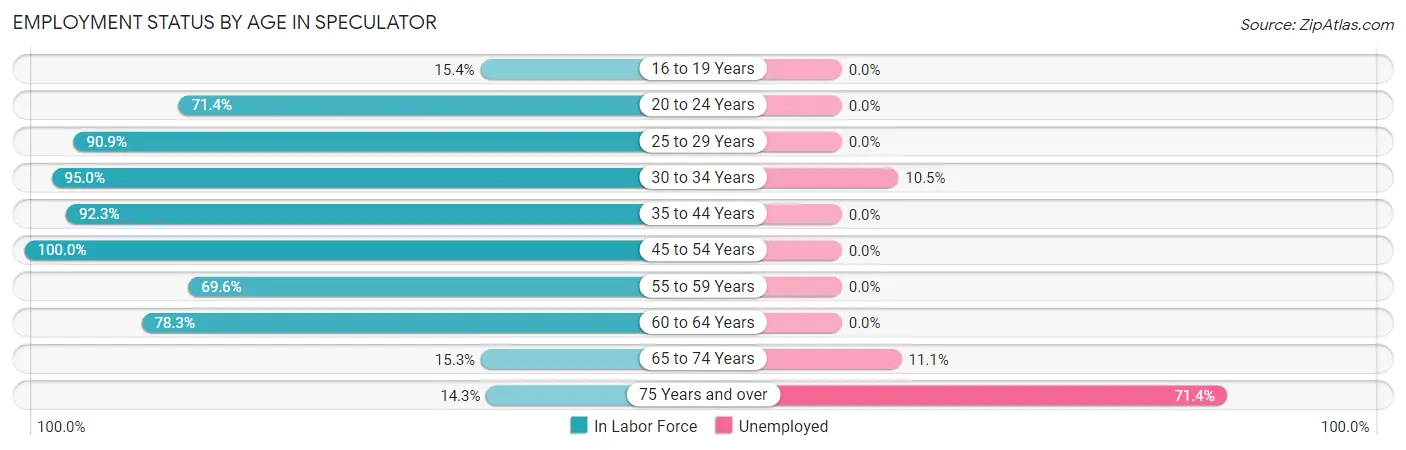
| Age Bracket | In Labor Force | Unemployed |
| 16 to 19 Years | 2 (15.4%) | 0 (0.0%) |
| 20 to 24 Years | 15 (71.4%) | 0 (0.0%) |
| 25 to 29 Years | 20 (90.9%) | 0 (0.0%) |
| 30 to 34 Years | 19 (95.0%) | 2 (10.5%) |
| 35 to 44 Years | 12 (92.3%) | 0 (0.0%) |
| 45 to 54 Years | 27 (100.0%) | 0 (0.0%) |
| 55 to 59 Years | 32 (69.6%) | 0 (0.0%) |
| 60 to 64 Years | 18 (78.3%) | 0 (0.0%) |
| 65 to 74 Years | 18 (15.3%) | 2 (11.1%) |
| 75 Years and over | 7 (14.3%) | 5 (71.4%) |
| Total | 170 (48.3%) | 9 (5.3%) |
Employment Status by Educational Attainment in Speculator
According to labor force statistics for Speculator, 84.8% of individuals (128) out of the total population between 25 and 64 years of age (151) are in the labor force, with 1.6% or 2 of them being unemployed. The group with the highest labor force participation rate are those with the educational attainment of bachelor's degree or higher, with 89.5% or 51 individuals in the labor force. Within the labor force, individuals with bachelor's degree or higher education have the highest percentage of unemployment, with 3.9% or 2 of them being unemployed.
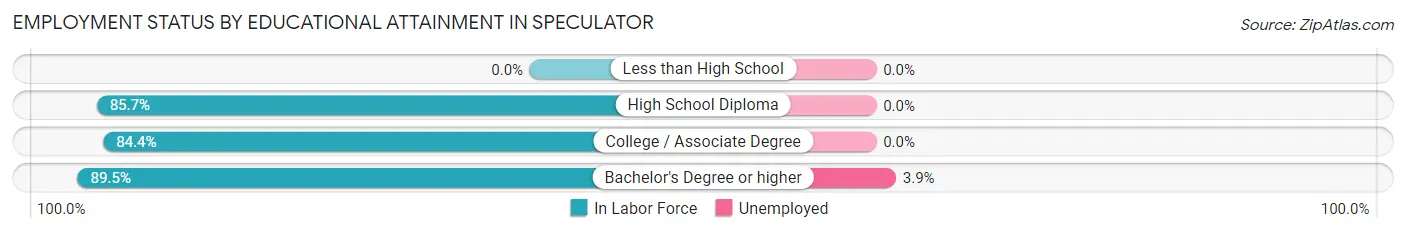
| Educational Attainment | In Labor Force | Unemployed |
| Less than High School | 0 (0.0%) | 0 (0.0%) |
| High School Diploma | 12 (85.7%) | 0 (0.0%) |
| College / Associate Degree | 65 (84.4%) | 0 (0.0%) |
| Bachelor's Degree or higher | 51 (89.5%) | 2 (3.9%) |
| Total | 128 (84.8%) | 2 (1.6%) |
Employment Occupations by Sex in Speculator
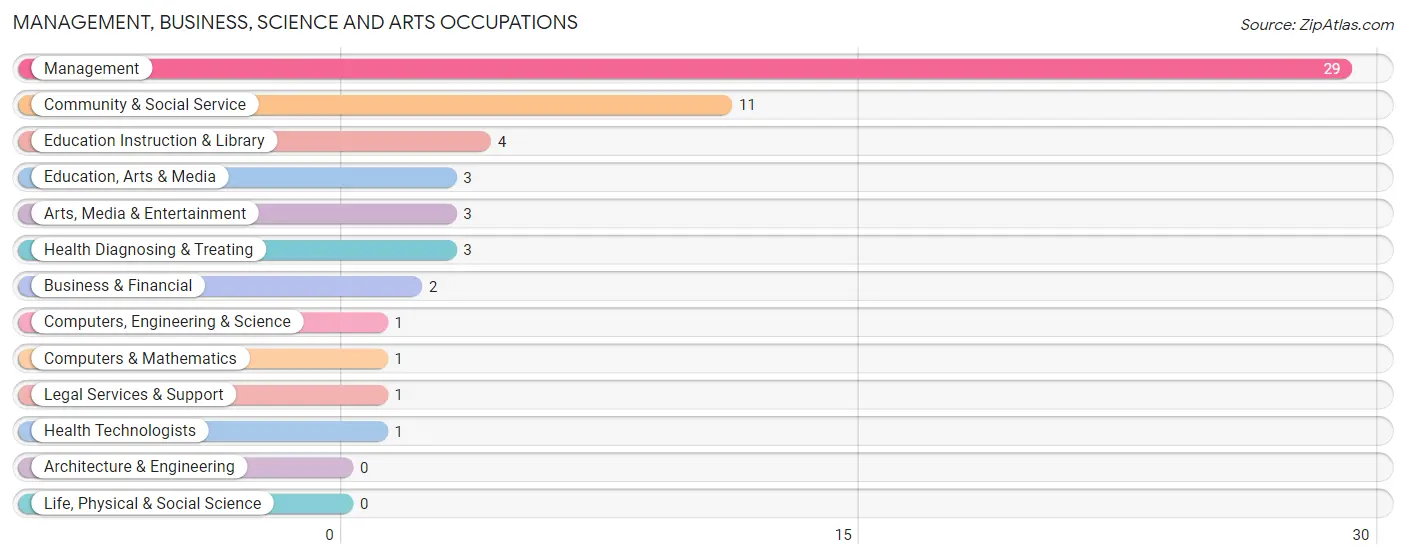
Management, Business, Science and Arts Occupations
The most common Management, Business, Science and Arts occupations in Speculator are Management (29 | 18.0%), Community & Social Service (11 | 6.8%), Education Instruction & Library (4 | 2.5%), Education, Arts & Media (3 | 1.9%), and Arts, Media & Entertainment (3 | 1.9%).
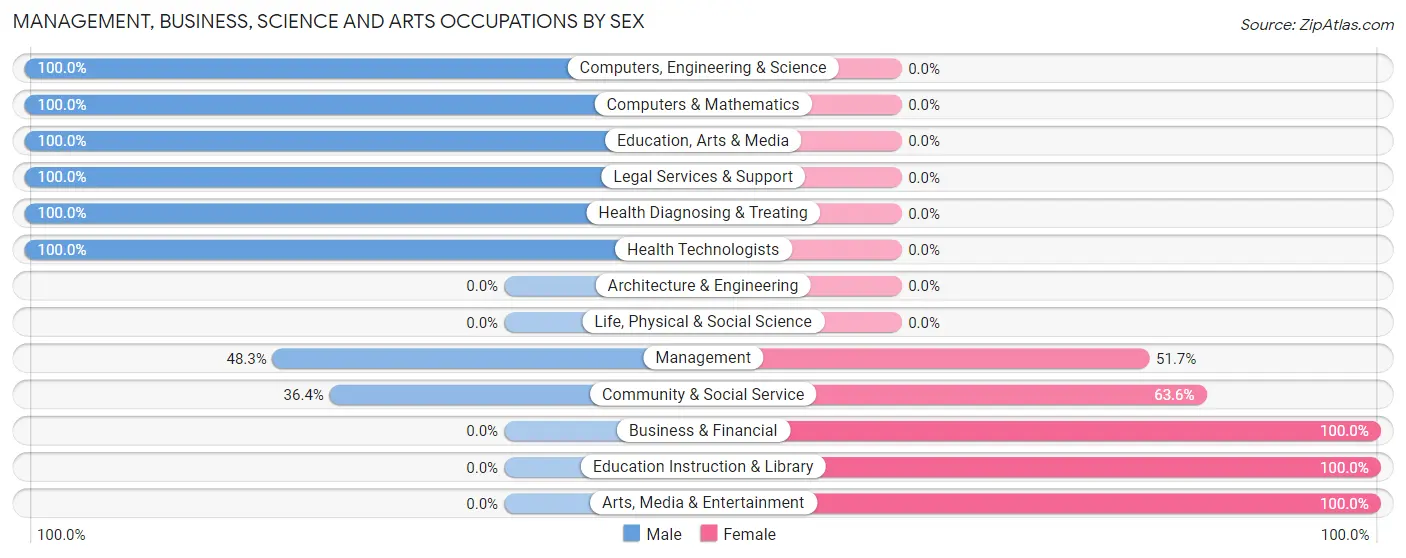
Management, Business, Science and Arts Occupations by Sex
Within the Management, Business, Science and Arts occupations in Speculator, the most male-oriented occupations are Computers, Engineering & Science (100.0%), Computers & Mathematics (100.0%), and Education, Arts & Media (100.0%), while the most female-oriented occupations are Business & Financial (100.0%), Education Instruction & Library (100.0%), and Arts, Media & Entertainment (100.0%).
| Occupation | Male | Female |
| Management | 14 (48.3%) | 15 (51.7%) |
| Business & Financial | 0 (0.0%) | 2 (100.0%) |
| Computers, Engineering & Science | 1 (100.0%) | 0 (0.0%) |
| Computers & Mathematics | 1 (100.0%) | 0 (0.0%) |
| Architecture & Engineering | 0 (0.0%) | 0 (0.0%) |
| Life, Physical & Social Science | 0 (0.0%) | 0 (0.0%) |
| Community & Social Service | 4 (36.4%) | 7 (63.6%) |
| Education, Arts & Media | 3 (100.0%) | 0 (0.0%) |
| Legal Services & Support | 1 (100.0%) | 0 (0.0%) |
| Education Instruction & Library | 0 (0.0%) | 4 (100.0%) |
| Arts, Media & Entertainment | 0 (0.0%) | 3 (100.0%) |
| Health Diagnosing & Treating | 3 (100.0%) | 0 (0.0%) |
| Health Technologists | 1 (100.0%) | 0 (0.0%) |
| Total (Category) | 22 (47.8%) | 24 (52.2%) |
| Total (Overall) | 92 (57.1%) | 69 (42.9%) |
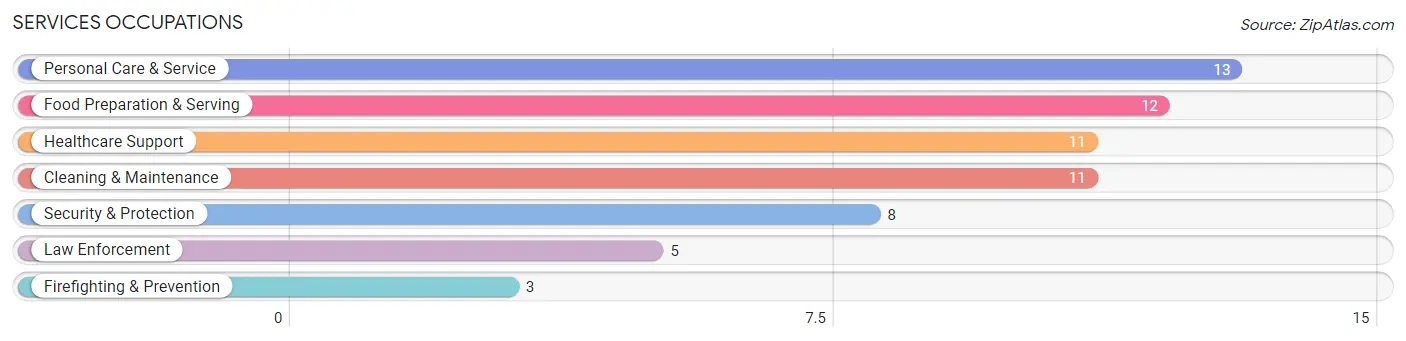
Services Occupations
The most common Services occupations in Speculator are Personal Care & Service (13 | 8.1%), Food Preparation & Serving (12 | 7.4%), Healthcare Support (11 | 6.8%), Cleaning & Maintenance (11 | 6.8%), and Security & Protection (8 | 5.0%).
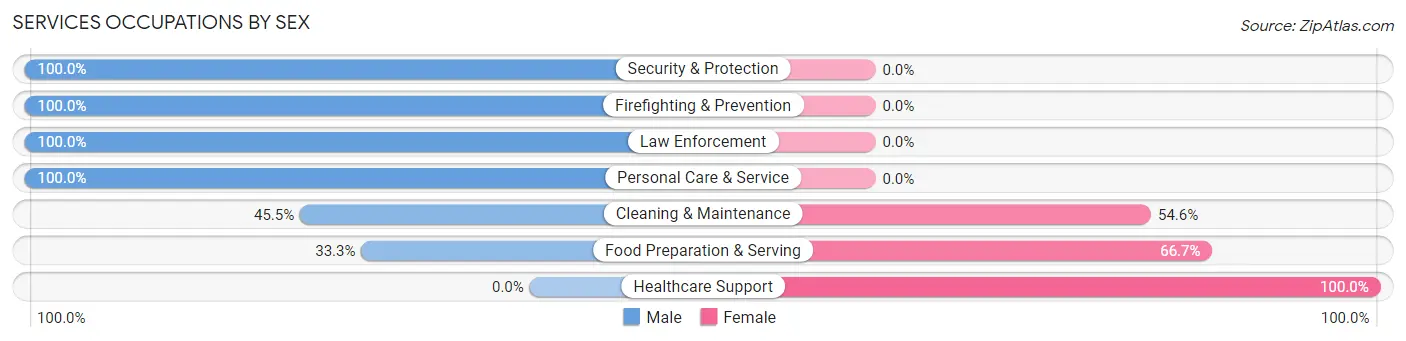
Services Occupations by Sex
Within the Services occupations in Speculator, the most male-oriented occupations are Security & Protection (100.0%), Firefighting & Prevention (100.0%), and Law Enforcement (100.0%), while the most female-oriented occupations are Healthcare Support (100.0%), Food Preparation & Serving (66.7%), and Cleaning & Maintenance (54.5%).
| Occupation | Male | Female |
| Healthcare Support | 0 (0.0%) | 11 (100.0%) |
| Security & Protection | 8 (100.0%) | 0 (0.0%) |
| Firefighting & Prevention | 3 (100.0%) | 0 (0.0%) |
| Law Enforcement | 5 (100.0%) | 0 (0.0%) |
| Food Preparation & Serving | 4 (33.3%) | 8 (66.7%) |
| Cleaning & Maintenance | 5 (45.5%) | 6 (54.5%) |
| Personal Care & Service | 13 (100.0%) | 0 (0.0%) |
| Total (Category) | 30 (54.5%) | 25 (45.5%) |
| Total (Overall) | 92 (57.1%) | 69 (42.9%) |
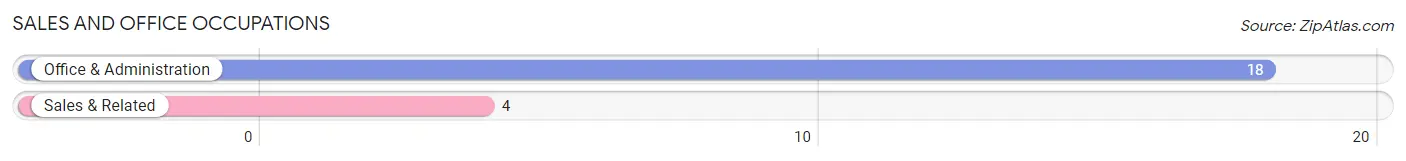
Sales and Office Occupations
The most common Sales and Office occupations in Speculator are Office & Administration (18 | 11.2%), and Sales & Related (4 | 2.5%).
Sales and Office Occupations by Sex
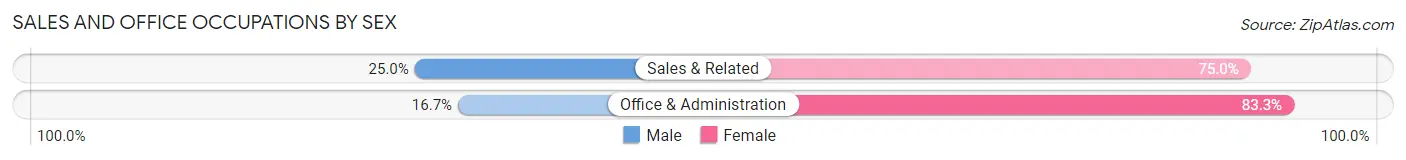
| Occupation | Male | Female |
| Sales & Related | 1 (25.0%) | 3 (75.0%) |
| Office & Administration | 3 (16.7%) | 15 (83.3%) |
| Total (Category) | 4 (18.2%) | 18 (81.8%) |
| Total (Overall) | 92 (57.1%) | 69 (42.9%) |
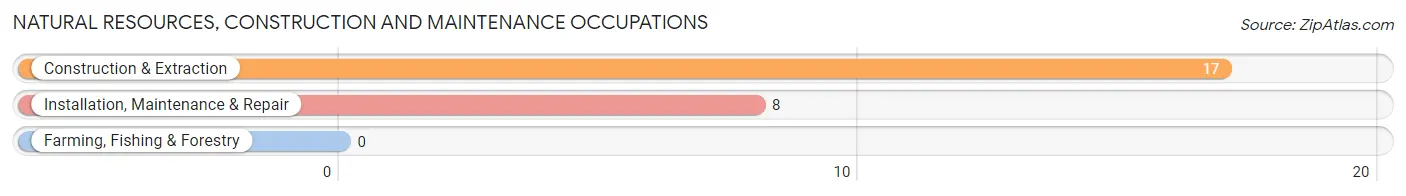
Natural Resources, Construction and Maintenance Occupations
The most common Natural Resources, Construction and Maintenance occupations in Speculator are Construction & Extraction (17 | 10.6%), and Installation, Maintenance & Repair (8 | 5.0%).
Natural Resources, Construction and Maintenance Occupations by Sex
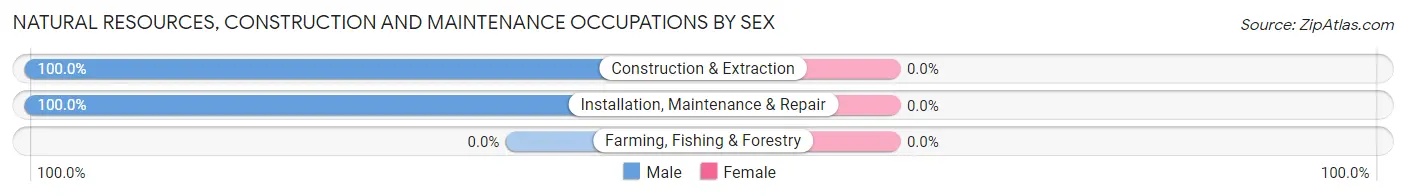
| Occupation | Male | Female |
| Farming, Fishing & Forestry | 0 (0.0%) | 0 (0.0%) |
| Construction & Extraction | 17 (100.0%) | 0 (0.0%) |
| Installation, Maintenance & Repair | 8 (100.0%) | 0 (0.0%) |
| Total (Category) | 25 (100.0%) | 0 (0.0%) |
| Total (Overall) | 92 (57.1%) | 69 (42.9%) |
Production, Transportation and Moving Occupations
The most common Production, Transportation and Moving occupations in Speculator are Production (12 | 7.4%), and Transportation (1 | 0.6%).
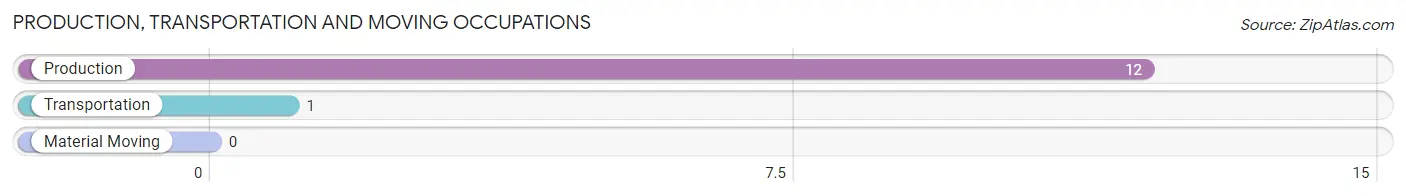
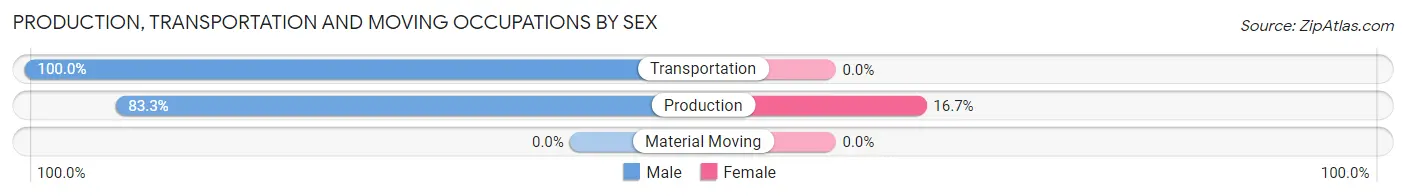
Production, Transportation and Moving Occupations by Sex
| Occupation | Male | Female |
| Production | 10 (83.3%) | 2 (16.7%) |
| Transportation | 1 (100.0%) | 0 (0.0%) |
| Material Moving | 0 (0.0%) | 0 (0.0%) |
| Total (Category) | 11 (84.6%) | 2 (15.4%) |
| Total (Overall) | 92 (57.1%) | 69 (42.9%) |
Employment Industries by Sex in Speculator
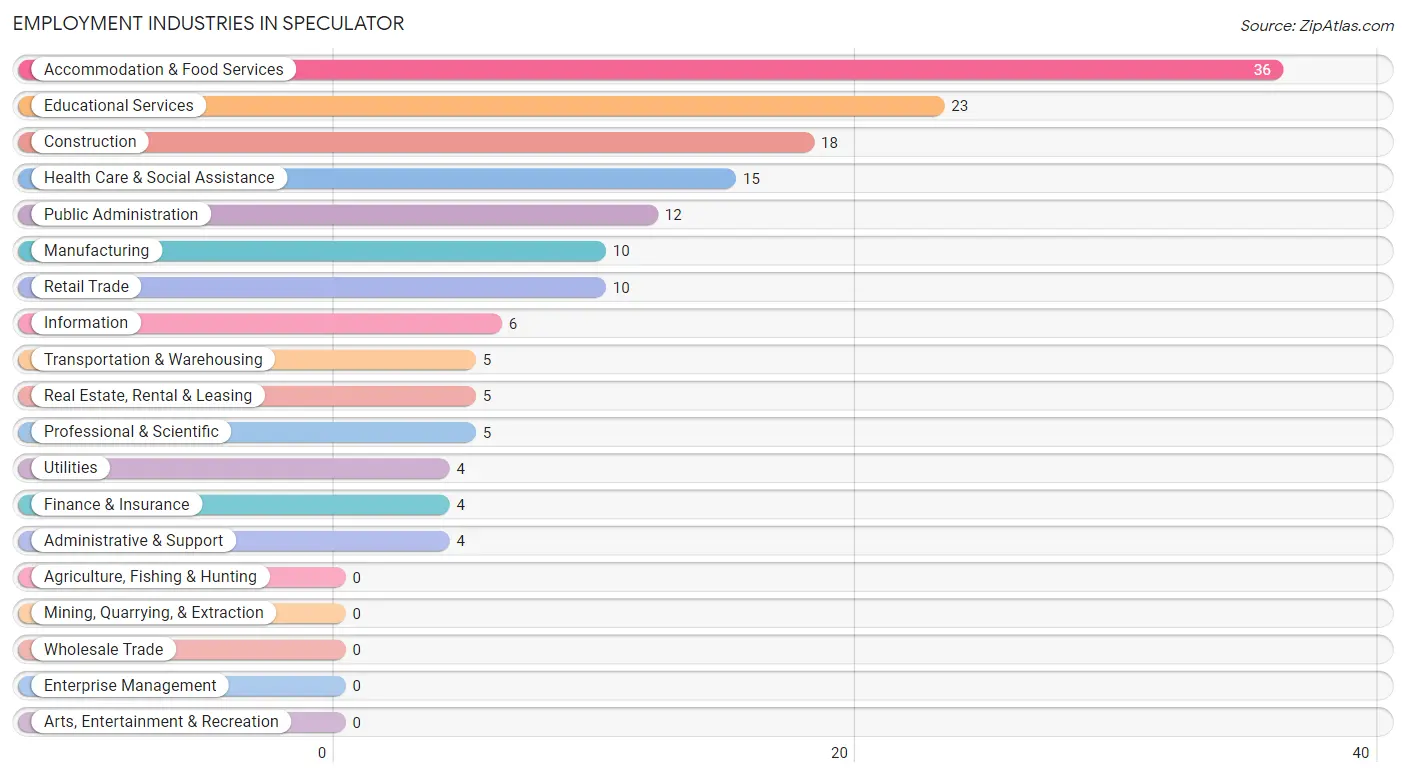
Employment Industries in Speculator
The major employment industries in Speculator include Accommodation & Food Services (36 | 22.4%), Educational Services (23 | 14.3%), Construction (18 | 11.2%), Health Care & Social Assistance (15 | 9.3%), and Public Administration (12 | 7.4%).
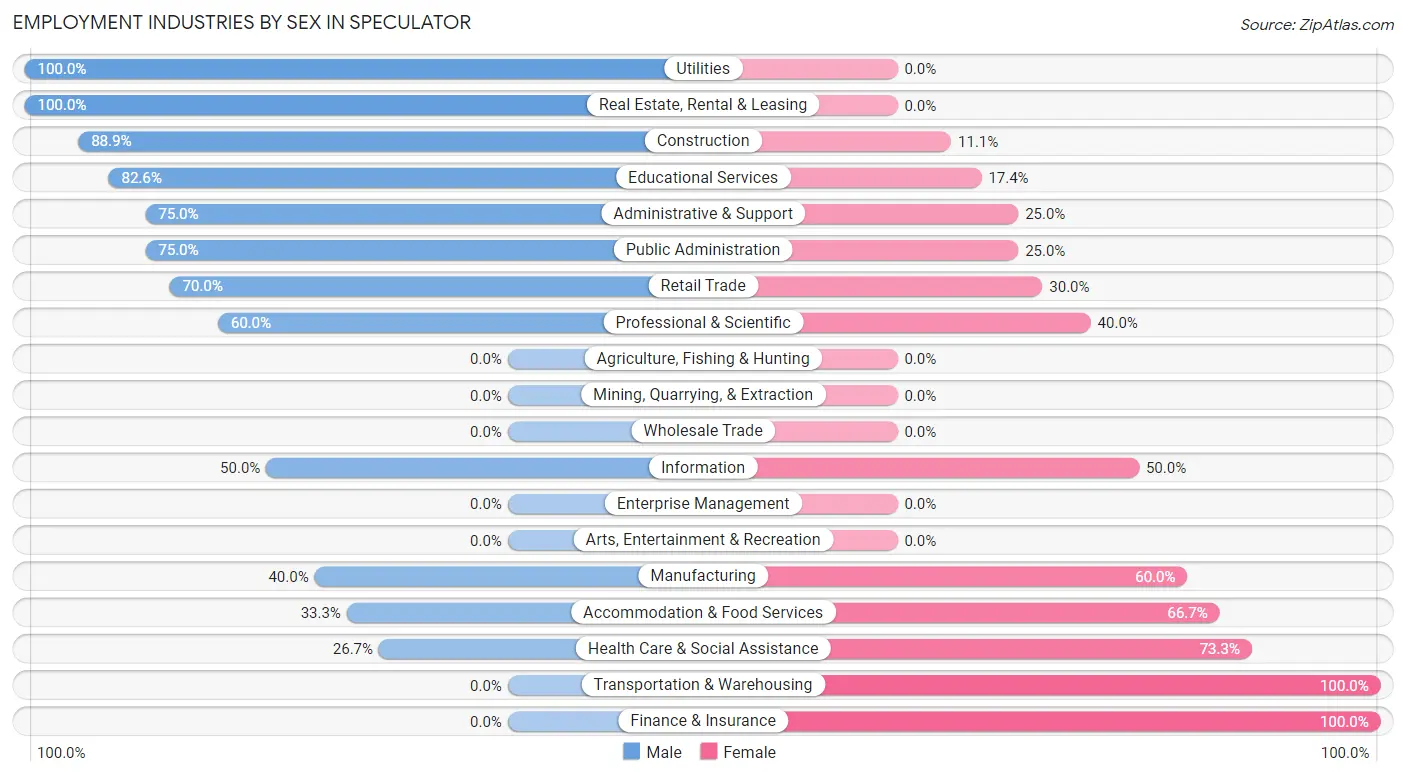
Employment Industries by Sex in Speculator
The Speculator industries that see more men than women are Utilities (100.0%), Real Estate, Rental & Leasing (100.0%), and Construction (88.9%), whereas the industries that tend to have a higher number of women are Transportation & Warehousing (100.0%), Finance & Insurance (100.0%), and Health Care & Social Assistance (73.3%).
| Industry | Male | Female |
| Agriculture, Fishing & Hunting | 0 (0.0%) | 0 (0.0%) |
| Mining, Quarrying, & Extraction | 0 (0.0%) | 0 (0.0%) |
| Construction | 16 (88.9%) | 2 (11.1%) |
| Manufacturing | 4 (40.0%) | 6 (60.0%) |
| Wholesale Trade | 0 (0.0%) | 0 (0.0%) |
| Retail Trade | 7 (70.0%) | 3 (30.0%) |
| Transportation & Warehousing | 0 (0.0%) | 5 (100.0%) |
| Utilities | 4 (100.0%) | 0 (0.0%) |
| Information | 3 (50.0%) | 3 (50.0%) |
| Finance & Insurance | 0 (0.0%) | 4 (100.0%) |
| Real Estate, Rental & Leasing | 5 (100.0%) | 0 (0.0%) |
| Professional & Scientific | 3 (60.0%) | 2 (40.0%) |
| Enterprise Management | 0 (0.0%) | 0 (0.0%) |
| Administrative & Support | 3 (75.0%) | 1 (25.0%) |
| Educational Services | 19 (82.6%) | 4 (17.4%) |
| Health Care & Social Assistance | 4 (26.7%) | 11 (73.3%) |
| Arts, Entertainment & Recreation | 0 (0.0%) | 0 (0.0%) |
| Accommodation & Food Services | 12 (33.3%) | 24 (66.7%) |
| Public Administration | 9 (75.0%) | 3 (25.0%) |
| Total | 92 (57.1%) | 69 (42.9%) |
Education in Speculator
School Enrollment in Speculator
The most common levels of schooling among the 65 students in Speculator are college / undergraduate (29 | 44.6%), elementary school (12 | 18.5%), and high school (10 | 15.4%).
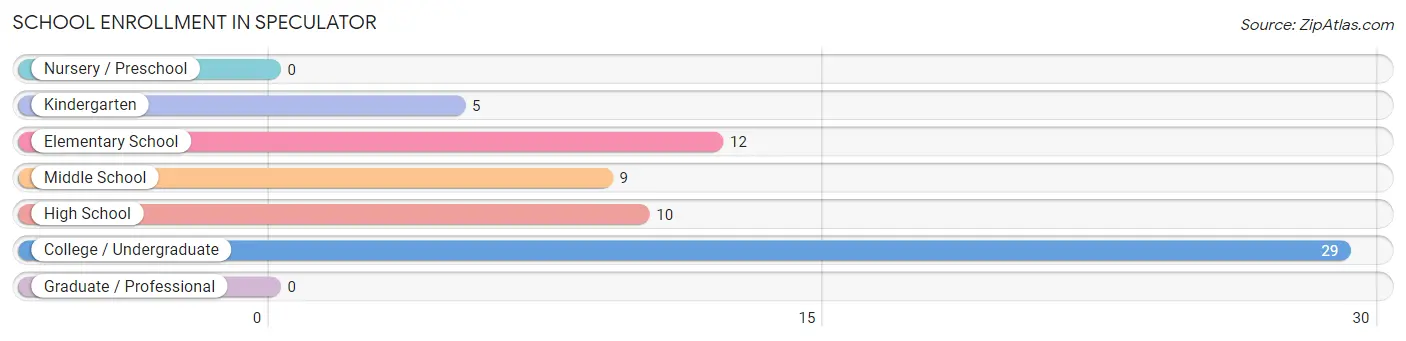
| School Level | # Students | % Students |
| Nursery / Preschool | 0 | 0.0% |
| Kindergarten | 5 | 7.7% |
| Elementary School | 12 | 18.5% |
| Middle School | 9 | 13.9% |
| High School | 10 | 15.4% |
| College / Undergraduate | 29 | 44.6% |
| Graduate / Professional | 0 | 0.0% |
| Total | 65 | 100.0% |
School Enrollment by Age by Funding Source in Speculator
Out of a total of 65 students who are enrolled in schools in Speculator, 26 (40.0%) attend a private institution, while the remaining 39 (60.0%) are enrolled in public schools. The age group of 20 to 24 year olds has the highest likelihood of being enrolled in private schools, with 13 (61.9% in the age bracket) enrolled. Conversely, the age group of 35 years and over has the lowest likelihood of being enrolled in a private school, with 2 (100.0% in the age bracket) attending a public institution.
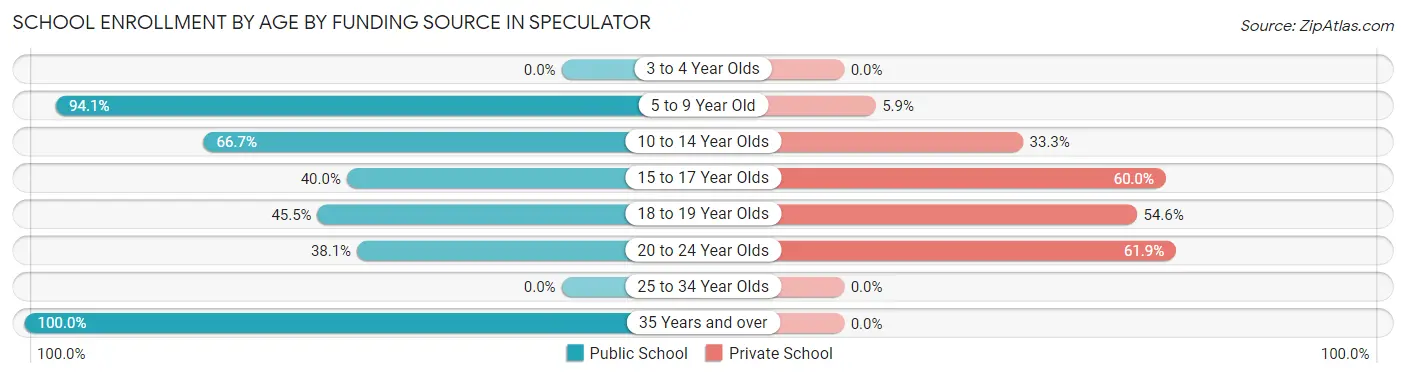
| Age Bracket | Public School | Private School |
| 3 to 4 Year Olds | 0 (0.0%) | 0 (0.0%) |
| 5 to 9 Year Old | 16 (94.1%) | 1 (5.9%) |
| 10 to 14 Year Olds | 6 (66.7%) | 3 (33.3%) |
| 15 to 17 Year Olds | 2 (40.0%) | 3 (60.0%) |
| 18 to 19 Year Olds | 5 (45.5%) | 6 (54.5%) |
| 20 to 24 Year Olds | 8 (38.1%) | 13 (61.9%) |
| 25 to 34 Year Olds | 0 (0.0%) | 0 (0.0%) |
| 35 Years and over | 2 (100.0%) | 0 (0.0%) |
| Total | 39 (60.0%) | 26 (40.0%) |
Educational Attainment by Field of Study in Speculator
Education (54 | 41.9%), literature & languages (21 | 16.3%), liberal arts & history (12 | 9.3%), bio, nature & agricultural (8 | 6.2%), and engineering (8 | 6.2%) are the most common fields of study among 129 individuals in Speculator who have obtained a bachelor's degree or higher.
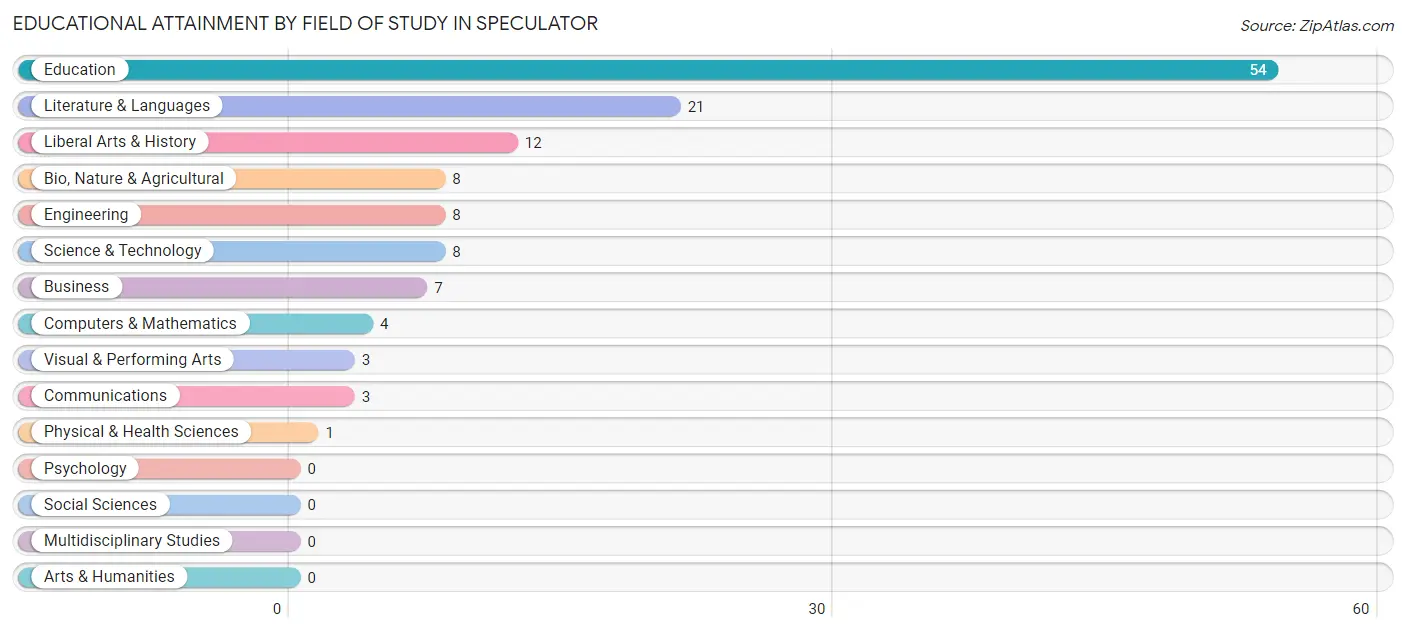
| Field of Study | # Graduates | % Graduates |
| Computers & Mathematics | 4 | 3.1% |
| Bio, Nature & Agricultural | 8 | 6.2% |
| Physical & Health Sciences | 1 | 0.8% |
| Psychology | 0 | 0.0% |
| Social Sciences | 0 | 0.0% |
| Engineering | 8 | 6.2% |
| Multidisciplinary Studies | 0 | 0.0% |
| Science & Technology | 8 | 6.2% |
| Business | 7 | 5.4% |
| Education | 54 | 41.9% |
| Literature & Languages | 21 | 16.3% |
| Liberal Arts & History | 12 | 9.3% |
| Visual & Performing Arts | 3 | 2.3% |
| Communications | 3 | 2.3% |
| Arts & Humanities | 0 | 0.0% |
| Total | 129 | 100.0% |
Transportation & Commute in Speculator
Vehicle Availability by Sex in Speculator
The most prevalent vehicle ownership categories in Speculator are males with 2 vehicles (43, accounting for 46.7%) and females with 2 vehicles (35, making up 62.3%).
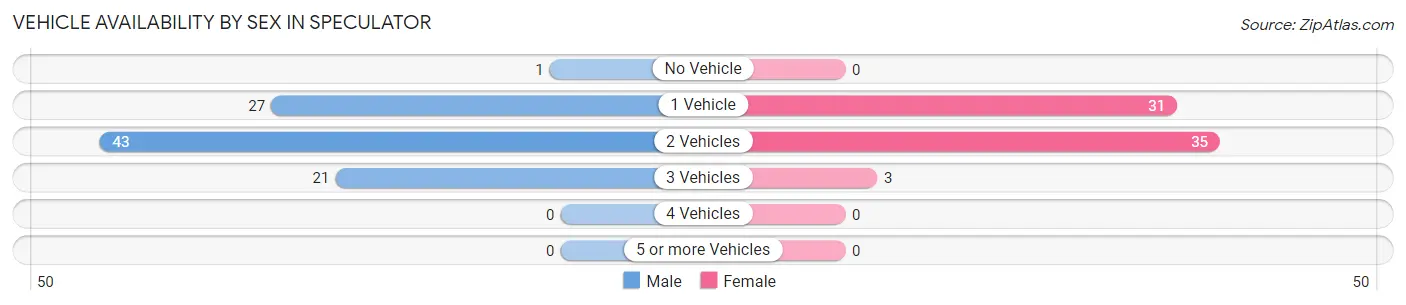
| Vehicles Available | Male | Female |
| No Vehicle | 1 (1.1%) | 0 (0.0%) |
| 1 Vehicle | 27 (29.3%) | 31 (44.9%) |
| 2 Vehicles | 43 (46.7%) | 35 (50.7%) |
| 3 Vehicles | 21 (22.8%) | 3 (4.3%) |
| 4 Vehicles | 0 (0.0%) | 0 (0.0%) |
| 5 or more Vehicles | 0 (0.0%) | 0 (0.0%) |
| Total | 92 (100.0%) | 69 (100.0%) |
Commute Time in Speculator
The most frequently occuring commute durations in Speculator are 5 to 9 minutes (52 commuters, 33.3%), less than 5 minutes (48 commuters, 30.8%), and 45 to 59 minutes (13 commuters, 8.3%).
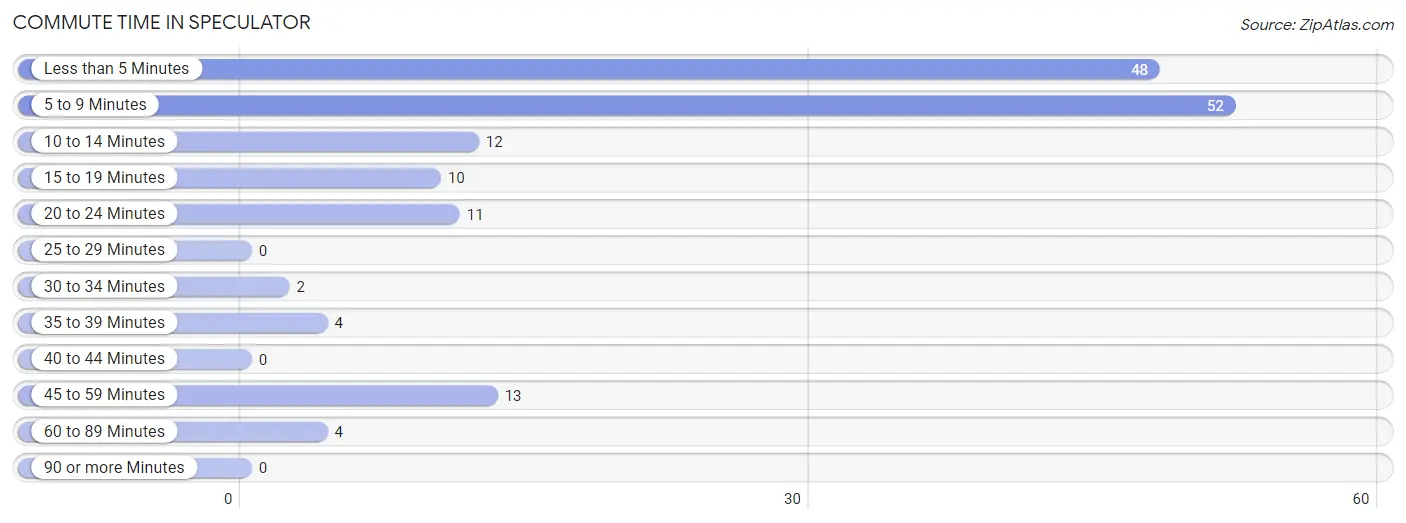
| Commute Time | # Commuters | % Commuters |
| Less than 5 Minutes | 48 | 30.8% |
| 5 to 9 Minutes | 52 | 33.3% |
| 10 to 14 Minutes | 12 | 7.7% |
| 15 to 19 Minutes | 10 | 6.4% |
| 20 to 24 Minutes | 11 | 7.0% |
| 25 to 29 Minutes | 0 | 0.0% |
| 30 to 34 Minutes | 2 | 1.3% |
| 35 to 39 Minutes | 4 | 2.6% |
| 40 to 44 Minutes | 0 | 0.0% |
| 45 to 59 Minutes | 13 | 8.3% |
| 60 to 89 Minutes | 4 | 2.6% |
| 90 or more Minutes | 0 | 0.0% |
Commute Time by Sex in Speculator
The most common commute times in Speculator are 5 to 9 minutes (25 commuters, 28.1%) for males and 5 to 9 minutes (27 commuters, 40.3%) for females.
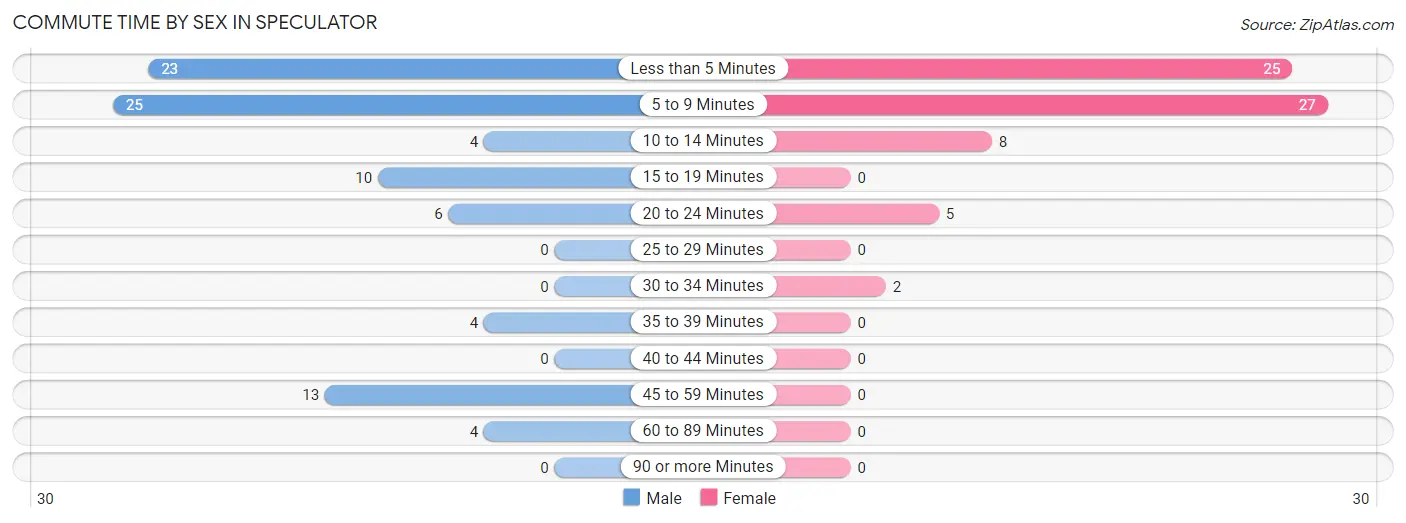
| Commute Time | Male | Female |
| Less than 5 Minutes | 23 (25.8%) | 25 (37.3%) |
| 5 to 9 Minutes | 25 (28.1%) | 27 (40.3%) |
| 10 to 14 Minutes | 4 (4.5%) | 8 (11.9%) |
| 15 to 19 Minutes | 10 (11.2%) | 0 (0.0%) |
| 20 to 24 Minutes | 6 (6.7%) | 5 (7.5%) |
| 25 to 29 Minutes | 0 (0.0%) | 0 (0.0%) |
| 30 to 34 Minutes | 0 (0.0%) | 2 (3.0%) |
| 35 to 39 Minutes | 4 (4.5%) | 0 (0.0%) |
| 40 to 44 Minutes | 0 (0.0%) | 0 (0.0%) |
| 45 to 59 Minutes | 13 (14.6%) | 0 (0.0%) |
| 60 to 89 Minutes | 4 (4.5%) | 0 (0.0%) |
| 90 or more Minutes | 0 (0.0%) | 0 (0.0%) |
Time of Departure to Work by Sex in Speculator
The most frequent times of departure to work in Speculator are 7:30 AM to 7:59 AM (19, 21.3%) for males and 7:00 AM to 7:29 AM (16, 23.9%) for females.
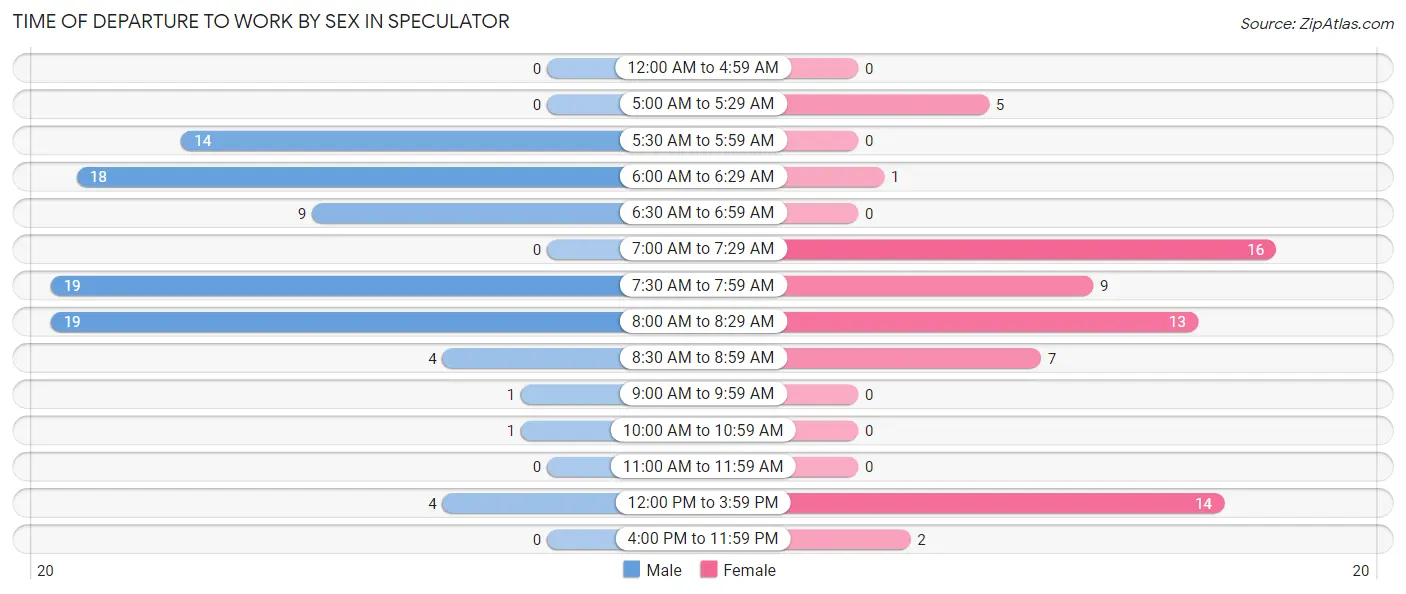
| Time of Departure | Male | Female |
| 12:00 AM to 4:59 AM | 0 (0.0%) | 0 (0.0%) |
| 5:00 AM to 5:29 AM | 0 (0.0%) | 5 (7.5%) |
| 5:30 AM to 5:59 AM | 14 (15.7%) | 0 (0.0%) |
| 6:00 AM to 6:29 AM | 18 (20.2%) | 1 (1.5%) |
| 6:30 AM to 6:59 AM | 9 (10.1%) | 0 (0.0%) |
| 7:00 AM to 7:29 AM | 0 (0.0%) | 16 (23.9%) |
| 7:30 AM to 7:59 AM | 19 (21.3%) | 9 (13.4%) |
| 8:00 AM to 8:29 AM | 19 (21.3%) | 13 (19.4%) |
| 8:30 AM to 8:59 AM | 4 (4.5%) | 7 (10.4%) |
| 9:00 AM to 9:59 AM | 1 (1.1%) | 0 (0.0%) |
| 10:00 AM to 10:59 AM | 1 (1.1%) | 0 (0.0%) |
| 11:00 AM to 11:59 AM | 0 (0.0%) | 0 (0.0%) |
| 12:00 PM to 3:59 PM | 4 (4.5%) | 14 (20.9%) |
| 4:00 PM to 11:59 PM | 0 (0.0%) | 2 (3.0%) |
| Total | 89 (100.0%) | 67 (100.0%) |
Housing Occupancy in Speculator
Occupancy by Ownership in Speculator
Of the total 116 dwellings in Speculator, owner-occupied units account for 76 (65.5%), while renter-occupied units make up 40 (34.5%).
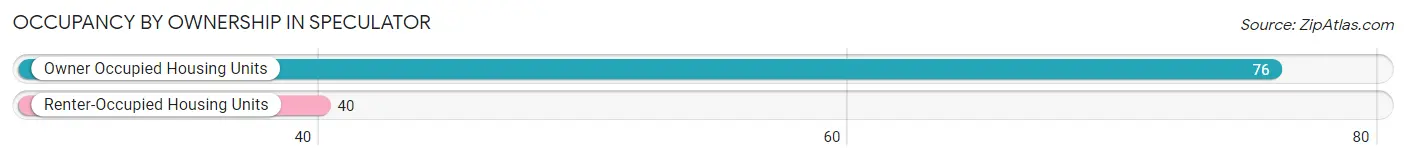
| Occupancy | # Housing Units | % Housing Units |
| Owner Occupied Housing Units | 76 | 65.5% |
| Renter-Occupied Housing Units | 40 | 34.5% |
| Total Occupied Housing Units | 116 | 100.0% |
Occupancy by Household Size in Speculator
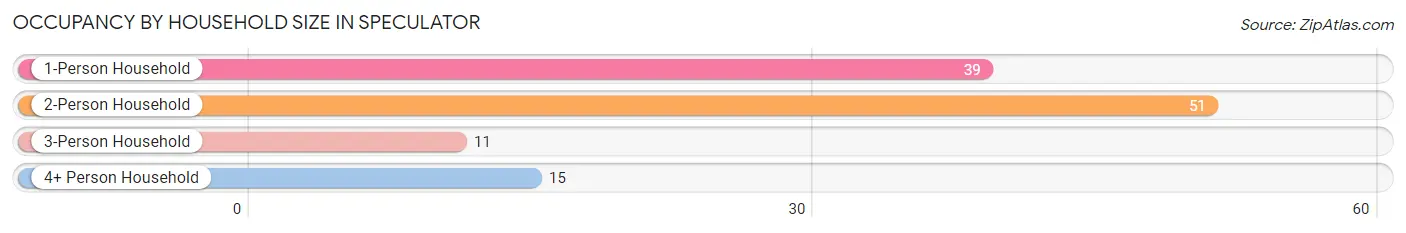
| Household Size | # Housing Units | % Housing Units |
| 1-Person Household | 39 | 33.6% |
| 2-Person Household | 51 | 44.0% |
| 3-Person Household | 11 | 9.5% |
| 4+ Person Household | 15 | 12.9% |
| Total Housing Units | 116 | 100.0% |
Occupancy by Ownership by Household Size in Speculator
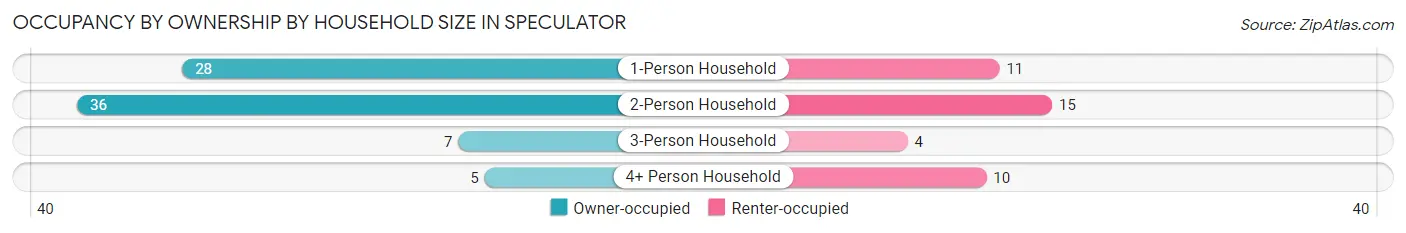
| Household Size | Owner-occupied | Renter-occupied |
| 1-Person Household | 28 (71.8%) | 11 (28.2%) |
| 2-Person Household | 36 (70.6%) | 15 (29.4%) |
| 3-Person Household | 7 (63.6%) | 4 (36.4%) |
| 4+ Person Household | 5 (33.3%) | 10 (66.7%) |
| Total Housing Units | 76 (65.5%) | 40 (34.5%) |
Occupancy by Educational Attainment in Speculator
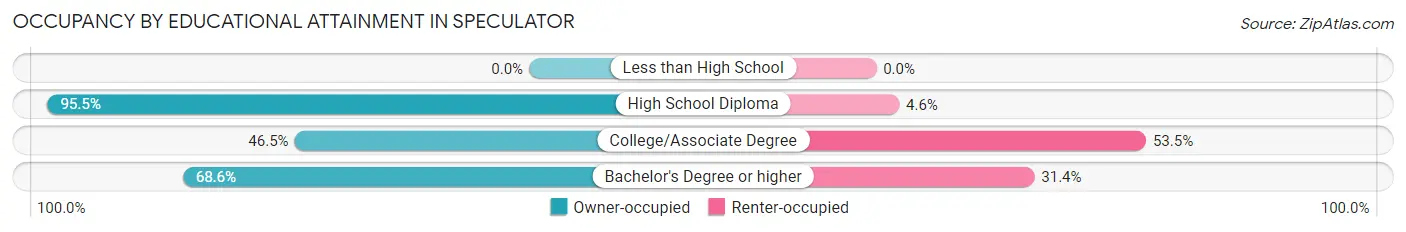
| Household Size | Owner-occupied | Renter-occupied |
| Less than High School | 0 (0.0%) | 0 (0.0%) |
| High School Diploma | 21 (95.5%) | 1 (4.5%) |
| College/Associate Degree | 20 (46.5%) | 23 (53.5%) |
| Bachelor's Degree or higher | 35 (68.6%) | 16 (31.4%) |
Occupancy by Age of Householder in Speculator
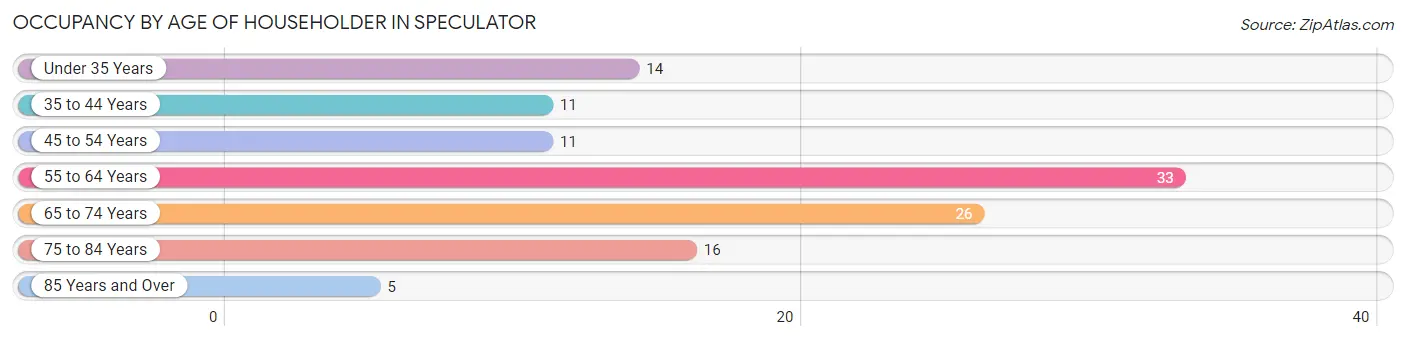
| Age Bracket | # Households | % Households |
| Under 35 Years | 14 | 12.1% |
| 35 to 44 Years | 11 | 9.5% |
| 45 to 54 Years | 11 | 9.5% |
| 55 to 64 Years | 33 | 28.4% |
| 65 to 74 Years | 26 | 22.4% |
| 75 to 84 Years | 16 | 13.8% |
| 85 Years and Over | 5 | 4.3% |
| Total | 116 | 100.0% |
Housing Finances in Speculator
Median Income by Occupancy in Speculator
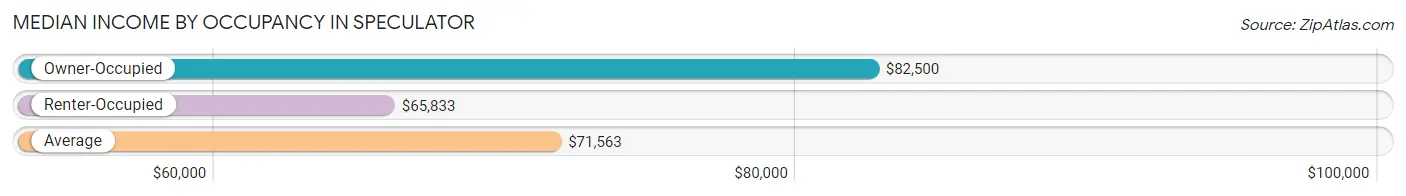
| Occupancy Type | # Households | Median Income |
| Owner-Occupied | 76 (65.5%) | $82,500 |
| Renter-Occupied | 40 (34.5%) | $65,833 |
| Average | 116 (100.0%) | $71,563 |
Occupancy by Householder Income Bracket in Speculator
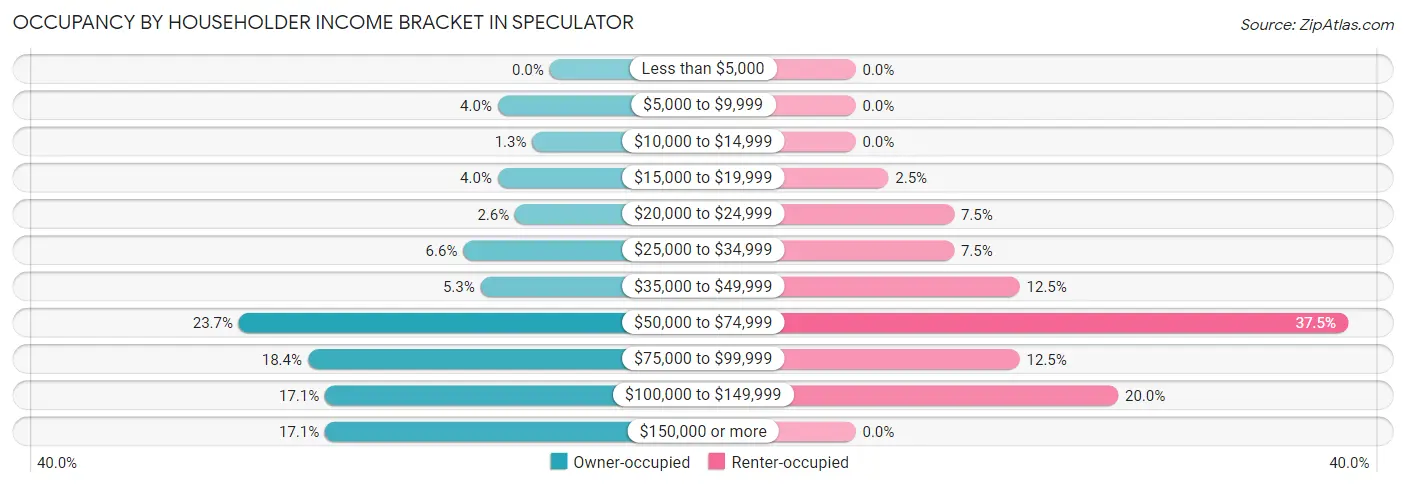
| Income Bracket | Owner-occupied | Renter-occupied |
| Less than $5,000 | 0 (0.0%) | 0 (0.0%) |
| $5,000 to $9,999 | 3 (4.0%) | 0 (0.0%) |
| $10,000 to $14,999 | 1 (1.3%) | 0 (0.0%) |
| $15,000 to $19,999 | 3 (4.0%) | 1 (2.5%) |
| $20,000 to $24,999 | 2 (2.6%) | 3 (7.5%) |
| $25,000 to $34,999 | 5 (6.6%) | 3 (7.5%) |
| $35,000 to $49,999 | 4 (5.3%) | 5 (12.5%) |
| $50,000 to $74,999 | 18 (23.7%) | 15 (37.5%) |
| $75,000 to $99,999 | 14 (18.4%) | 5 (12.5%) |
| $100,000 to $149,999 | 13 (17.1%) | 8 (20.0%) |
| $150,000 or more | 13 (17.1%) | 0 (0.0%) |
| Total | 76 (100.0%) | 40 (100.0%) |
Monthly Housing Cost Tiers in Speculator
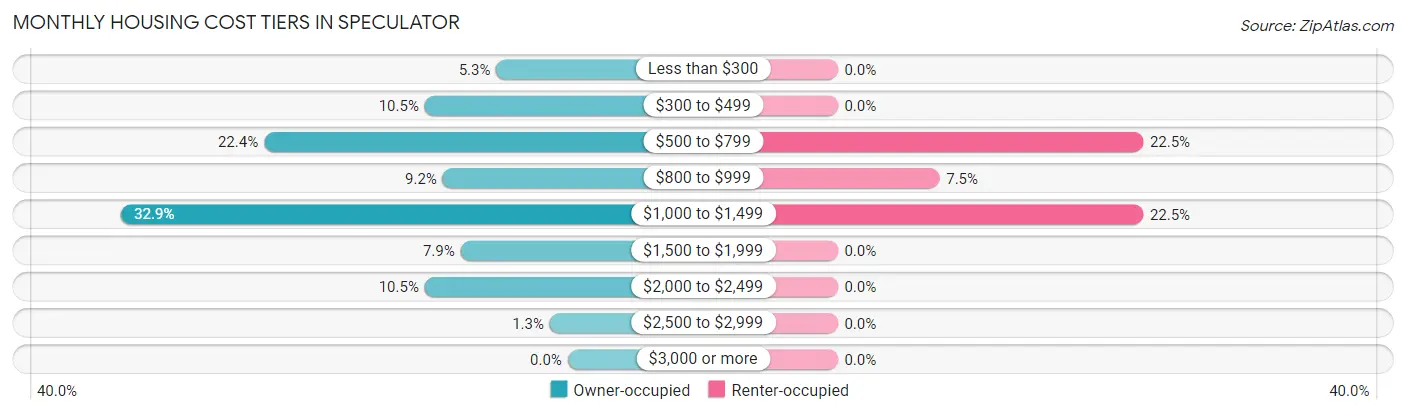
| Monthly Cost | Owner-occupied | Renter-occupied |
| Less than $300 | 4 (5.3%) | 0 (0.0%) |
| $300 to $499 | 8 (10.5%) | 0 (0.0%) |
| $500 to $799 | 17 (22.4%) | 9 (22.5%) |
| $800 to $999 | 7 (9.2%) | 3 (7.5%) |
| $1,000 to $1,499 | 25 (32.9%) | 9 (22.5%) |
| $1,500 to $1,999 | 6 (7.9%) | 0 (0.0%) |
| $2,000 to $2,499 | 8 (10.5%) | 0 (0.0%) |
| $2,500 to $2,999 | 1 (1.3%) | 0 (0.0%) |
| $3,000 or more | 0 (0.0%) | 0 (0.0%) |
| Total | 76 (100.0%) | 40 (100.0%) |
Physical Housing Characteristics in Speculator
Housing Structures in Speculator
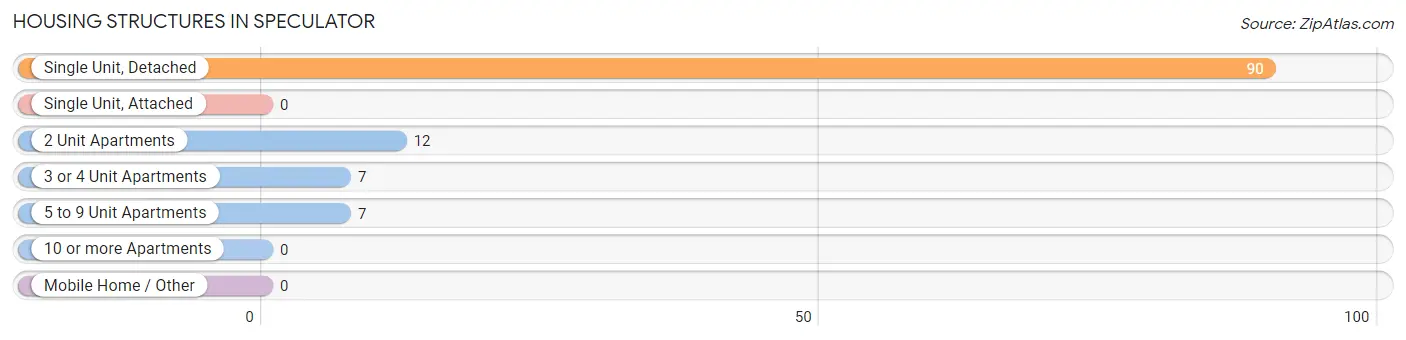
| Structure Type | # Housing Units | % Housing Units |
| Single Unit, Detached | 90 | 77.6% |
| Single Unit, Attached | 0 | 0.0% |
| 2 Unit Apartments | 12 | 10.3% |
| 3 or 4 Unit Apartments | 7 | 6.0% |
| 5 to 9 Unit Apartments | 7 | 6.0% |
| 10 or more Apartments | 0 | 0.0% |
| Mobile Home / Other | 0 | 0.0% |
| Total | 116 | 100.0% |
Housing Structures by Occupancy in Speculator
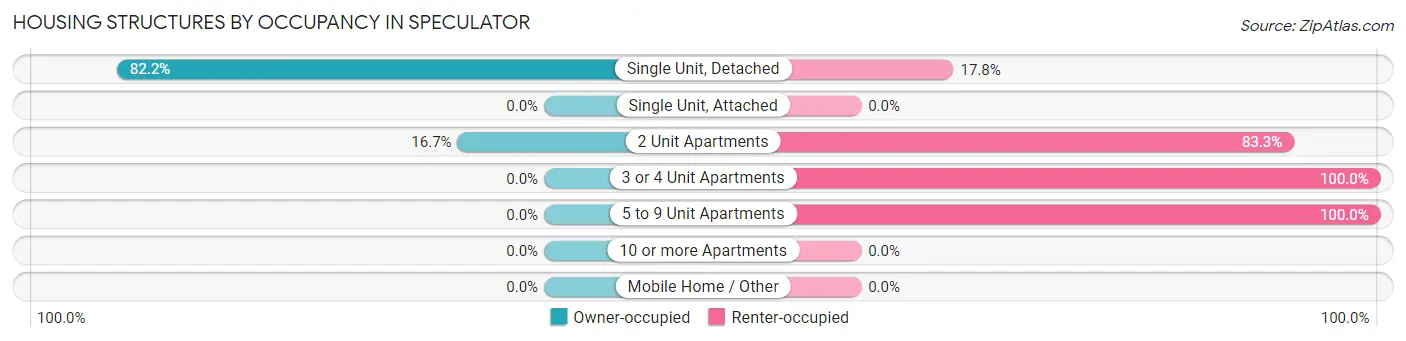
| Structure Type | Owner-occupied | Renter-occupied |
| Single Unit, Detached | 74 (82.2%) | 16 (17.8%) |
| Single Unit, Attached | 0 (0.0%) | 0 (0.0%) |
| 2 Unit Apartments | 2 (16.7%) | 10 (83.3%) |
| 3 or 4 Unit Apartments | 0 (0.0%) | 7 (100.0%) |
| 5 to 9 Unit Apartments | 0 (0.0%) | 7 (100.0%) |
| 10 or more Apartments | 0 (0.0%) | 0 (0.0%) |
| Mobile Home / Other | 0 (0.0%) | 0 (0.0%) |
| Total | 76 (65.5%) | 40 (34.5%) |
Housing Structures by Number of Rooms in Speculator
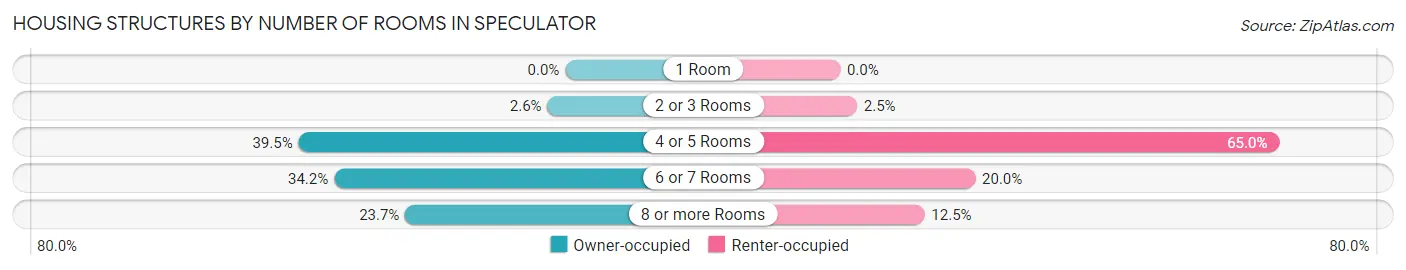
| Number of Rooms | Owner-occupied | Renter-occupied |
| 1 Room | 0 (0.0%) | 0 (0.0%) |
| 2 or 3 Rooms | 2 (2.6%) | 1 (2.5%) |
| 4 or 5 Rooms | 30 (39.5%) | 26 (65.0%) |
| 6 or 7 Rooms | 26 (34.2%) | 8 (20.0%) |
| 8 or more Rooms | 18 (23.7%) | 5 (12.5%) |
| Total | 76 (100.0%) | 40 (100.0%) |
Housing Structure by Heating Type in Speculator
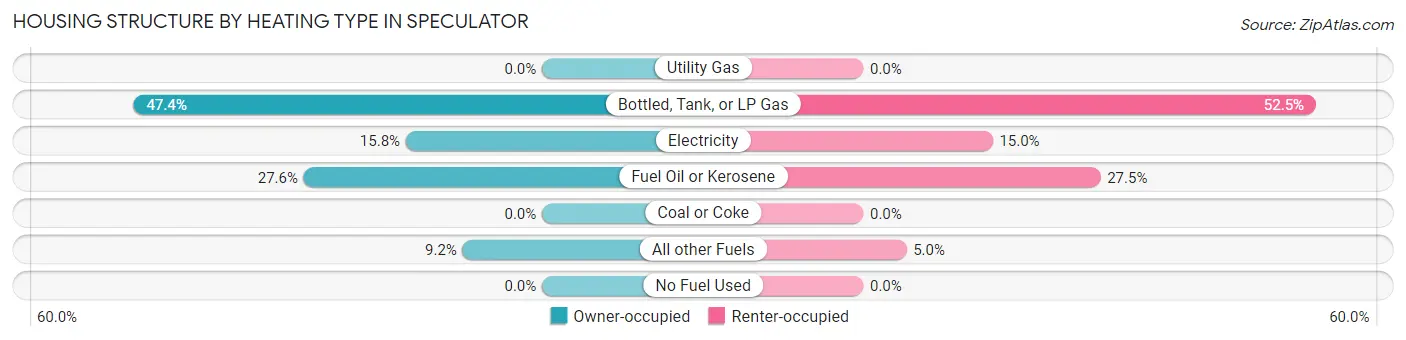
| Heating Type | Owner-occupied | Renter-occupied |
| Utility Gas | 0 (0.0%) | 0 (0.0%) |
| Bottled, Tank, or LP Gas | 36 (47.4%) | 21 (52.5%) |
| Electricity | 12 (15.8%) | 6 (15.0%) |
| Fuel Oil or Kerosene | 21 (27.6%) | 11 (27.5%) |
| Coal or Coke | 0 (0.0%) | 0 (0.0%) |
| All other Fuels | 7 (9.2%) | 2 (5.0%) |
| No Fuel Used | 0 (0.0%) | 0 (0.0%) |
| Total | 76 (100.0%) | 40 (100.0%) |
Household Vehicle Usage in Speculator
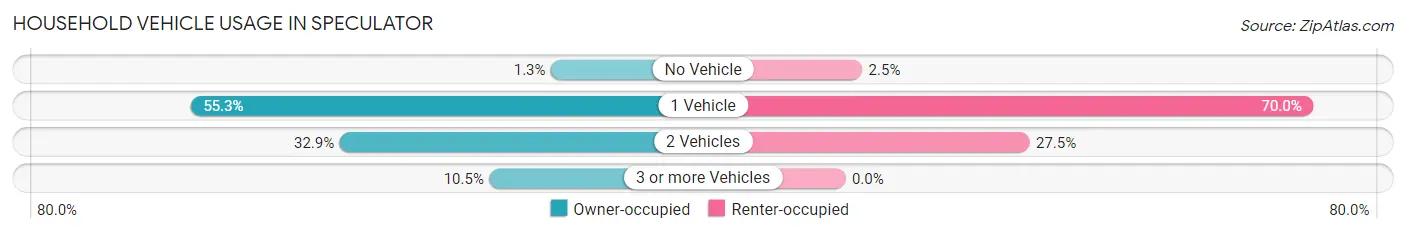
| Vehicles per Household | Owner-occupied | Renter-occupied |
| No Vehicle | 1 (1.3%) | 1 (2.5%) |
| 1 Vehicle | 42 (55.3%) | 28 (70.0%) |
| 2 Vehicles | 25 (32.9%) | 11 (27.5%) |
| 3 or more Vehicles | 8 (10.5%) | 0 (0.0%) |
| Total | 76 (100.0%) | 40 (100.0%) |
Real Estate & Mortgages in Speculator
Real Estate and Mortgage Overview in Speculator
| Characteristic | Without Mortgage | With Mortgage |
| Housing Units | 44 | 32 |
| Median Property Value | $196,900 | $162,500 |
| Median Household Income | $66,250 | $3 |
| Monthly Housing Costs | $700 | $0 |
| Real Estate Taxes | $2,833 | $0 |
Property Value by Mortgage Status in Speculator
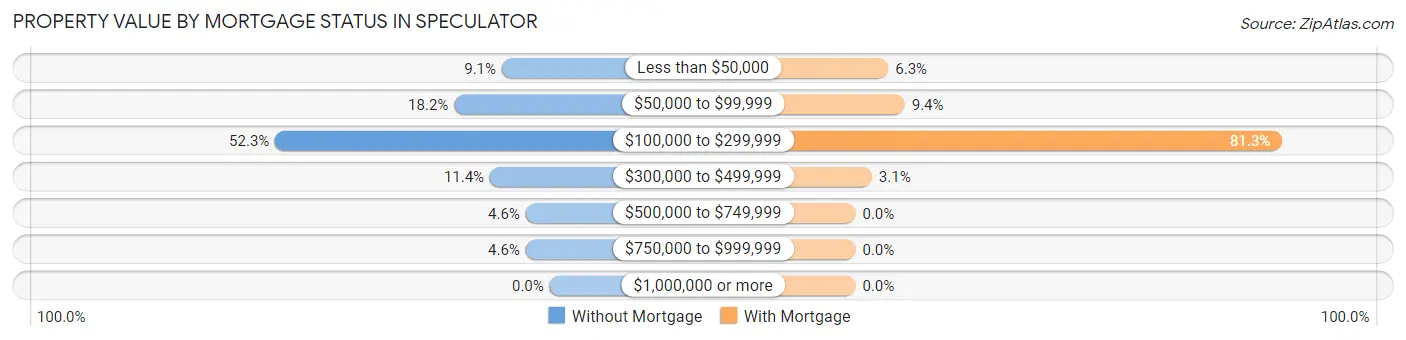
| Property Value | Without Mortgage | With Mortgage |
| Less than $50,000 | 4 (9.1%) | 2 (6.2%) |
| $50,000 to $99,999 | 8 (18.2%) | 3 (9.4%) |
| $100,000 to $299,999 | 23 (52.3%) | 26 (81.2%) |
| $300,000 to $499,999 | 5 (11.4%) | 1 (3.1%) |
| $500,000 to $749,999 | 2 (4.5%) | 0 (0.0%) |
| $750,000 to $999,999 | 2 (4.5%) | 0 (0.0%) |
| $1,000,000 or more | 0 (0.0%) | 0 (0.0%) |
| Total | 44 (100.0%) | 32 (100.0%) |
Household Income by Mortgage Status in Speculator
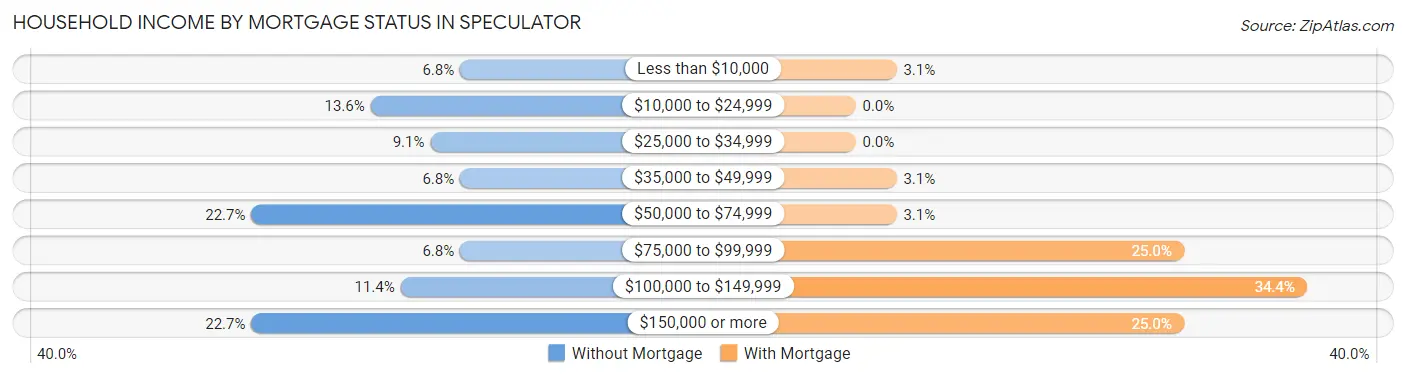
| Household Income | Without Mortgage | With Mortgage |
| Less than $10,000 | 3 (6.8%) | 1 (3.1%) |
| $10,000 to $24,999 | 6 (13.6%) | 0 (0.0%) |
| $25,000 to $34,999 | 4 (9.1%) | 0 (0.0%) |
| $35,000 to $49,999 | 3 (6.8%) | 1 (3.1%) |
| $50,000 to $74,999 | 10 (22.7%) | 1 (3.1%) |
| $75,000 to $99,999 | 3 (6.8%) | 8 (25.0%) |
| $100,000 to $149,999 | 5 (11.4%) | 11 (34.4%) |
| $150,000 or more | 10 (22.7%) | 8 (25.0%) |
| Total | 44 (100.0%) | 32 (100.0%) |
Property Value to Household Income Ratio in Speculator
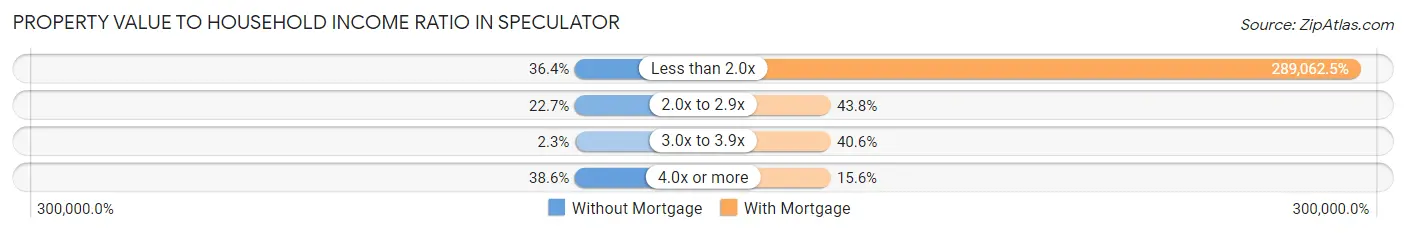
| Value-to-Income Ratio | Without Mortgage | With Mortgage |
| Less than 2.0x | 16 (36.4%) | 92,500 (289,062.5%) |
| 2.0x to 2.9x | 10 (22.7%) | 14 (43.8%) |
| 3.0x to 3.9x | 1 (2.3%) | 13 (40.6%) |
| 4.0x or more | 17 (38.6%) | 5 (15.6%) |
| Total | 44 (100.0%) | 32 (100.0%) |
Real Estate Taxes by Mortgage Status in Speculator
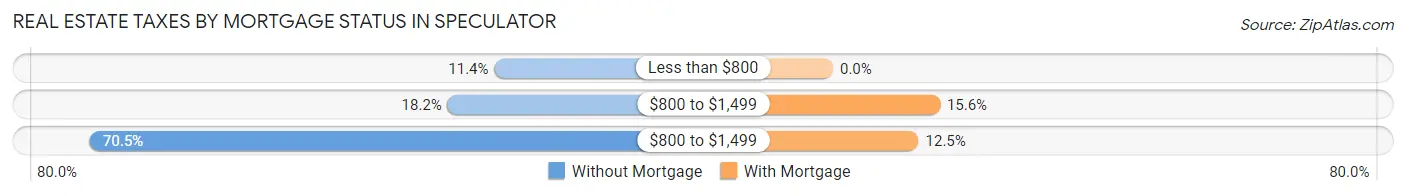
| Property Taxes | Without Mortgage | With Mortgage |
| Less than $800 | 5 (11.4%) | 0 (0.0%) |
| $800 to $1,499 | 8 (18.2%) | 5 (15.6%) |
| $800 to $1,499 | 31 (70.5%) | 4 (12.5%) |
| Total | 44 (100.0%) | 32 (100.0%) |
Health & Disability in Speculator
Health Insurance Coverage by Age in Speculator
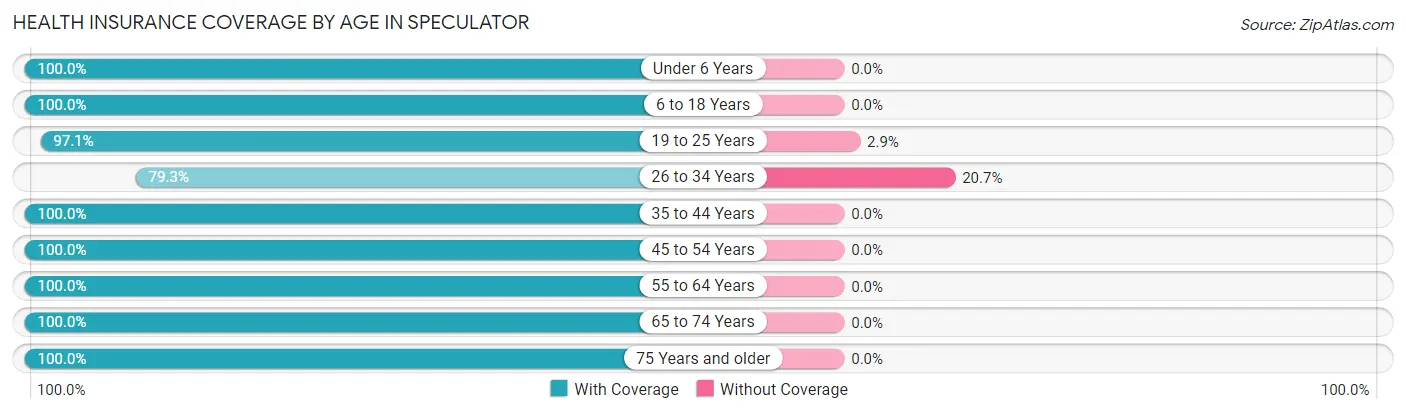
| Age Bracket | With Coverage | Without Coverage |
| Under 6 Years | 12 (100.0%) | 0 (0.0%) |
| 6 to 18 Years | 37 (100.0%) | 0 (0.0%) |
| 19 to 25 Years | 33 (97.1%) | 1 (2.9%) |
| 26 to 34 Years | 23 (79.3%) | 6 (20.7%) |
| 35 to 44 Years | 13 (100.0%) | 0 (0.0%) |
| 45 to 54 Years | 27 (100.0%) | 0 (0.0%) |
| 55 to 64 Years | 69 (100.0%) | 0 (0.0%) |
| 65 to 74 Years | 118 (100.0%) | 0 (0.0%) |
| 75 Years and older | 49 (100.0%) | 0 (0.0%) |
| Total | 381 (98.2%) | 7 (1.8%) |
Health Insurance Coverage by Citizenship Status in Speculator
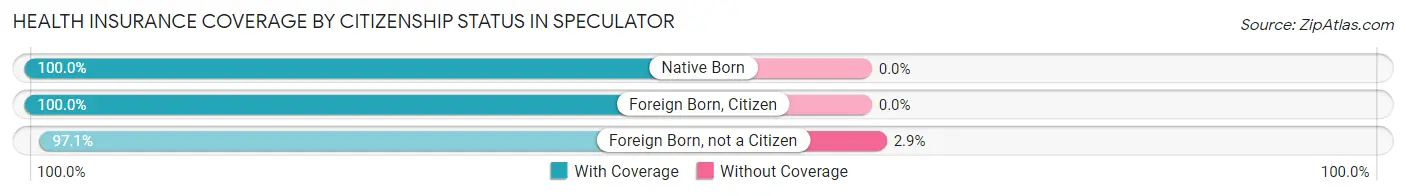
| Citizenship Status | With Coverage | Without Coverage |
| Native Born | 12 (100.0%) | 0 (0.0%) |
| Foreign Born, Citizen | 37 (100.0%) | 0 (0.0%) |
| Foreign Born, not a Citizen | 33 (97.1%) | 1 (2.9%) |
Health Insurance Coverage by Household Income in Speculator
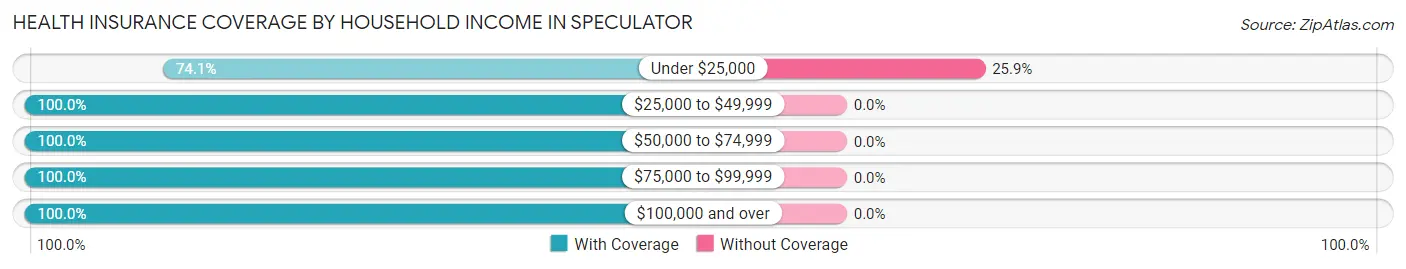
| Household Income | With Coverage | Without Coverage |
| Under $25,000 | 20 (74.1%) | 7 (25.9%) |
| $25,000 to $49,999 | 31 (100.0%) | 0 (0.0%) |
| $50,000 to $74,999 | 56 (100.0%) | 0 (0.0%) |
| $75,000 to $99,999 | 41 (100.0%) | 0 (0.0%) |
| $100,000 and over | 154 (100.0%) | 0 (0.0%) |
Public vs Private Health Insurance Coverage by Age in Speculator
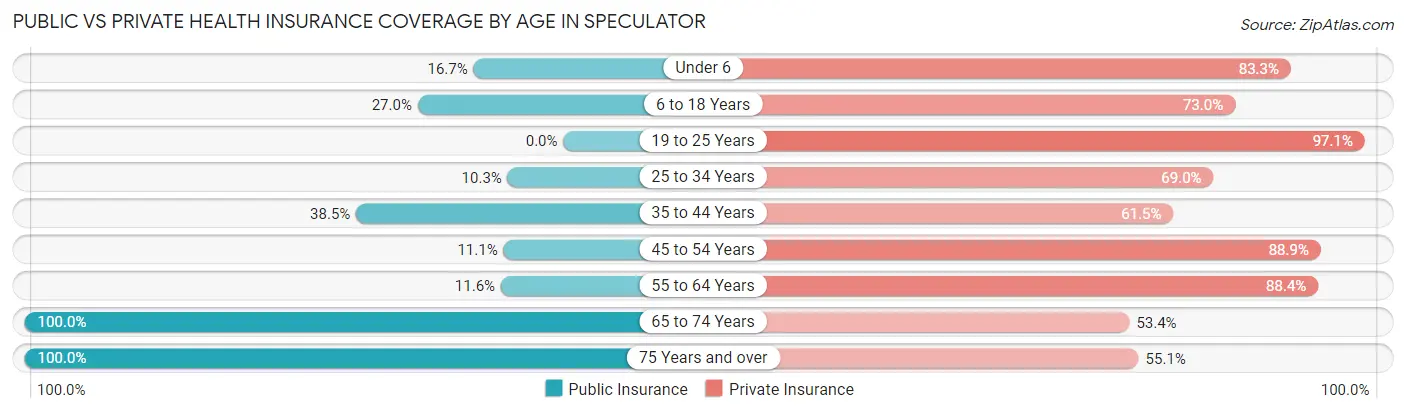
| Age Bracket | Public Insurance | Private Insurance |
| Under 6 | 2 (16.7%) | 10 (83.3%) |
| 6 to 18 Years | 10 (27.0%) | 27 (73.0%) |
| 19 to 25 Years | 0 (0.0%) | 33 (97.1%) |
| 25 to 34 Years | 3 (10.3%) | 20 (69.0%) |
| 35 to 44 Years | 5 (38.5%) | 8 (61.5%) |
| 45 to 54 Years | 3 (11.1%) | 24 (88.9%) |
| 55 to 64 Years | 8 (11.6%) | 61 (88.4%) |
| 65 to 74 Years | 118 (100.0%) | 63 (53.4%) |
| 75 Years and over | 49 (100.0%) | 27 (55.1%) |
| Total | 198 (51.0%) | 273 (70.4%) |
Disability Status by Sex by Age in Speculator
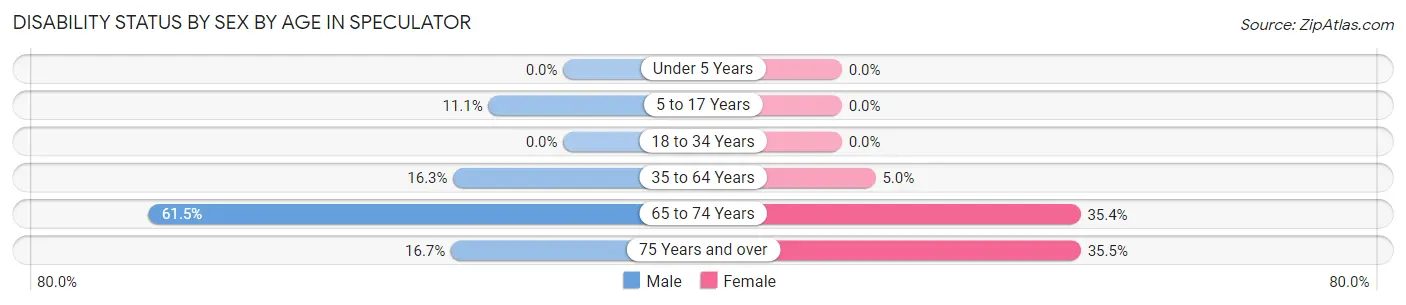
| Age Bracket | Male | Female |
| Under 5 Years | 0 (0.0%) | 0 (0.0%) |
| 5 to 17 Years | 2 (11.1%) | 0 (0.0%) |
| 18 to 34 Years | 0 (0.0%) | 0 (0.0%) |
| 35 to 64 Years | 8 (16.3%) | 3 (5.0%) |
| 65 to 74 Years | 24 (61.5%) | 28 (35.4%) |
| 75 Years and over | 3 (16.7%) | 11 (35.5%) |
Disability Class by Sex by Age in Speculator
Disability Class: Hearing Difficulty
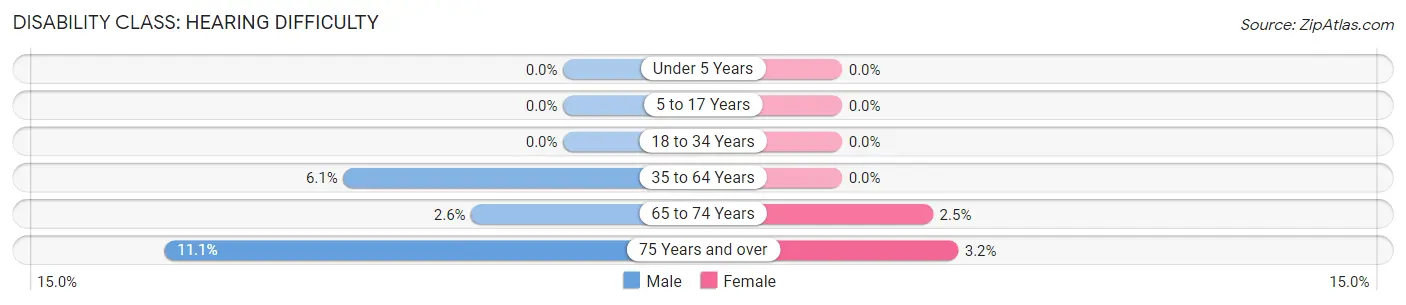
| Age Bracket | Male | Female |
| Under 5 Years | 0 (0.0%) | 0 (0.0%) |
| 5 to 17 Years | 0 (0.0%) | 0 (0.0%) |
| 18 to 34 Years | 0 (0.0%) | 0 (0.0%) |
| 35 to 64 Years | 3 (6.1%) | 0 (0.0%) |
| 65 to 74 Years | 1 (2.6%) | 2 (2.5%) |
| 75 Years and over | 2 (11.1%) | 1 (3.2%) |
Disability Class: Vision Difficulty
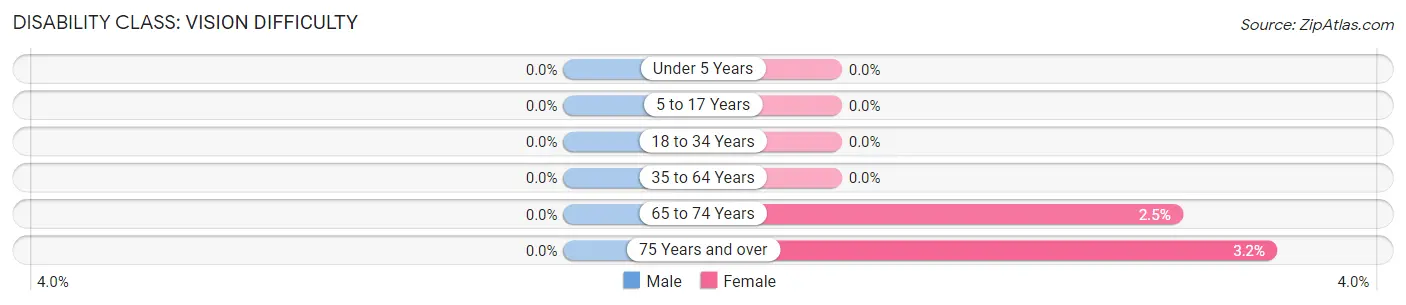
| Age Bracket | Male | Female |
| Under 5 Years | 0 (0.0%) | 0 (0.0%) |
| 5 to 17 Years | 0 (0.0%) | 0 (0.0%) |
| 18 to 34 Years | 0 (0.0%) | 0 (0.0%) |
| 35 to 64 Years | 0 (0.0%) | 0 (0.0%) |
| 65 to 74 Years | 0 (0.0%) | 2 (2.5%) |
| 75 Years and over | 0 (0.0%) | 1 (3.2%) |
Disability Class: Cognitive Difficulty
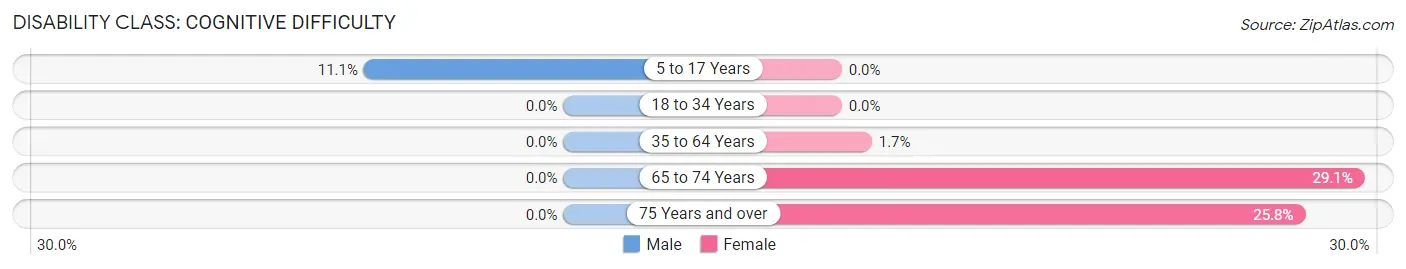
| Age Bracket | Male | Female |
| 5 to 17 Years | 2 (11.1%) | 0 (0.0%) |
| 18 to 34 Years | 0 (0.0%) | 0 (0.0%) |
| 35 to 64 Years | 0 (0.0%) | 1 (1.7%) |
| 65 to 74 Years | 0 (0.0%) | 23 (29.1%) |
| 75 Years and over | 0 (0.0%) | 8 (25.8%) |
Disability Class: Ambulatory Difficulty
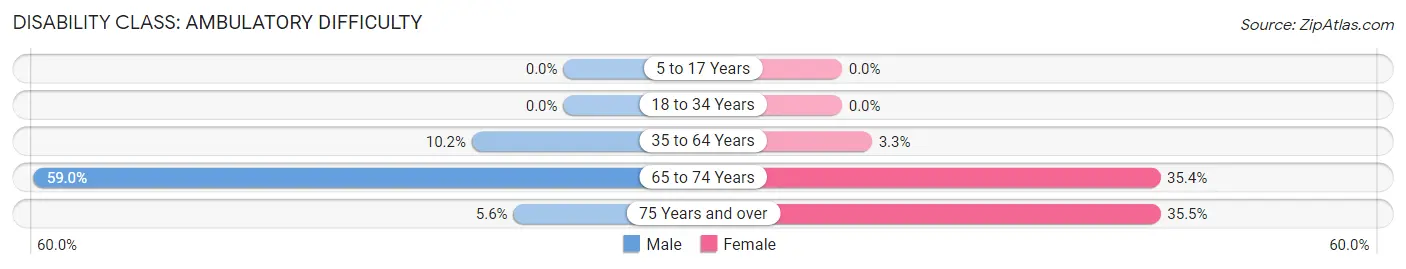
| Age Bracket | Male | Female |
| 5 to 17 Years | 0 (0.0%) | 0 (0.0%) |
| 18 to 34 Years | 0 (0.0%) | 0 (0.0%) |
| 35 to 64 Years | 5 (10.2%) | 2 (3.3%) |
| 65 to 74 Years | 23 (59.0%) | 28 (35.4%) |
| 75 Years and over | 1 (5.6%) | 11 (35.5%) |
Disability Class: Self-Care Difficulty
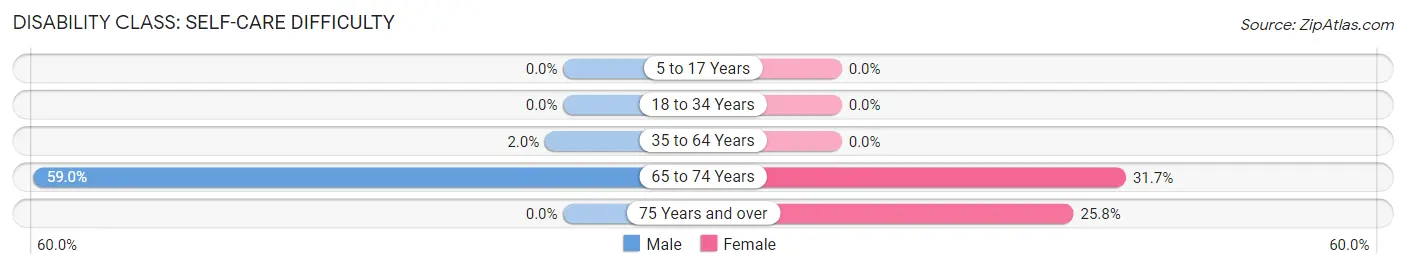
| Age Bracket | Male | Female |
| 5 to 17 Years | 0 (0.0%) | 0 (0.0%) |
| 18 to 34 Years | 0 (0.0%) | 0 (0.0%) |
| 35 to 64 Years | 1 (2.0%) | 0 (0.0%) |
| 65 to 74 Years | 23 (59.0%) | 25 (31.7%) |
| 75 Years and over | 0 (0.0%) | 8 (25.8%) |
Technology Access in Speculator
Computing Device Access in Speculator
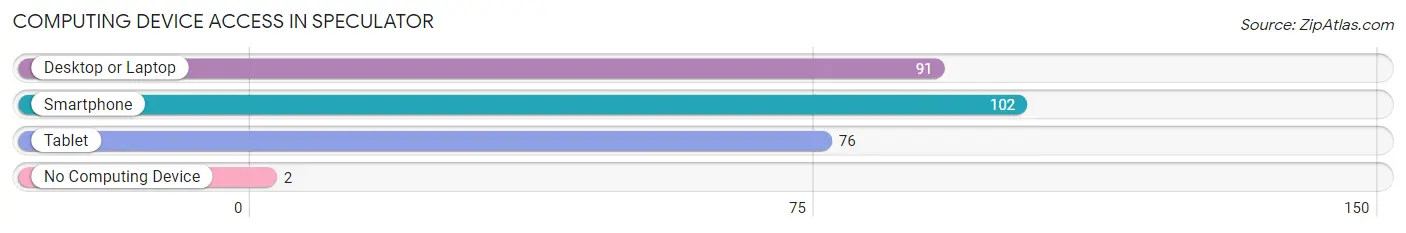
| Device Type | # Households | % Households |
| Desktop or Laptop | 91 | 78.4% |
| Smartphone | 102 | 87.9% |
| Tablet | 76 | 65.5% |
| No Computing Device | 2 | 1.7% |
| Total | 116 | 100.0% |
Internet Access in Speculator
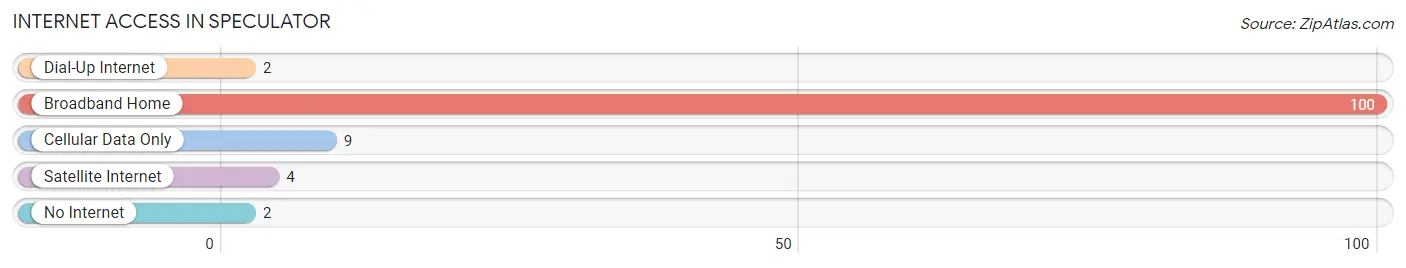
| Internet Type | # Households | % Households |
| Dial-Up Internet | 2 | 1.7% |
| Broadband Home | 100 | 86.2% |
| Cellular Data Only | 9 | 7.8% |
| Satellite Internet | 4 | 3.5% |
| No Internet | 2 | 1.7% |
| Total | 116 | 100.0% |
Speculator Summary
NY History
New York is a state located in the Northeastern United States. It is the 27th most populous state in the United States and the fourth most populous state in the country. The state was originally inhabited by the Iroquois and Algonquian-speaking Native American tribes. The first Europeans to explore the area were the Dutch in 1609. The Dutch established the colony of New Netherland in 1624, which was later taken over by the English in 1664. The English renamed the colony New York after the Duke of York.
The American Revolution began in 1775 and New York was a major battleground during the war. The state was the site of several major battles, including the Battle of Saratoga in 1777, which was a major turning point in the war. After the war, New York became the 11th state to ratify the United States Constitution in 1788.
New York City, the largest city in the state, was established in 1790. The city quickly became a major commercial and cultural center and was the first capital of the United States. The city was the site of the first presidential inauguration in 1789 and the first capital of the United States.
In the 19th century, New York was a major center of immigration and the state was home to many immigrants from Europe, Asia, and Latin America. The state was also a major center of industry and manufacturing and was home to many of the nation’s largest corporations.
Geography
New York is located in the Northeastern United States and is bordered by the states of New Jersey, Pennsylvania, Connecticut, Massachusetts, and Vermont. The state is divided into two distinct regions: the Hudson Valley and the Adirondack Mountains. The Hudson Valley is located in the south and is home to the state’s largest cities, including New York City. The Adirondack Mountains are located in the north and are home to many of the state’s most popular tourist destinations, including the Adirondack Park.
The state is home to many rivers, including the Hudson River, the Mohawk River, and the Genesee River. The state is also home to many lakes, including Lake Ontario, Lake Erie, and Lake Champlain.
Economy
New York’s economy is one of the largest and most diverse in the United States. The state is home to many of the nation’s largest corporations, including JPMorgan Chase, Citigroup, and Goldman Sachs. The state is also home to many of the nation’s largest media companies, including Time Warner, News Corporation, and Viacom.
The state is also home to many of the nation’s largest financial institutions, including the New York Stock Exchange and the NASDAQ. The state is also home to many of the nation’s largest universities, including Columbia University, New York University, and Cornell University.
The state’s economy is also heavily dependent on tourism. The state is home to many of the nation’s most popular tourist destinations, including Niagara Falls, the Finger Lakes, and the Adirondack Mountains.
Demographics
As of the 2010 census, the population of New York was 19,378,102. The state is home to many ethnic and racial groups, including African Americans, Hispanics, Asians, and Native Americans. The state is also home to many immigrants from Europe, Asia, and Latin America.
The state’s largest cities are New York City, Buffalo, Rochester, Yonkers, and Syracuse. The state’s capital is Albany. The state’s largest metropolitan area is the New York City metropolitan area, which is home to over 19 million people.
Conclusion
New York is a state located in the Northeastern United States. It is the 27th most populous state in the United States and the fourth most populous state in the country. The state was originally inhabited by the Iroquois and Algonquian-speaking Native American tribes. The state is home to many of the nation’s largest corporations, universities, and financial institutions. The state’s economy is heavily dependent on tourism and the state is home to many of the nation’s most popular tourist destinations. The state is also home to many ethnic and racial groups, including African Americans, Hispanics, Asians, and Native Americans.
Common Questions
What is Per Capita Income in Speculator?
Per Capita income in Speculator is $38,531.
What is the Median Family Income in Speculator?
Median Family Income in Speculator is $95,536.
What is the Median Household income in Speculator?
Median Household Income in Speculator is $71,563.
What is Income or Wage Gap in Speculator?
Income or Wage Gap in Speculator is 21.4%.
Women in Speculator earn 78.6 cents for every dollar earned by a man.
What is Inequality or Gini Index in Speculator?
Inequality or Gini Index in Speculator is 0.37.
What is the Total Population of Speculator?
Total Population of Speculator is 388.
What is the Total Male Population of Speculator?
Total Male Population of Speculator is 177.
What is the Total Female Population of Speculator?
Total Female Population of Speculator is 211.
What is the Ratio of Males per 100 Females in Speculator?
There are 83.89 Males per 100 Females in Speculator.
What is the Ratio of Females per 100 Males in Speculator?
There are 119.21 Females per 100 Males in Speculator.
What is the Median Population Age in Speculator?
Median Population Age in Speculator is 59.7 Years.
What is the Average Family Size in Speculator
Average Family Size in Speculator is 3.5 People.
What is the Average Household Size in Speculator
Average Household Size in Speculator is 2.7 People.
How Large is the Labor Force in Speculator?
There are 170 People in the Labor Forcein in Speculator.
What is the Percentage of People in the Labor Force in Speculator?
48.3% of People are in the Labor Force in Speculator.
What is the Unemployment Rate in Speculator?
Unemployment Rate in Speculator is 5.3%.