Nevada, IA Map & Demographics
Nevada Map
Nevada Overview
$47,535
PER CAPITA INCOME
$95,034
AVG FAMILY INCOME
$69,742
AVG HOUSEHOLD INCOME
24.9%
WAGE / INCOME GAP [ % ]
75.1¢/ $1
WAGE / INCOME GAP [ $ ]
0.52
INEQUALITY / GINI INDEX
6,933
TOTAL POPULATION
3,673
MALE POPULATION
3,260
FEMALE POPULATION
112.67
MALES / 100 FEMALES
88.76
FEMALES / 100 MALES
40.9
MEDIAN AGE
3.0
AVG FAMILY SIZE
2.2
AVG HOUSEHOLD SIZE
3,655
LABOR FORCE [ PEOPLE ]
68.3%
PERCENT IN LABOR FORCE
1.8%
UNEMPLOYMENT RATE
Nevada Zip Codes
Nevada Area Codes
Income in Nevada
Income Overview in Nevada
Per Capita Income in Nevada is $47,535, while median incomes of families and households are $95,034 and $69,742 respectively.
| Characteristic | Number | Measure |
| Per Capita Income | 6,933 | $47,535 |
| Median Family Income | 1,703 | $95,034 |
| Mean Family Income | 1,703 | $134,731 |
| Median Household Income | 3,094 | $69,742 |
| Mean Household Income | 3,094 | $106,202 |
| Income Deficit | 1,703 | $0 |
| Wage / Income Gap (%) | 6,933 | 24.88% |
| Wage / Income Gap ($) | 6,933 | 75.12¢ per $1 |
| Gini / Inequality Index | 6,933 | 0.52 |
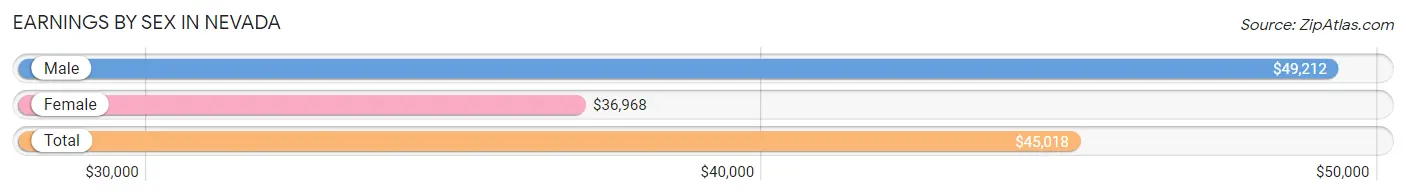
Earnings by Sex in Nevada
Average Earnings in Nevada are $45,018, $49,212 for men and $36,968 for women, a difference of 24.9%.
| Sex | Number | Average Earnings |
| Male | 2,182 (57.4%) | $49,212 |
| Female | 1,623 (42.6%) | $36,968 |
| Total | 3,805 (100.0%) | $45,018 |
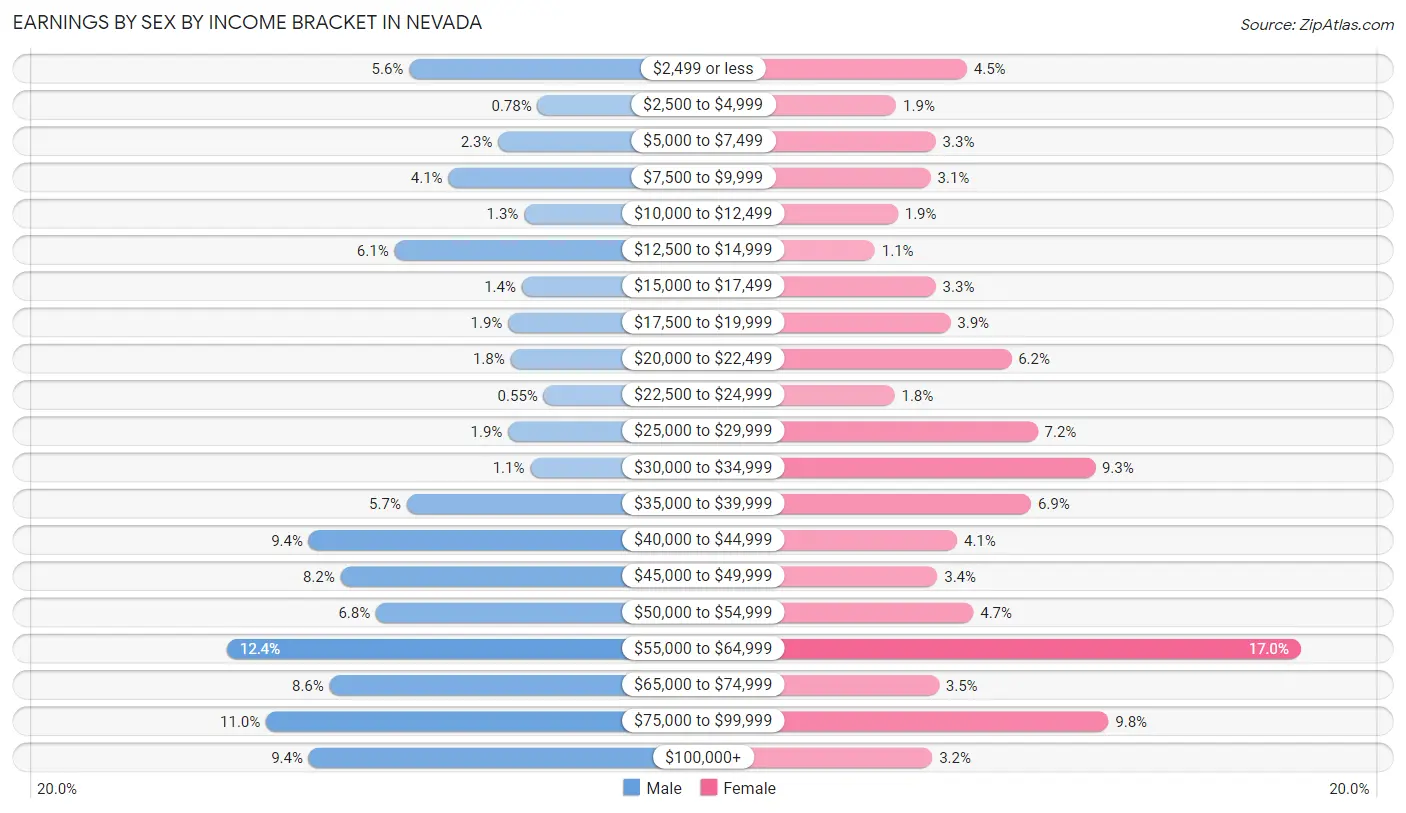
Earnings by Sex by Income Bracket in Nevada
The most common earnings brackets in Nevada are $55,000 to $64,999 for men (271 | 12.4%) and $55,000 to $64,999 for women (276 | 17.0%).
| Income | Male | Female |
| $2,499 or less | 122 (5.6%) | 73 (4.5%) |
| $2,500 to $4,999 | 17 (0.8%) | 30 (1.8%) |
| $5,000 to $7,499 | 49 (2.2%) | 54 (3.3%) |
| $7,500 to $9,999 | 90 (4.1%) | 51 (3.1%) |
| $10,000 to $12,499 | 28 (1.3%) | 31 (1.9%) |
| $12,500 to $14,999 | 134 (6.1%) | 17 (1.1%) |
| $15,000 to $17,499 | 30 (1.4%) | 54 (3.3%) |
| $17,500 to $19,999 | 41 (1.9%) | 63 (3.9%) |
| $20,000 to $22,499 | 39 (1.8%) | 100 (6.2%) |
| $22,500 to $24,999 | 12 (0.5%) | 29 (1.8%) |
| $25,000 to $29,999 | 41 (1.9%) | 116 (7.1%) |
| $30,000 to $34,999 | 23 (1.1%) | 151 (9.3%) |
| $35,000 to $39,999 | 124 (5.7%) | 112 (6.9%) |
| $40,000 to $44,999 | 204 (9.3%) | 67 (4.1%) |
| $45,000 to $49,999 | 178 (8.2%) | 55 (3.4%) |
| $50,000 to $54,999 | 149 (6.8%) | 77 (4.7%) |
| $55,000 to $64,999 | 271 (12.4%) | 276 (17.0%) |
| $65,000 to $74,999 | 187 (8.6%) | 56 (3.5%) |
| $75,000 to $99,999 | 239 (11.0%) | 159 (9.8%) |
| $100,000+ | 204 (9.3%) | 52 (3.2%) |
| Total | 2,182 (100.0%) | 1,623 (100.0%) |
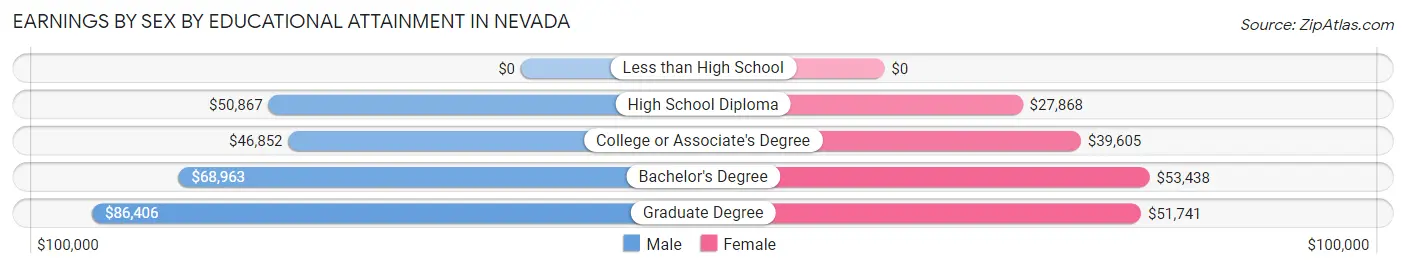
Earnings by Sex by Educational Attainment in Nevada
Average earnings in Nevada are $52,079 for men and $40,263 for women, a difference of 22.7%. Men with an educational attainment of graduate degree enjoy the highest average annual earnings of $86,406, while those with college or associate's degree education earn the least with $46,852. Women with an educational attainment of bachelor's degree earn the most with the average annual earnings of $53,438, while those with high school diploma education have the smallest earnings of $27,868.
| Educational Attainment | Male Income | Female Income |
| Less than High School | - | - |
| High School Diploma | $50,867 | $27,868 |
| College or Associate's Degree | $46,852 | $39,605 |
| Bachelor's Degree | $68,963 | $53,438 |
| Graduate Degree | $86,406 | $51,741 |
| Total | $52,079 | $40,263 |
Family Income in Nevada
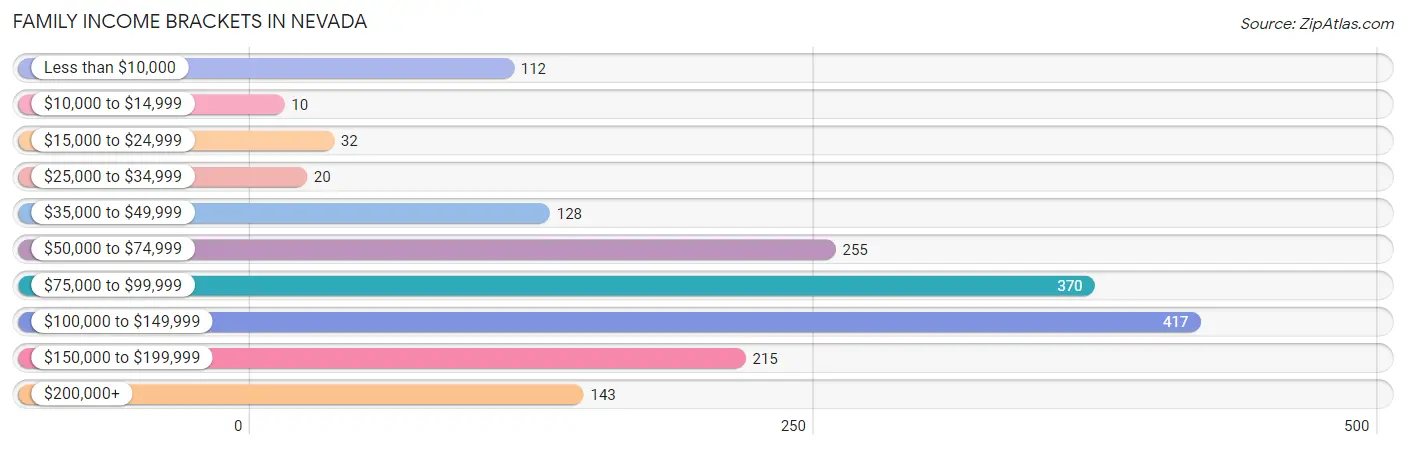
Family Income Brackets in Nevada
According to the Nevada family income data, there are 417 families falling into the $100,000 to $149,999 income range, which is the most common income bracket and makes up 24.5% of all families. Conversely, the $10,000 to $14,999 income bracket is the least frequent group with only 10 families (0.6%) belonging to this category.
| Income Bracket | # Families | % Families |
| Less than $10,000 | 112 | 6.6% |
| $10,000 to $14,999 | 10 | 0.6% |
| $15,000 to $24,999 | 32 | 1.9% |
| $25,000 to $34,999 | 20 | 1.2% |
| $35,000 to $49,999 | 128 | 7.5% |
| $50,000 to $74,999 | 255 | 15.0% |
| $75,000 to $99,999 | 370 | 21.7% |
| $100,000 to $149,999 | 417 | 24.5% |
| $150,000 to $199,999 | 215 | 12.6% |
| $200,000+ | 143 | 8.4% |
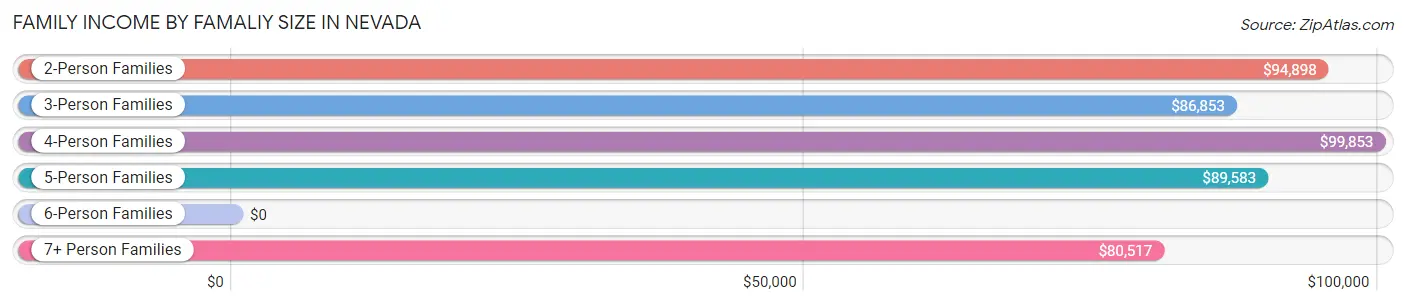
Family Income by Famaliy Size in Nevada
4-person families (258 | 15.1%) account for the highest median family income in Nevada with $99,853 per family, while 2-person families (930 | 54.6%) have the highest median income of $47,449 per family member.
| Income Bracket | # Families | Median Income |
| 2-Person Families | 930 (54.6%) | $94,898 |
| 3-Person Families | 253 (14.9%) | $86,853 |
| 4-Person Families | 258 (15.1%) | $99,853 |
| 5-Person Families | 127 (7.5%) | $89,583 |
| 6-Person Families | 89 (5.2%) | $0 |
| 7+ Person Families | 46 (2.7%) | $80,517 |
| Total | 1,703 (100.0%) | $95,034 |
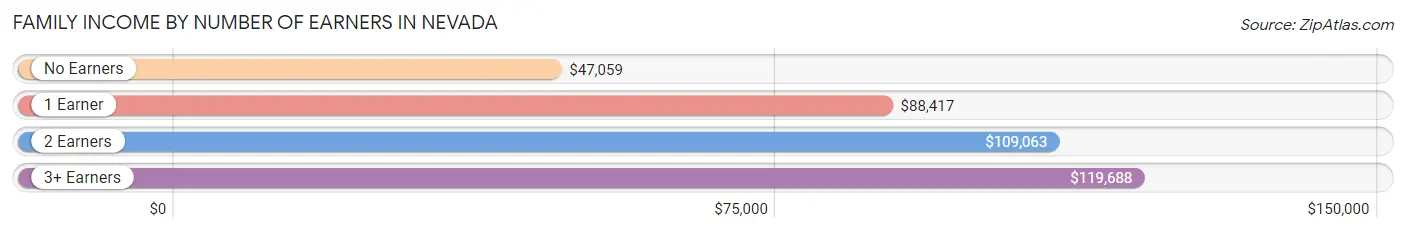
Family Income by Number of Earners in Nevada
The median family income in Nevada is $95,034, with families comprising 3+ earners (199) having the highest median family income of $119,688, while families with no earners (202) have the lowest median family income of $47,059, accounting for 11.7% and 11.9% of families, respectively.
| Number of Earners | # Families | Median Income |
| No Earners | 202 (11.9%) | $47,059 |
| 1 Earner | 603 (35.4%) | $88,417 |
| 2 Earners | 699 (41.0%) | $109,063 |
| 3+ Earners | 199 (11.7%) | $119,688 |
| Total | 1,703 (100.0%) | $95,034 |
Household Income in Nevada
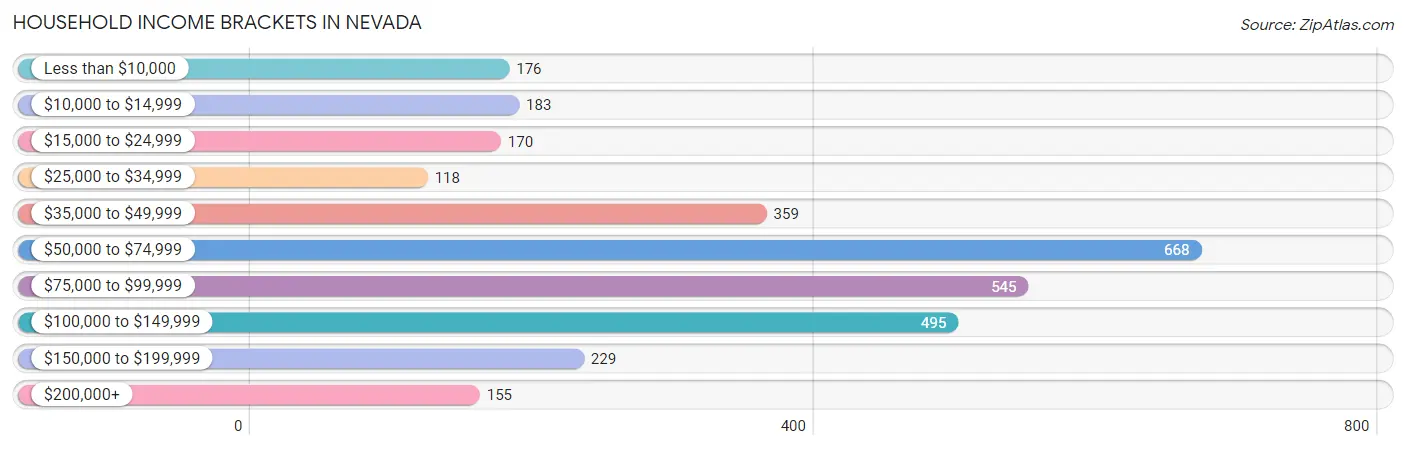
Household Income Brackets in Nevada
With 668 households falling in the category, the $50,000 to $74,999 income range is the most frequent in Nevada, accounting for 21.6% of all households. In contrast, only 118 households (3.8%) fall into the $25,000 to $34,999 income bracket, making it the least populous group.
| Income Bracket | # Households | % Households |
| Less than $10,000 | 176 | 5.7% |
| $10,000 to $14,999 | 183 | 5.9% |
| $15,000 to $24,999 | 170 | 5.5% |
| $25,000 to $34,999 | 118 | 3.8% |
| $35,000 to $49,999 | 359 | 11.6% |
| $50,000 to $74,999 | 668 | 21.6% |
| $75,000 to $99,999 | 545 | 17.6% |
| $100,000 to $149,999 | 495 | 16.0% |
| $150,000 to $199,999 | 229 | 7.4% |
| $200,000+ | 155 | 5.0% |
Household Income by Householder Age in Nevada
The median household income in Nevada is $69,742, with the highest median household income of $81,250 found in the 15 to 24 years age bracket for the primary householder. A total of 62 households (2.0%) fall into this category. Meanwhile, the 65+ years age bracket for the primary householder has the lowest median household income of $56,563, with 788 households (25.5%) in this group.
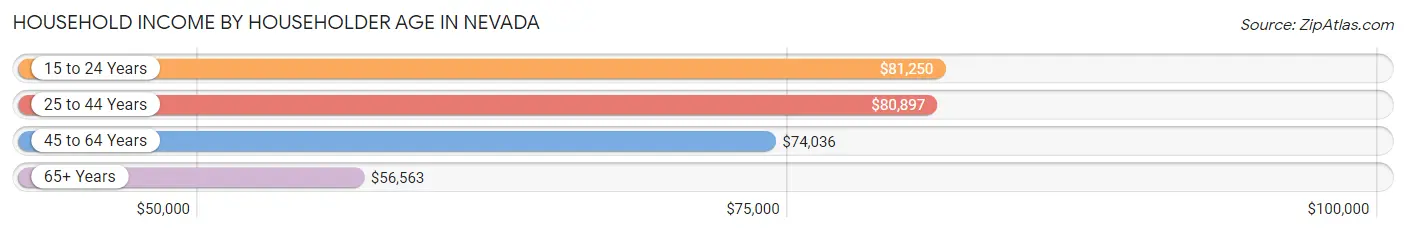
| Income Bracket | # Households | Median Income |
| 15 to 24 Years | 62 (2.0%) | $81,250 |
| 25 to 44 Years | 1,012 (32.7%) | $80,897 |
| 45 to 64 Years | 1,232 (39.8%) | $74,036 |
| 65+ Years | 788 (25.5%) | $56,563 |
| Total | 3,094 (100.0%) | $69,742 |
Poverty in Nevada
Income Below Poverty by Sex and Age in Nevada
With 13.0% poverty level for males and 9.7% for females among the residents of Nevada, under 5 year old males and 45 to 54 year old females are the most vulnerable to poverty, with 90 males (50.0%) and 105 females (27.6%) in their respective age groups living below the poverty level.
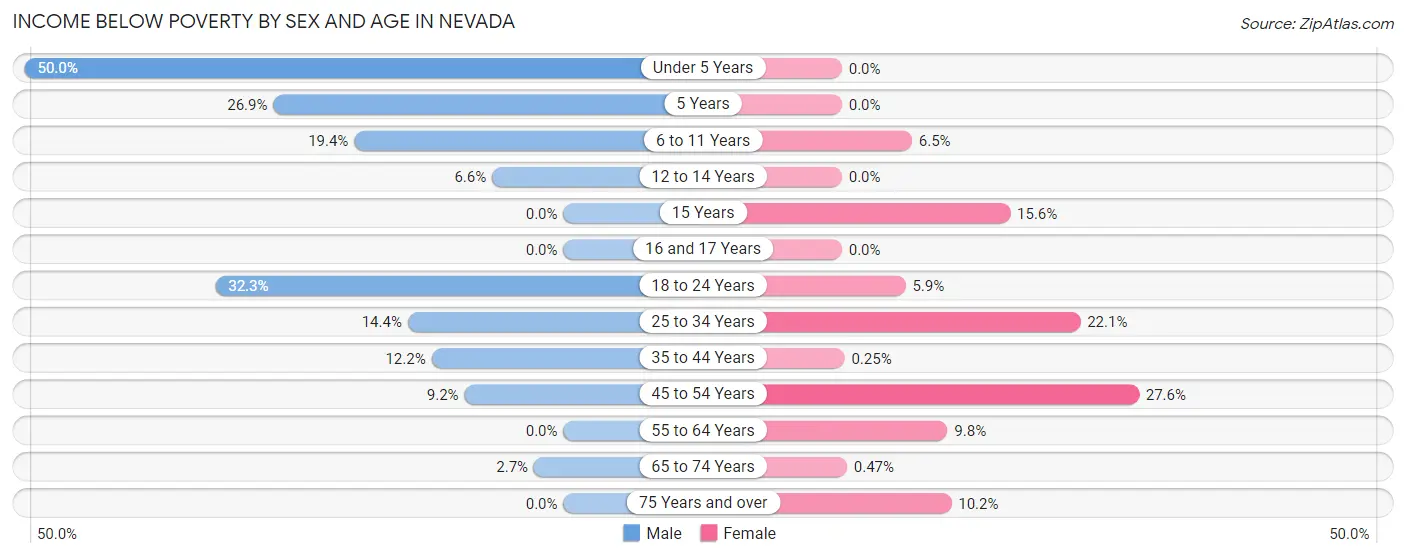
| Age Bracket | Male | Female |
| Under 5 Years | 90 (50.0%) | 0 (0.0%) |
| 5 Years | 28 (26.9%) | 0 (0.0%) |
| 6 to 11 Years | 79 (19.4%) | 23 (6.5%) |
| 12 to 14 Years | 10 (6.6%) | 0 (0.0%) |
| 15 Years | 0 (0.0%) | 10 (15.6%) |
| 16 and 17 Years | 0 (0.0%) | 0 (0.0%) |
| 18 to 24 Years | 83 (32.3%) | 11 (5.9%) |
| 25 to 34 Years | 69 (14.4%) | 83 (22.1%) |
| 35 to 44 Years | 59 (12.2%) | 1 (0.3%) |
| 45 to 54 Years | 36 (9.2%) | 105 (27.6%) |
| 55 to 64 Years | 0 (0.0%) | 49 (9.8%) |
| 65 to 74 Years | 8 (2.7%) | 2 (0.5%) |
| 75 Years and over | 0 (0.0%) | 25 (10.2%) |
| Total | 462 (13.0%) | 309 (9.7%) |
Income Above Poverty by Sex and Age in Nevada
According to the poverty statistics in Nevada, males aged 15 years and females aged under 5 years are the age groups that are most secure financially, with 100.0% of males and 100.0% of females in these age groups living above the poverty line.
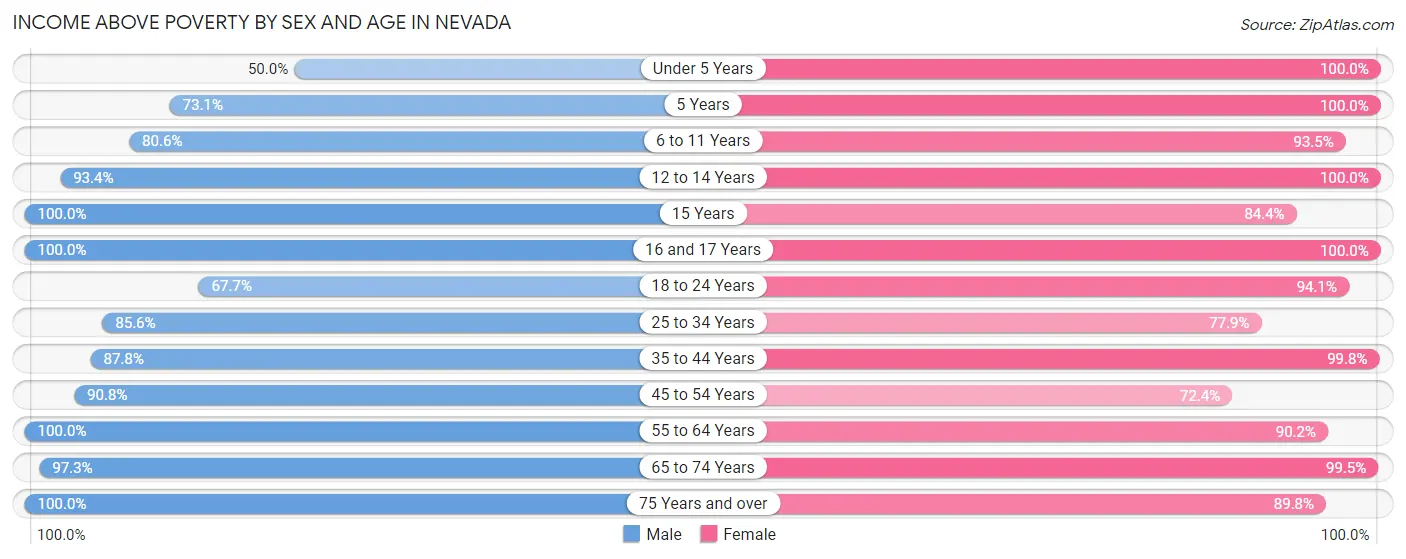
| Age Bracket | Male | Female |
| Under 5 Years | 90 (50.0%) | 101 (100.0%) |
| 5 Years | 76 (73.1%) | 24 (100.0%) |
| 6 to 11 Years | 328 (80.6%) | 331 (93.5%) |
| 12 to 14 Years | 141 (93.4%) | 86 (100.0%) |
| 15 Years | 38 (100.0%) | 54 (84.4%) |
| 16 and 17 Years | 70 (100.0%) | 36 (100.0%) |
| 18 to 24 Years | 174 (67.7%) | 175 (94.1%) |
| 25 to 34 Years | 409 (85.6%) | 292 (77.9%) |
| 35 to 44 Years | 423 (87.8%) | 402 (99.8%) |
| 45 to 54 Years | 356 (90.8%) | 276 (72.4%) |
| 55 to 64 Years | 560 (100.0%) | 451 (90.2%) |
| 65 to 74 Years | 285 (97.3%) | 422 (99.5%) |
| 75 Years and over | 155 (100.0%) | 221 (89.8%) |
| Total | 3,105 (87.1%) | 2,871 (90.3%) |
Income Below Poverty Among Married-Couple Families in Nevada
The poverty statistics for married-couple families in Nevada show that 0.1% or 1 of the total 1,336 families live below the poverty line. Families with no children have the highest poverty rate of 0.1%, comprising of 1 families. On the other hand, families with 1 or 2 children have the lowest poverty rate of 0.0%, which includes 0 families.
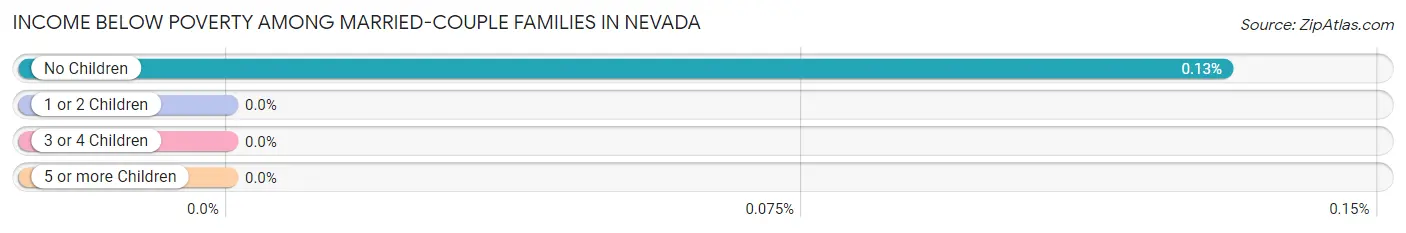
| Children | Above Poverty | Below Poverty |
| No Children | 784 (99.9%) | 1 (0.1%) |
| 1 or 2 Children | 407 (100.0%) | 0 (0.0%) |
| 3 or 4 Children | 98 (100.0%) | 0 (0.0%) |
| 5 or more Children | 46 (100.0%) | 0 (0.0%) |
| Total | 1,335 (99.9%) | 1 (0.1%) |
Income Below Poverty Among Single-Parent Households in Nevada
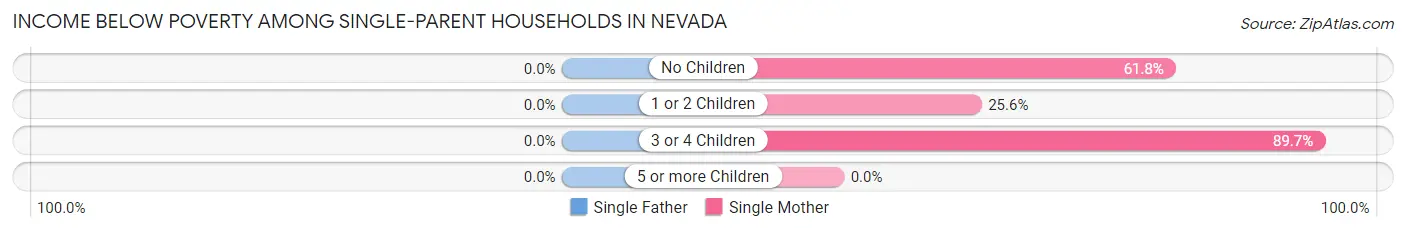
| Children | Single Father | Single Mother |
| No Children | 0 (0.0%) | 47 (61.8%) |
| 1 or 2 Children | 0 (0.0%) | 41 (25.6%) |
| 3 or 4 Children | 0 (0.0%) | 52 (89.7%) |
| 5 or more Children | 0 (0.0%) | 0 (0.0%) |
| Total | 0 (0.0%) | 140 (47.6%) |
Income Below Poverty Among Married-Couple vs Single-Parent Households in Nevada
The poverty data for Nevada shows that 1 of the married-couple family households (0.1%) and 140 of the single-parent households (38.2%) are living below the poverty level. Within the married-couple family households, those with no children have the highest poverty rate, with 1 households (0.1%) falling below the poverty line. Among the single-parent households, those with 3 or 4 children have the highest poverty rate, with 52 household (89.7%) living below poverty.
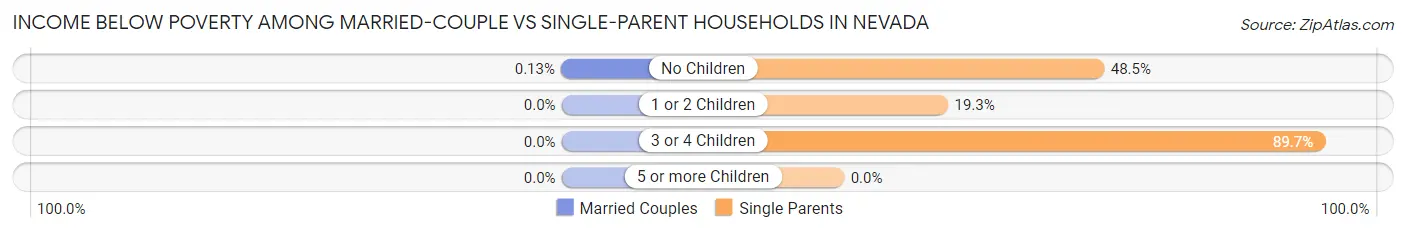
| Children | Married-Couple Families | Single-Parent Households |
| No Children | 1 (0.1%) | 47 (48.4%) |
| 1 or 2 Children | 0 (0.0%) | 41 (19.3%) |
| 3 or 4 Children | 0 (0.0%) | 52 (89.7%) |
| 5 or more Children | 0 (0.0%) | 0 (0.0%) |
| Total | 1 (0.1%) | 140 (38.2%) |
Race in Nevada
The most populous races in Nevada are White / Caucasian (6,303 | 90.9%), Hispanic or Latino (488 | 7.0%), and Two or more Races (325 | 4.7%).
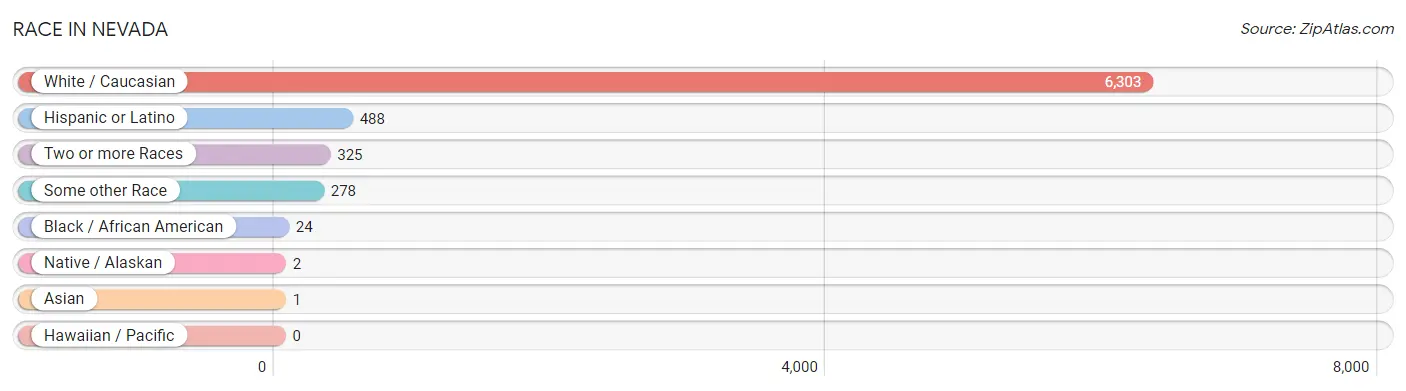
| Race | # Population | % Population |
| Asian | 1 | 0.0% |
| Black / African American | 24 | 0.4% |
| Hawaiian / Pacific | 0 | 0.0% |
| Hispanic or Latino | 488 | 7.0% |
| Native / Alaskan | 2 | 0.0% |
| White / Caucasian | 6,303 | 90.9% |
| Two or more Races | 325 | 4.7% |
| Some other Race | 278 | 4.0% |
| Total | 6,933 | 100.0% |
Ancestry in Nevada
The most populous ancestries reported in Nevada are German (2,400 | 34.6%), English (1,032 | 14.9%), Irish (827 | 11.9%), Norwegian (684 | 9.9%), and Scandinavian (370 | 5.3%), together accounting for 76.6% of all Nevada residents.
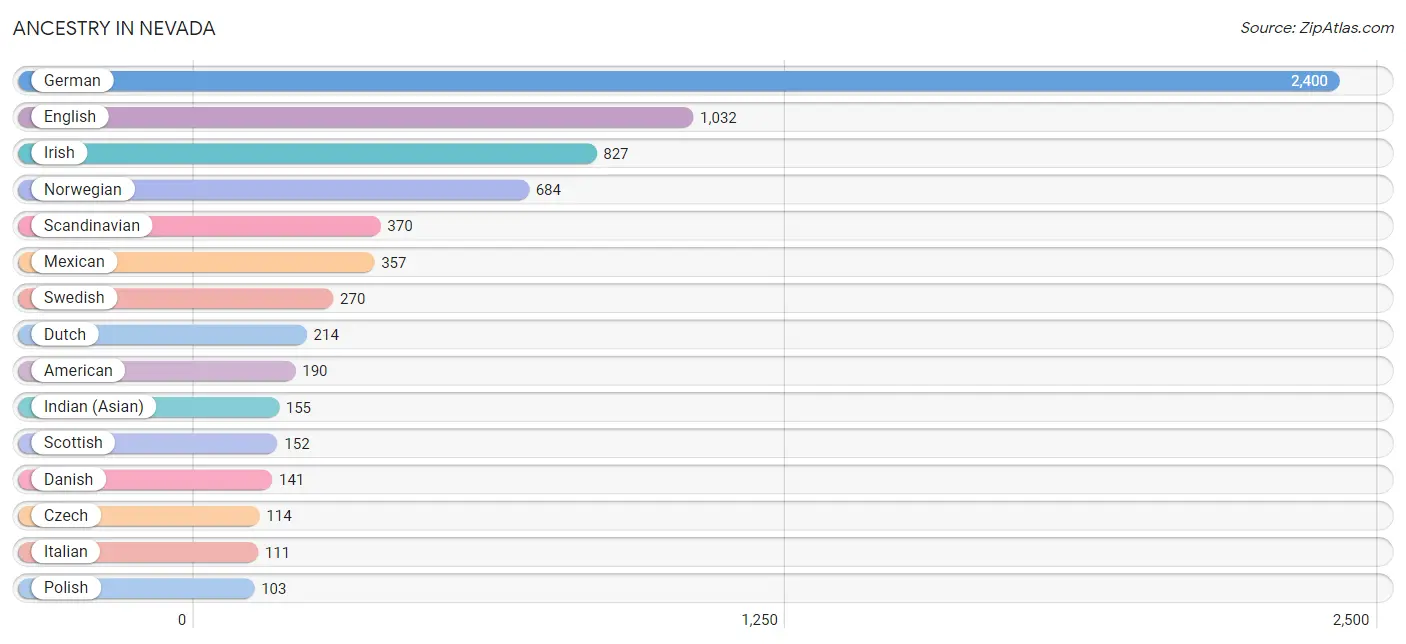
| Ancestry | # Population | % Population |
| American | 190 | 2.7% |
| Belgian | 32 | 0.5% |
| Bhutanese | 1 | 0.0% |
| British | 56 | 0.8% |
| Cherokee | 3 | 0.0% |
| Czech | 114 | 1.6% |
| Czechoslovakian | 17 | 0.3% |
| Danish | 141 | 2.0% |
| Dutch | 214 | 3.1% |
| Eastern European | 26 | 0.4% |
| English | 1,032 | 14.9% |
| European | 34 | 0.5% |
| Finnish | 21 | 0.3% |
| French | 57 | 0.8% |
| German | 2,400 | 34.6% |
| Greek | 7 | 0.1% |
| Indian (Asian) | 155 | 2.2% |
| Iranian | 18 | 0.3% |
| Irish | 827 | 11.9% |
| Italian | 111 | 1.6% |
| Mexican | 357 | 5.1% |
| Northern European | 23 | 0.3% |
| Norwegian | 684 | 9.9% |
| Polish | 103 | 1.5% |
| Puerto Rican | 10 | 0.1% |
| Russian | 41 | 0.6% |
| Scandinavian | 370 | 5.3% |
| Scotch-Irish | 51 | 0.7% |
| Scottish | 152 | 2.2% |
| Slavic | 14 | 0.2% |
| Spaniard | 12 | 0.2% |
| Swedish | 270 | 3.9% |
| Swiss | 8 | 0.1% |
| Welsh | 37 | 0.5% | View All 34 Rows |
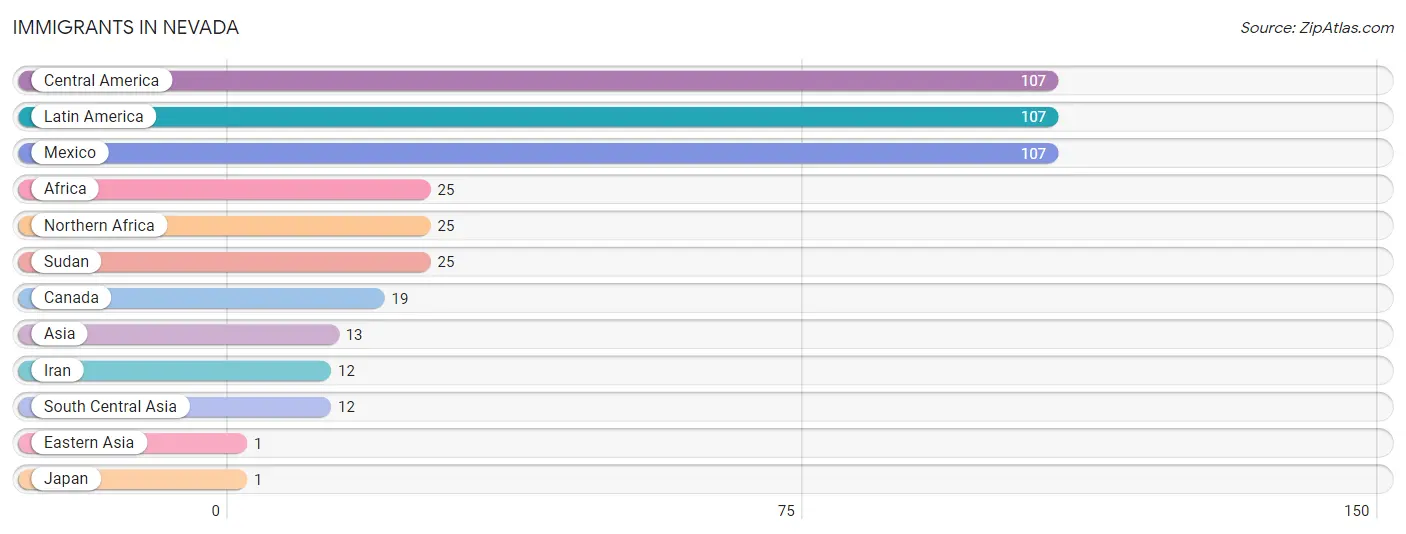
Immigrants in Nevada
The most numerous immigrant groups reported in Nevada came from Central America (107 | 1.5%), Latin America (107 | 1.5%), Mexico (107 | 1.5%), Africa (25 | 0.4%), and Northern Africa (25 | 0.4%), together accounting for 5.3% of all Nevada residents.
| Immigration Origin | # Population | % Population |
| Africa | 25 | 0.4% |
| Asia | 13 | 0.2% |
| Canada | 19 | 0.3% |
| Central America | 107 | 1.5% |
| Eastern Asia | 1 | 0.0% |
| Iran | 12 | 0.2% |
| Japan | 1 | 0.0% |
| Latin America | 107 | 1.5% |
| Mexico | 107 | 1.5% |
| Northern Africa | 25 | 0.4% |
| South Central Asia | 12 | 0.2% |
| Sudan | 25 | 0.4% | View All 12 Rows |
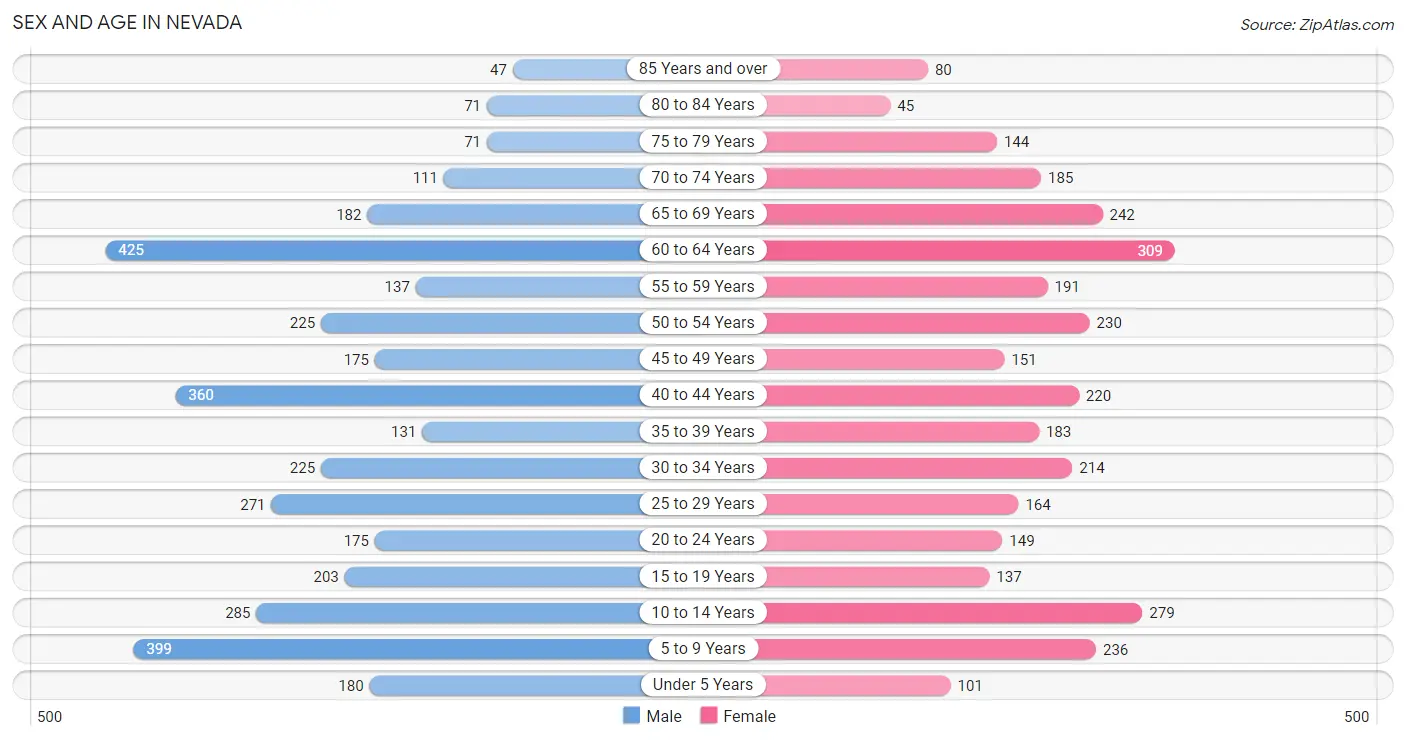
Sex and Age in Nevada
Sex and Age in Nevada
The most populous age groups in Nevada are 60 to 64 Years (425 | 11.6%) for men and 60 to 64 Years (309 | 9.5%) for women.
| Age Bracket | Male | Female |
| Under 5 Years | 180 (4.9%) | 101 (3.1%) |
| 5 to 9 Years | 399 (10.9%) | 236 (7.2%) |
| 10 to 14 Years | 285 (7.8%) | 279 (8.6%) |
| 15 to 19 Years | 203 (5.5%) | 137 (4.2%) |
| 20 to 24 Years | 175 (4.8%) | 149 (4.6%) |
| 25 to 29 Years | 271 (7.4%) | 164 (5.0%) |
| 30 to 34 Years | 225 (6.1%) | 214 (6.6%) |
| 35 to 39 Years | 131 (3.6%) | 183 (5.6%) |
| 40 to 44 Years | 360 (9.8%) | 220 (6.8%) |
| 45 to 49 Years | 175 (4.8%) | 151 (4.6%) |
| 50 to 54 Years | 225 (6.1%) | 230 (7.1%) |
| 55 to 59 Years | 137 (3.7%) | 191 (5.9%) |
| 60 to 64 Years | 425 (11.6%) | 309 (9.5%) |
| 65 to 69 Years | 182 (5.0%) | 242 (7.4%) |
| 70 to 74 Years | 111 (3.0%) | 185 (5.7%) |
| 75 to 79 Years | 71 (1.9%) | 144 (4.4%) |
| 80 to 84 Years | 71 (1.9%) | 45 (1.4%) |
| 85 Years and over | 47 (1.3%) | 80 (2.5%) |
| Total | 3,673 (100.0%) | 3,260 (100.0%) |
Families and Households in Nevada
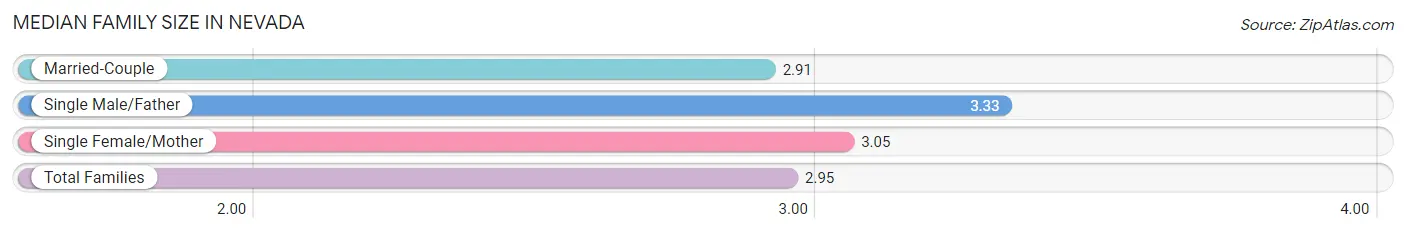
Median Family Size in Nevada
The median family size in Nevada is 2.95 persons per family, with single male/father families (73 | 4.3%) accounting for the largest median family size of 3.33 persons per family. On the other hand, married-couple families (1,336 | 78.4%) represent the smallest median family size with 2.91 persons per family.
| Family Type | # Families | Family Size |
| Married-Couple | 1,336 (78.4%) | 2.91 |
| Single Male/Father | 73 (4.3%) | 3.33 |
| Single Female/Mother | 294 (17.3%) | 3.05 |
| Total Families | 1,703 (100.0%) | 2.95 |
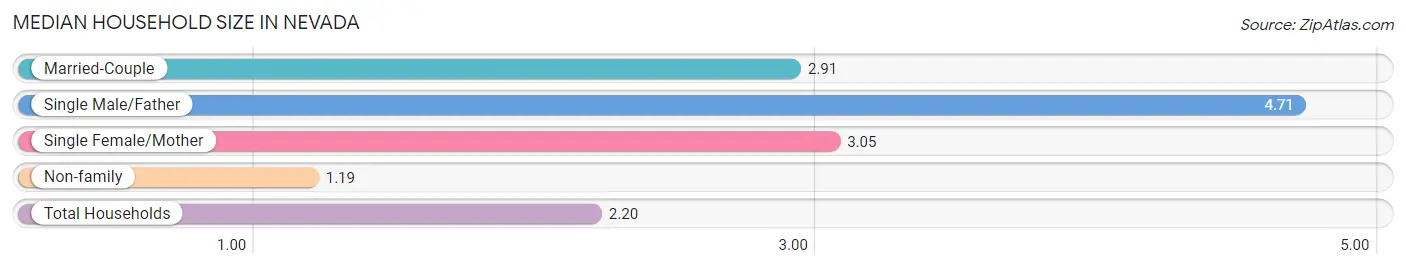
Median Household Size in Nevada
The median household size in Nevada is 2.20 persons per household, with single male/father households (73 | 2.4%) accounting for the largest median household size of 4.71 persons per household. non-family households (1,391 | 45.0%) represent the smallest median household size with 1.19 persons per household.
| Household Type | # Households | Household Size |
| Married-Couple | 1,336 (43.2%) | 2.91 |
| Single Male/Father | 73 (2.4%) | 4.71 |
| Single Female/Mother | 294 (9.5%) | 3.05 |
| Non-family | 1,391 (45.0%) | 1.19 |
| Total Households | 3,094 (100.0%) | 2.20 |
Household Size by Marriage Status in Nevada
Out of a total of 3,094 households in Nevada, 1,703 (55.0%) are family households, while 1,391 (45.0%) are nonfamily households. The most numerous type of family households are 2-person households, comprising 902, and the most common type of nonfamily households are 1-person households, comprising 1,110.
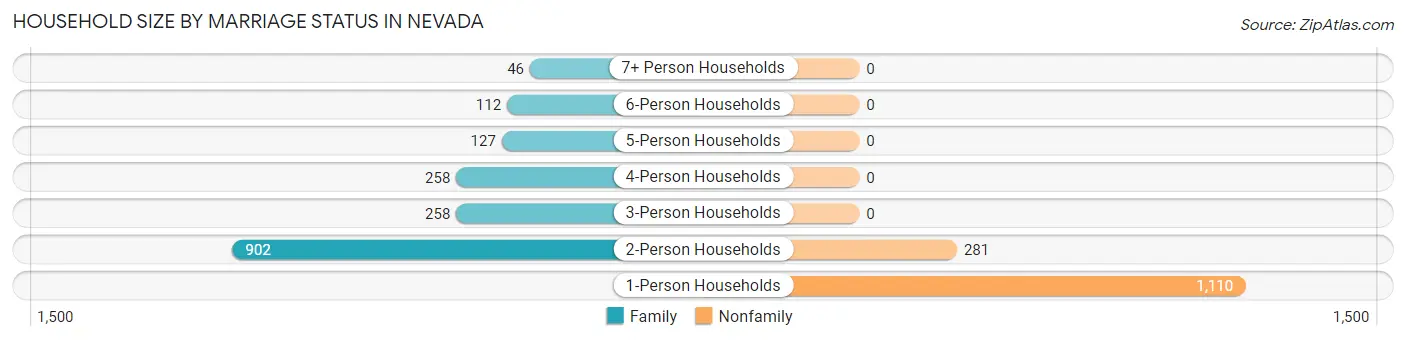
| Household Size | Family Households | Nonfamily Households |
| 1-Person Households | - | 1,110 (35.9%) |
| 2-Person Households | 902 (29.1%) | 281 (9.1%) |
| 3-Person Households | 258 (8.3%) | 0 (0.0%) |
| 4-Person Households | 258 (8.3%) | 0 (0.0%) |
| 5-Person Households | 127 (4.1%) | 0 (0.0%) |
| 6-Person Households | 112 (3.6%) | 0 (0.0%) |
| 7+ Person Households | 46 (1.5%) | 0 (0.0%) |
| Total | 1,703 (55.0%) | 1,391 (45.0%) |
Female Fertility in Nevada
Fertility by Age in Nevada
Average fertility rate in Nevada is 68.0 births per 1,000 women. Women in the age bracket of 20 to 34 years have the highest fertility rate with 165.0 births per 1,000 women. Women in the age bracket of 20 to 34 years acount for 100.0% of all women with births.
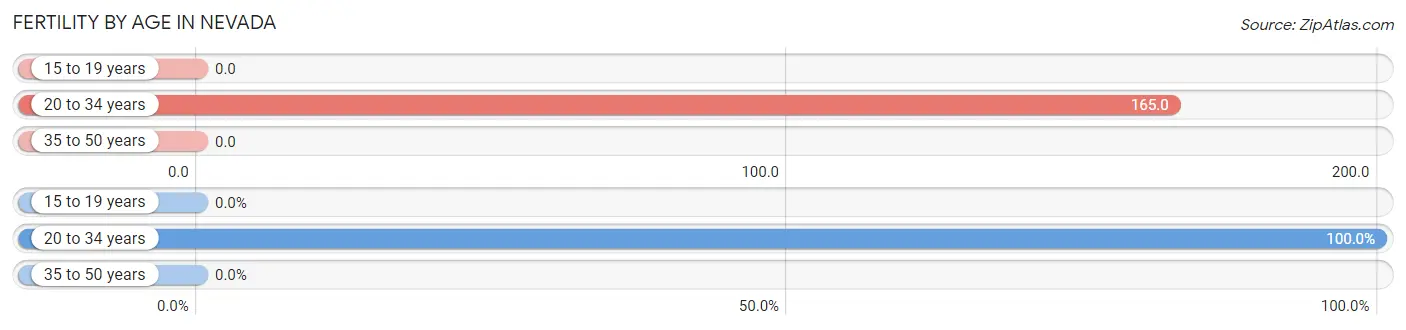
| Age Bracket | Women with Births | Births / 1,000 Women |
| 15 to 19 years | 0 (0.0%) | 0.0 |
| 20 to 34 years | 87 (100.0%) | 165.0 |
| 35 to 50 years | 0 (0.0%) | 0.0 |
| Total | 87 (100.0%) | 68.0 |
Fertility by Age by Marriage Status in Nevada
62.1% of women with births (87) in Nevada are married. The highest percentage of unmarried women with births falls into 20 to 34 years age bracket with 37.9% of them unmarried at the time of birth, while the lowest percentage of unmarried women with births belong to 20 to 34 years age bracket with 37.9% of them unmarried.
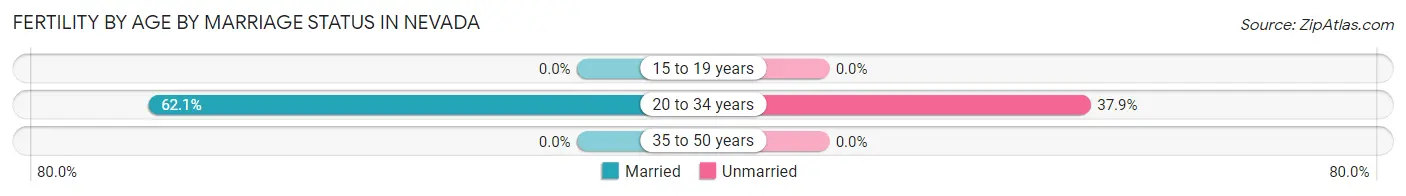
| Age Bracket | Married | Unmarried |
| 15 to 19 years | 0 (0.0%) | 0 (0.0%) |
| 20 to 34 years | 54 (62.1%) | 33 (37.9%) |
| 35 to 50 years | 0 (0.0%) | 0 (0.0%) |
| Total | 54 (62.1%) | 33 (37.9%) |
Fertility by Education in Nevada
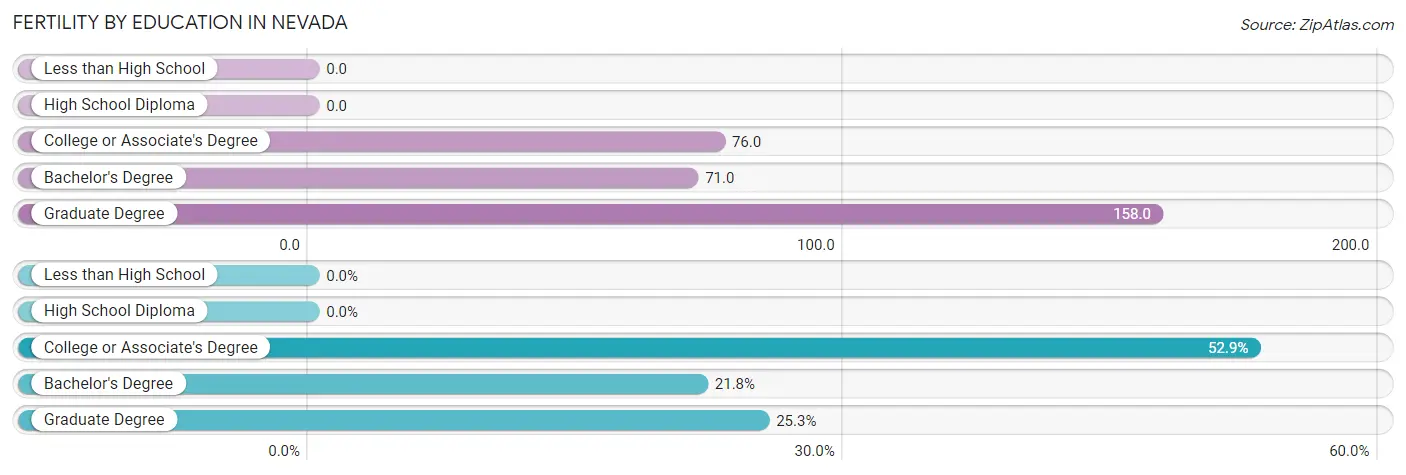
| Educational Attainment | Women with Births | Births / 1,000 Women |
| Less than High School | 0 (0.0%) | 0.0 |
| High School Diploma | 0 (0.0%) | 0.0 |
| College or Associate's Degree | 46 (52.9%) | 76.0 |
| Bachelor's Degree | 19 (21.8%) | 71.0 |
| Graduate Degree | 22 (25.3%) | 158.0 |
| Total | 87 (100.0%) | 68.0 |
Fertility by Education by Marriage Status in Nevada
37.9% of women with births in Nevada are unmarried. Women with the educational attainment of bachelor's degree are most likely to be married with 100.0% of them married at childbirth, while women with the educational attainment of college or associate's degree are least likely to be married with 71.7% of them unmarried at childbirth.
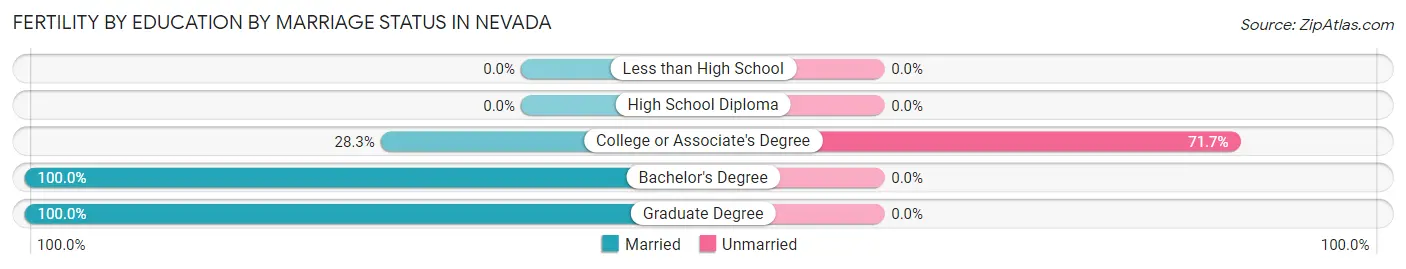
| Educational Attainment | Married | Unmarried |
| Less than High School | 0 (0.0%) | 0 (0.0%) |
| High School Diploma | 0 (0.0%) | 0 (0.0%) |
| College or Associate's Degree | 13 (28.3%) | 33 (71.7%) |
| Bachelor's Degree | 19 (100.0%) | 0 (0.0%) |
| Graduate Degree | 22 (100.0%) | 0 (0.0%) |
| Total | 54 (62.1%) | 33 (37.9%) |
Employment Characteristics in Nevada
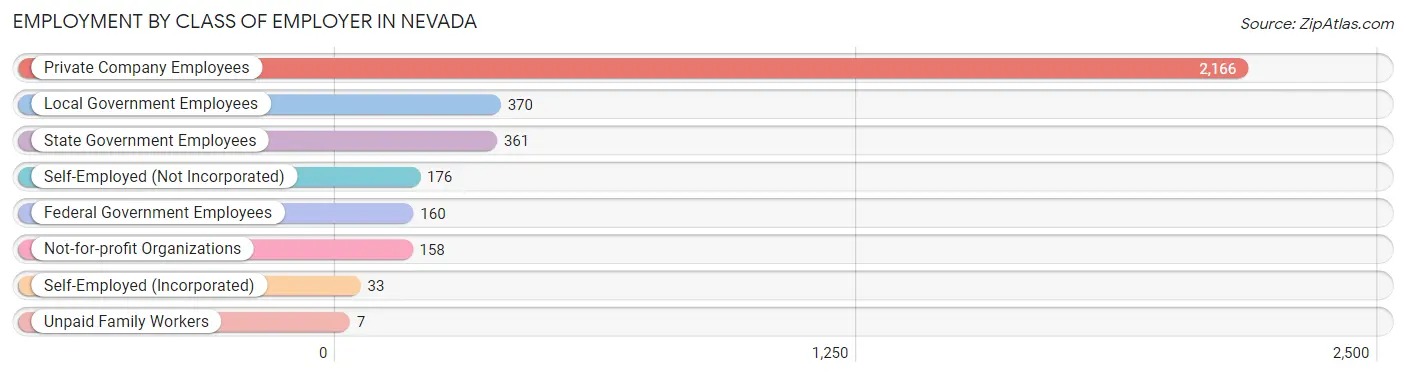
Employment by Class of Employer in Nevada
Among the 3,431 employed individuals in Nevada, private company employees (2,166 | 63.1%), local government employees (370 | 10.8%), and state government employees (361 | 10.5%) make up the most common classes of employment.
| Employer Class | # Employees | % Employees |
| Private Company Employees | 2,166 | 63.1% |
| Self-Employed (Incorporated) | 33 | 1.0% |
| Self-Employed (Not Incorporated) | 176 | 5.1% |
| Not-for-profit Organizations | 158 | 4.6% |
| Local Government Employees | 370 | 10.8% |
| State Government Employees | 361 | 10.5% |
| Federal Government Employees | 160 | 4.7% |
| Unpaid Family Workers | 7 | 0.2% |
| Total | 3,431 | 100.0% |
Employment Status by Age in Nevada
According to the labor force statistics for Nevada, out of the total population over 16 years of age (5,351), 68.3% or 3,655 individuals are in the labor force, with 1.8% or 66 of them unemployed. The age group with the highest labor force participation rate is 25 to 29 years, with 93.8% or 408 individuals in the labor force. Within the labor force, the 65 to 74 years age range has the highest percentage of unemployed individuals, with 14.1% or 31 of them being unemployed.
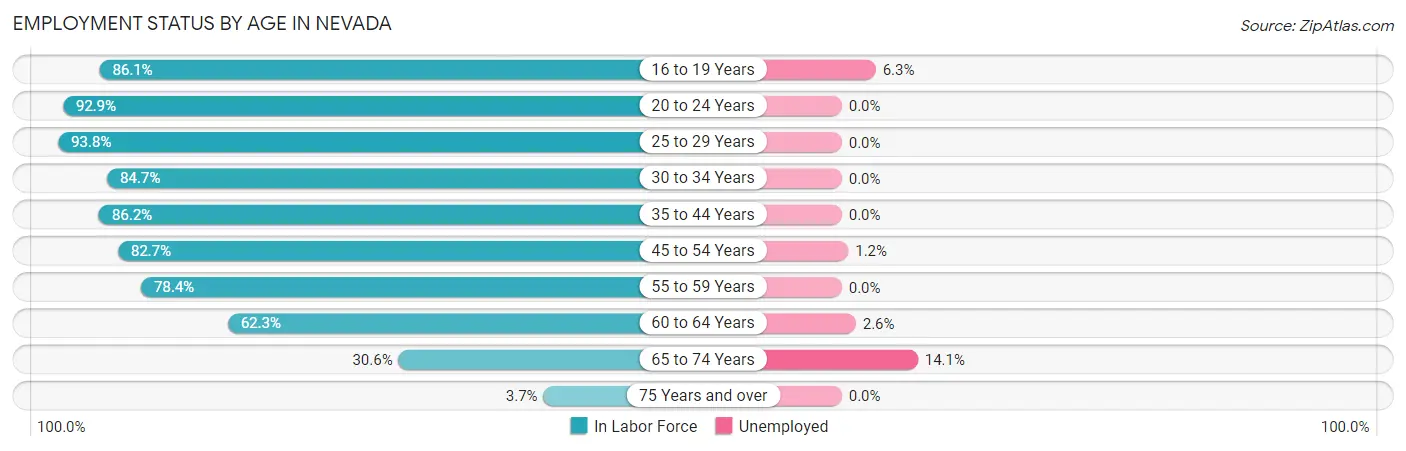
| Age Bracket | In Labor Force | Unemployed |
| 16 to 19 Years | 205 (86.1%) | 13 (6.3%) |
| 20 to 24 Years | 301 (92.9%) | 0 (0.0%) |
| 25 to 29 Years | 408 (93.8%) | 0 (0.0%) |
| 30 to 34 Years | 372 (84.7%) | 0 (0.0%) |
| 35 to 44 Years | 771 (86.2%) | 0 (0.0%) |
| 45 to 54 Years | 646 (82.7%) | 8 (1.2%) |
| 55 to 59 Years | 257 (78.4%) | 0 (0.0%) |
| 60 to 64 Years | 457 (62.3%) | 12 (2.6%) |
| 65 to 74 Years | 220 (30.6%) | 31 (14.1%) |
| 75 Years and over | 17 (3.7%) | 0 (0.0%) |
| Total | 3,655 (68.3%) | 66 (1.8%) |
Employment Status by Educational Attainment in Nevada
According to labor force statistics for Nevada, 80.6% of individuals (2,910) out of the total population between 25 and 64 years of age (3,611) are in the labor force, with 0.7% or 20 of them being unemployed. The group with the highest labor force participation rate are those with the educational attainment of bachelor's degree or higher, with 89.4% or 1,102 individuals in the labor force. Within the labor force, individuals with high school diploma education have the highest percentage of unemployment, with 2.3% or 13 of them being unemployed.
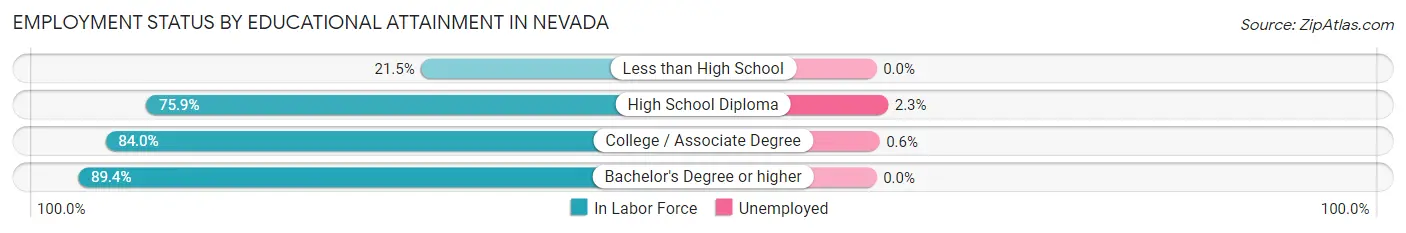
| Educational Attainment | In Labor Force | Unemployed |
| Less than High School | 44 (21.5%) | 0 (0.0%) |
| High School Diploma | 564 (75.9%) | 17 (2.3%) |
| College / Associate Degree | 1,201 (84.0%) | 9 (0.6%) |
| Bachelor's Degree or higher | 1,102 (89.4%) | 0 (0.0%) |
| Total | 2,910 (80.6%) | 25 (0.7%) |
Employment Occupations by Sex in Nevada
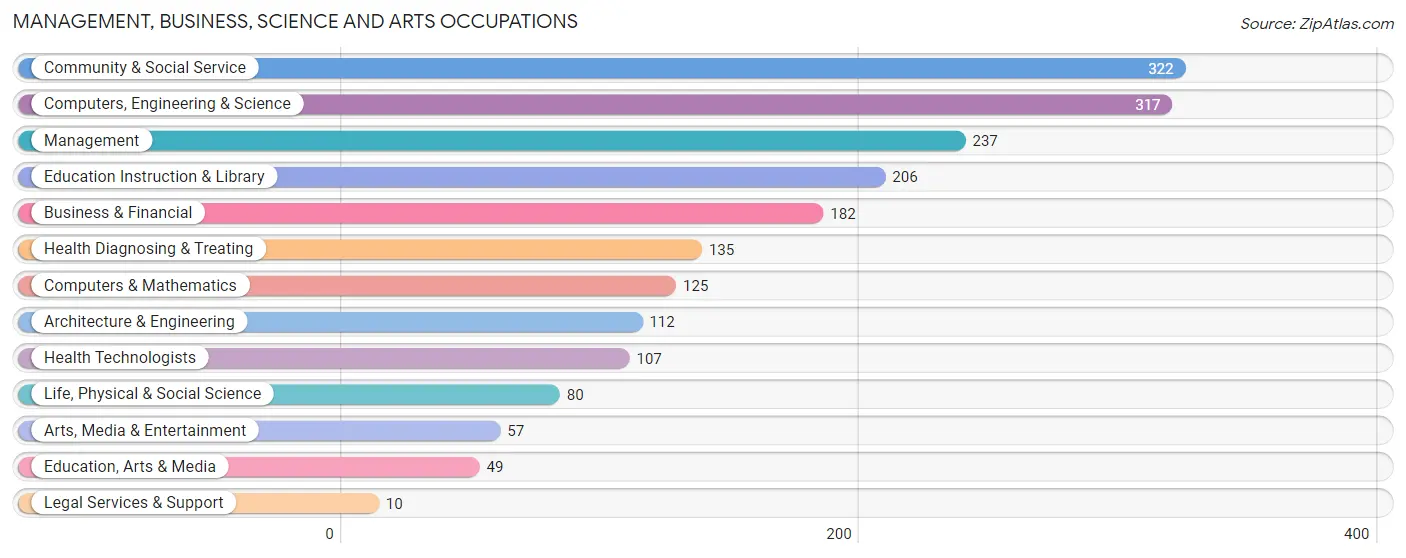
Management, Business, Science and Arts Occupations
The most common Management, Business, Science and Arts occupations in Nevada are Community & Social Service (322 | 9.0%), Computers, Engineering & Science (317 | 8.8%), Management (237 | 6.6%), Education Instruction & Library (206 | 5.7%), and Business & Financial (182 | 5.1%).
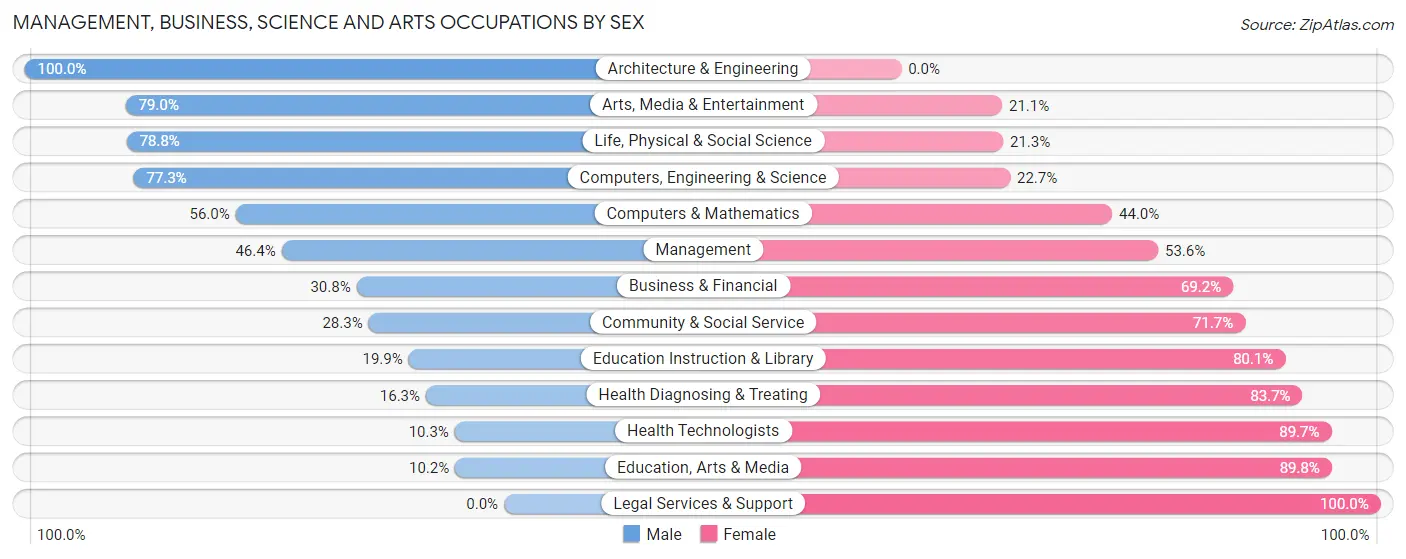
Management, Business, Science and Arts Occupations by Sex
Within the Management, Business, Science and Arts occupations in Nevada, the most male-oriented occupations are Architecture & Engineering (100.0%), Arts, Media & Entertainment (78.9%), and Life, Physical & Social Science (78.7%), while the most female-oriented occupations are Legal Services & Support (100.0%), Education, Arts & Media (89.8%), and Health Technologists (89.7%).
| Occupation | Male | Female |
| Management | 110 (46.4%) | 127 (53.6%) |
| Business & Financial | 56 (30.8%) | 126 (69.2%) |
| Computers, Engineering & Science | 245 (77.3%) | 72 (22.7%) |
| Computers & Mathematics | 70 (56.0%) | 55 (44.0%) |
| Architecture & Engineering | 112 (100.0%) | 0 (0.0%) |
| Life, Physical & Social Science | 63 (78.7%) | 17 (21.2%) |
| Community & Social Service | 91 (28.3%) | 231 (71.7%) |
| Education, Arts & Media | 5 (10.2%) | 44 (89.8%) |
| Legal Services & Support | 0 (0.0%) | 10 (100.0%) |
| Education Instruction & Library | 41 (19.9%) | 165 (80.1%) |
| Arts, Media & Entertainment | 45 (78.9%) | 12 (21.0%) |
| Health Diagnosing & Treating | 22 (16.3%) | 113 (83.7%) |
| Health Technologists | 11 (10.3%) | 96 (89.7%) |
| Total (Category) | 524 (43.9%) | 669 (56.1%) |
| Total (Overall) | 1,992 (55.5%) | 1,598 (44.5%) |
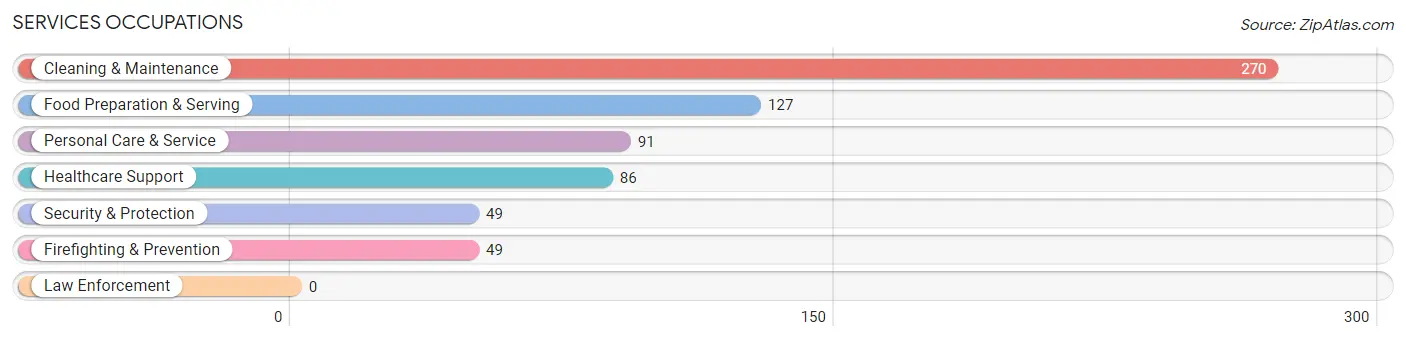
Services Occupations
The most common Services occupations in Nevada are Cleaning & Maintenance (270 | 7.5%), Food Preparation & Serving (127 | 3.5%), Personal Care & Service (91 | 2.5%), Healthcare Support (86 | 2.4%), and Security & Protection (49 | 1.4%).
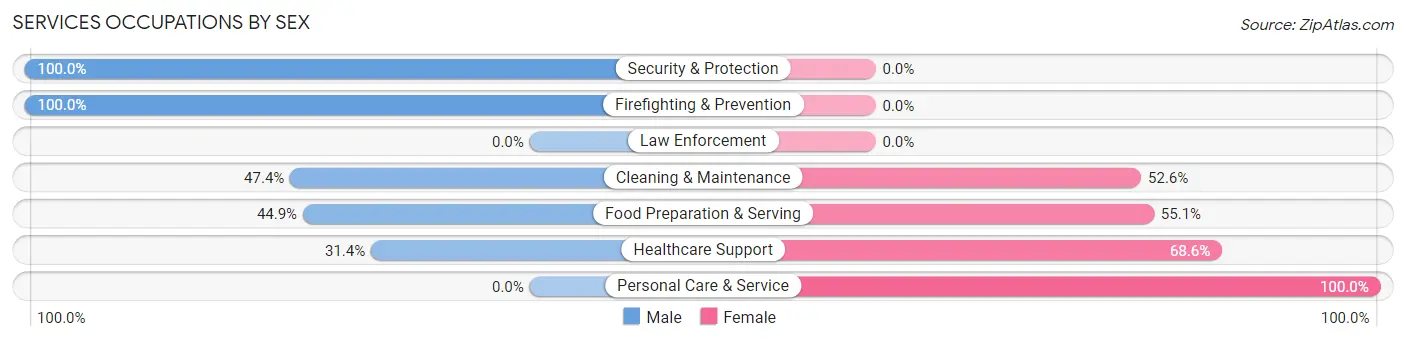
Services Occupations by Sex
Within the Services occupations in Nevada, the most male-oriented occupations are Security & Protection (100.0%), Firefighting & Prevention (100.0%), and Cleaning & Maintenance (47.4%), while the most female-oriented occupations are Personal Care & Service (100.0%), Healthcare Support (68.6%), and Food Preparation & Serving (55.1%).
| Occupation | Male | Female |
| Healthcare Support | 27 (31.4%) | 59 (68.6%) |
| Security & Protection | 49 (100.0%) | 0 (0.0%) |
| Firefighting & Prevention | 49 (100.0%) | 0 (0.0%) |
| Law Enforcement | 0 (0.0%) | 0 (0.0%) |
| Food Preparation & Serving | 57 (44.9%) | 70 (55.1%) |
| Cleaning & Maintenance | 128 (47.4%) | 142 (52.6%) |
| Personal Care & Service | 0 (0.0%) | 91 (100.0%) |
| Total (Category) | 261 (41.9%) | 362 (58.1%) |
| Total (Overall) | 1,992 (55.5%) | 1,598 (44.5%) |
Sales and Office Occupations
The most common Sales and Office occupations in Nevada are Office & Administration (573 | 16.0%), and Sales & Related (175 | 4.9%).
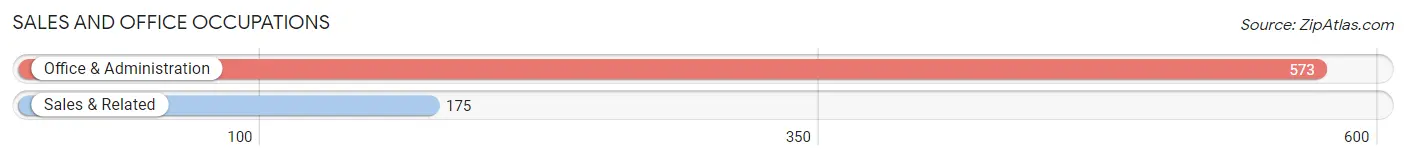
Sales and Office Occupations by Sex
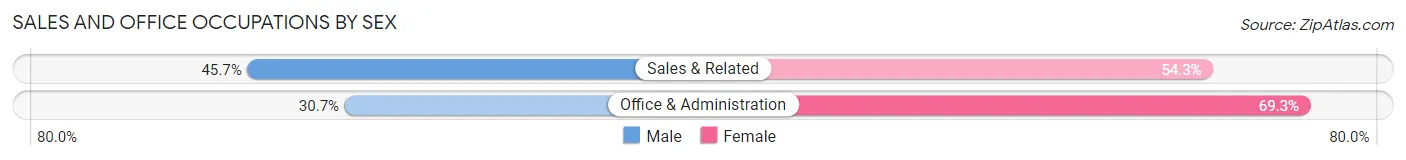
| Occupation | Male | Female |
| Sales & Related | 80 (45.7%) | 95 (54.3%) |
| Office & Administration | 176 (30.7%) | 397 (69.3%) |
| Total (Category) | 256 (34.2%) | 492 (65.8%) |
| Total (Overall) | 1,992 (55.5%) | 1,598 (44.5%) |
Natural Resources, Construction and Maintenance Occupations
The most common Natural Resources, Construction and Maintenance occupations in Nevada are Construction & Extraction (286 | 8.0%), Installation, Maintenance & Repair (162 | 4.5%), and Farming, Fishing & Forestry (34 | 0.9%).
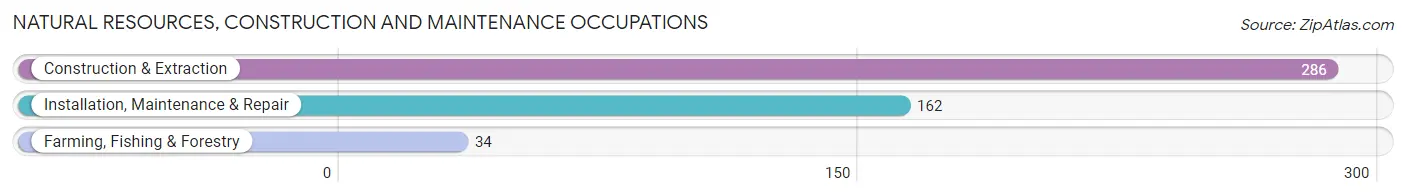
Natural Resources, Construction and Maintenance Occupations by Sex
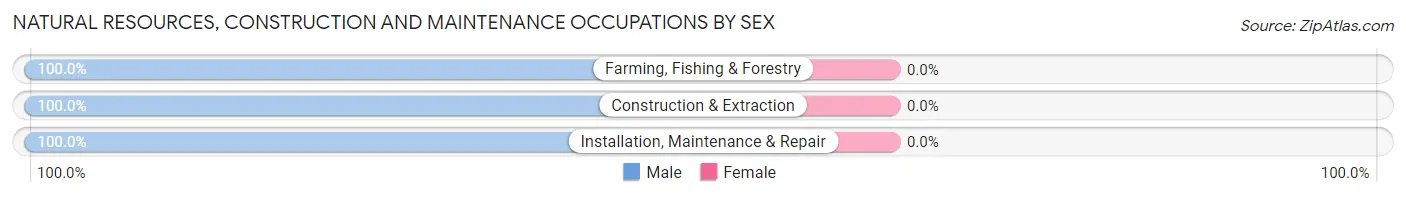
| Occupation | Male | Female |
| Farming, Fishing & Forestry | 34 (100.0%) | 0 (0.0%) |
| Construction & Extraction | 286 (100.0%) | 0 (0.0%) |
| Installation, Maintenance & Repair | 162 (100.0%) | 0 (0.0%) |
| Total (Category) | 482 (100.0%) | 0 (0.0%) |
| Total (Overall) | 1,992 (55.5%) | 1,598 (44.5%) |
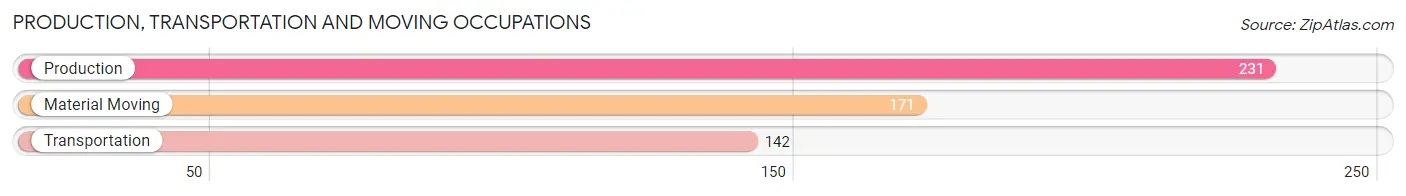
Production, Transportation and Moving Occupations
The most common Production, Transportation and Moving occupations in Nevada are Production (231 | 6.4%), Material Moving (171 | 4.8%), and Transportation (142 | 4.0%).
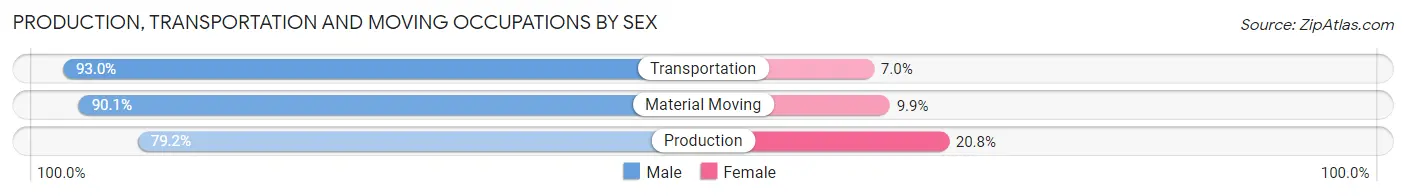
Production, Transportation and Moving Occupations by Sex
| Occupation | Male | Female |
| Production | 183 (79.2%) | 48 (20.8%) |
| Transportation | 132 (93.0%) | 10 (7.0%) |
| Material Moving | 154 (90.1%) | 17 (9.9%) |
| Total (Category) | 469 (86.2%) | 75 (13.8%) |
| Total (Overall) | 1,992 (55.5%) | 1,598 (44.5%) |
Employment Industries by Sex in Nevada
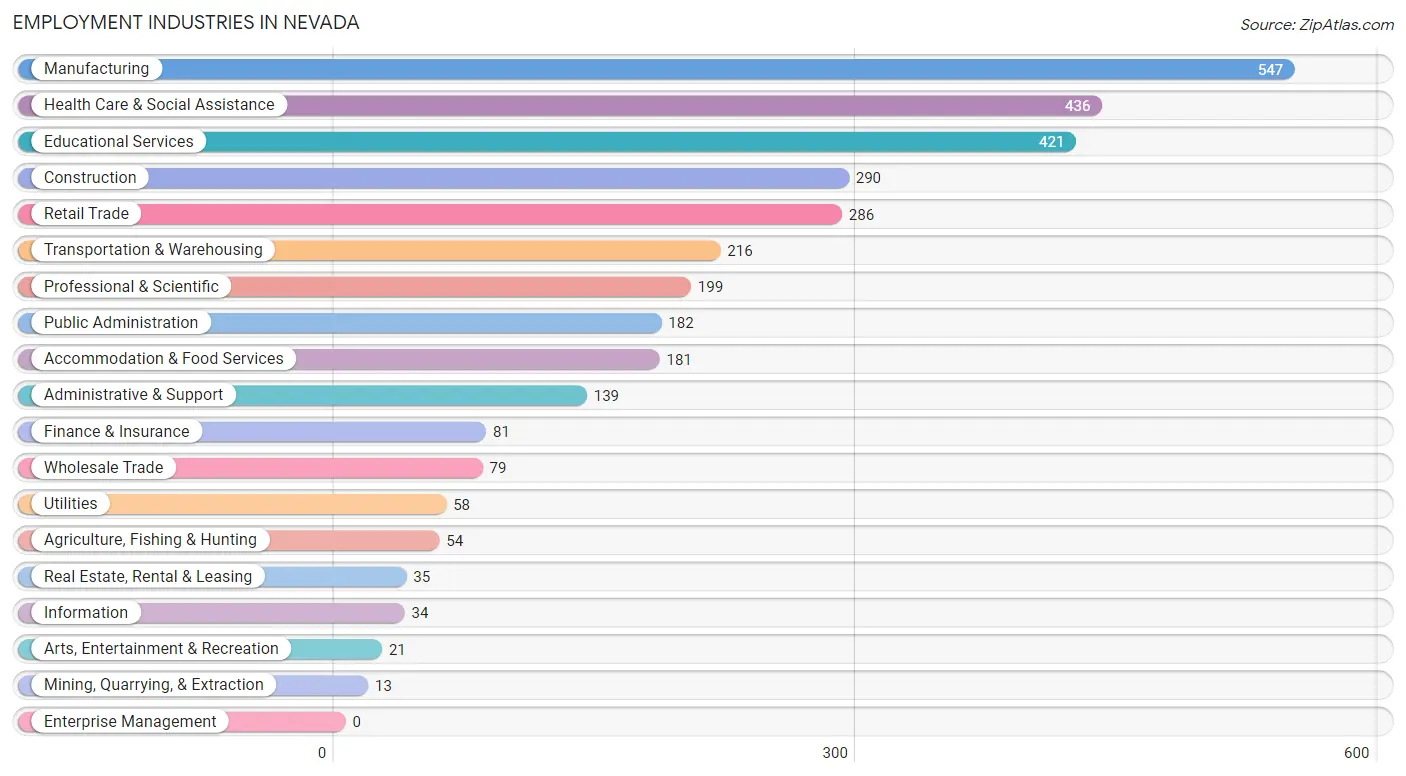
Employment Industries in Nevada
The major employment industries in Nevada include Manufacturing (547 | 15.2%), Health Care & Social Assistance (436 | 12.1%), Educational Services (421 | 11.7%), Construction (290 | 8.1%), and Retail Trade (286 | 8.0%).
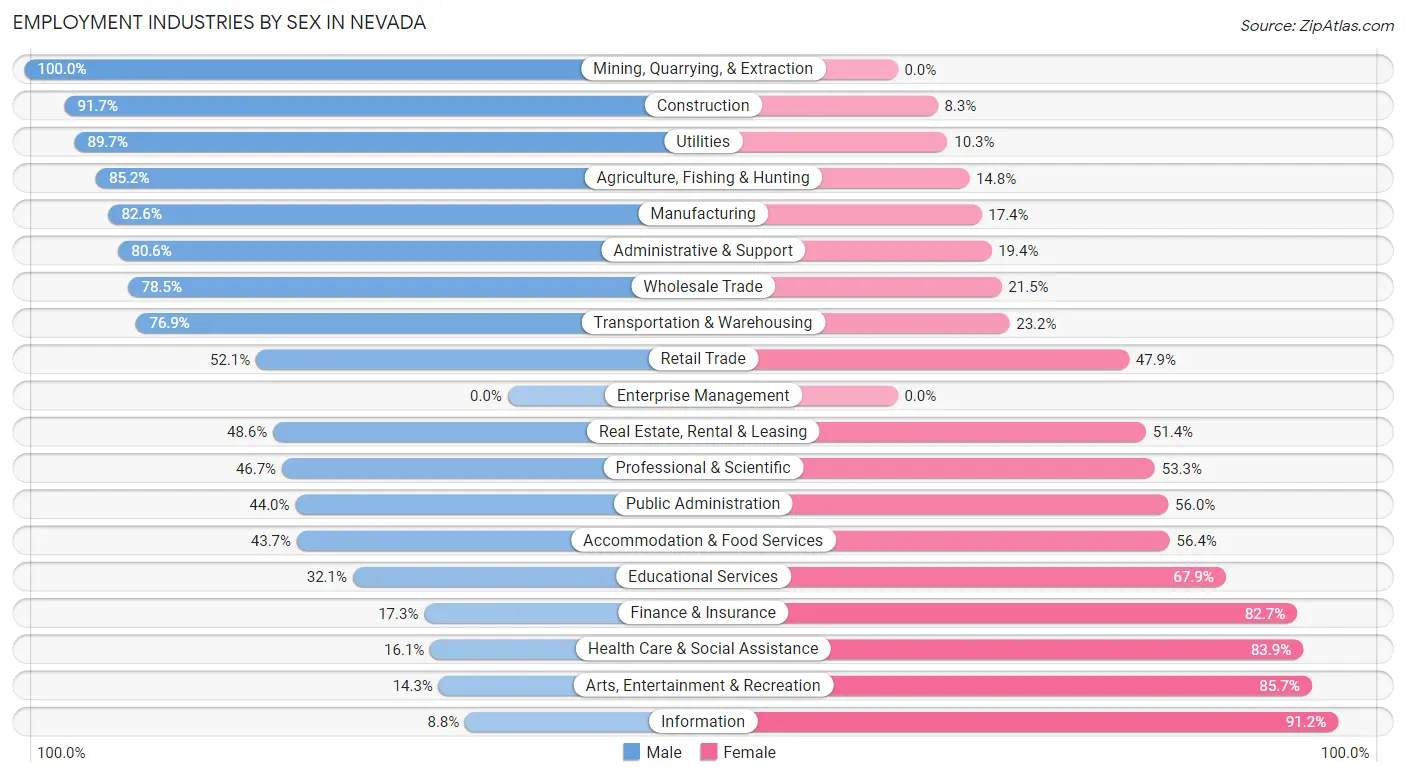
Employment Industries by Sex in Nevada
The Nevada industries that see more men than women are Mining, Quarrying, & Extraction (100.0%), Construction (91.7%), and Utilities (89.7%), whereas the industries that tend to have a higher number of women are Information (91.2%), Arts, Entertainment & Recreation (85.7%), and Health Care & Social Assistance (83.9%).
| Industry | Male | Female |
| Agriculture, Fishing & Hunting | 46 (85.2%) | 8 (14.8%) |
| Mining, Quarrying, & Extraction | 13 (100.0%) | 0 (0.0%) |
| Construction | 266 (91.7%) | 24 (8.3%) |
| Manufacturing | 452 (82.6%) | 95 (17.4%) |
| Wholesale Trade | 62 (78.5%) | 17 (21.5%) |
| Retail Trade | 149 (52.1%) | 137 (47.9%) |
| Transportation & Warehousing | 166 (76.8%) | 50 (23.2%) |
| Utilities | 52 (89.7%) | 6 (10.3%) |
| Information | 3 (8.8%) | 31 (91.2%) |
| Finance & Insurance | 14 (17.3%) | 67 (82.7%) |
| Real Estate, Rental & Leasing | 17 (48.6%) | 18 (51.4%) |
| Professional & Scientific | 93 (46.7%) | 106 (53.3%) |
| Enterprise Management | 0 (0.0%) | 0 (0.0%) |
| Administrative & Support | 112 (80.6%) | 27 (19.4%) |
| Educational Services | 135 (32.1%) | 286 (67.9%) |
| Health Care & Social Assistance | 70 (16.1%) | 366 (83.9%) |
| Arts, Entertainment & Recreation | 3 (14.3%) | 18 (85.7%) |
| Accommodation & Food Services | 79 (43.6%) | 102 (56.4%) |
| Public Administration | 80 (44.0%) | 102 (56.0%) |
| Total | 1,992 (55.5%) | 1,598 (44.5%) |
Education in Nevada
School Enrollment in Nevada
The most common levels of schooling among the 1,668 students in Nevada are elementary school (527 | 31.6%), middle school (463 | 27.8%), and high school (316 | 18.9%).
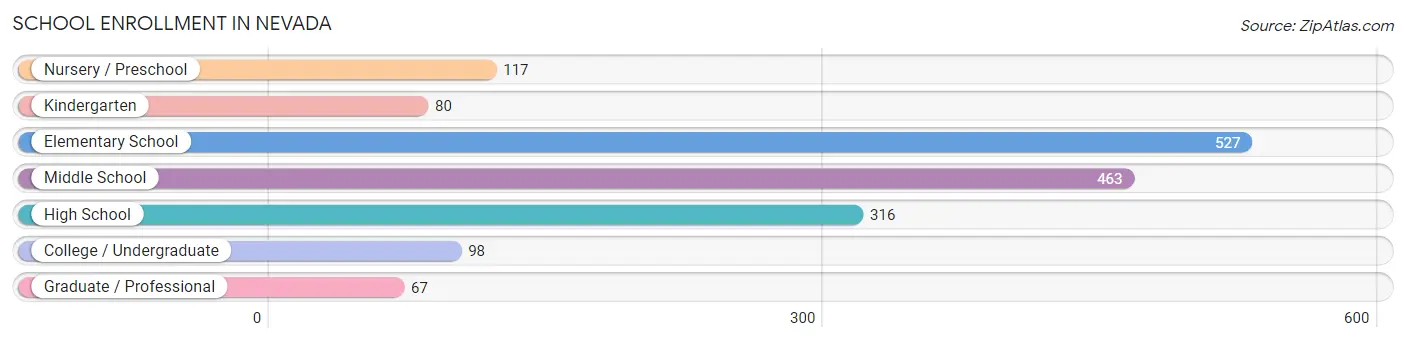
| School Level | # Students | % Students |
| Nursery / Preschool | 117 | 7.0% |
| Kindergarten | 80 | 4.8% |
| Elementary School | 527 | 31.6% |
| Middle School | 463 | 27.8% |
| High School | 316 | 18.9% |
| College / Undergraduate | 98 | 5.9% |
| Graduate / Professional | 67 | 4.0% |
| Total | 1,668 | 100.0% |
School Enrollment by Age by Funding Source in Nevada
Out of a total of 1,668 students who are enrolled in schools in Nevada, 93 (5.6%) attend a private institution, while the remaining 1,575 (94.4%) are enrolled in public schools. The age group of 3 to 4 year olds has the highest likelihood of being enrolled in private schools, with 23 (60.5% in the age bracket) enrolled. Conversely, the age group of 18 to 19 year olds has the lowest likelihood of being enrolled in a private school, with 104 (100.0% in the age bracket) attending a public institution.
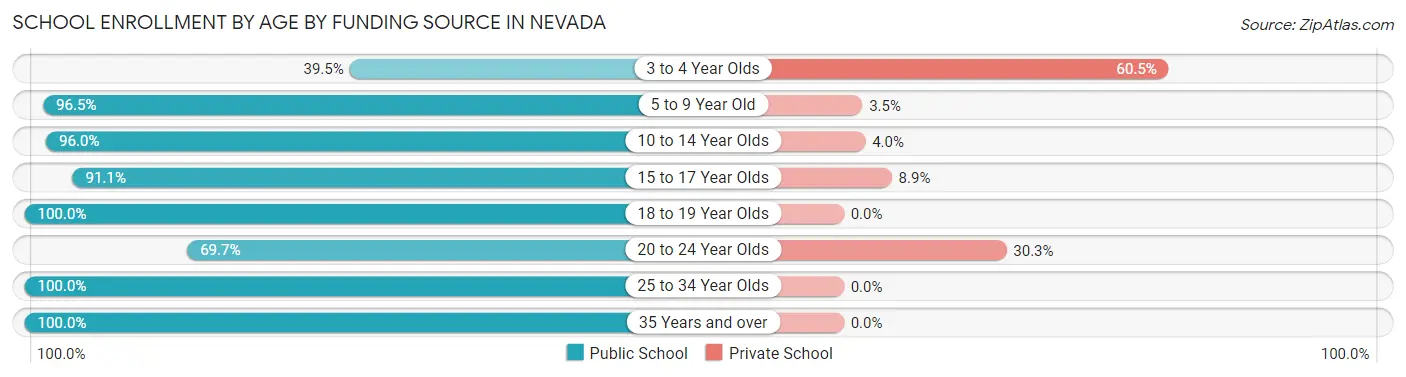
| Age Bracket | Public School | Private School |
| 3 to 4 Year Olds | 15 (39.5%) | 23 (60.5%) |
| 5 to 9 Year Old | 613 (96.5%) | 22 (3.5%) |
| 10 to 14 Year Olds | 527 (96.0%) | 22 (4.0%) |
| 15 to 17 Year Olds | 163 (91.1%) | 16 (8.9%) |
| 18 to 19 Year Olds | 104 (100.0%) | 0 (0.0%) |
| 20 to 24 Year Olds | 23 (69.7%) | 10 (30.3%) |
| 25 to 34 Year Olds | 108 (100.0%) | 0 (0.0%) |
| 35 Years and over | 22 (100.0%) | 0 (0.0%) |
| Total | 1,575 (94.4%) | 93 (5.6%) |
Educational Attainment by Field of Study in Nevada
Business (213 | 13.3%), science & technology (191 | 11.9%), bio, nature & agricultural (175 | 10.9%), education (157 | 9.8%), and arts & humanities (147 | 9.2%) are the most common fields of study among 1,604 individuals in Nevada who have obtained a bachelor's degree or higher.
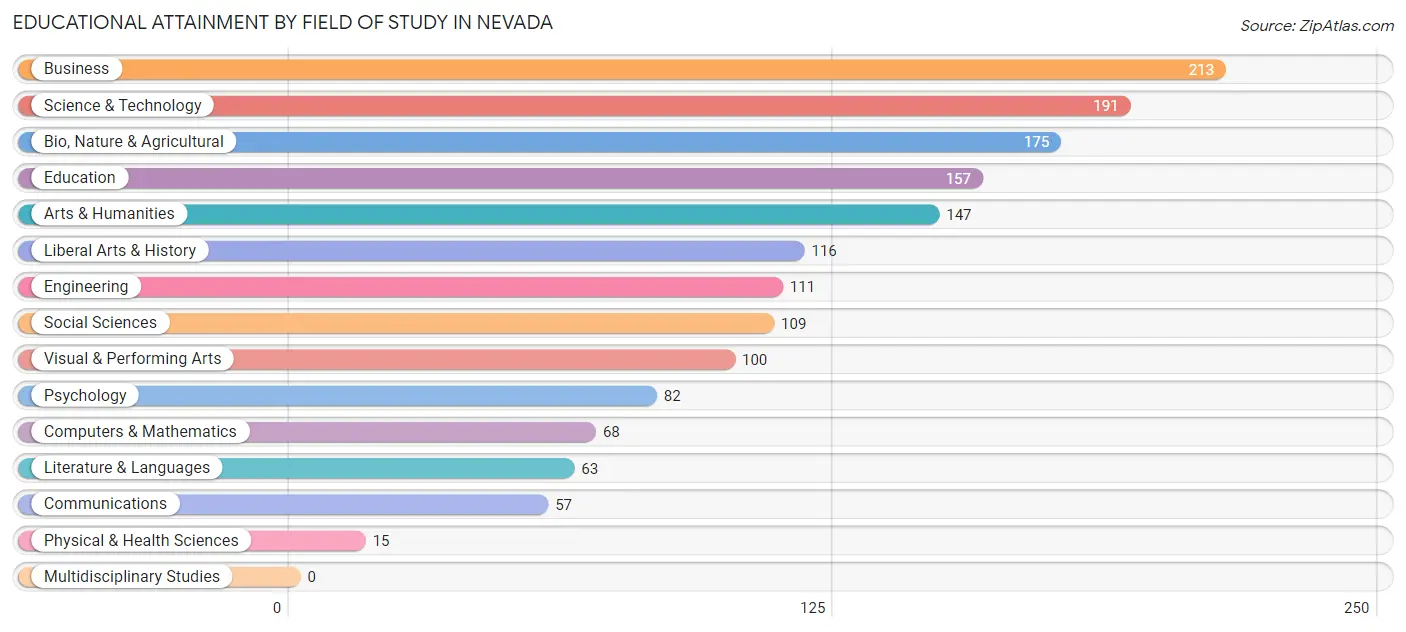
| Field of Study | # Graduates | % Graduates |
| Computers & Mathematics | 68 | 4.2% |
| Bio, Nature & Agricultural | 175 | 10.9% |
| Physical & Health Sciences | 15 | 0.9% |
| Psychology | 82 | 5.1% |
| Social Sciences | 109 | 6.8% |
| Engineering | 111 | 6.9% |
| Multidisciplinary Studies | 0 | 0.0% |
| Science & Technology | 191 | 11.9% |
| Business | 213 | 13.3% |
| Education | 157 | 9.8% |
| Literature & Languages | 63 | 3.9% |
| Liberal Arts & History | 116 | 7.2% |
| Visual & Performing Arts | 100 | 6.2% |
| Communications | 57 | 3.5% |
| Arts & Humanities | 147 | 9.2% |
| Total | 1,604 | 100.0% |
Transportation & Commute in Nevada
Vehicle Availability by Sex in Nevada
The most prevalent vehicle ownership categories in Nevada are males with 2 vehicles (897, accounting for 47.0%) and females with 2 vehicles (789, making up 59.0%).
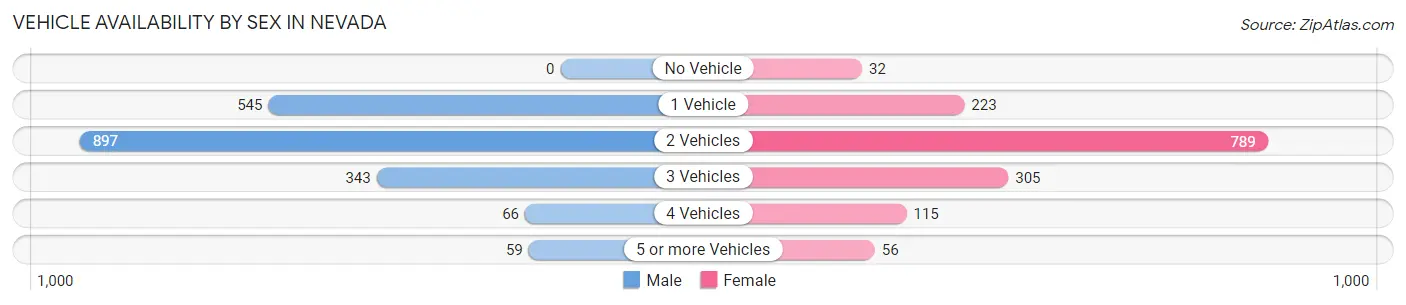
| Vehicles Available | Male | Female |
| No Vehicle | 0 (0.0%) | 32 (2.1%) |
| 1 Vehicle | 545 (28.5%) | 223 (14.7%) |
| 2 Vehicles | 897 (47.0%) | 789 (51.9%) |
| 3 Vehicles | 343 (18.0%) | 305 (20.1%) |
| 4 Vehicles | 66 (3.5%) | 115 (7.6%) |
| 5 or more Vehicles | 59 (3.1%) | 56 (3.7%) |
| Total | 1,910 (100.0%) | 1,520 (100.0%) |
Commute Time in Nevada
The most frequently occuring commute durations in Nevada are 15 to 19 minutes (709 commuters, 21.7%), 5 to 9 minutes (630 commuters, 19.3%), and 10 to 14 minutes (595 commuters, 18.2%).
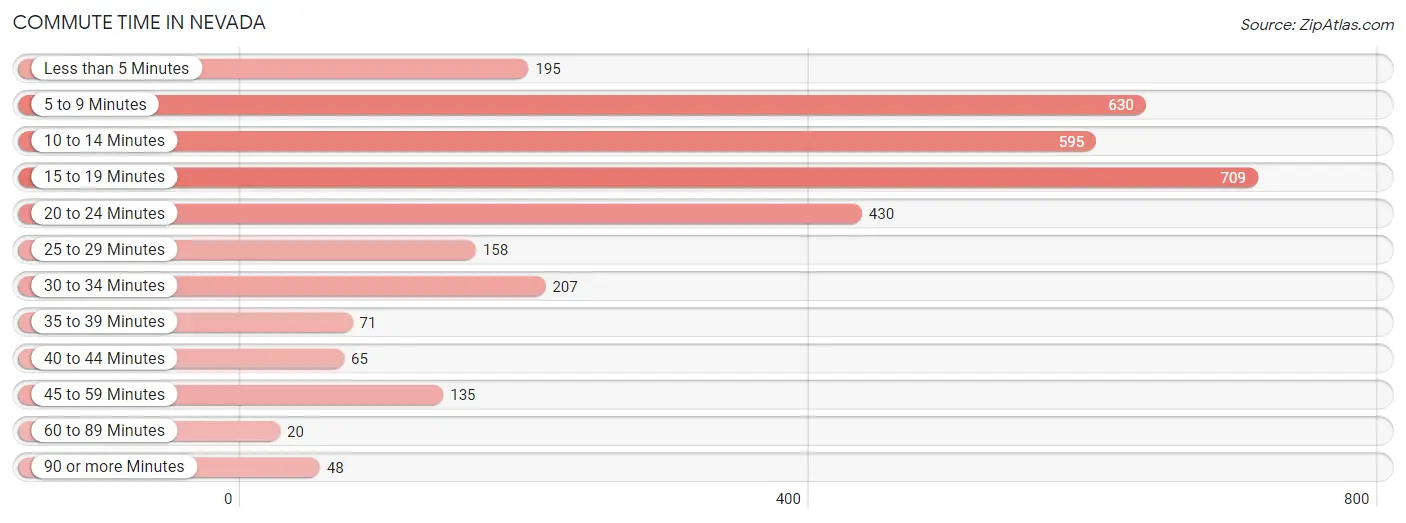
| Commute Time | # Commuters | % Commuters |
| Less than 5 Minutes | 195 | 6.0% |
| 5 to 9 Minutes | 630 | 19.3% |
| 10 to 14 Minutes | 595 | 18.2% |
| 15 to 19 Minutes | 709 | 21.7% |
| 20 to 24 Minutes | 430 | 13.2% |
| 25 to 29 Minutes | 158 | 4.8% |
| 30 to 34 Minutes | 207 | 6.3% |
| 35 to 39 Minutes | 71 | 2.2% |
| 40 to 44 Minutes | 65 | 2.0% |
| 45 to 59 Minutes | 135 | 4.1% |
| 60 to 89 Minutes | 20 | 0.6% |
| 90 or more Minutes | 48 | 1.5% |
Commute Time by Sex in Nevada
The most common commute times in Nevada are 10 to 14 minutes (484 commuters, 26.7%) for males and 15 to 19 minutes (336 commuters, 23.2%) for females.
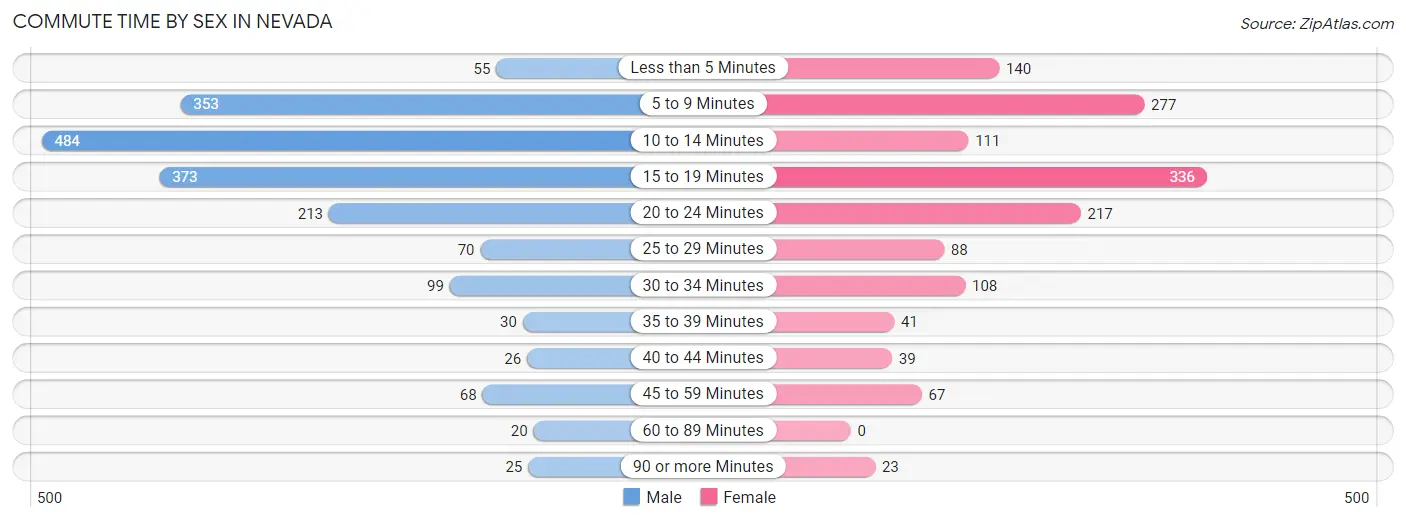
| Commute Time | Male | Female |
| Less than 5 Minutes | 55 (3.0%) | 140 (9.7%) |
| 5 to 9 Minutes | 353 (19.4%) | 277 (19.1%) |
| 10 to 14 Minutes | 484 (26.7%) | 111 (7.7%) |
| 15 to 19 Minutes | 373 (20.5%) | 336 (23.2%) |
| 20 to 24 Minutes | 213 (11.7%) | 217 (15.0%) |
| 25 to 29 Minutes | 70 (3.8%) | 88 (6.1%) |
| 30 to 34 Minutes | 99 (5.4%) | 108 (7.5%) |
| 35 to 39 Minutes | 30 (1.7%) | 41 (2.8%) |
| 40 to 44 Minutes | 26 (1.4%) | 39 (2.7%) |
| 45 to 59 Minutes | 68 (3.7%) | 67 (4.6%) |
| 60 to 89 Minutes | 20 (1.1%) | 0 (0.0%) |
| 90 or more Minutes | 25 (1.4%) | 23 (1.6%) |
Time of Departure to Work by Sex in Nevada
The most frequent times of departure to work in Nevada are 6:30 AM to 6:59 AM (388, 21.4%) for males and 7:30 AM to 7:59 AM (300, 20.7%) for females.

| Time of Departure | Male | Female |
| 12:00 AM to 4:59 AM | 159 (8.8%) | 49 (3.4%) |
| 5:00 AM to 5:29 AM | 63 (3.5%) | 0 (0.0%) |
| 5:30 AM to 5:59 AM | 220 (12.1%) | 30 (2.1%) |
| 6:00 AM to 6:29 AM | 212 (11.7%) | 46 (3.2%) |
| 6:30 AM to 6:59 AM | 388 (21.4%) | 259 (17.9%) |
| 7:00 AM to 7:29 AM | 211 (11.6%) | 275 (19.0%) |
| 7:30 AM to 7:59 AM | 341 (18.8%) | 300 (20.7%) |
| 8:00 AM to 8:29 AM | 56 (3.1%) | 238 (16.5%) |
| 8:30 AM to 8:59 AM | 75 (4.1%) | 93 (6.4%) |
| 9:00 AM to 9:59 AM | 20 (1.1%) | 28 (1.9%) |
| 10:00 AM to 10:59 AM | 0 (0.0%) | 35 (2.4%) |
| 11:00 AM to 11:59 AM | 0 (0.0%) | 14 (1.0%) |
| 12:00 PM to 3:59 PM | 26 (1.4%) | 44 (3.0%) |
| 4:00 PM to 11:59 PM | 45 (2.5%) | 36 (2.5%) |
| Total | 1,816 (100.0%) | 1,447 (100.0%) |
Housing Occupancy in Nevada
Occupancy by Ownership in Nevada
Of the total 3,094 dwellings in Nevada, owner-occupied units account for 2,356 (76.1%), while renter-occupied units make up 738 (23.8%).
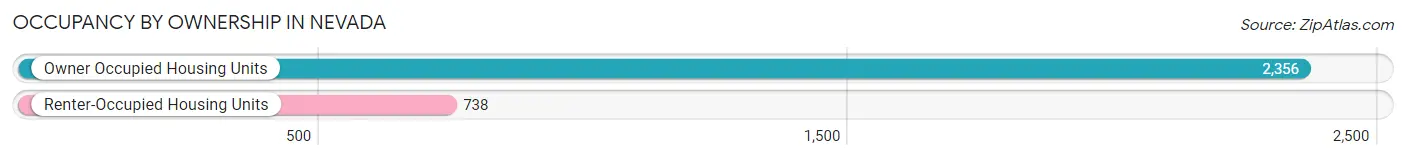
| Occupancy | # Housing Units | % Housing Units |
| Owner Occupied Housing Units | 2,356 | 76.1% |
| Renter-Occupied Housing Units | 738 | 23.8% |
| Total Occupied Housing Units | 3,094 | 100.0% |
Occupancy by Household Size in Nevada
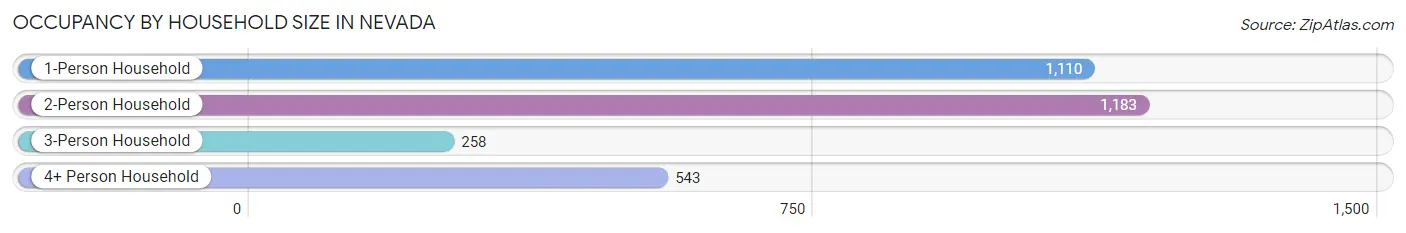
| Household Size | # Housing Units | % Housing Units |
| 1-Person Household | 1,110 | 35.9% |
| 2-Person Household | 1,183 | 38.2% |
| 3-Person Household | 258 | 8.3% |
| 4+ Person Household | 543 | 17.5% |
| Total Housing Units | 3,094 | 100.0% |
Occupancy by Ownership by Household Size in Nevada
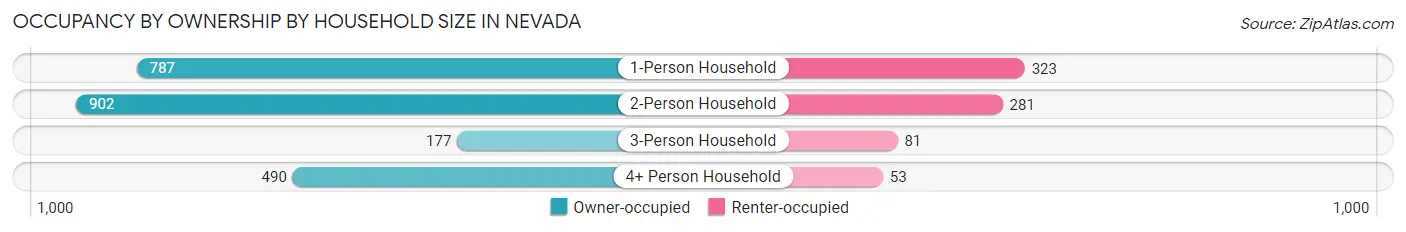
| Household Size | Owner-occupied | Renter-occupied |
| 1-Person Household | 787 (70.9%) | 323 (29.1%) |
| 2-Person Household | 902 (76.2%) | 281 (23.7%) |
| 3-Person Household | 177 (68.6%) | 81 (31.4%) |
| 4+ Person Household | 490 (90.2%) | 53 (9.8%) |
| Total Housing Units | 2,356 (76.1%) | 738 (23.8%) |
Occupancy by Educational Attainment in Nevada
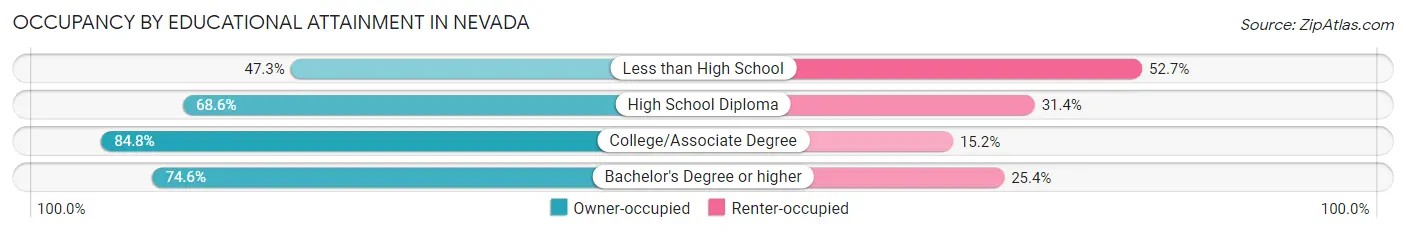
| Household Size | Owner-occupied | Renter-occupied |
| Less than High School | 52 (47.3%) | 58 (52.7%) |
| High School Diploma | 528 (68.6%) | 242 (31.4%) |
| College/Associate Degree | 1,035 (84.8%) | 186 (15.2%) |
| Bachelor's Degree or higher | 741 (74.6%) | 252 (25.4%) |
Occupancy by Age of Householder in Nevada
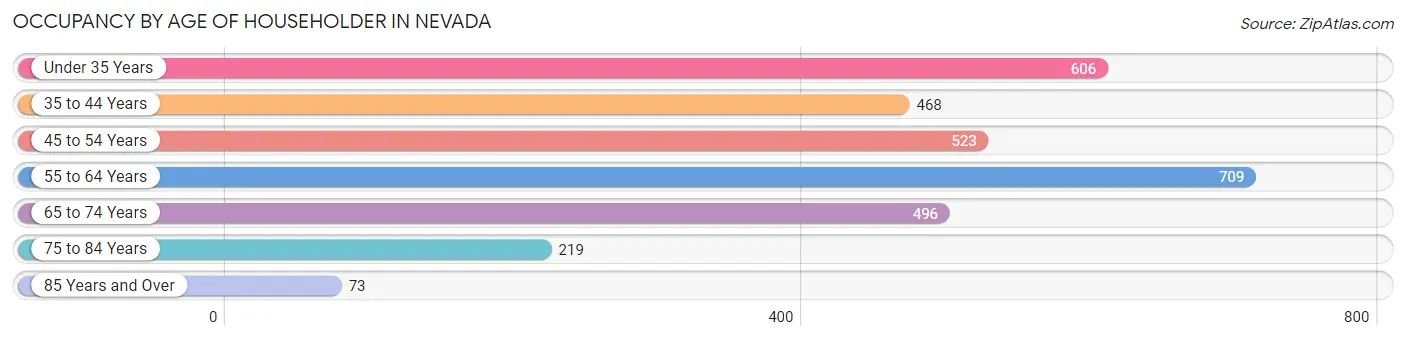
| Age Bracket | # Households | % Households |
| Under 35 Years | 606 | 19.6% |
| 35 to 44 Years | 468 | 15.1% |
| 45 to 54 Years | 523 | 16.9% |
| 55 to 64 Years | 709 | 22.9% |
| 65 to 74 Years | 496 | 16.0% |
| 75 to 84 Years | 219 | 7.1% |
| 85 Years and Over | 73 | 2.4% |
| Total | 3,094 | 100.0% |
Housing Finances in Nevada
Median Income by Occupancy in Nevada
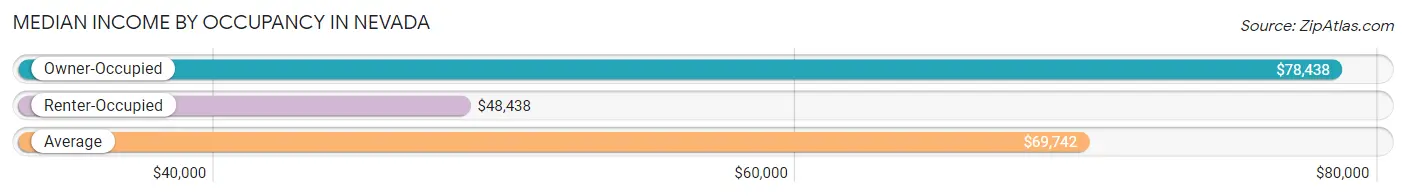
| Occupancy Type | # Households | Median Income |
| Owner-Occupied | 2,356 (76.1%) | $78,438 |
| Renter-Occupied | 738 (23.8%) | $48,438 |
| Average | 3,094 (100.0%) | $69,742 |
Occupancy by Householder Income Bracket in Nevada
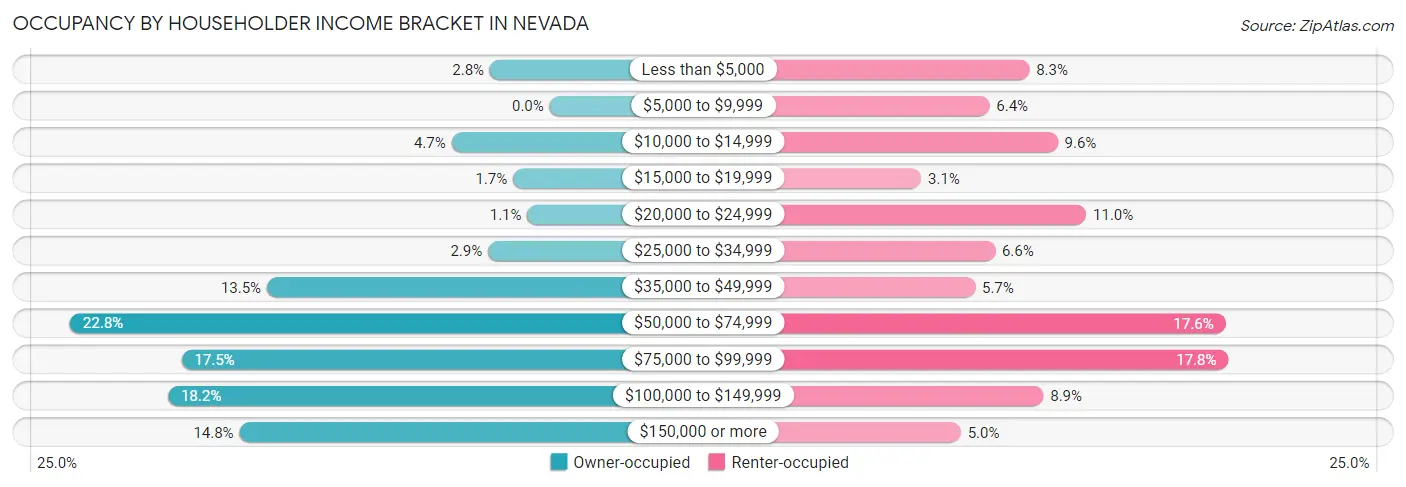
| Income Bracket | Owner-occupied | Renter-occupied |
| Less than $5,000 | 67 (2.8%) | 61 (8.3%) |
| $5,000 to $9,999 | 0 (0.0%) | 47 (6.4%) |
| $10,000 to $14,999 | 110 (4.7%) | 71 (9.6%) |
| $15,000 to $19,999 | 41 (1.7%) | 23 (3.1%) |
| $20,000 to $24,999 | 25 (1.1%) | 81 (11.0%) |
| $25,000 to $34,999 | 69 (2.9%) | 49 (6.6%) |
| $35,000 to $49,999 | 317 (13.5%) | 42 (5.7%) |
| $50,000 to $74,999 | 538 (22.8%) | 130 (17.6%) |
| $75,000 to $99,999 | 413 (17.5%) | 131 (17.7%) |
| $100,000 to $149,999 | 428 (18.2%) | 66 (8.9%) |
| $150,000 or more | 348 (14.8%) | 37 (5.0%) |
| Total | 2,356 (100.0%) | 738 (100.0%) |
Monthly Housing Cost Tiers in Nevada
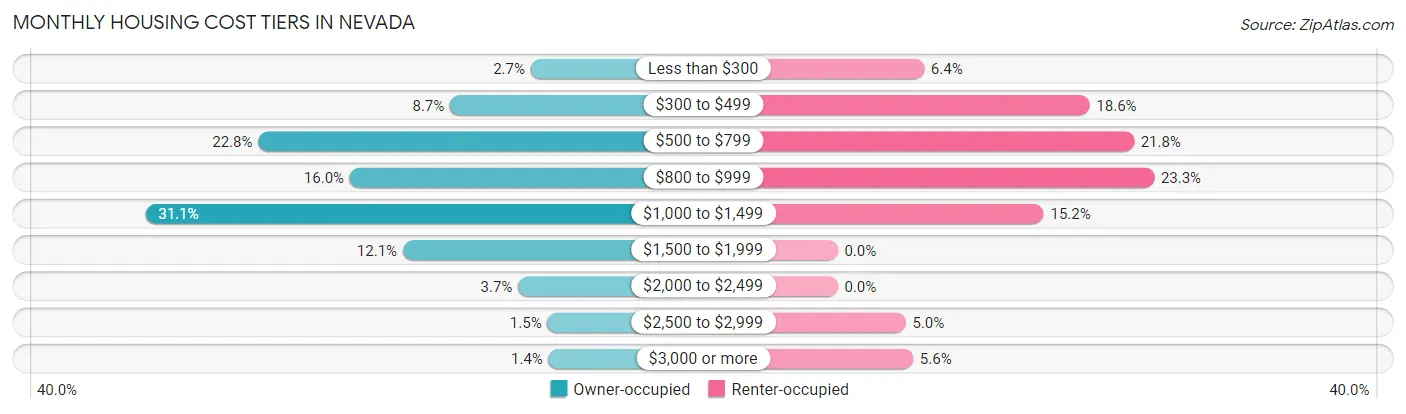
| Monthly Cost | Owner-occupied | Renter-occupied |
| Less than $300 | 64 (2.7%) | 47 (6.4%) |
| $300 to $499 | 204 (8.7%) | 137 (18.6%) |
| $500 to $799 | 537 (22.8%) | 161 (21.8%) |
| $800 to $999 | 378 (16.0%) | 172 (23.3%) |
| $1,000 to $1,499 | 733 (31.1%) | 112 (15.2%) |
| $1,500 to $1,999 | 286 (12.1%) | 0 (0.0%) |
| $2,000 to $2,499 | 86 (3.6%) | 0 (0.0%) |
| $2,500 to $2,999 | 35 (1.5%) | 37 (5.0%) |
| $3,000 or more | 33 (1.4%) | 41 (5.6%) |
| Total | 2,356 (100.0%) | 738 (100.0%) |
Physical Housing Characteristics in Nevada
Housing Structures in Nevada
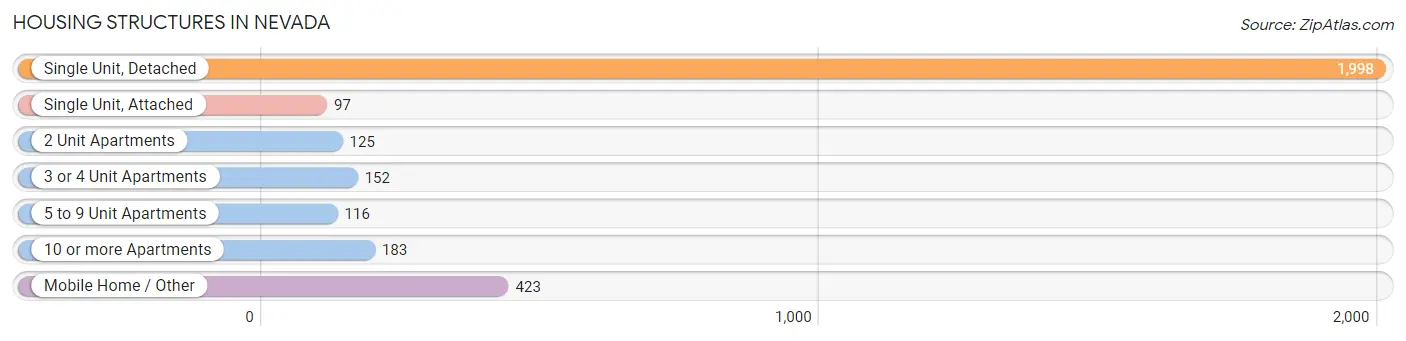
| Structure Type | # Housing Units | % Housing Units |
| Single Unit, Detached | 1,998 | 64.6% |
| Single Unit, Attached | 97 | 3.1% |
| 2 Unit Apartments | 125 | 4.0% |
| 3 or 4 Unit Apartments | 152 | 4.9% |
| 5 to 9 Unit Apartments | 116 | 3.7% |
| 10 or more Apartments | 183 | 5.9% |
| Mobile Home / Other | 423 | 13.7% |
| Total | 3,094 | 100.0% |
Housing Structures by Occupancy in Nevada
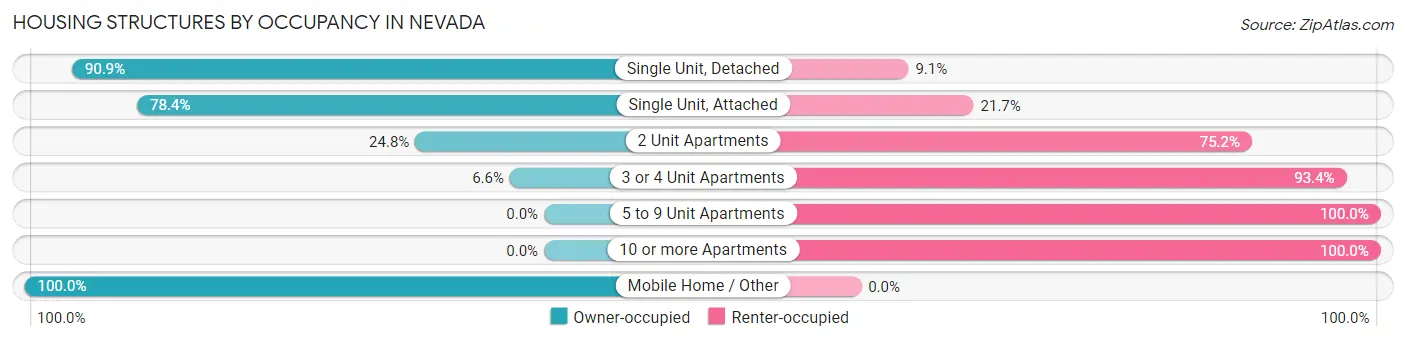
| Structure Type | Owner-occupied | Renter-occupied |
| Single Unit, Detached | 1,816 (90.9%) | 182 (9.1%) |
| Single Unit, Attached | 76 (78.3%) | 21 (21.6%) |
| 2 Unit Apartments | 31 (24.8%) | 94 (75.2%) |
| 3 or 4 Unit Apartments | 10 (6.6%) | 142 (93.4%) |
| 5 to 9 Unit Apartments | 0 (0.0%) | 116 (100.0%) |
| 10 or more Apartments | 0 (0.0%) | 183 (100.0%) |
| Mobile Home / Other | 423 (100.0%) | 0 (0.0%) |
| Total | 2,356 (76.1%) | 738 (23.8%) |
Housing Structures by Number of Rooms in Nevada
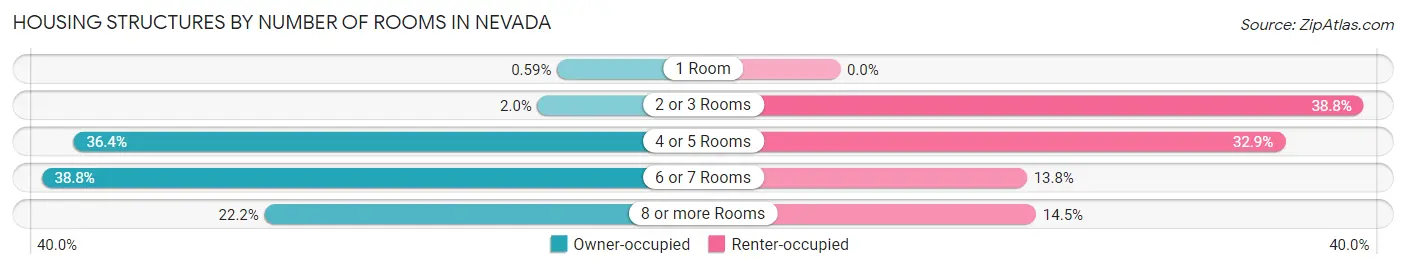
| Number of Rooms | Owner-occupied | Renter-occupied |
| 1 Room | 14 (0.6%) | 0 (0.0%) |
| 2 or 3 Rooms | 48 (2.0%) | 286 (38.8%) |
| 4 or 5 Rooms | 857 (36.4%) | 243 (32.9%) |
| 6 or 7 Rooms | 913 (38.8%) | 102 (13.8%) |
| 8 or more Rooms | 524 (22.2%) | 107 (14.5%) |
| Total | 2,356 (100.0%) | 738 (100.0%) |
Housing Structure by Heating Type in Nevada
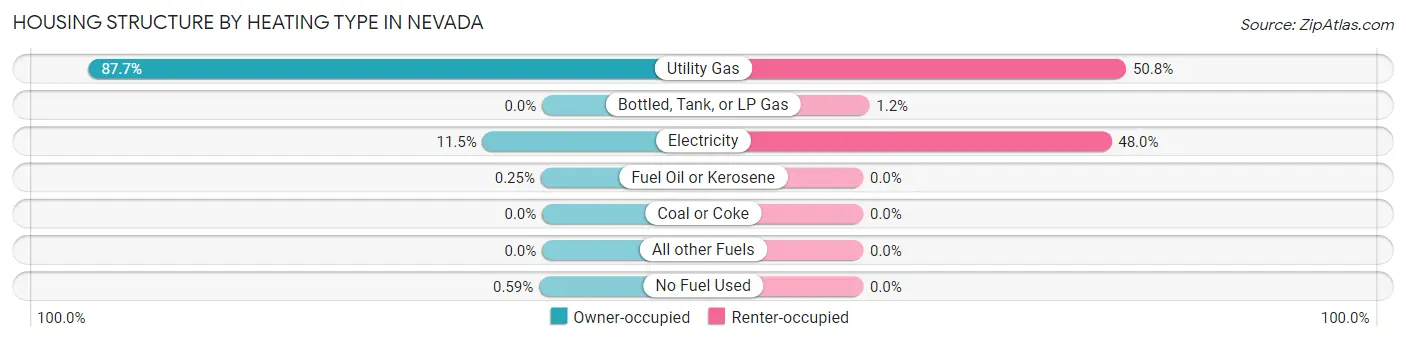
| Heating Type | Owner-occupied | Renter-occupied |
| Utility Gas | 2,065 (87.6%) | 375 (50.8%) |
| Bottled, Tank, or LP Gas | 0 (0.0%) | 9 (1.2%) |
| Electricity | 271 (11.5%) | 354 (48.0%) |
| Fuel Oil or Kerosene | 6 (0.3%) | 0 (0.0%) |
| Coal or Coke | 0 (0.0%) | 0 (0.0%) |
| All other Fuels | 0 (0.0%) | 0 (0.0%) |
| No Fuel Used | 14 (0.6%) | 0 (0.0%) |
| Total | 2,356 (100.0%) | 738 (100.0%) |
Household Vehicle Usage in Nevada
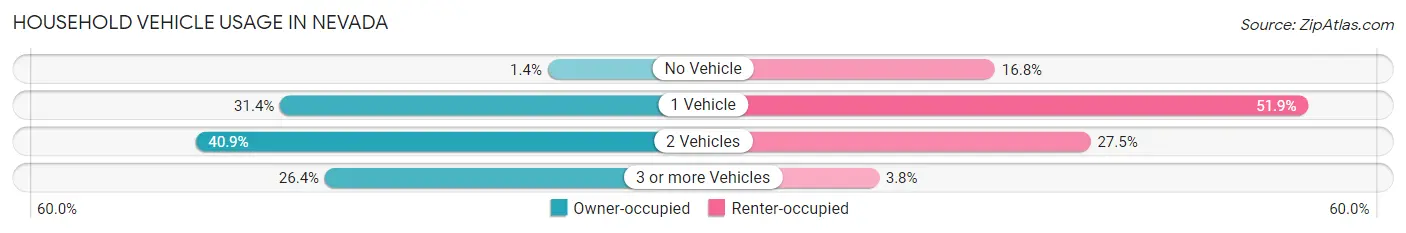
| Vehicles per Household | Owner-occupied | Renter-occupied |
| No Vehicle | 33 (1.4%) | 124 (16.8%) |
| 1 Vehicle | 739 (31.4%) | 383 (51.9%) |
| 2 Vehicles | 963 (40.9%) | 203 (27.5%) |
| 3 or more Vehicles | 621 (26.4%) | 28 (3.8%) |
| Total | 2,356 (100.0%) | 738 (100.0%) |
Real Estate & Mortgages in Nevada
Real Estate and Mortgage Overview in Nevada
| Characteristic | Without Mortgage | With Mortgage |
| Housing Units | 1,050 | 1,306 |
| Median Property Value | $152,400 | $168,100 |
| Median Household Income | $68,299 | $178 |
| Monthly Housing Costs | $619 | $33 |
| Real Estate Taxes | $2,354 | $35 |
Property Value by Mortgage Status in Nevada
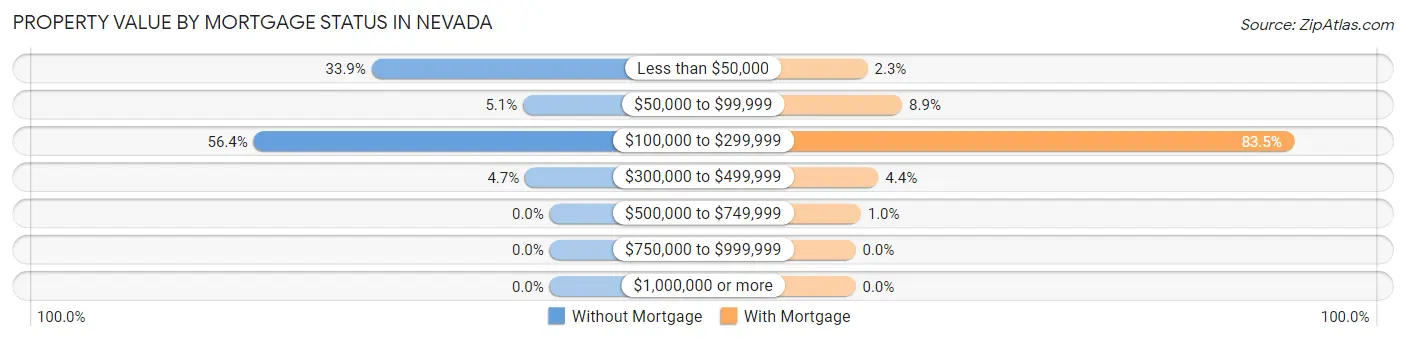
| Property Value | Without Mortgage | With Mortgage |
| Less than $50,000 | 356 (33.9%) | 30 (2.3%) |
| $50,000 to $99,999 | 53 (5.1%) | 116 (8.9%) |
| $100,000 to $299,999 | 592 (56.4%) | 1,090 (83.5%) |
| $300,000 to $499,999 | 49 (4.7%) | 57 (4.4%) |
| $500,000 to $749,999 | 0 (0.0%) | 13 (1.0%) |
| $750,000 to $999,999 | 0 (0.0%) | 0 (0.0%) |
| $1,000,000 or more | 0 (0.0%) | 0 (0.0%) |
| Total | 1,050 (100.0%) | 1,306 (100.0%) |
Household Income by Mortgage Status in Nevada
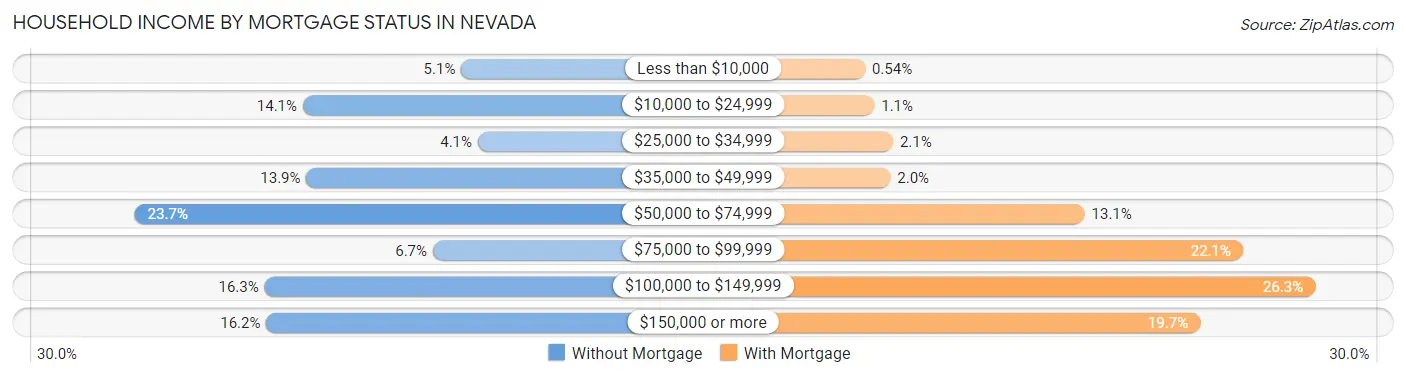
| Household Income | Without Mortgage | With Mortgage |
| Less than $10,000 | 53 (5.1%) | 7 (0.5%) |
| $10,000 to $24,999 | 148 (14.1%) | 14 (1.1%) |
| $25,000 to $34,999 | 43 (4.1%) | 28 (2.1%) |
| $35,000 to $49,999 | 146 (13.9%) | 26 (2.0%) |
| $50,000 to $74,999 | 249 (23.7%) | 171 (13.1%) |
| $75,000 to $99,999 | 70 (6.7%) | 289 (22.1%) |
| $100,000 to $149,999 | 171 (16.3%) | 343 (26.3%) |
| $150,000 or more | 170 (16.2%) | 257 (19.7%) |
| Total | 1,050 (100.0%) | 1,306 (100.0%) |
Property Value to Household Income Ratio in Nevada
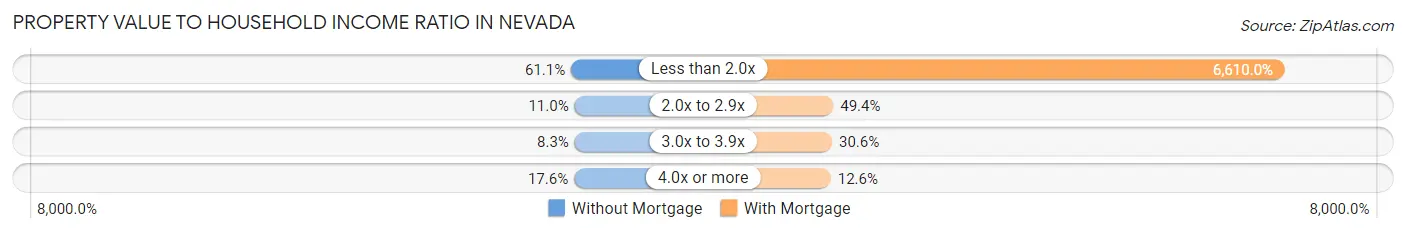
| Value-to-Income Ratio | Without Mortgage | With Mortgage |
| Less than 2.0x | 642 (61.1%) | 86,327 (6,610.0%) |
| 2.0x to 2.9x | 115 (11.0%) | 645 (49.4%) |
| 3.0x to 3.9x | 87 (8.3%) | 400 (30.6%) |
| 4.0x or more | 185 (17.6%) | 165 (12.6%) |
| Total | 1,050 (100.0%) | 1,306 (100.0%) |
Real Estate Taxes by Mortgage Status in Nevada
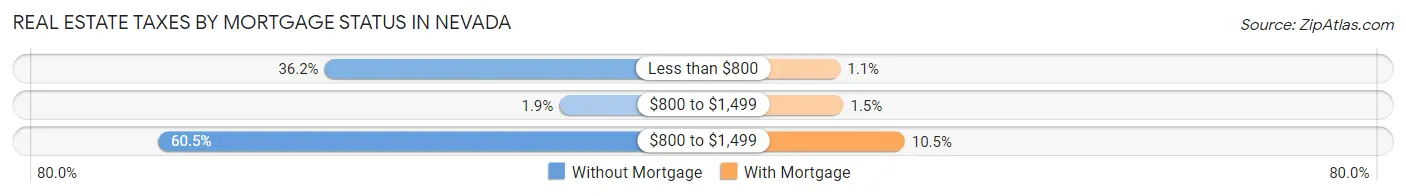
| Property Taxes | Without Mortgage | With Mortgage |
| Less than $800 | 380 (36.2%) | 14 (1.1%) |
| $800 to $1,499 | 20 (1.9%) | 20 (1.5%) |
| $800 to $1,499 | 635 (60.5%) | 137 (10.5%) |
| Total | 1,050 (100.0%) | 1,306 (100.0%) |
Health & Disability in Nevada
Health Insurance Coverage by Age in Nevada
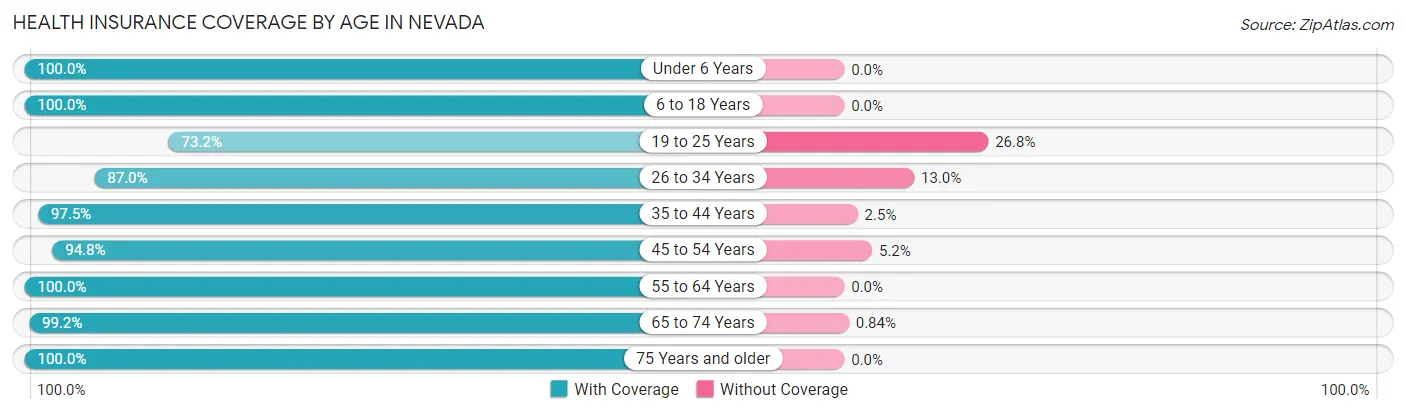
| Age Bracket | With Coverage | Without Coverage |
| Under 6 Years | 431 (100.0%) | 0 (0.0%) |
| 6 to 18 Years | 1,361 (100.0%) | 0 (0.0%) |
| 19 to 25 Years | 259 (73.2%) | 95 (26.8%) |
| 26 to 34 Years | 729 (87.0%) | 109 (13.0%) |
| 35 to 44 Years | 863 (97.5%) | 22 (2.5%) |
| 45 to 54 Years | 733 (94.8%) | 40 (5.2%) |
| 55 to 64 Years | 1,060 (100.0%) | 0 (0.0%) |
| 65 to 74 Years | 711 (99.2%) | 6 (0.8%) |
| 75 Years and older | 401 (100.0%) | 0 (0.0%) |
| Total | 6,548 (96.0%) | 272 (4.0%) |
Health Insurance Coverage by Citizenship Status in Nevada
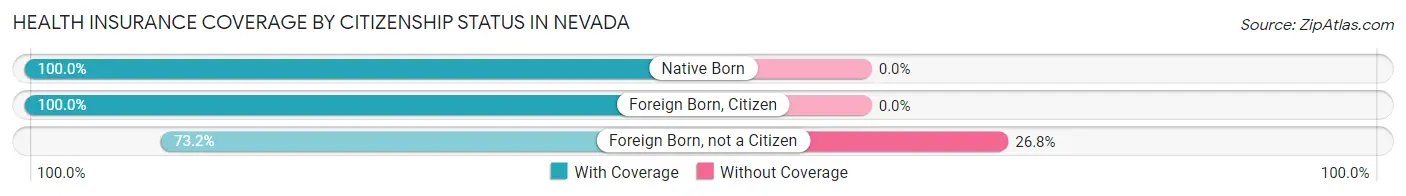
| Citizenship Status | With Coverage | Without Coverage |
| Native Born | 431 (100.0%) | 0 (0.0%) |
| Foreign Born, Citizen | 1,361 (100.0%) | 0 (0.0%) |
| Foreign Born, not a Citizen | 259 (73.2%) | 95 (26.8%) |
Health Insurance Coverage by Household Income in Nevada
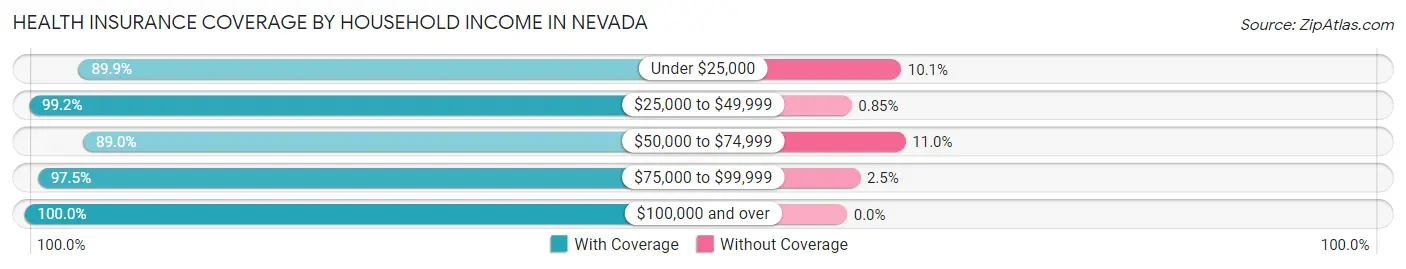
| Household Income | With Coverage | Without Coverage |
| Under $25,000 | 816 (89.9%) | 92 (10.1%) |
| $25,000 to $49,999 | 699 (99.2%) | 6 (0.9%) |
| $50,000 to $74,999 | 1,096 (89.0%) | 135 (11.0%) |
| $75,000 to $99,999 | 1,542 (97.5%) | 39 (2.5%) |
| $100,000 and over | 2,368 (100.0%) | 0 (0.0%) |
Public vs Private Health Insurance Coverage by Age in Nevada
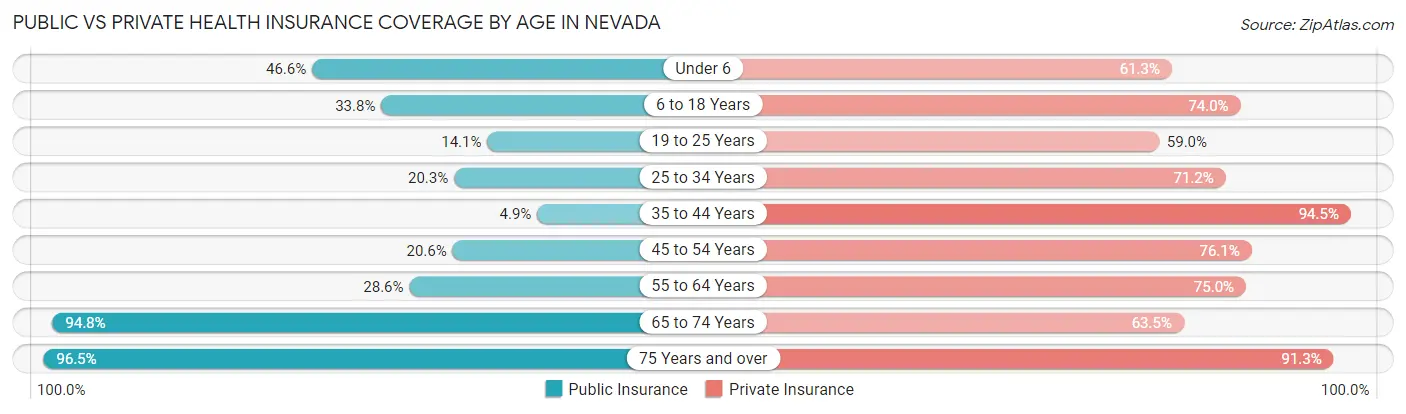
| Age Bracket | Public Insurance | Private Insurance |
| Under 6 | 201 (46.6%) | 264 (61.3%) |
| 6 to 18 Years | 460 (33.8%) | 1,007 (74.0%) |
| 19 to 25 Years | 50 (14.1%) | 209 (59.0%) |
| 25 to 34 Years | 170 (20.3%) | 597 (71.2%) |
| 35 to 44 Years | 43 (4.9%) | 836 (94.5%) |
| 45 to 54 Years | 159 (20.6%) | 588 (76.1%) |
| 55 to 64 Years | 303 (28.6%) | 795 (75.0%) |
| 65 to 74 Years | 680 (94.8%) | 455 (63.5%) |
| 75 Years and over | 387 (96.5%) | 366 (91.3%) |
| Total | 2,453 (36.0%) | 5,117 (75.0%) |
Disability Status by Sex by Age in Nevada
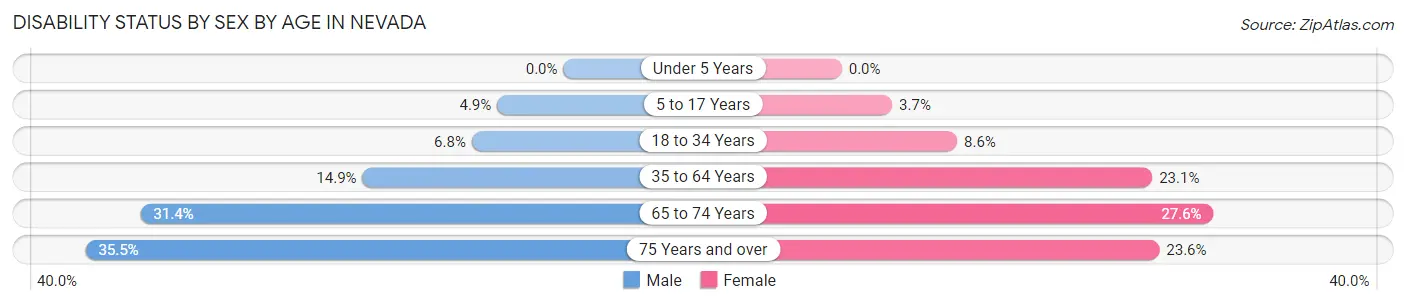
| Age Bracket | Male | Female |
| Under 5 Years | 0 (0.0%) | 0 (0.0%) |
| 5 to 17 Years | 39 (4.9%) | 23 (3.7%) |
| 18 to 34 Years | 50 (6.8%) | 48 (8.6%) |
| 35 to 64 Years | 214 (14.9%) | 296 (23.1%) |
| 65 to 74 Years | 92 (31.4%) | 117 (27.6%) |
| 75 Years and over | 55 (35.5%) | 58 (23.6%) |
Disability Class by Sex by Age in Nevada
Disability Class: Hearing Difficulty
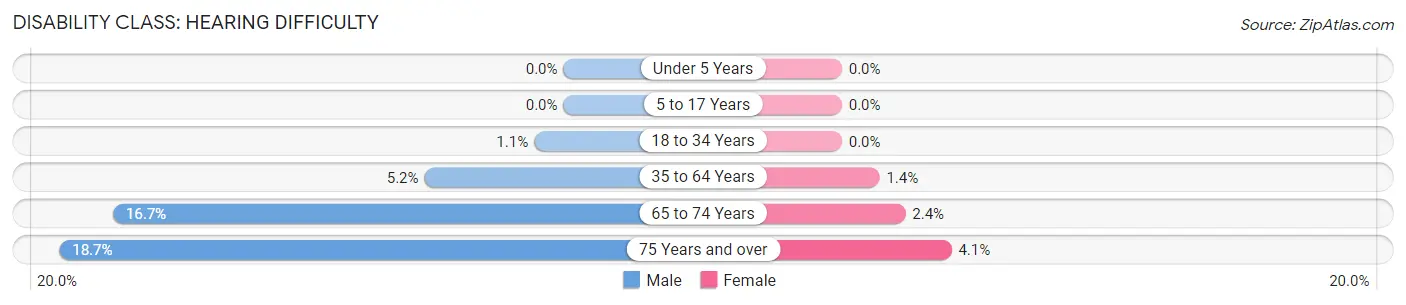
| Age Bracket | Male | Female |
| Under 5 Years | 0 (0.0%) | 0 (0.0%) |
| 5 to 17 Years | 0 (0.0%) | 0 (0.0%) |
| 18 to 34 Years | 8 (1.1%) | 0 (0.0%) |
| 35 to 64 Years | 74 (5.2%) | 18 (1.4%) |
| 65 to 74 Years | 49 (16.7%) | 10 (2.4%) |
| 75 Years and over | 29 (18.7%) | 10 (4.1%) |
Disability Class: Vision Difficulty
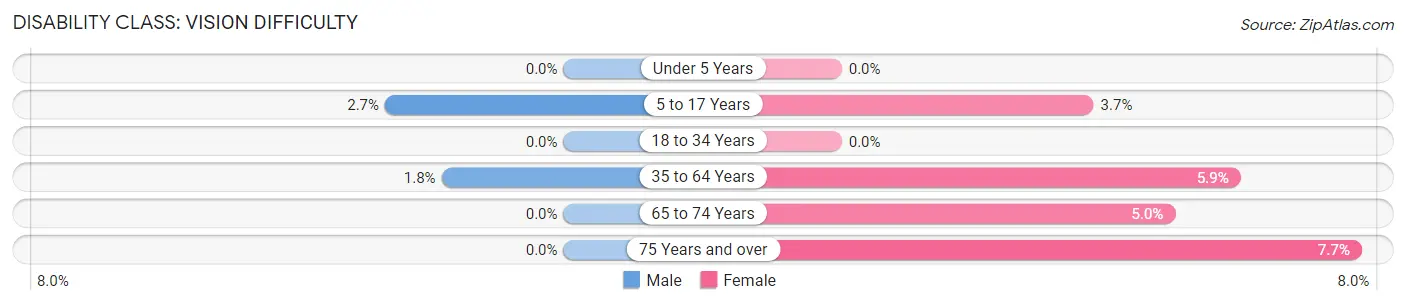
| Age Bracket | Male | Female |
| Under 5 Years | 0 (0.0%) | 0 (0.0%) |
| 5 to 17 Years | 21 (2.6%) | 23 (3.7%) |
| 18 to 34 Years | 0 (0.0%) | 0 (0.0%) |
| 35 to 64 Years | 26 (1.8%) | 76 (5.9%) |
| 65 to 74 Years | 0 (0.0%) | 21 (5.0%) |
| 75 Years and over | 0 (0.0%) | 19 (7.7%) |
Disability Class: Cognitive Difficulty
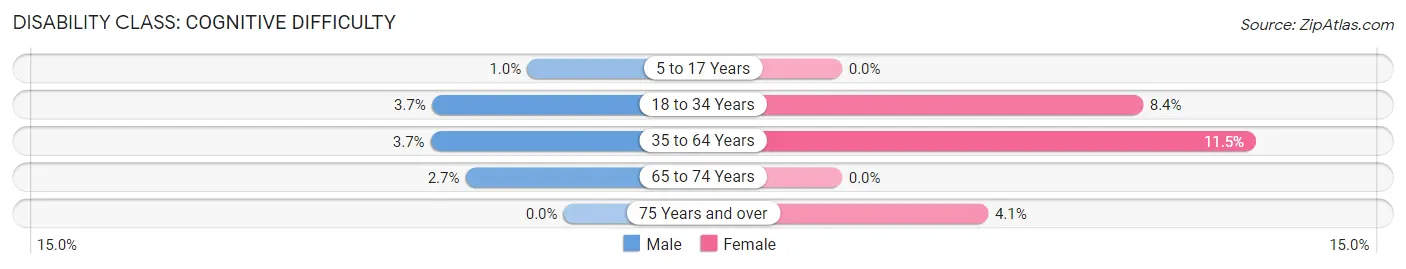
| Age Bracket | Male | Female |
| 5 to 17 Years | 8 (1.0%) | 0 (0.0%) |
| 18 to 34 Years | 27 (3.7%) | 47 (8.4%) |
| 35 to 64 Years | 53 (3.7%) | 148 (11.5%) |
| 65 to 74 Years | 8 (2.7%) | 0 (0.0%) |
| 75 Years and over | 0 (0.0%) | 10 (4.1%) |
Disability Class: Ambulatory Difficulty
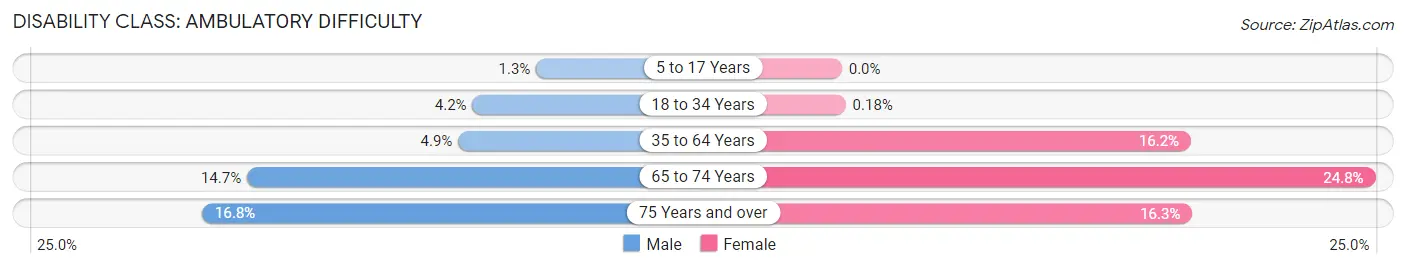
| Age Bracket | Male | Female |
| 5 to 17 Years | 10 (1.3%) | 0 (0.0%) |
| 18 to 34 Years | 31 (4.2%) | 1 (0.2%) |
| 35 to 64 Years | 70 (4.9%) | 208 (16.2%) |
| 65 to 74 Years | 43 (14.7%) | 105 (24.8%) |
| 75 Years and over | 26 (16.8%) | 40 (16.3%) |
Disability Class: Self-Care Difficulty
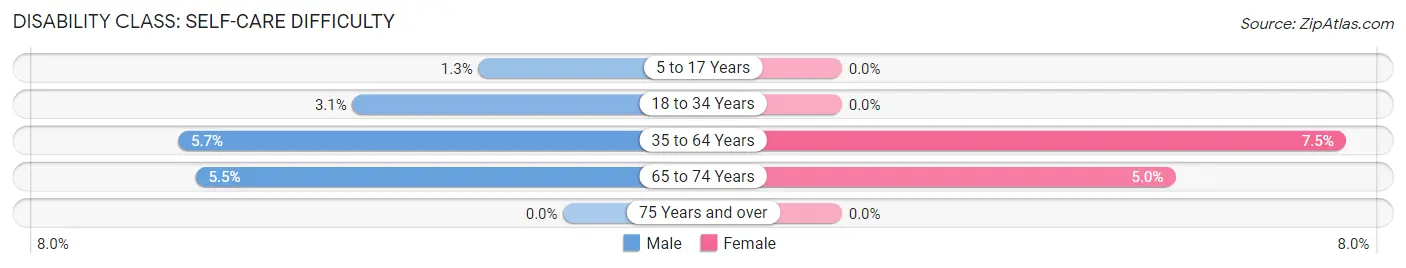
| Age Bracket | Male | Female |
| 5 to 17 Years | 10 (1.3%) | 0 (0.0%) |
| 18 to 34 Years | 23 (3.1%) | 0 (0.0%) |
| 35 to 64 Years | 82 (5.7%) | 96 (7.5%) |
| 65 to 74 Years | 16 (5.5%) | 21 (5.0%) |
| 75 Years and over | 0 (0.0%) | 0 (0.0%) |
Technology Access in Nevada
Computing Device Access in Nevada
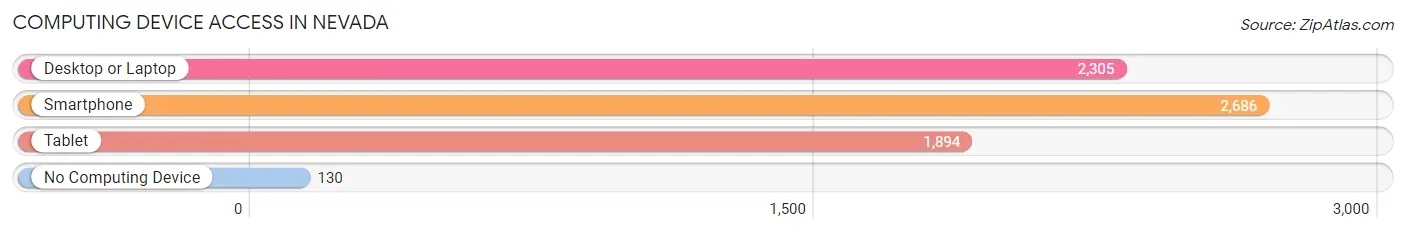
| Device Type | # Households | % Households |
| Desktop or Laptop | 2,305 | 74.5% |
| Smartphone | 2,686 | 86.8% |
| Tablet | 1,894 | 61.2% |
| No Computing Device | 130 | 4.2% |
| Total | 3,094 | 100.0% |
Internet Access in Nevada
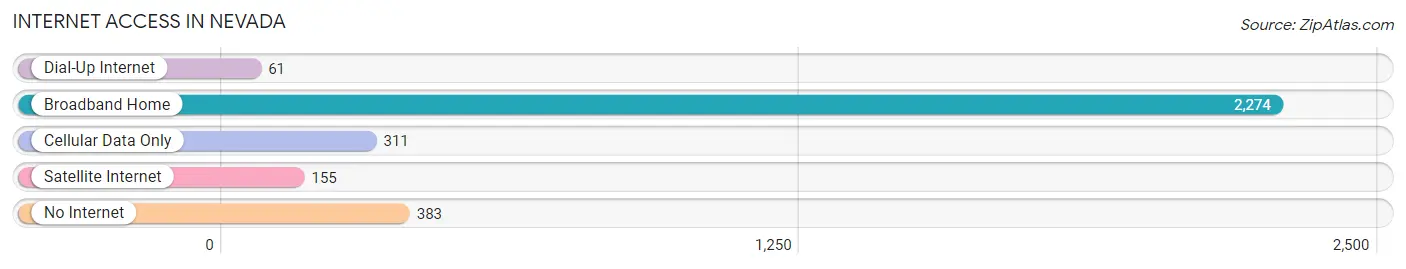
| Internet Type | # Households | % Households |
| Dial-Up Internet | 61 | 2.0% |
| Broadband Home | 2,274 | 73.5% |
| Cellular Data Only | 311 | 10.1% |
| Satellite Internet | 155 | 5.0% |
| No Internet | 383 | 12.4% |
| Total | 3,094 | 100.0% |
Nevada Summary
Nevada, Iowa is a small city located in Story County, Iowa, United States. It is situated in the central part of the state, approximately 30 miles north of Des Moines. The city has a population of 6,798 as of the 2010 census, making it the largest city in Story County.
History
The area that is now Nevada was first settled in 1854 by a group of settlers from Ohio. The town was originally named “Ralston” after one of the settlers, but was later changed to “Nevada” in 1856. The name was chosen to honor the nearby Nevada Mine, which was a major source of lead ore in the area.
The city was officially incorporated in 1869 and quickly grew to become a major agricultural center in the region. The city was also home to a number of manufacturing businesses, including a flour mill, a brickyard, and a furniture factory.
Geography
Nevada is located in central Iowa, approximately 30 miles north of Des Moines. The city is situated in the rolling hills of Story County, with the South Skunk River running through the city. The city has a total area of 4.2 square miles, all of which is land.
The city has a humid continental climate, with hot, humid summers and cold, snowy winters. The average temperature in the summer is around 75 degrees Fahrenheit, while the average temperature in the winter is around 25 degrees Fahrenheit.
Economy
The economy of Nevada is largely based on agriculture and manufacturing. The city is home to a number of agricultural businesses, including a large hog farm and a number of grain elevators. The city is also home to a number of manufacturing businesses, including a furniture factory, a brickyard, and a flour mill.
The city is also home to a number of retail businesses, including a number of restaurants, grocery stores, and other shops. The city is also home to a number of service businesses, including a number of medical offices and a number of law firms.
Demographics
As of the 2010 census, the population of Nevada was 6,798. The city has a population density of 1,637 people per square mile. The racial makeup of the city is 91.3% White, 4.2% African American, 0.5% Native American, 0.7% Asian, 0.1% Pacific Islander, 1.2% from other races, and 2.1% from two or more races.
The median household income in Nevada is $45,945, and the median family income is $54,917. The per capita income in the city is $21,945. The poverty rate in the city is 11.3%.
Conclusion
Nevada, Iowa is a small city located in Story County, Iowa, United States. It is situated in the central part of the state, approximately 30 miles north of Des Moines. The city has a population of 6,798 as of the 2010 census, making it the largest city in Story County. The economy of Nevada is largely based on agriculture and manufacturing, and the city is home to a number of retail and service businesses. The racial makeup of the city is 91.3% White, 4.2% African American, 0.5% Native American, 0.7% Asian, 0.1% Pacific Islander, 1.2% from other races, and 2.1% from two or more races. The median household income in Nevada is $45,945, and the median family income is $54,917. The per capita income in the city is $21,945. The poverty rate in the city is 11.3%.
Common Questions
What is Per Capita Income in Nevada?
Per Capita income in Nevada is $47,535.
What is the Median Family Income in Nevada?
Median Family Income in Nevada is $95,034.
What is the Median Household income in Nevada?
Median Household Income in Nevada is $69,742.
What is Income or Wage Gap in Nevada?
Income or Wage Gap in Nevada is 24.9%.
Women in Nevada earn 75.1 cents for every dollar earned by a man.
What is Inequality or Gini Index in Nevada?
Inequality or Gini Index in Nevada is 0.52.
What is the Total Population of Nevada?
Total Population of Nevada is 6,933.
What is the Total Male Population of Nevada?
Total Male Population of Nevada is 3,673.
What is the Total Female Population of Nevada?
Total Female Population of Nevada is 3,260.
What is the Ratio of Males per 100 Females in Nevada?
There are 112.67 Males per 100 Females in Nevada.
What is the Ratio of Females per 100 Males in Nevada?
There are 88.76 Females per 100 Males in Nevada.
What is the Median Population Age in Nevada?
Median Population Age in Nevada is 40.9 Years.
What is the Average Family Size in Nevada
Average Family Size in Nevada is 3.0 People.
What is the Average Household Size in Nevada
Average Household Size in Nevada is 2.2 People.
How Large is the Labor Force in Nevada?
There are 3,655 People in the Labor Forcein in Nevada.
What is the Percentage of People in the Labor Force in Nevada?
68.3% of People are in the Labor Force in Nevada.
What is the Unemployment Rate in Nevada?
Unemployment Rate in Nevada is 1.8%.