West Liberty, IA Map & Demographics
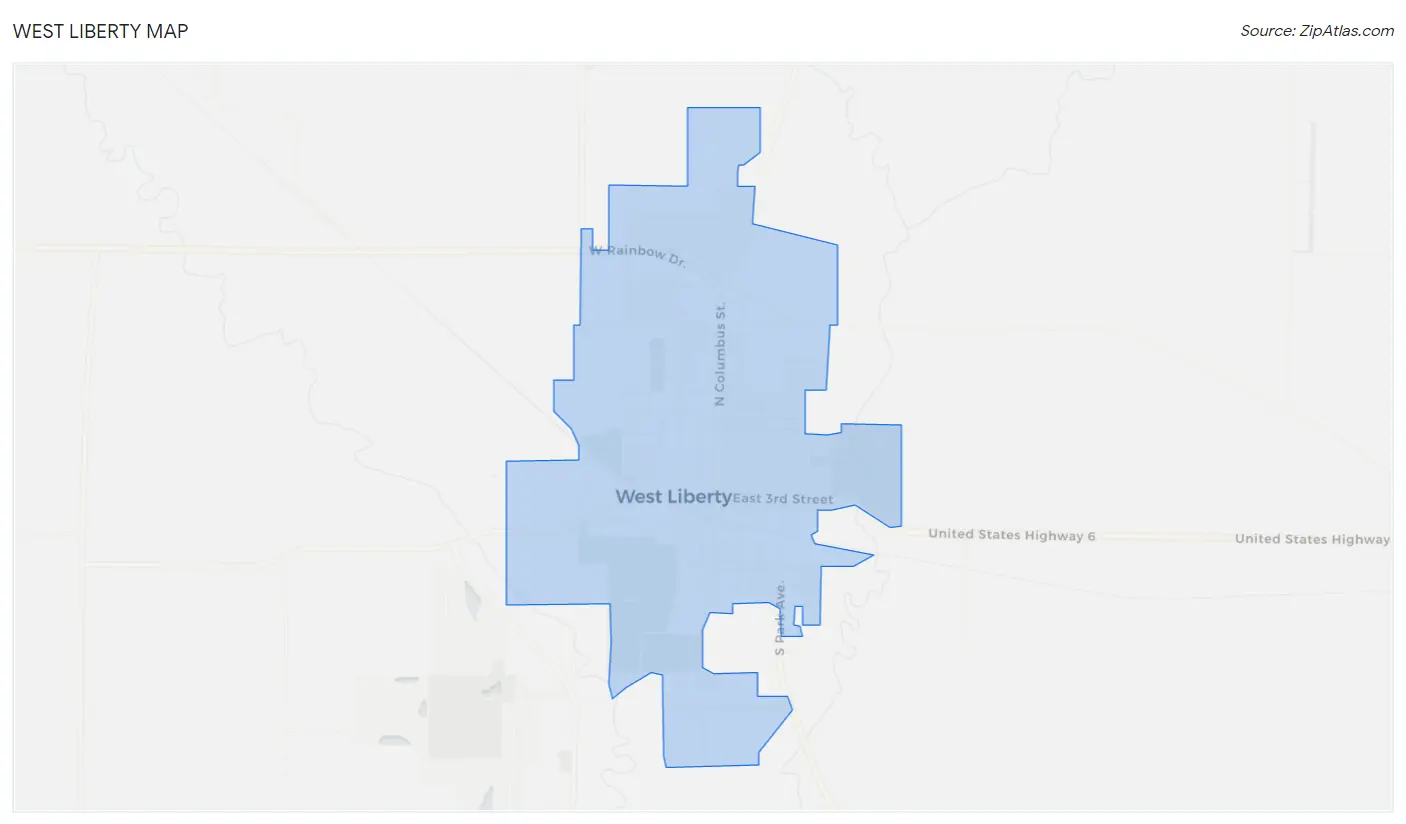
West Liberty Map
West Liberty Overview
$25,783
PER CAPITA INCOME
$73,456
AVG FAMILY INCOME
$63,910
AVG HOUSEHOLD INCOME
6.4%
WAGE / INCOME GAP [ % ]
93.6¢/ $1
WAGE / INCOME GAP [ $ ]
0.32
INEQUALITY / GINI INDEX
3,821
TOTAL POPULATION
1,901
MALE POPULATION
1,920
FEMALE POPULATION
99.01
MALES / 100 FEMALES
101.00
FEMALES / 100 MALES
33.5
MEDIAN AGE
3.6
AVG FAMILY SIZE
2.9
AVG HOUSEHOLD SIZE
2,145
LABOR FORCE [ PEOPLE ]
73.6%
PERCENT IN LABOR FORCE
4.2%
UNEMPLOYMENT RATE
West Liberty Zip Codes
West Liberty Area Codes
Income in West Liberty
Income Overview in West Liberty
Per Capita Income in West Liberty is $25,783, while median incomes of families and households are $73,456 and $63,910 respectively.
| Characteristic | Number | Measure |
| Per Capita Income | 3,821 | $25,783 |
| Median Family Income | 845 | $73,456 |
| Mean Family Income | 845 | $84,527 |
| Median Household Income | 1,315 | $63,910 |
| Mean Household Income | 1,315 | $70,988 |
| Income Deficit | 845 | $0 |
| Wage / Income Gap (%) | 3,821 | 6.38% |
| Wage / Income Gap ($) | 3,821 | 93.62¢ per $1 |
| Gini / Inequality Index | 3,821 | 0.32 |
Earnings by Sex in West Liberty
Average Earnings in West Liberty are $36,285, $35,564 for men and $37,989 for women, a difference of 6.4%.
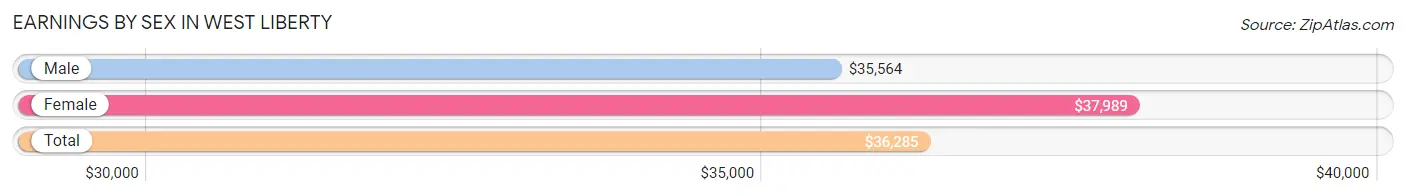
| Sex | Number | Average Earnings |
| Male | 1,095 (51.9%) | $35,564 |
| Female | 1,015 (48.1%) | $37,989 |
| Total | 2,110 (100.0%) | $36,285 |
Earnings by Sex by Income Bracket in West Liberty
The most common earnings brackets in West Liberty are $30,000 to $34,999 for men (232 | 21.2%) and $55,000 to $64,999 for women (200 | 19.7%).
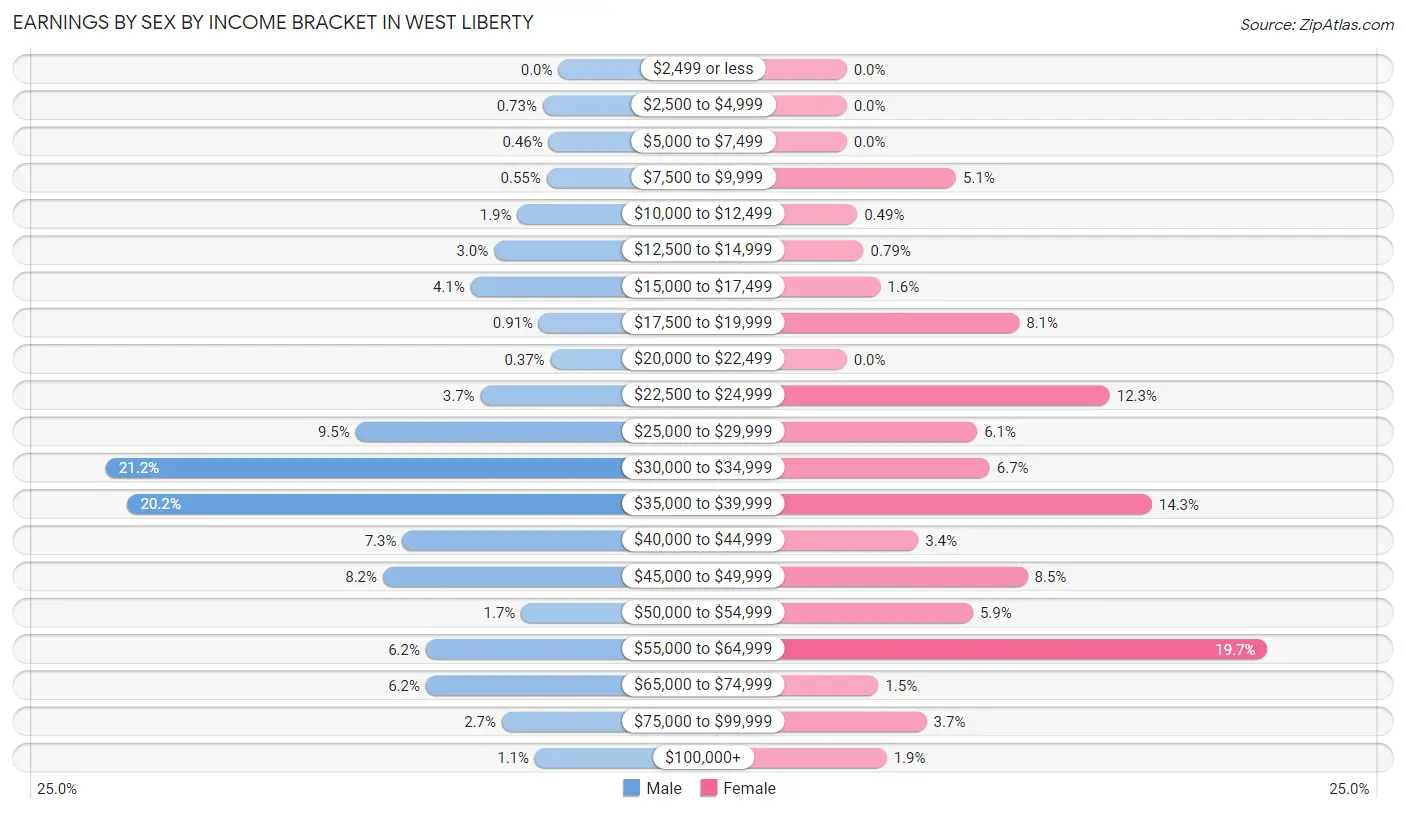
| Income | Male | Female |
| $2,499 or less | 0 (0.0%) | 0 (0.0%) |
| $2,500 to $4,999 | 8 (0.7%) | 0 (0.0%) |
| $5,000 to $7,499 | 5 (0.5%) | 0 (0.0%) |
| $7,500 to $9,999 | 6 (0.5%) | 52 (5.1%) |
| $10,000 to $12,499 | 21 (1.9%) | 5 (0.5%) |
| $12,500 to $14,999 | 33 (3.0%) | 8 (0.8%) |
| $15,000 to $17,499 | 45 (4.1%) | 16 (1.6%) |
| $17,500 to $19,999 | 10 (0.9%) | 82 (8.1%) |
| $20,000 to $22,499 | 4 (0.4%) | 0 (0.0%) |
| $22,500 to $24,999 | 40 (3.6%) | 125 (12.3%) |
| $25,000 to $29,999 | 104 (9.5%) | 62 (6.1%) |
| $30,000 to $34,999 | 232 (21.2%) | 68 (6.7%) |
| $35,000 to $39,999 | 221 (20.2%) | 145 (14.3%) |
| $40,000 to $44,999 | 80 (7.3%) | 34 (3.4%) |
| $45,000 to $49,999 | 90 (8.2%) | 86 (8.5%) |
| $50,000 to $54,999 | 19 (1.7%) | 60 (5.9%) |
| $55,000 to $64,999 | 68 (6.2%) | 200 (19.7%) |
| $65,000 to $74,999 | 68 (6.2%) | 15 (1.5%) |
| $75,000 to $99,999 | 29 (2.6%) | 38 (3.7%) |
| $100,000+ | 12 (1.1%) | 19 (1.9%) |
| Total | 1,095 (100.0%) | 1,015 (100.0%) |
Earnings by Sex by Educational Attainment in West Liberty
Average earnings in West Liberty are $36,047 for men and $40,288 for women, a difference of 10.5%. Men with an educational attainment of bachelor's degree enjoy the highest average annual earnings of $69,432, while those with college or associate's degree education earn the least with $33,472. Women with an educational attainment of graduate degree earn the most with the average annual earnings of $59,850, while those with less than high school education have the smallest earnings of $30,603.
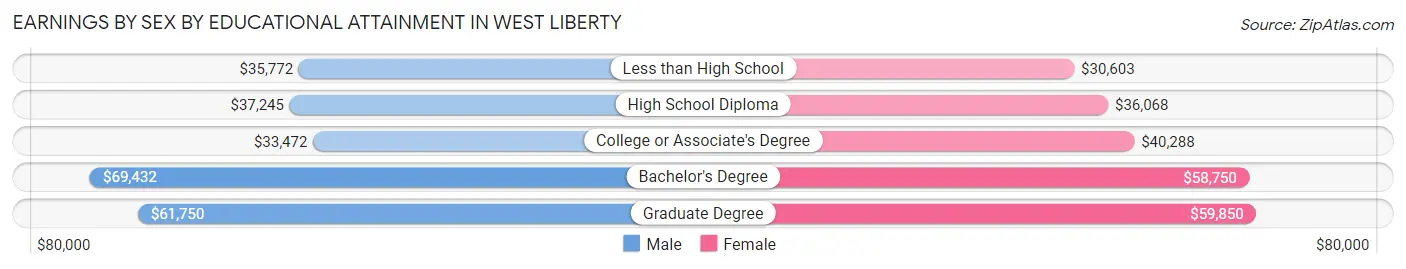
| Educational Attainment | Male Income | Female Income |
| Less than High School | $35,772 | $30,603 |
| High School Diploma | $37,245 | $36,068 |
| College or Associate's Degree | $33,472 | $40,288 |
| Bachelor's Degree | $69,432 | $58,750 |
| Graduate Degree | $61,750 | $59,850 |
| Total | $36,047 | $40,288 |
Family Income in West Liberty
Family Income Brackets in West Liberty
According to the West Liberty family income data, there are 315 families falling into the $50,000 to $74,999 income range, which is the most common income bracket and makes up 37.3% of all families.
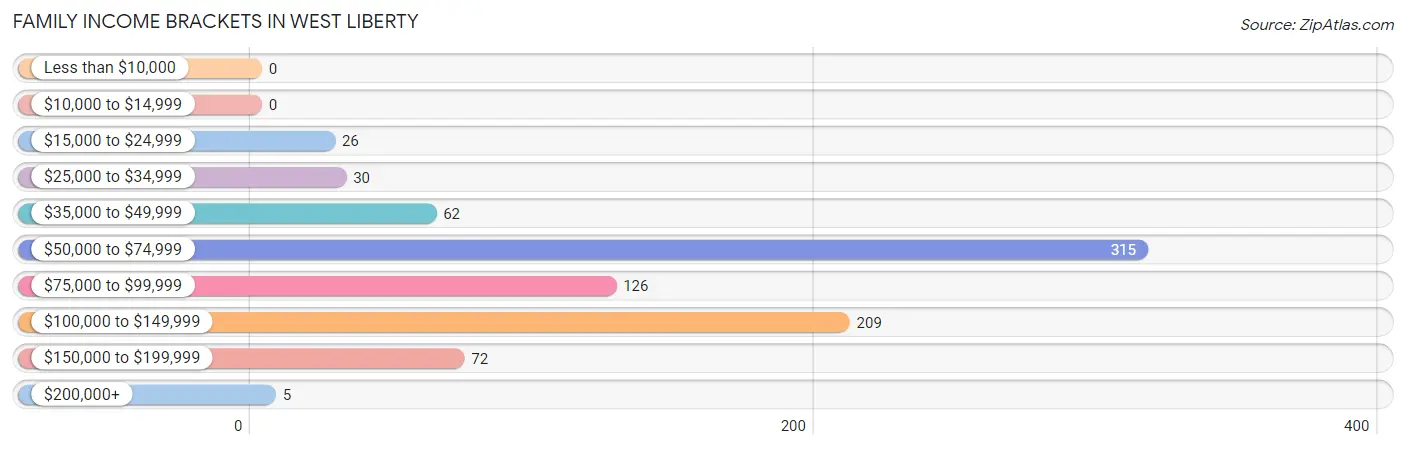
| Income Bracket | # Families | % Families |
| Less than $10,000 | 0 | 0.0% |
| $10,000 to $14,999 | 0 | 0.0% |
| $15,000 to $24,999 | 26 | 3.1% |
| $25,000 to $34,999 | 30 | 3.6% |
| $35,000 to $49,999 | 62 | 7.3% |
| $50,000 to $74,999 | 315 | 37.3% |
| $75,000 to $99,999 | 126 | 14.9% |
| $100,000 to $149,999 | 209 | 24.7% |
| $150,000 to $199,999 | 72 | 8.5% |
| $200,000+ | 5 | 0.6% |
Family Income by Famaliy Size in West Liberty
5-person families (49 | 5.8%) account for the highest median family income in West Liberty with $98,047 per family, while 2-person families (212 | 25.1%) have the highest median income of $36,818 per family member.
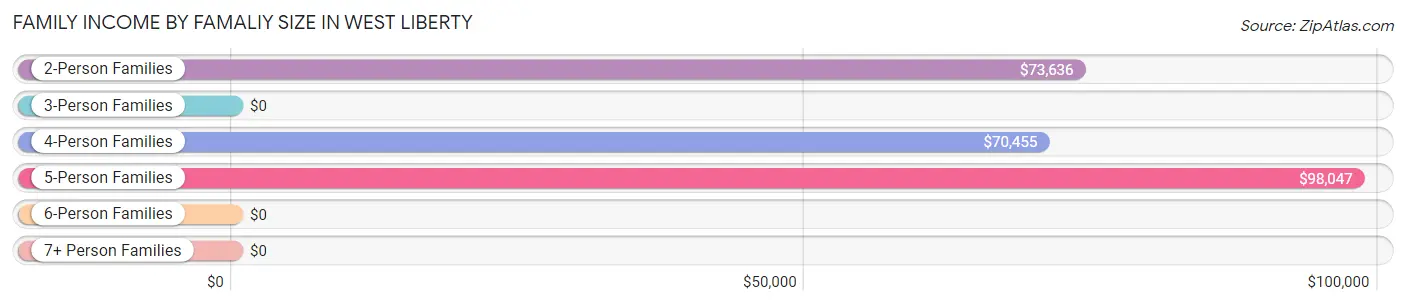
| Income Bracket | # Families | Median Income |
| 2-Person Families | 212 (25.1%) | $73,636 |
| 3-Person Families | 218 (25.8%) | $0 |
| 4-Person Families | 268 (31.7%) | $70,455 |
| 5-Person Families | 49 (5.8%) | $98,047 |
| 6-Person Families | 86 (10.2%) | $0 |
| 7+ Person Families | 12 (1.4%) | $0 |
| Total | 845 (100.0%) | $73,456 |
Family Income by Number of Earners in West Liberty
The median family income in West Liberty is $73,456, with families comprising 3+ earners (127) having the highest median family income of $109,153, while families with 1 earner (304) have the lowest median family income of $59,042, accounting for 15.0% and 36.0% of families, respectively.
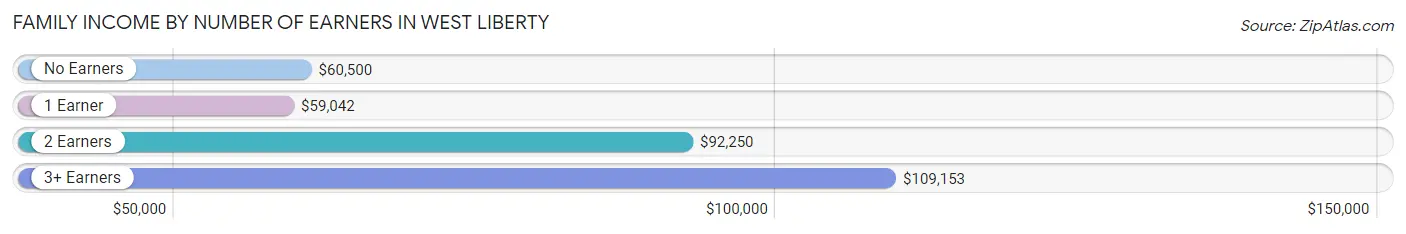
| Number of Earners | # Families | Median Income |
| No Earners | 60 (7.1%) | $60,500 |
| 1 Earner | 304 (36.0%) | $59,042 |
| 2 Earners | 354 (41.9%) | $92,250 |
| 3+ Earners | 127 (15.0%) | $109,153 |
| Total | 845 (100.0%) | $73,456 |
Household Income in West Liberty
Household Income Brackets in West Liberty
With 398 households falling in the category, the $50,000 to $74,999 income range is the most frequent in West Liberty, accounting for 30.3% of all households. In contrast, only 5 households (0.4%) fall into the $200,000+ income bracket, making it the least populous group.
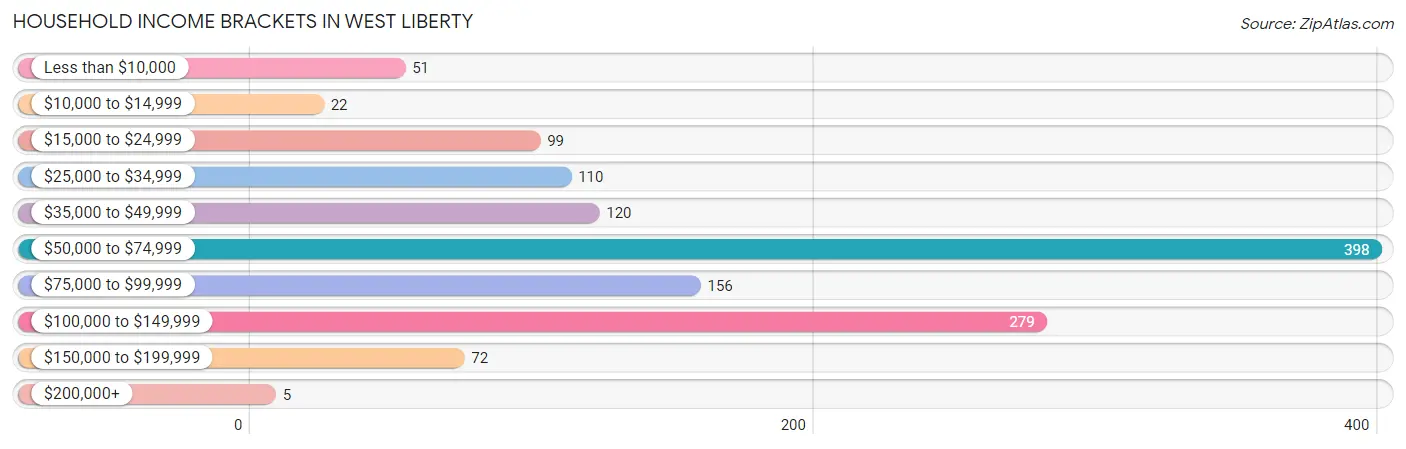
| Income Bracket | # Households | % Households |
| Less than $10,000 | 51 | 3.9% |
| $10,000 to $14,999 | 22 | 1.7% |
| $15,000 to $24,999 | 99 | 7.5% |
| $25,000 to $34,999 | 110 | 8.4% |
| $35,000 to $49,999 | 120 | 9.1% |
| $50,000 to $74,999 | 398 | 30.3% |
| $75,000 to $99,999 | 156 | 11.9% |
| $100,000 to $149,999 | 279 | 21.2% |
| $150,000 to $199,999 | 72 | 5.5% |
| $200,000+ | 5 | 0.4% |
Household Income by Householder Age in West Liberty
The median household income in West Liberty is $63,910, with the highest median household income of $81,375 found in the 45 to 64 years age bracket for the primary householder. A total of 423 households (32.2%) fall into this category. Meanwhile, the 15 to 24 years age bracket for the primary householder has the lowest median household income of $35,962, with 42 households (3.2%) in this group.
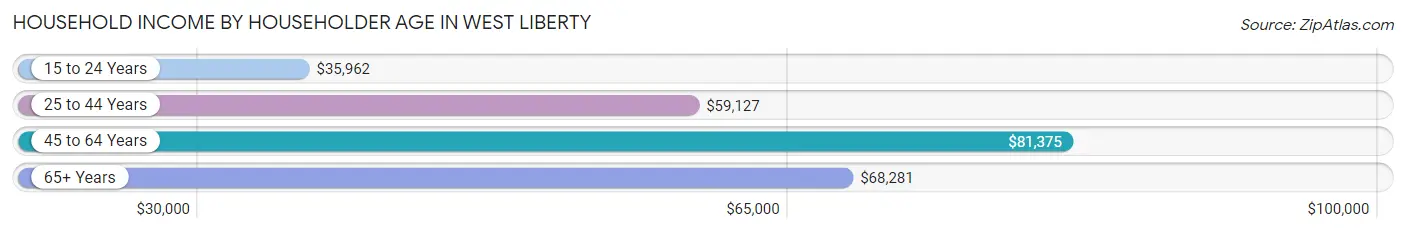
| Income Bracket | # Households | Median Income |
| 15 to 24 Years | 42 (3.2%) | $35,962 |
| 25 to 44 Years | 557 (42.4%) | $59,127 |
| 45 to 64 Years | 423 (32.2%) | $81,375 |
| 65+ Years | 293 (22.3%) | $68,281 |
| Total | 1,315 (100.0%) | $63,910 |
Poverty in West Liberty
Income Below Poverty by Sex and Age in West Liberty
With 6.8% poverty level for males and 6.5% for females among the residents of West Liberty, 12 to 14 year old males and 65 to 74 year old females are the most vulnerable to poverty, with 11 males (33.3%) and 41 females (36.9%) in their respective age groups living below the poverty level.
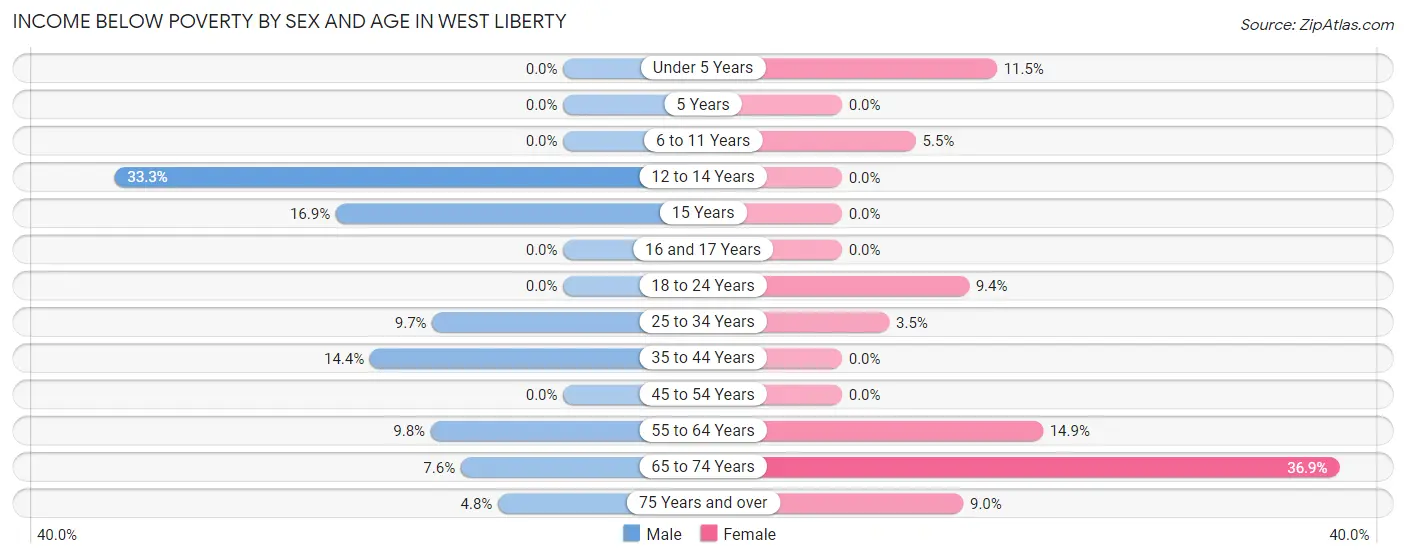
| Age Bracket | Male | Female |
| Under 5 Years | 0 (0.0%) | 13 (11.5%) |
| 5 Years | 0 (0.0%) | 0 (0.0%) |
| 6 to 11 Years | 0 (0.0%) | 8 (5.5%) |
| 12 to 14 Years | 11 (33.3%) | 0 (0.0%) |
| 15 Years | 13 (16.9%) | 0 (0.0%) |
| 16 and 17 Years | 0 (0.0%) | 0 (0.0%) |
| 18 to 24 Years | 0 (0.0%) | 13 (9.4%) |
| 25 to 34 Years | 38 (9.7%) | 11 (3.5%) |
| 35 to 44 Years | 33 (14.3%) | 0 (0.0%) |
| 45 to 54 Years | 0 (0.0%) | 0 (0.0%) |
| 55 to 64 Years | 17 (9.8%) | 27 (14.9%) |
| 65 to 74 Years | 13 (7.6%) | 41 (36.9%) |
| 75 Years and over | 3 (4.8%) | 9 (9.0%) |
| Total | 128 (6.8%) | 122 (6.5%) |
Income Above Poverty by Sex and Age in West Liberty
According to the poverty statistics in West Liberty, males aged under 5 years and females aged 5 years are the age groups that are most secure financially, with 100.0% of males and 100.0% of females in these age groups living above the poverty line.
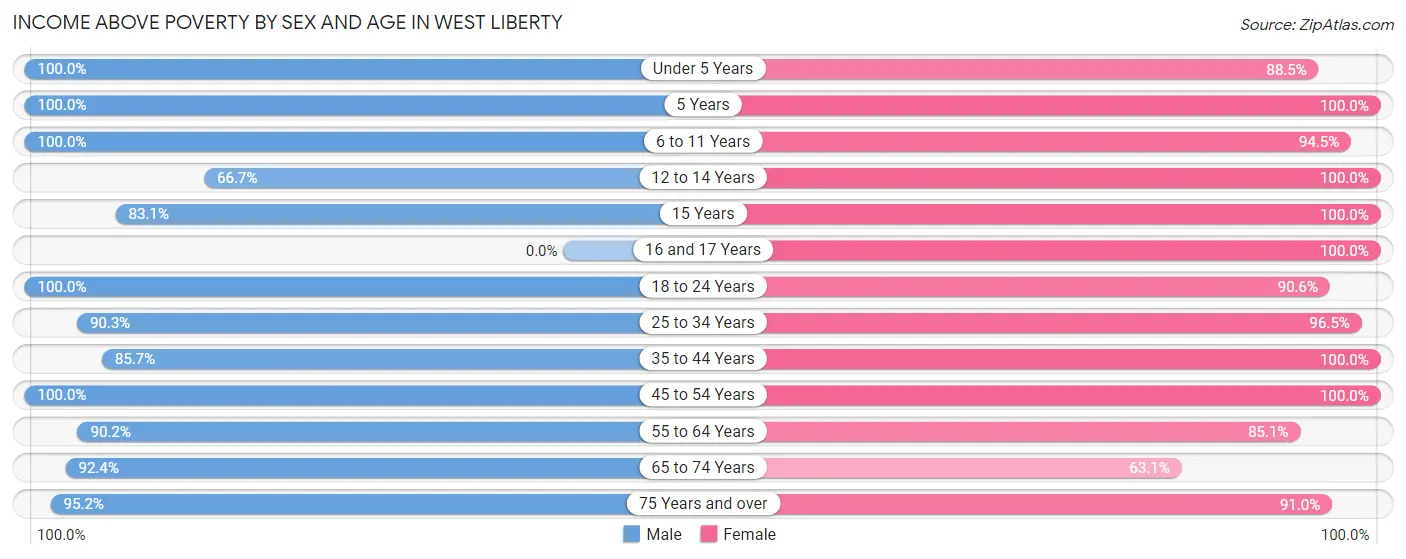
| Age Bracket | Male | Female |
| Under 5 Years | 68 (100.0%) | 100 (88.5%) |
| 5 Years | 35 (100.0%) | 37 (100.0%) |
| 6 to 11 Years | 247 (100.0%) | 138 (94.5%) |
| 12 to 14 Years | 22 (66.7%) | 76 (100.0%) |
| 15 Years | 64 (83.1%) | 74 (100.0%) |
| 16 and 17 Years | 0 (0.0%) | 120 (100.0%) |
| 18 to 24 Years | 206 (100.0%) | 125 (90.6%) |
| 25 to 34 Years | 353 (90.3%) | 302 (96.5%) |
| 35 to 44 Years | 197 (85.7%) | 278 (100.0%) |
| 45 to 54 Years | 189 (100.0%) | 203 (100.0%) |
| 55 to 64 Years | 156 (90.2%) | 154 (85.1%) |
| 65 to 74 Years | 158 (92.4%) | 70 (63.1%) |
| 75 Years and over | 59 (95.2%) | 91 (91.0%) |
| Total | 1,754 (93.2%) | 1,768 (93.5%) |
Income Below Poverty Among Married-Couple Families in West Liberty
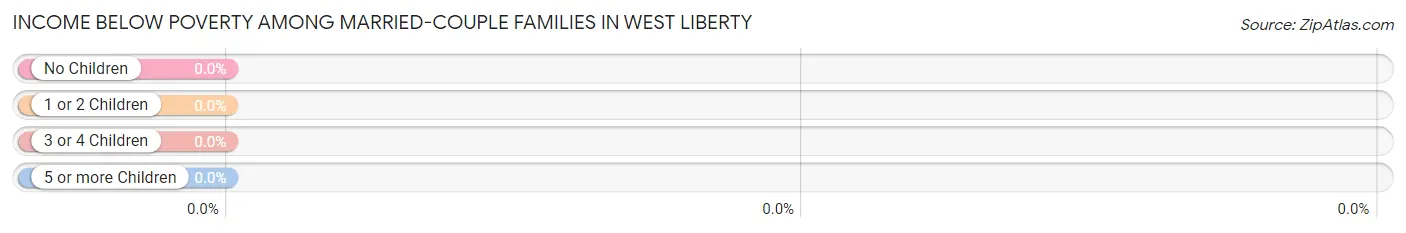
| Children | Above Poverty | Below Poverty |
| No Children | 332 (100.0%) | 0 (0.0%) |
| 1 or 2 Children | 142 (100.0%) | 0 (0.0%) |
| 3 or 4 Children | 103 (100.0%) | 0 (0.0%) |
| 5 or more Children | 12 (100.0%) | 0 (0.0%) |
| Total | 589 (100.0%) | 0 (0.0%) |
Income Below Poverty Among Single-Parent Households in West Liberty
According to the poverty data in West Liberty, 13.2% or 9 single-father households and 5.9% or 11 single-mother households are living below the poverty line. Among single-father households, those with no children have the highest poverty rate, with 9 households (81.8%) experiencing poverty. Likewise, among single-mother households, those with 3 or 4 children have the highest poverty rate, with 11 households (100.0%) falling below the poverty line.
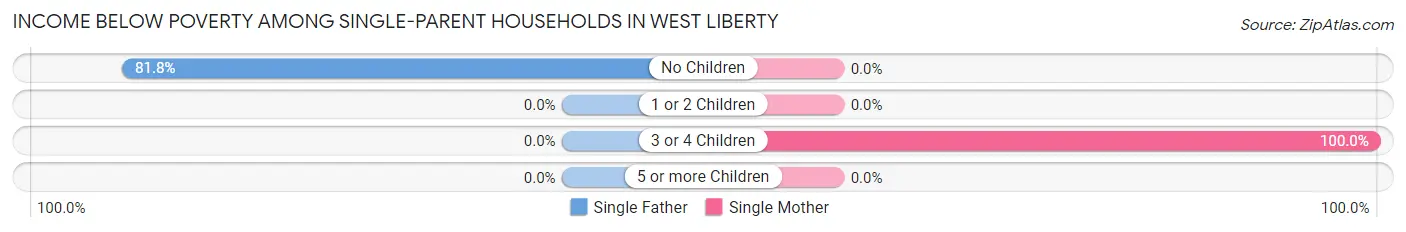
| Children | Single Father | Single Mother |
| No Children | 9 (81.8%) | 0 (0.0%) |
| 1 or 2 Children | 0 (0.0%) | 0 (0.0%) |
| 3 or 4 Children | 0 (0.0%) | 11 (100.0%) |
| 5 or more Children | 0 (0.0%) | 0 (0.0%) |
| Total | 9 (13.2%) | 11 (5.9%) |
Income Below Poverty Among Married-Couple vs Single-Parent Households in West Liberty
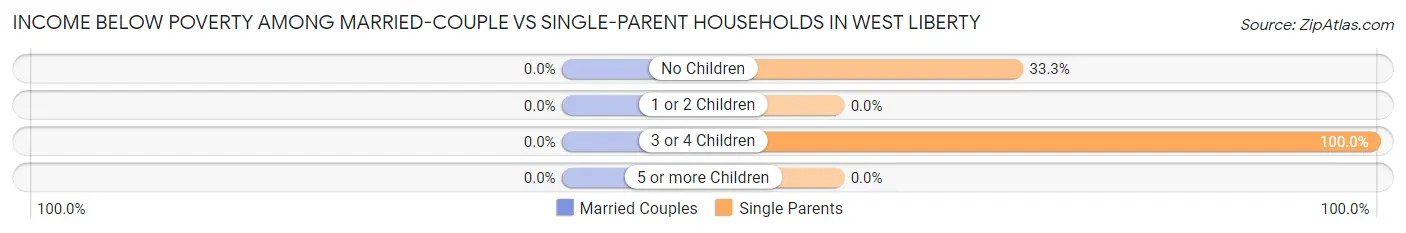
| Children | Married-Couple Families | Single-Parent Households |
| No Children | 0 (0.0%) | 9 (33.3%) |
| 1 or 2 Children | 0 (0.0%) | 0 (0.0%) |
| 3 or 4 Children | 0 (0.0%) | 11 (100.0%) |
| 5 or more Children | 0 (0.0%) | 0 (0.0%) |
| Total | 0 (0.0%) | 20 (7.8%) |
Race in West Liberty
The most populous races in West Liberty are White / Caucasian (2,587 | 67.7%), Hispanic or Latino (1,945 | 50.9%), and Some other Race (772 | 20.2%).
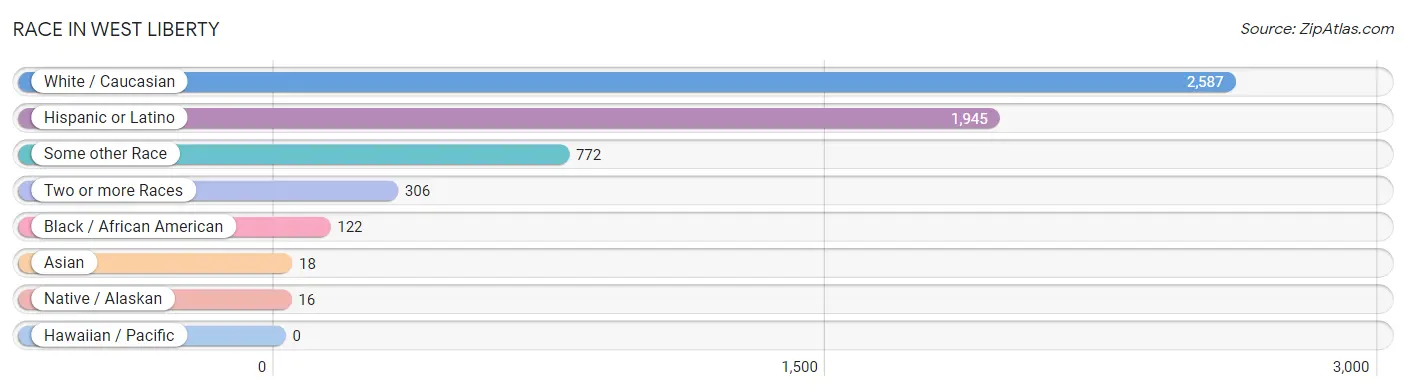
| Race | # Population | % Population |
| Asian | 18 | 0.5% |
| Black / African American | 122 | 3.2% |
| Hawaiian / Pacific | 0 | 0.0% |
| Hispanic or Latino | 1,945 | 50.9% |
| Native / Alaskan | 16 | 0.4% |
| White / Caucasian | 2,587 | 67.7% |
| Two or more Races | 306 | 8.0% |
| Some other Race | 772 | 20.2% |
| Total | 3,821 | 100.0% |
Ancestry in West Liberty
The most populous ancestries reported in West Liberty are Mexican (1,170 | 30.6%), German (507 | 13.3%), Central American (484 | 12.7%), Guatemalan (353 | 9.2%), and Irish (251 | 6.6%), together accounting for 72.4% of all West Liberty residents.
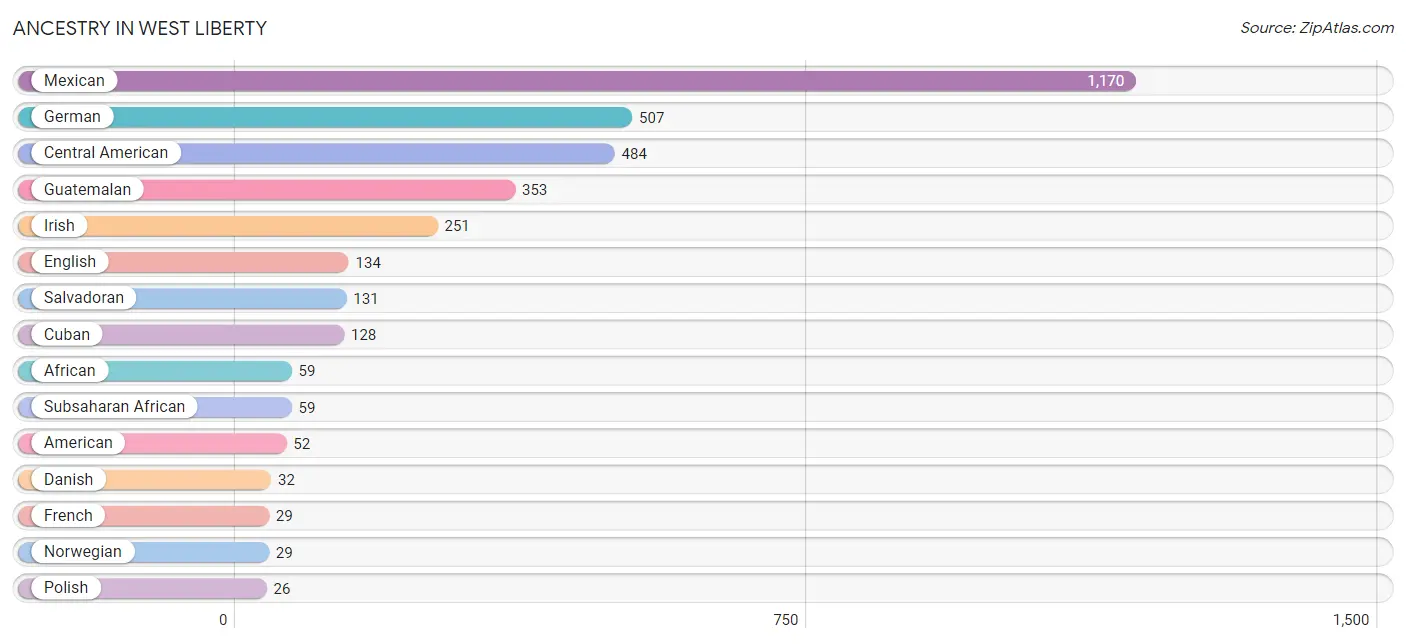
| Ancestry | # Population | % Population |
| African | 59 | 1.5% |
| American | 52 | 1.4% |
| Belgian | 1 | 0.0% |
| British | 16 | 0.4% |
| Central American | 484 | 12.7% |
| Cuban | 128 | 3.4% |
| Czech | 11 | 0.3% |
| Czechoslovakian | 19 | 0.5% |
| Danish | 32 | 0.8% |
| Dutch | 10 | 0.3% |
| English | 134 | 3.5% |
| European | 17 | 0.4% |
| French | 29 | 0.8% |
| French Canadian | 18 | 0.5% |
| German | 507 | 13.3% |
| Greek | 1 | 0.0% |
| Guatemalan | 353 | 9.2% |
| Irish | 251 | 6.6% |
| Malaysian | 18 | 0.5% |
| Mexican | 1,170 | 30.6% |
| Mexican American Indian | 16 | 0.4% |
| Norwegian | 29 | 0.8% |
| Pennsylvania German | 5 | 0.1% |
| Polish | 26 | 0.7% |
| Salvadoran | 131 | 3.4% |
| Scandinavian | 19 | 0.5% |
| Scotch-Irish | 13 | 0.3% |
| Scottish | 6 | 0.2% |
| Spanish | 11 | 0.3% |
| Subsaharan African | 59 | 1.5% |
| Swedish | 7 | 0.2% |
| Welsh | 12 | 0.3% | View All 32 Rows |
Immigrants in West Liberty
The most numerous immigrant groups reported in West Liberty came from Central America (673 | 17.6%), Latin America (673 | 17.6%), Mexico (507 | 13.3%), Guatemala (101 | 2.6%), and Africa (92 | 2.4%), together accounting for 53.5% of all West Liberty residents.
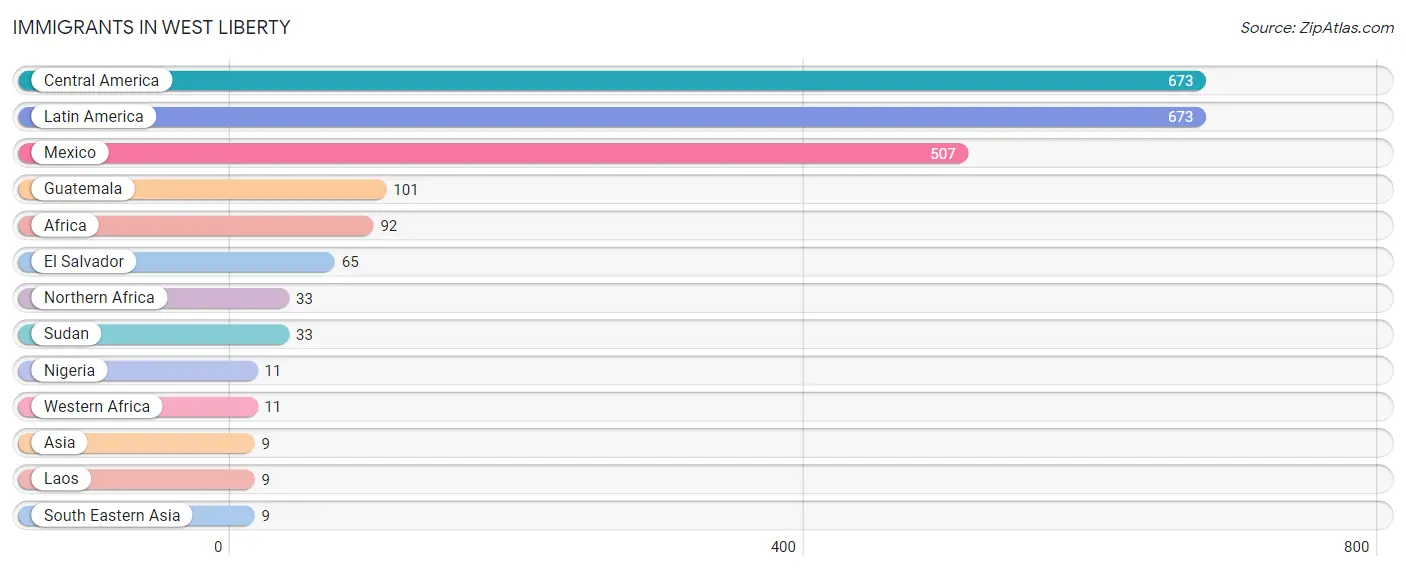
| Immigration Origin | # Population | % Population |
| Africa | 92 | 2.4% |
| Asia | 9 | 0.2% |
| Central America | 673 | 17.6% |
| El Salvador | 65 | 1.7% |
| Guatemala | 101 | 2.6% |
| Laos | 9 | 0.2% |
| Latin America | 673 | 17.6% |
| Mexico | 507 | 13.3% |
| Nigeria | 11 | 0.3% |
| Northern Africa | 33 | 0.9% |
| South Eastern Asia | 9 | 0.2% |
| Sudan | 33 | 0.9% |
| Western Africa | 11 | 0.3% | View All 13 Rows |
Sex and Age in West Liberty
Sex and Age in West Liberty
The most populous age groups in West Liberty are 25 to 29 Years (242 | 12.7%) for men and 15 to 19 Years (224 | 11.7%) for women.
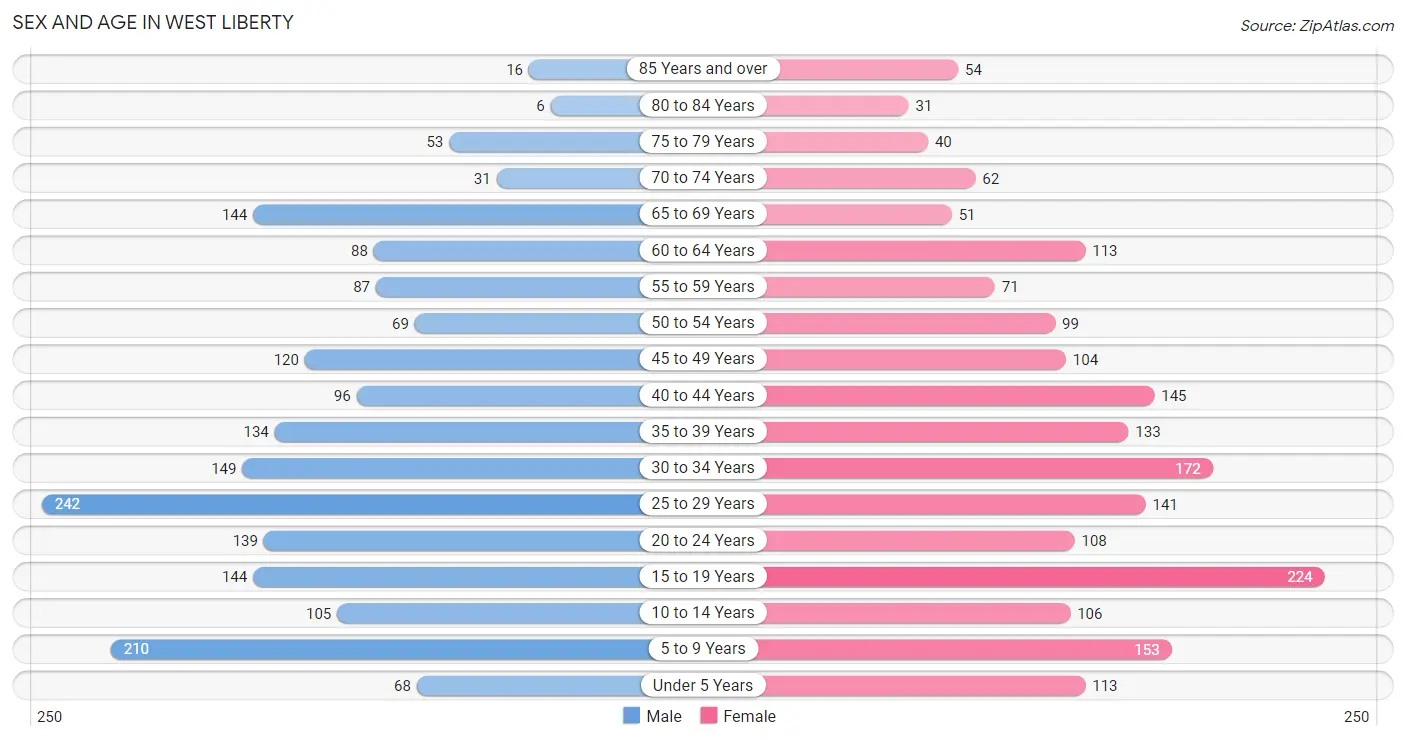
| Age Bracket | Male | Female |
| Under 5 Years | 68 (3.6%) | 113 (5.9%) |
| 5 to 9 Years | 210 (11.1%) | 153 (8.0%) |
| 10 to 14 Years | 105 (5.5%) | 106 (5.5%) |
| 15 to 19 Years | 144 (7.6%) | 224 (11.7%) |
| 20 to 24 Years | 139 (7.3%) | 108 (5.6%) |
| 25 to 29 Years | 242 (12.7%) | 141 (7.3%) |
| 30 to 34 Years | 149 (7.8%) | 172 (9.0%) |
| 35 to 39 Years | 134 (7.0%) | 133 (6.9%) |
| 40 to 44 Years | 96 (5.1%) | 145 (7.5%) |
| 45 to 49 Years | 120 (6.3%) | 104 (5.4%) |
| 50 to 54 Years | 69 (3.6%) | 99 (5.2%) |
| 55 to 59 Years | 87 (4.6%) | 71 (3.7%) |
| 60 to 64 Years | 88 (4.6%) | 113 (5.9%) |
| 65 to 69 Years | 144 (7.6%) | 51 (2.7%) |
| 70 to 74 Years | 31 (1.6%) | 62 (3.2%) |
| 75 to 79 Years | 53 (2.8%) | 40 (2.1%) |
| 80 to 84 Years | 6 (0.3%) | 31 (1.6%) |
| 85 Years and over | 16 (0.8%) | 54 (2.8%) |
| Total | 1,901 (100.0%) | 1,920 (100.0%) |
Families and Households in West Liberty
Median Family Size in West Liberty
The median family size in West Liberty is 3.57 persons per family, with married-couple families (589 | 69.7%) accounting for the largest median family size of 3.89 persons per family. On the other hand, single female/mother families (188 | 22.3%) represent the smallest median family size with 2.84 persons per family.
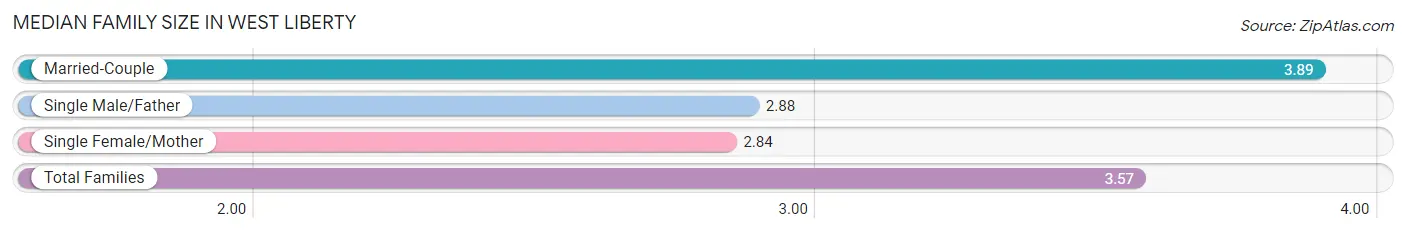
| Family Type | # Families | Family Size |
| Married-Couple | 589 (69.7%) | 3.89 |
| Single Male/Father | 68 (8.1%) | 2.88 |
| Single Female/Mother | 188 (22.3%) | 2.84 |
| Total Families | 845 (100.0%) | 3.57 |
Median Household Size in West Liberty
The median household size in West Liberty is 2.87 persons per household, with married-couple households (589 | 44.8%) accounting for the largest median household size of 3.89 persons per household. non-family households (470 | 35.7%) represent the smallest median household size with 1.31 persons per household.
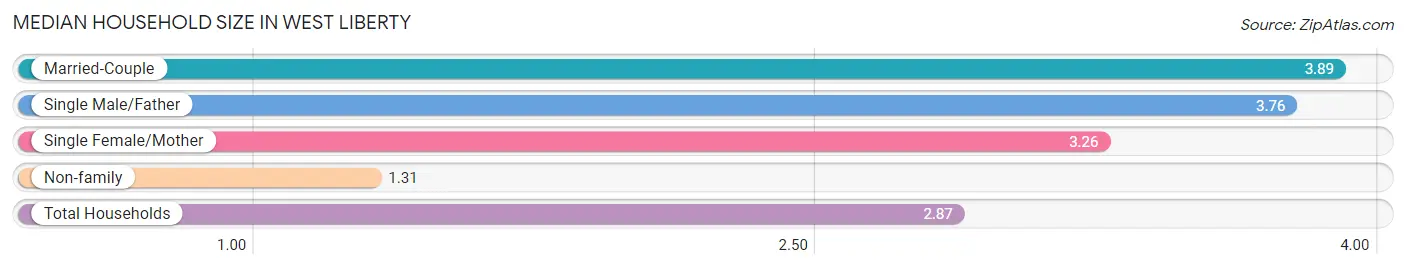
| Household Type | # Households | Household Size |
| Married-Couple | 589 (44.8%) | 3.89 |
| Single Male/Father | 68 (5.2%) | 3.76 |
| Single Female/Mother | 188 (14.3%) | 3.26 |
| Non-family | 470 (35.7%) | 1.31 |
| Total Households | 1,315 (100.0%) | 2.87 |
Household Size by Marriage Status in West Liberty
Out of a total of 1,315 households in West Liberty, 845 (64.3%) are family households, while 470 (35.7%) are nonfamily households. The most numerous type of family households are 4-person households, comprising 324, and the most common type of nonfamily households are 1-person households, comprising 338.
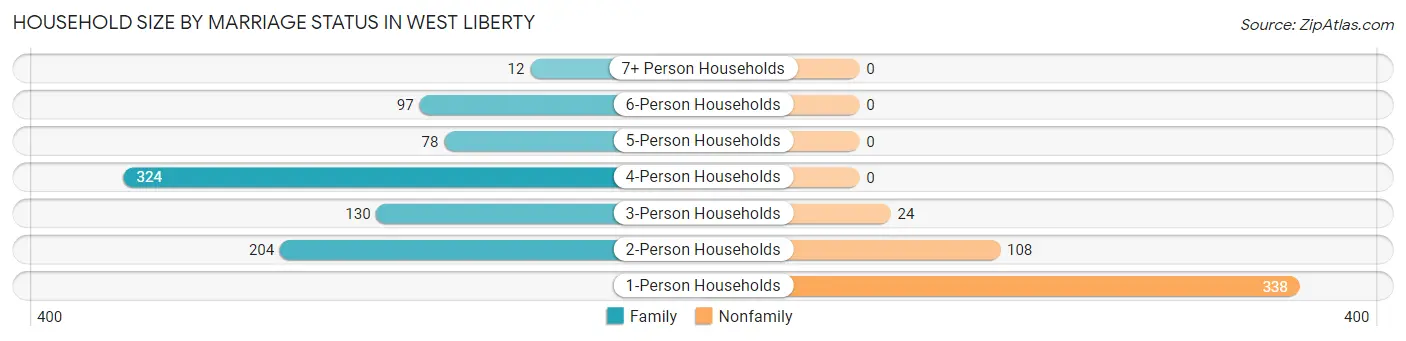
| Household Size | Family Households | Nonfamily Households |
| 1-Person Households | - | 338 (25.7%) |
| 2-Person Households | 204 (15.5%) | 108 (8.2%) |
| 3-Person Households | 130 (9.9%) | 24 (1.8%) |
| 4-Person Households | 324 (24.6%) | 0 (0.0%) |
| 5-Person Households | 78 (5.9%) | 0 (0.0%) |
| 6-Person Households | 97 (7.4%) | 0 (0.0%) |
| 7+ Person Households | 12 (0.9%) | 0 (0.0%) |
| Total | 845 (64.3%) | 470 (35.7%) |
Female Fertility in West Liberty
Fertility by Age in West Liberty
Average fertility rate in West Liberty is 85.0 births per 1,000 women. Women in the age bracket of 20 to 34 years have the highest fertility rate with 207.0 births per 1,000 women. Women in the age bracket of 20 to 34 years acount for 100.0% of all women with births.
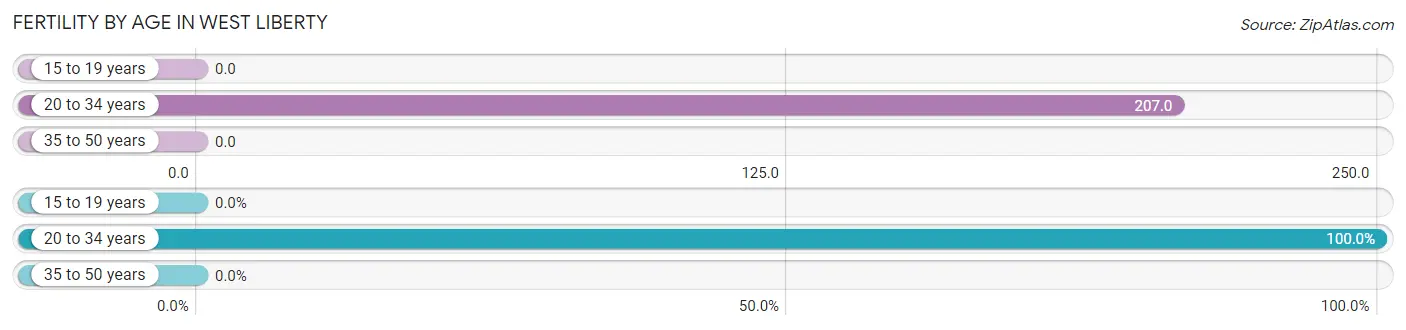
| Age Bracket | Women with Births | Births / 1,000 Women |
| 15 to 19 years | 0 (0.0%) | 0.0 |
| 20 to 34 years | 87 (100.0%) | 207.0 |
| 35 to 50 years | 0 (0.0%) | 0.0 |
| Total | 87 (100.0%) | 85.0 |
Fertility by Age by Marriage Status in West Liberty
26.4% of women with births (87) in West Liberty are married. The highest percentage of unmarried women with births falls into 20 to 34 years age bracket with 73.6% of them unmarried at the time of birth, while the lowest percentage of unmarried women with births belong to 20 to 34 years age bracket with 73.6% of them unmarried.
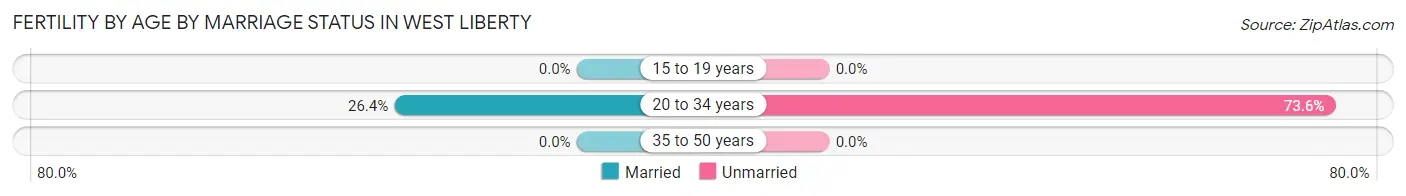
| Age Bracket | Married | Unmarried |
| 15 to 19 years | 0 (0.0%) | 0 (0.0%) |
| 20 to 34 years | 23 (26.4%) | 64 (73.6%) |
| 35 to 50 years | 0 (0.0%) | 0 (0.0%) |
| Total | 23 (26.4%) | 64 (73.6%) |
Fertility by Education in West Liberty
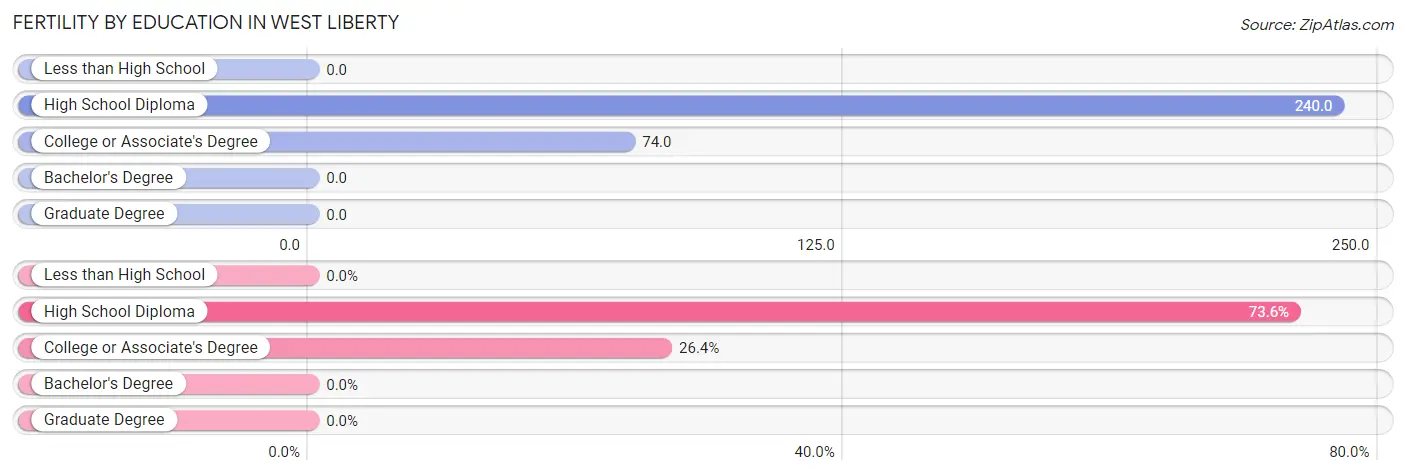
| Educational Attainment | Women with Births | Births / 1,000 Women |
| Less than High School | 0 (0.0%) | 0.0 |
| High School Diploma | 64 (73.6%) | 240.0 |
| College or Associate's Degree | 23 (26.4%) | 74.0 |
| Bachelor's Degree | 0 (0.0%) | 0.0 |
| Graduate Degree | 0 (0.0%) | 0.0 |
| Total | 87 (100.0%) | 85.0 |
Fertility by Education by Marriage Status in West Liberty
73.6% of women with births in West Liberty are unmarried. Women with the educational attainment of college or associate's degree are most likely to be married with 100.0% of them married at childbirth, while women with the educational attainment of high school diploma are least likely to be married with 100.0% of them unmarried at childbirth.
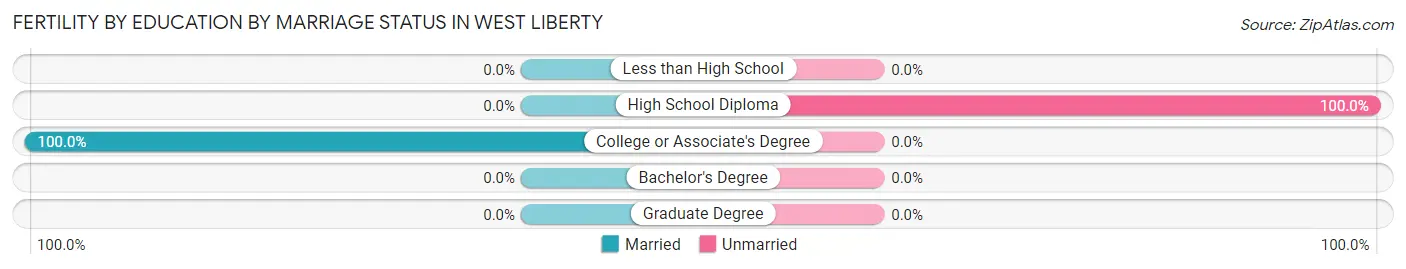
| Educational Attainment | Married | Unmarried |
| Less than High School | 0 (0.0%) | 0 (0.0%) |
| High School Diploma | 0 (0.0%) | 64 (100.0%) |
| College or Associate's Degree | 23 (100.0%) | 0 (0.0%) |
| Bachelor's Degree | 0 (0.0%) | 0 (0.0%) |
| Graduate Degree | 0 (0.0%) | 0 (0.0%) |
| Total | 23 (26.4%) | 64 (73.6%) |
Employment Characteristics in West Liberty
Employment by Class of Employer in West Liberty
Among the 1,976 employed individuals in West Liberty, private company employees (1,502 | 76.0%), not-for-profit organizations (149 | 7.5%), and local government employees (132 | 6.7%) make up the most common classes of employment.
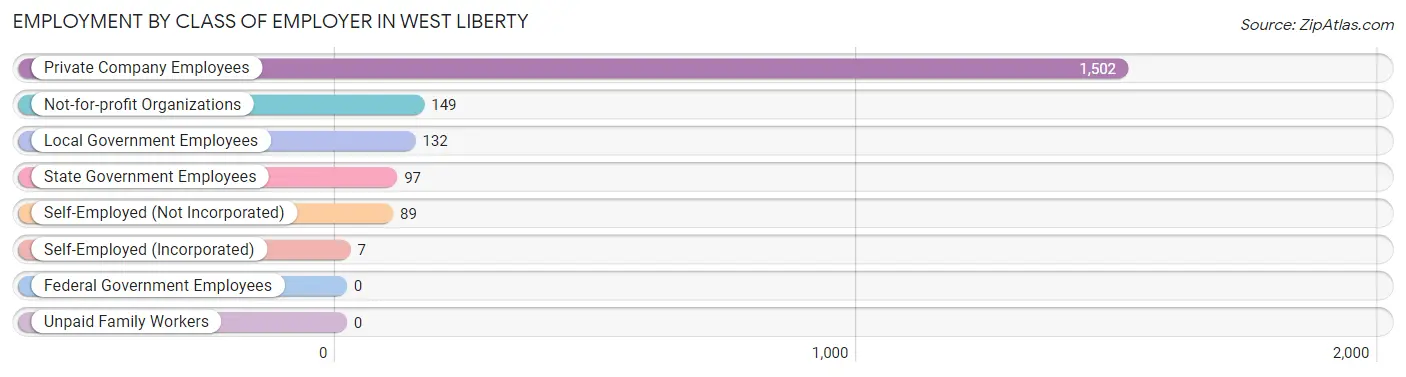
| Employer Class | # Employees | % Employees |
| Private Company Employees | 1,502 | 76.0% |
| Self-Employed (Incorporated) | 7 | 0.4% |
| Self-Employed (Not Incorporated) | 89 | 4.5% |
| Not-for-profit Organizations | 149 | 7.5% |
| Local Government Employees | 132 | 6.7% |
| State Government Employees | 97 | 4.9% |
| Federal Government Employees | 0 | 0.0% |
| Unpaid Family Workers | 0 | 0.0% |
| Total | 1,976 | 100.0% |
Employment Status by Age in West Liberty
According to the labor force statistics for West Liberty, out of the total population over 16 years of age (2,915), 73.6% or 2,145 individuals are in the labor force, with 4.2% or 90 of them unemployed. The age group with the highest labor force participation rate is 20 to 24 years, with 100.0% or 247 individuals in the labor force. Within the labor force, the 16 to 19 years age range has the highest percentage of unemployed individuals, with 56.4% or 22 of them being unemployed.
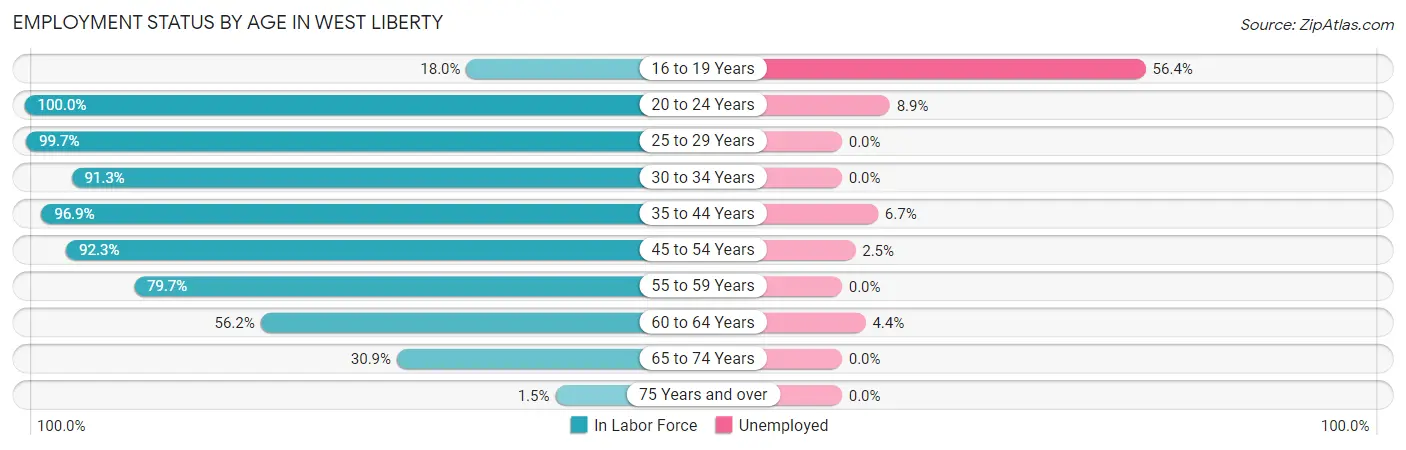
| Age Bracket | In Labor Force | Unemployed |
| 16 to 19 Years | 39 (18.0%) | 22 (56.4%) |
| 20 to 24 Years | 247 (100.0%) | 22 (8.9%) |
| 25 to 29 Years | 382 (99.7%) | 0 (0.0%) |
| 30 to 34 Years | 293 (91.3%) | 0 (0.0%) |
| 35 to 44 Years | 492 (96.9%) | 33 (6.7%) |
| 45 to 54 Years | 362 (92.3%) | 9 (2.5%) |
| 55 to 59 Years | 126 (79.7%) | 0 (0.0%) |
| 60 to 64 Years | 113 (56.2%) | 5 (4.4%) |
| 65 to 74 Years | 89 (30.9%) | 0 (0.0%) |
| 75 Years and over | 3 (1.5%) | 0 (0.0%) |
| Total | 2,145 (73.6%) | 90 (4.2%) |
Employment Status by Educational Attainment in West Liberty
According to labor force statistics for West Liberty, 90.1% of individuals (1,769) out of the total population between 25 and 64 years of age (1,963) are in the labor force, with 2.7% or 48 of them being unemployed. The group with the highest labor force participation rate are those with the educational attainment of college / associate degree, with 95.3% or 505 individuals in the labor force. Within the labor force, individuals with high school diploma education have the highest percentage of unemployment, with 7.3% or 38 of them being unemployed.
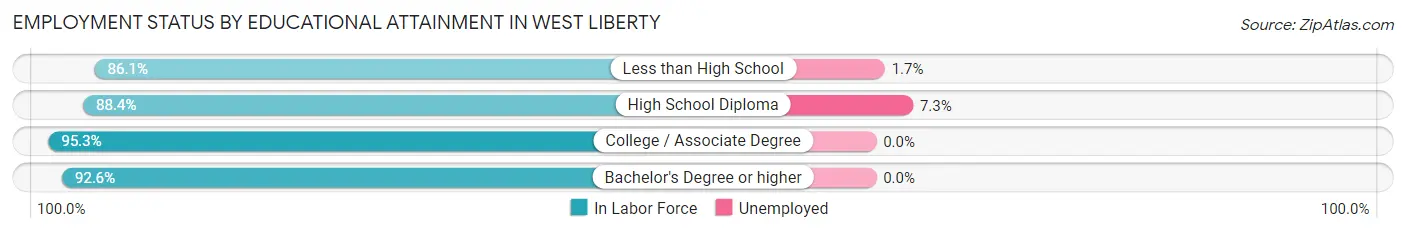
| Educational Attainment | In Labor Force | Unemployed |
| Less than High School | 521 (86.1%) | 10 (1.7%) |
| High School Diploma | 518 (88.4%) | 43 (7.3%) |
| College / Associate Degree | 505 (95.3%) | 0 (0.0%) |
| Bachelor's Degree or higher | 224 (92.6%) | 0 (0.0%) |
| Total | 1,769 (90.1%) | 53 (2.7%) |
Employment Occupations by Sex in West Liberty
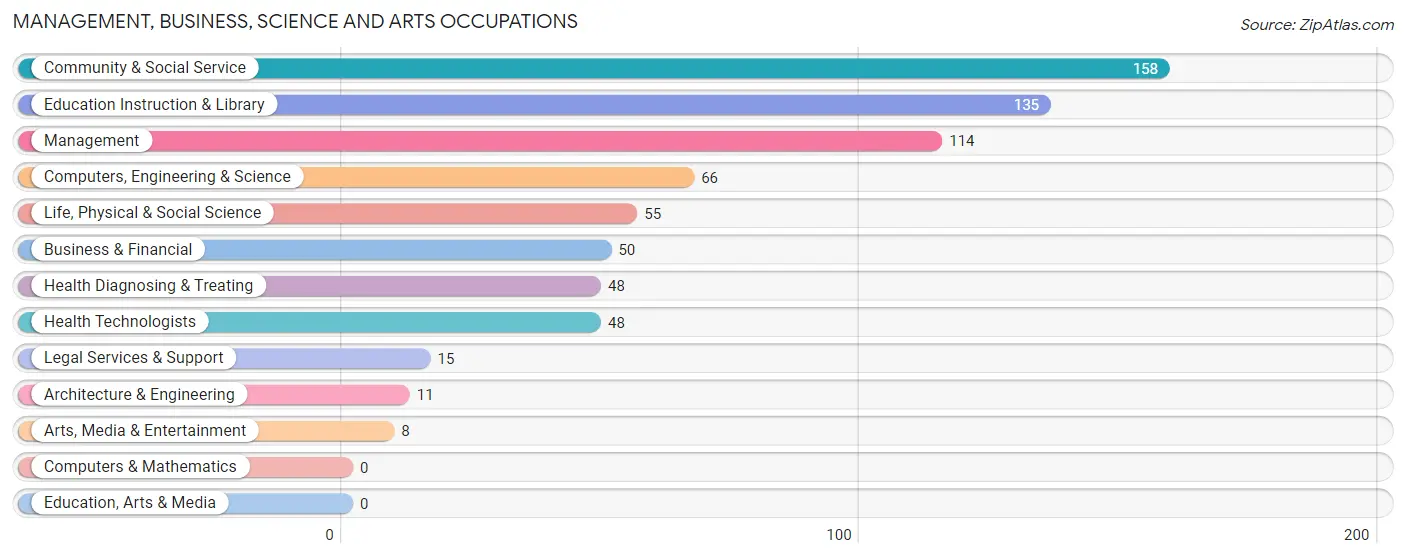
Management, Business, Science and Arts Occupations
The most common Management, Business, Science and Arts occupations in West Liberty are Community & Social Service (158 | 7.7%), Education Instruction & Library (135 | 6.6%), Management (114 | 5.6%), Computers, Engineering & Science (66 | 3.2%), and Life, Physical & Social Science (55 | 2.7%).
Management, Business, Science and Arts Occupations by Sex
Within the Management, Business, Science and Arts occupations in West Liberty, the most male-oriented occupations are Architecture & Engineering (100.0%), Computers, Engineering & Science (72.7%), and Life, Physical & Social Science (67.3%), while the most female-oriented occupations are Arts, Media & Entertainment (100.0%), Education Instruction & Library (94.8%), and Community & Social Service (91.1%).
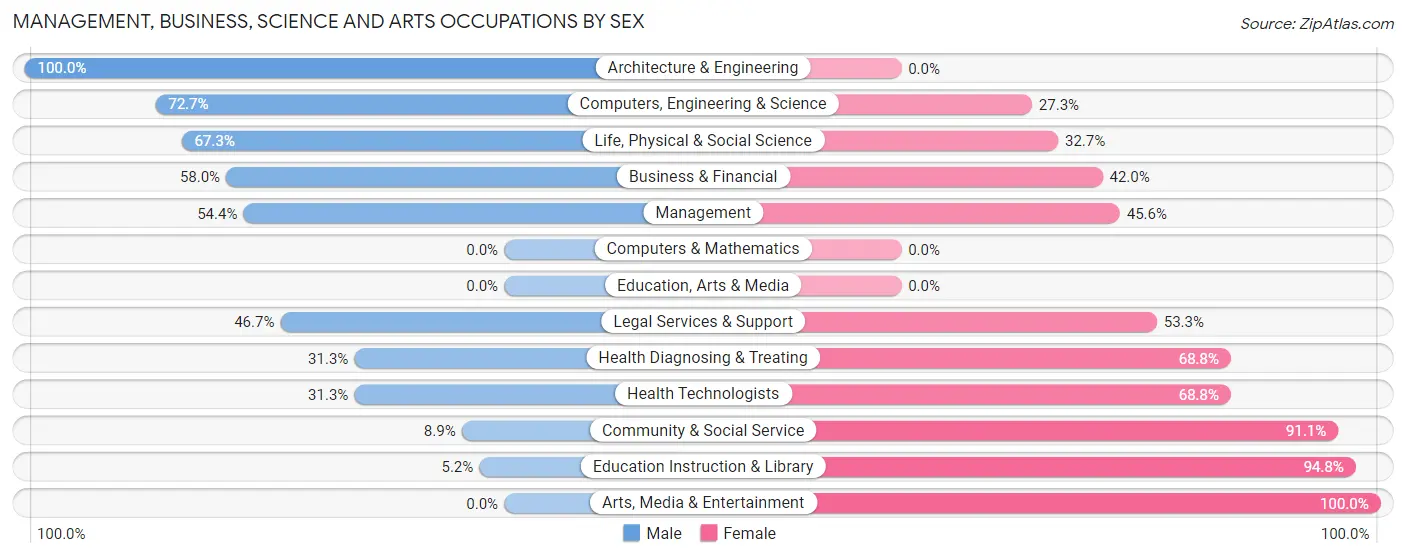
| Occupation | Male | Female |
| Management | 62 (54.4%) | 52 (45.6%) |
| Business & Financial | 29 (58.0%) | 21 (42.0%) |
| Computers, Engineering & Science | 48 (72.7%) | 18 (27.3%) |
| Computers & Mathematics | 0 (0.0%) | 0 (0.0%) |
| Architecture & Engineering | 11 (100.0%) | 0 (0.0%) |
| Life, Physical & Social Science | 37 (67.3%) | 18 (32.7%) |
| Community & Social Service | 14 (8.9%) | 144 (91.1%) |
| Education, Arts & Media | 0 (0.0%) | 0 (0.0%) |
| Legal Services & Support | 7 (46.7%) | 8 (53.3%) |
| Education Instruction & Library | 7 (5.2%) | 128 (94.8%) |
| Arts, Media & Entertainment | 0 (0.0%) | 8 (100.0%) |
| Health Diagnosing & Treating | 15 (31.2%) | 33 (68.8%) |
| Health Technologists | 15 (31.2%) | 33 (68.8%) |
| Total (Category) | 168 (38.5%) | 268 (61.5%) |
| Total (Overall) | 1,060 (51.6%) | 995 (48.4%) |
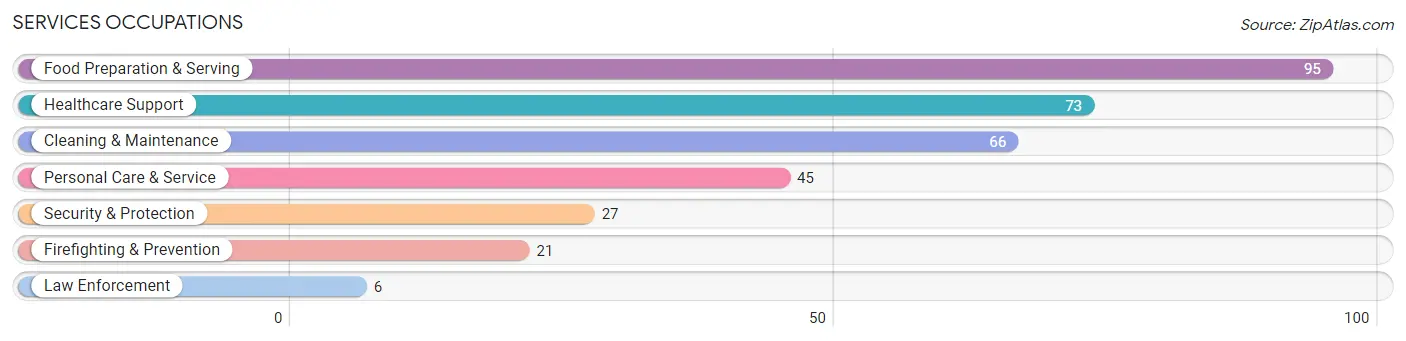
Services Occupations
The most common Services occupations in West Liberty are Food Preparation & Serving (95 | 4.6%), Healthcare Support (73 | 3.5%), Cleaning & Maintenance (66 | 3.2%), Personal Care & Service (45 | 2.2%), and Security & Protection (27 | 1.3%).
Services Occupations by Sex
Within the Services occupations in West Liberty, the most male-oriented occupations are Security & Protection (100.0%), Firefighting & Prevention (100.0%), and Law Enforcement (100.0%), while the most female-oriented occupations are Food Preparation & Serving (70.5%), Healthcare Support (64.4%), and Personal Care & Service (28.9%).
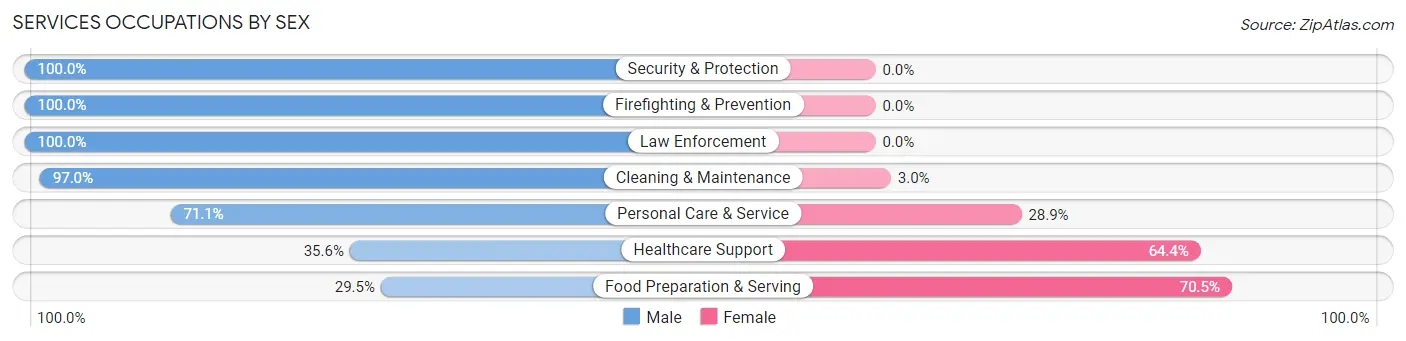
| Occupation | Male | Female |
| Healthcare Support | 26 (35.6%) | 47 (64.4%) |
| Security & Protection | 27 (100.0%) | 0 (0.0%) |
| Firefighting & Prevention | 21 (100.0%) | 0 (0.0%) |
| Law Enforcement | 6 (100.0%) | 0 (0.0%) |
| Food Preparation & Serving | 28 (29.5%) | 67 (70.5%) |
| Cleaning & Maintenance | 64 (97.0%) | 2 (3.0%) |
| Personal Care & Service | 32 (71.1%) | 13 (28.9%) |
| Total (Category) | 177 (57.8%) | 129 (42.2%) |
| Total (Overall) | 1,060 (51.6%) | 995 (48.4%) |
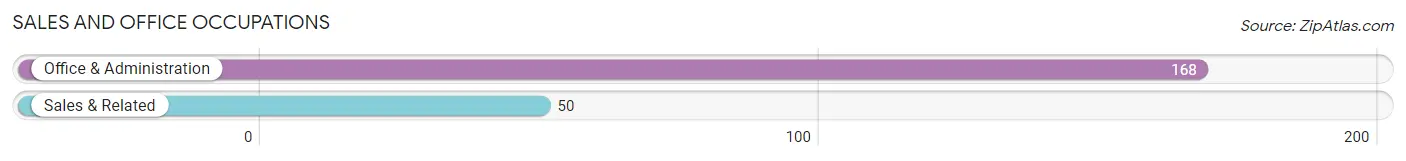
Sales and Office Occupations
The most common Sales and Office occupations in West Liberty are Office & Administration (168 | 8.2%), and Sales & Related (50 | 2.4%).
Sales and Office Occupations by Sex
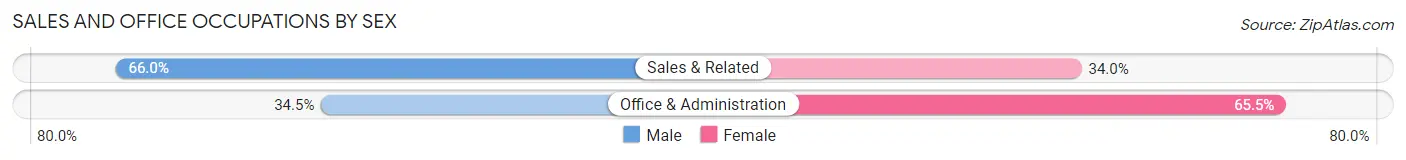
| Occupation | Male | Female |
| Sales & Related | 33 (66.0%) | 17 (34.0%) |
| Office & Administration | 58 (34.5%) | 110 (65.5%) |
| Total (Category) | 91 (41.7%) | 127 (58.3%) |
| Total (Overall) | 1,060 (51.6%) | 995 (48.4%) |
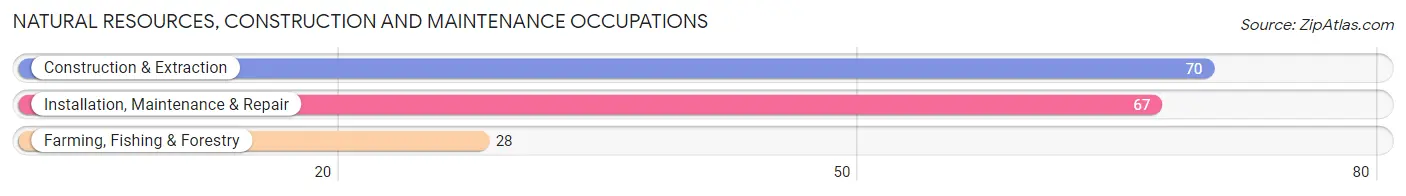
Natural Resources, Construction and Maintenance Occupations
The most common Natural Resources, Construction and Maintenance occupations in West Liberty are Construction & Extraction (70 | 3.4%), Installation, Maintenance & Repair (67 | 3.3%), and Farming, Fishing & Forestry (28 | 1.4%).
Natural Resources, Construction and Maintenance Occupations by Sex
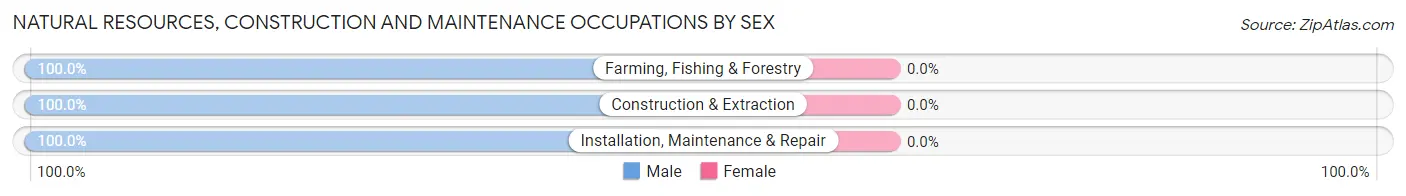
| Occupation | Male | Female |
| Farming, Fishing & Forestry | 28 (100.0%) | 0 (0.0%) |
| Construction & Extraction | 70 (100.0%) | 0 (0.0%) |
| Installation, Maintenance & Repair | 67 (100.0%) | 0 (0.0%) |
| Total (Category) | 165 (100.0%) | 0 (0.0%) |
| Total (Overall) | 1,060 (51.6%) | 995 (48.4%) |
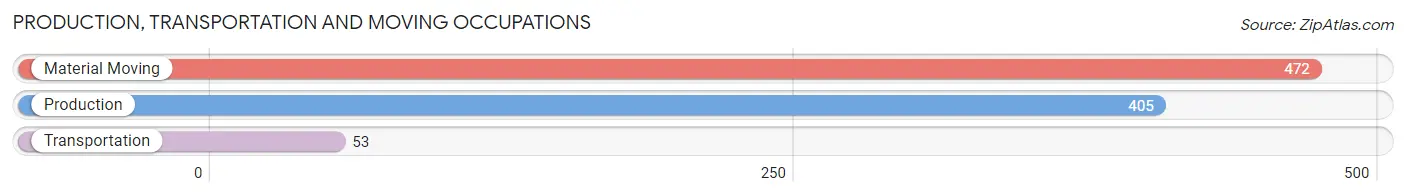
Production, Transportation and Moving Occupations
The most common Production, Transportation and Moving occupations in West Liberty are Material Moving (472 | 23.0%), Production (405 | 19.7%), and Transportation (53 | 2.6%).
Production, Transportation and Moving Occupations by Sex
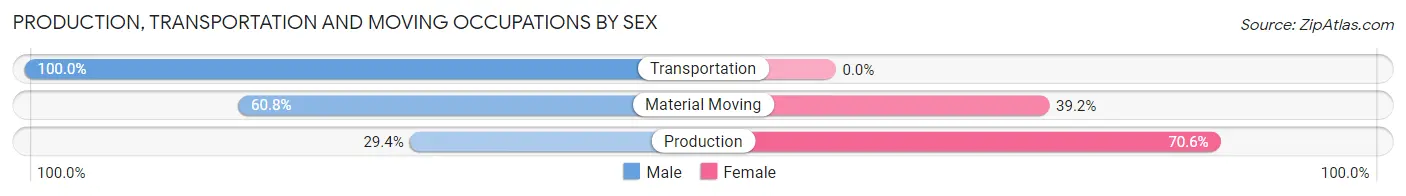
| Occupation | Male | Female |
| Production | 119 (29.4%) | 286 (70.6%) |
| Transportation | 53 (100.0%) | 0 (0.0%) |
| Material Moving | 287 (60.8%) | 185 (39.2%) |
| Total (Category) | 459 (49.3%) | 471 (50.6%) |
| Total (Overall) | 1,060 (51.6%) | 995 (48.4%) |
Employment Industries by Sex in West Liberty
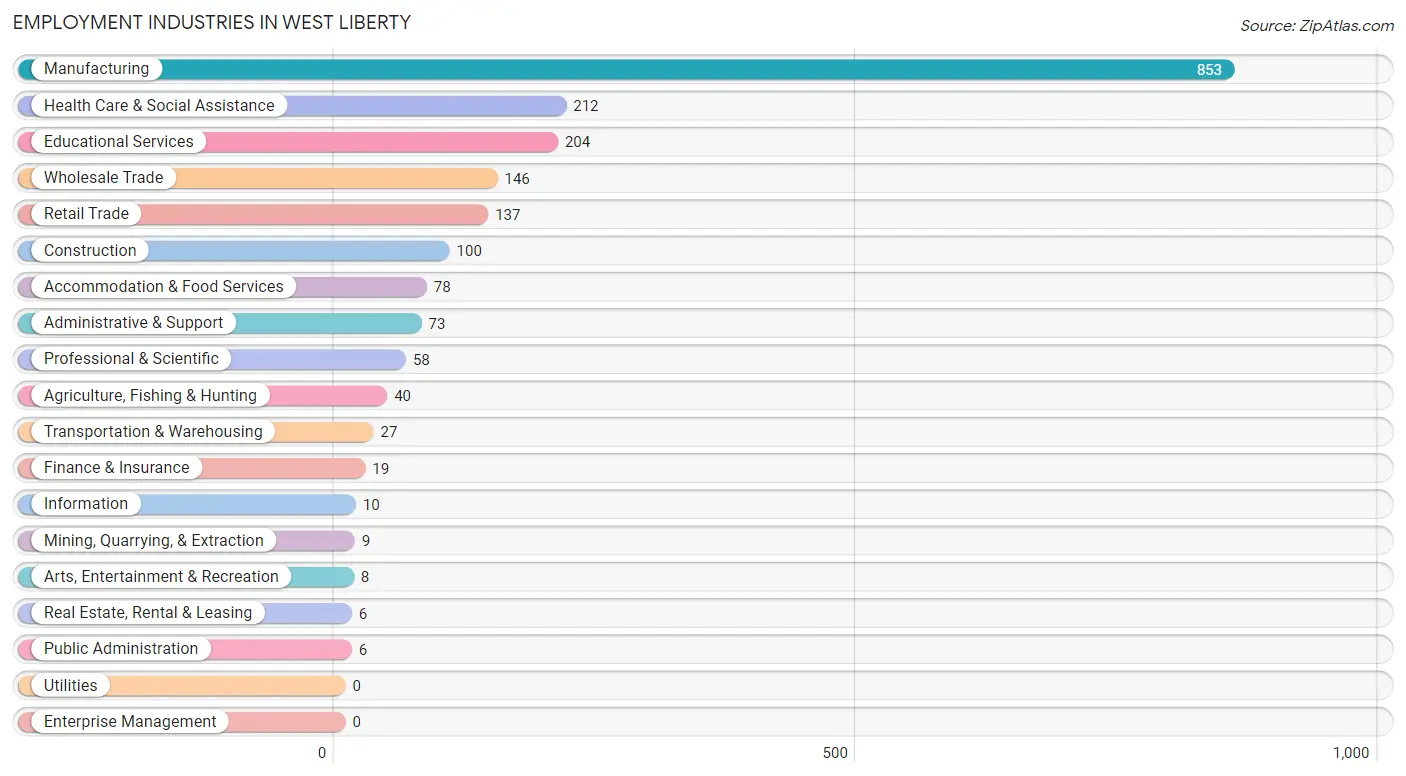
Employment Industries in West Liberty
The major employment industries in West Liberty include Manufacturing (853 | 41.5%), Health Care & Social Assistance (212 | 10.3%), Educational Services (204 | 9.9%), Wholesale Trade (146 | 7.1%), and Retail Trade (137 | 6.7%).
Employment Industries by Sex in West Liberty
The West Liberty industries that see more men than women are Mining, Quarrying, & Extraction (100.0%), Construction (100.0%), and Information (100.0%), whereas the industries that tend to have a higher number of women are Real Estate, Rental & Leasing (100.0%), Professional & Scientific (87.9%), and Health Care & Social Assistance (80.7%).
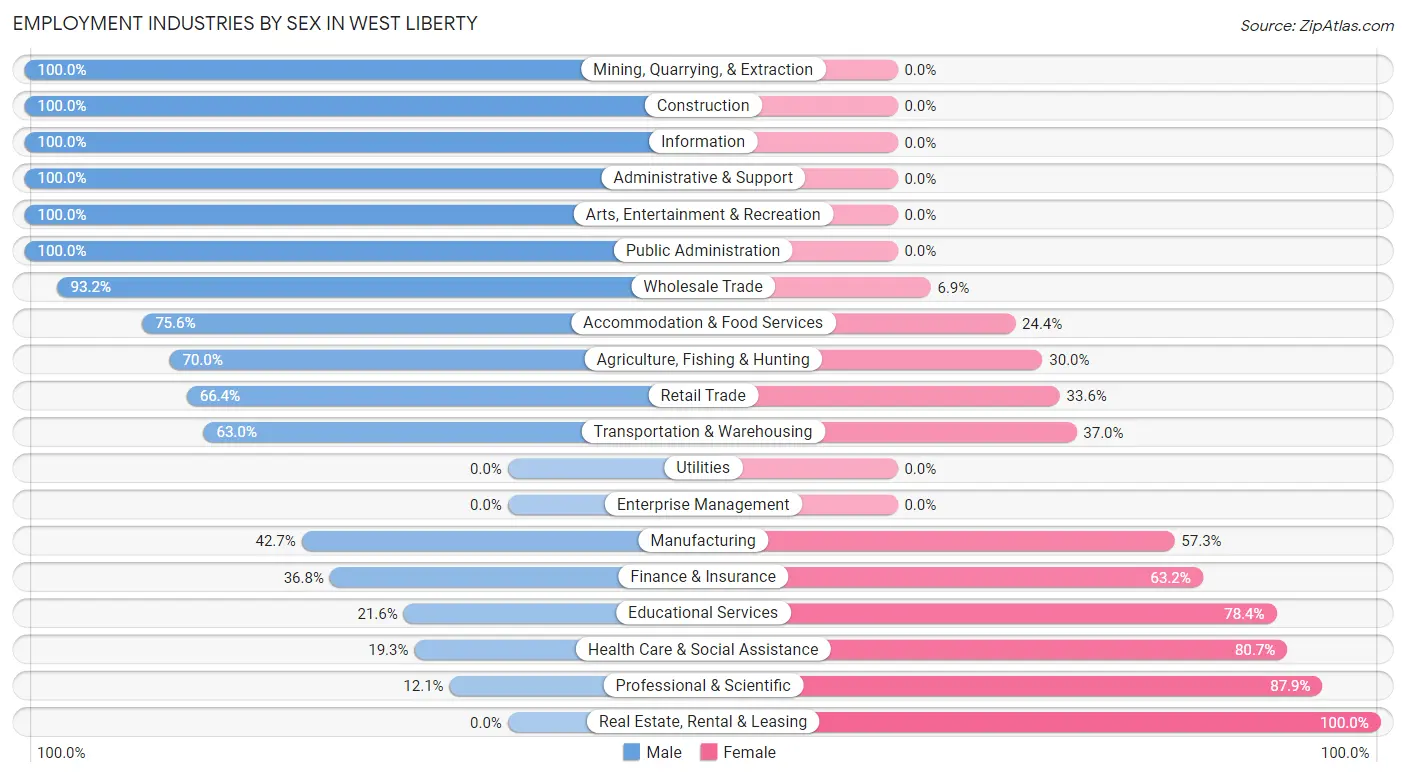
| Industry | Male | Female |
| Agriculture, Fishing & Hunting | 28 (70.0%) | 12 (30.0%) |
| Mining, Quarrying, & Extraction | 9 (100.0%) | 0 (0.0%) |
| Construction | 100 (100.0%) | 0 (0.0%) |
| Manufacturing | 364 (42.7%) | 489 (57.3%) |
| Wholesale Trade | 136 (93.1%) | 10 (6.9%) |
| Retail Trade | 91 (66.4%) | 46 (33.6%) |
| Transportation & Warehousing | 17 (63.0%) | 10 (37.0%) |
| Utilities | 0 (0.0%) | 0 (0.0%) |
| Information | 10 (100.0%) | 0 (0.0%) |
| Finance & Insurance | 7 (36.8%) | 12 (63.2%) |
| Real Estate, Rental & Leasing | 0 (0.0%) | 6 (100.0%) |
| Professional & Scientific | 7 (12.1%) | 51 (87.9%) |
| Enterprise Management | 0 (0.0%) | 0 (0.0%) |
| Administrative & Support | 73 (100.0%) | 0 (0.0%) |
| Educational Services | 44 (21.6%) | 160 (78.4%) |
| Health Care & Social Assistance | 41 (19.3%) | 171 (80.7%) |
| Arts, Entertainment & Recreation | 8 (100.0%) | 0 (0.0%) |
| Accommodation & Food Services | 59 (75.6%) | 19 (24.4%) |
| Public Administration | 6 (100.0%) | 0 (0.0%) |
| Total | 1,060 (51.6%) | 995 (48.4%) |
Education in West Liberty
School Enrollment in West Liberty
The most common levels of schooling among the 1,033 students in West Liberty are elementary school (303 | 29.3%), high school (254 | 24.6%), and middle school (197 | 19.1%).
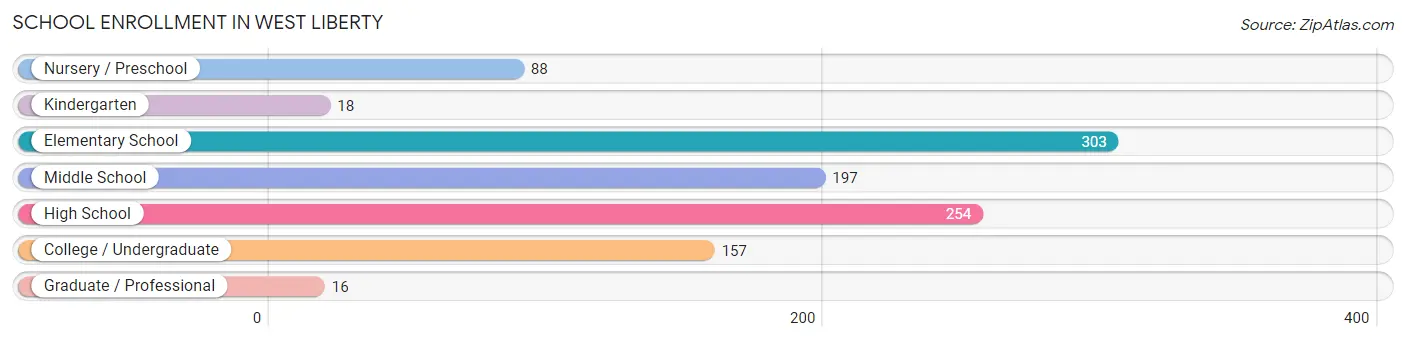
| School Level | # Students | % Students |
| Nursery / Preschool | 88 | 8.5% |
| Kindergarten | 18 | 1.7% |
| Elementary School | 303 | 29.3% |
| Middle School | 197 | 19.1% |
| High School | 254 | 24.6% |
| College / Undergraduate | 157 | 15.2% |
| Graduate / Professional | 16 | 1.5% |
| Total | 1,033 | 100.0% |
School Enrollment by Age by Funding Source in West Liberty
Out of a total of 1,033 students who are enrolled in schools in West Liberty, 57 (5.5%) attend a private institution, while the remaining 976 (94.5%) are enrolled in public schools. The age group of 35 years and over has the highest likelihood of being enrolled in private schools, with 16 (34.0% in the age bracket) enrolled. Conversely, the age group of 3 to 4 year olds has the lowest likelihood of being enrolled in a private school, with 23 (100.0% in the age bracket) attending a public institution.
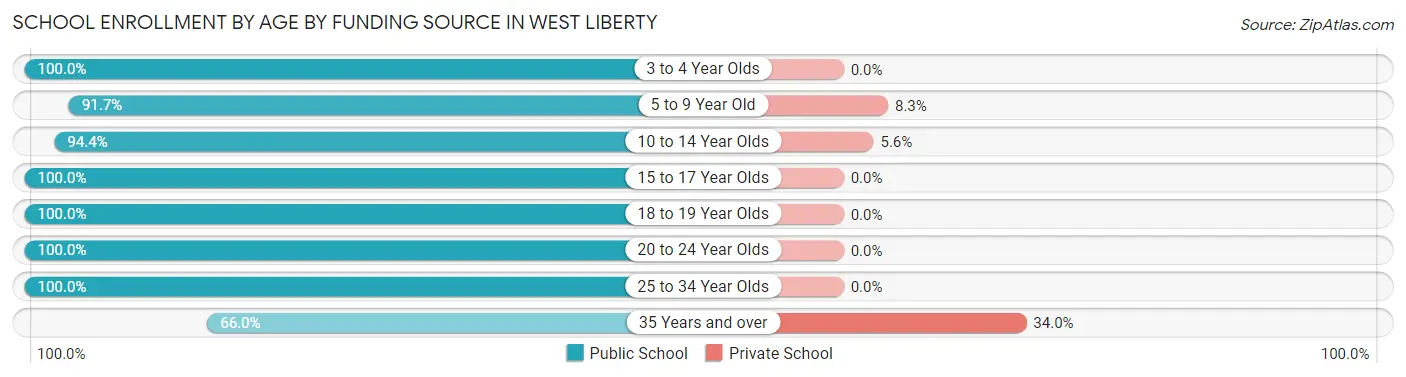
| Age Bracket | Public School | Private School |
| 3 to 4 Year Olds | 23 (100.0%) | 0 (0.0%) |
| 5 to 9 Year Old | 333 (91.7%) | 30 (8.3%) |
| 10 to 14 Year Olds | 187 (94.4%) | 11 (5.6%) |
| 15 to 17 Year Olds | 271 (100.0%) | 0 (0.0%) |
| 18 to 19 Year Olds | 66 (100.0%) | 0 (0.0%) |
| 20 to 24 Year Olds | 54 (100.0%) | 0 (0.0%) |
| 25 to 34 Year Olds | 11 (100.0%) | 0 (0.0%) |
| 35 Years and over | 31 (66.0%) | 16 (34.0%) |
| Total | 976 (94.5%) | 57 (5.5%) |
Educational Attainment by Field of Study in West Liberty
Education (79 | 22.3%), science & technology (76 | 21.4%), business (60 | 16.9%), visual & performing arts (25 | 7.0%), and literature & languages (19 | 5.3%) are the most common fields of study among 355 individuals in West Liberty who have obtained a bachelor's degree or higher.
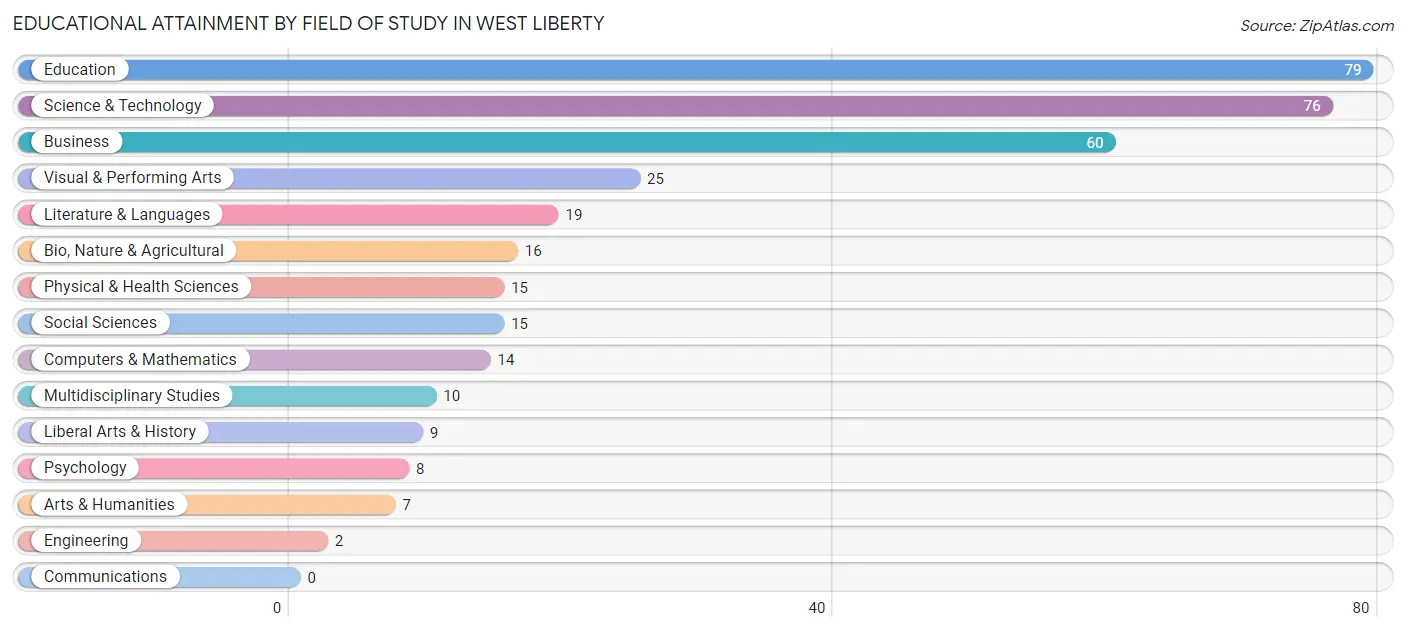
| Field of Study | # Graduates | % Graduates |
| Computers & Mathematics | 14 | 3.9% |
| Bio, Nature & Agricultural | 16 | 4.5% |
| Physical & Health Sciences | 15 | 4.2% |
| Psychology | 8 | 2.2% |
| Social Sciences | 15 | 4.2% |
| Engineering | 2 | 0.6% |
| Multidisciplinary Studies | 10 | 2.8% |
| Science & Technology | 76 | 21.4% |
| Business | 60 | 16.9% |
| Education | 79 | 22.3% |
| Literature & Languages | 19 | 5.3% |
| Liberal Arts & History | 9 | 2.5% |
| Visual & Performing Arts | 25 | 7.0% |
| Communications | 0 | 0.0% |
| Arts & Humanities | 7 | 2.0% |
| Total | 355 | 100.0% |
Transportation & Commute in West Liberty
Vehicle Availability by Sex in West Liberty
The most prevalent vehicle ownership categories in West Liberty are males with 2 vehicles (293, accounting for 28.4%) and females with 2 vehicles (189, making up 31.0%).
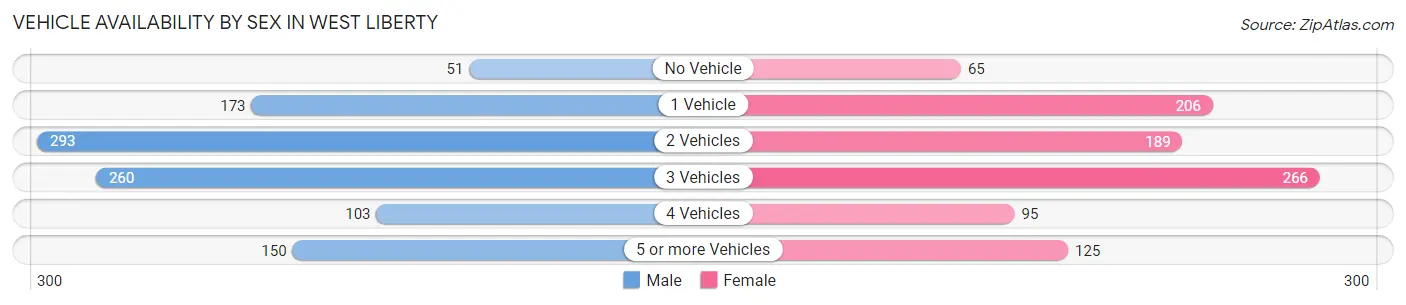
| Vehicles Available | Male | Female |
| No Vehicle | 51 (5.0%) | 65 (6.9%) |
| 1 Vehicle | 173 (16.8%) | 206 (21.8%) |
| 2 Vehicles | 293 (28.4%) | 189 (20.0%) |
| 3 Vehicles | 260 (25.2%) | 266 (28.1%) |
| 4 Vehicles | 103 (10.0%) | 95 (10.0%) |
| 5 or more Vehicles | 150 (14.6%) | 125 (13.2%) |
| Total | 1,030 (100.0%) | 946 (100.0%) |
Commute Time in West Liberty
The most frequently occuring commute durations in West Liberty are 5 to 9 minutes (331 commuters, 17.0%), 30 to 34 minutes (329 commuters, 16.9%), and less than 5 minutes (272 commuters, 14.0%).
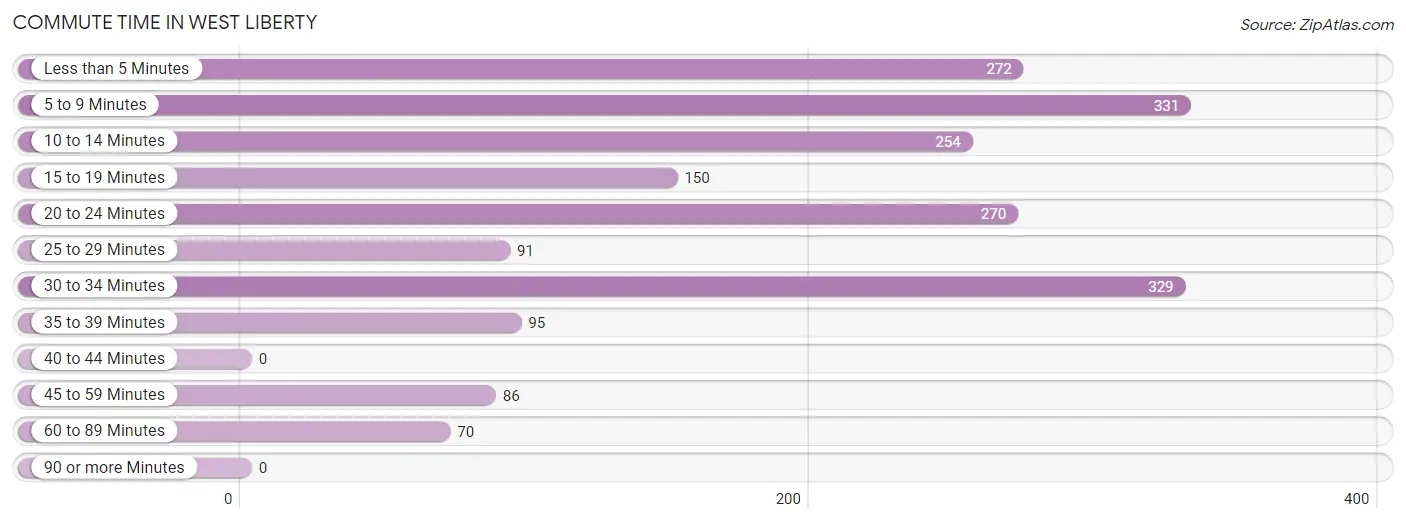
| Commute Time | # Commuters | % Commuters |
| Less than 5 Minutes | 272 | 14.0% |
| 5 to 9 Minutes | 331 | 17.0% |
| 10 to 14 Minutes | 254 | 13.0% |
| 15 to 19 Minutes | 150 | 7.7% |
| 20 to 24 Minutes | 270 | 13.9% |
| 25 to 29 Minutes | 91 | 4.7% |
| 30 to 34 Minutes | 329 | 16.9% |
| 35 to 39 Minutes | 95 | 4.9% |
| 40 to 44 Minutes | 0 | 0.0% |
| 45 to 59 Minutes | 86 | 4.4% |
| 60 to 89 Minutes | 70 | 3.6% |
| 90 or more Minutes | 0 | 0.0% |
Commute Time by Sex in West Liberty
The most common commute times in West Liberty are 5 to 9 minutes (155 commuters, 15.2%) for males and 30 to 34 minutes (201 commuters, 21.6%) for females.
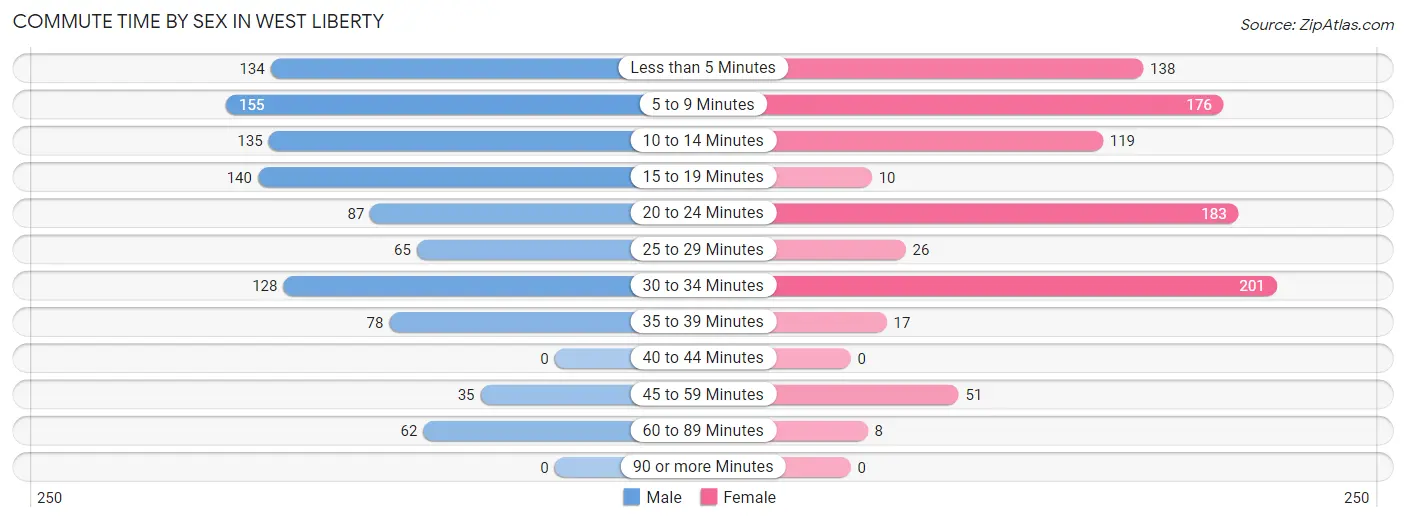
| Commute Time | Male | Female |
| Less than 5 Minutes | 134 (13.2%) | 138 (14.8%) |
| 5 to 9 Minutes | 155 (15.2%) | 176 (19.0%) |
| 10 to 14 Minutes | 135 (13.3%) | 119 (12.8%) |
| 15 to 19 Minutes | 140 (13.7%) | 10 (1.1%) |
| 20 to 24 Minutes | 87 (8.5%) | 183 (19.7%) |
| 25 to 29 Minutes | 65 (6.4%) | 26 (2.8%) |
| 30 to 34 Minutes | 128 (12.6%) | 201 (21.6%) |
| 35 to 39 Minutes | 78 (7.6%) | 17 (1.8%) |
| 40 to 44 Minutes | 0 (0.0%) | 0 (0.0%) |
| 45 to 59 Minutes | 35 (3.4%) | 51 (5.5%) |
| 60 to 89 Minutes | 62 (6.1%) | 8 (0.9%) |
| 90 or more Minutes | 0 (0.0%) | 0 (0.0%) |
Time of Departure to Work by Sex in West Liberty
The most frequent times of departure to work in West Liberty are 12:00 AM to 4:59 AM (239, 23.4%) for males and 6:00 AM to 6:29 AM (183, 19.7%) for females.
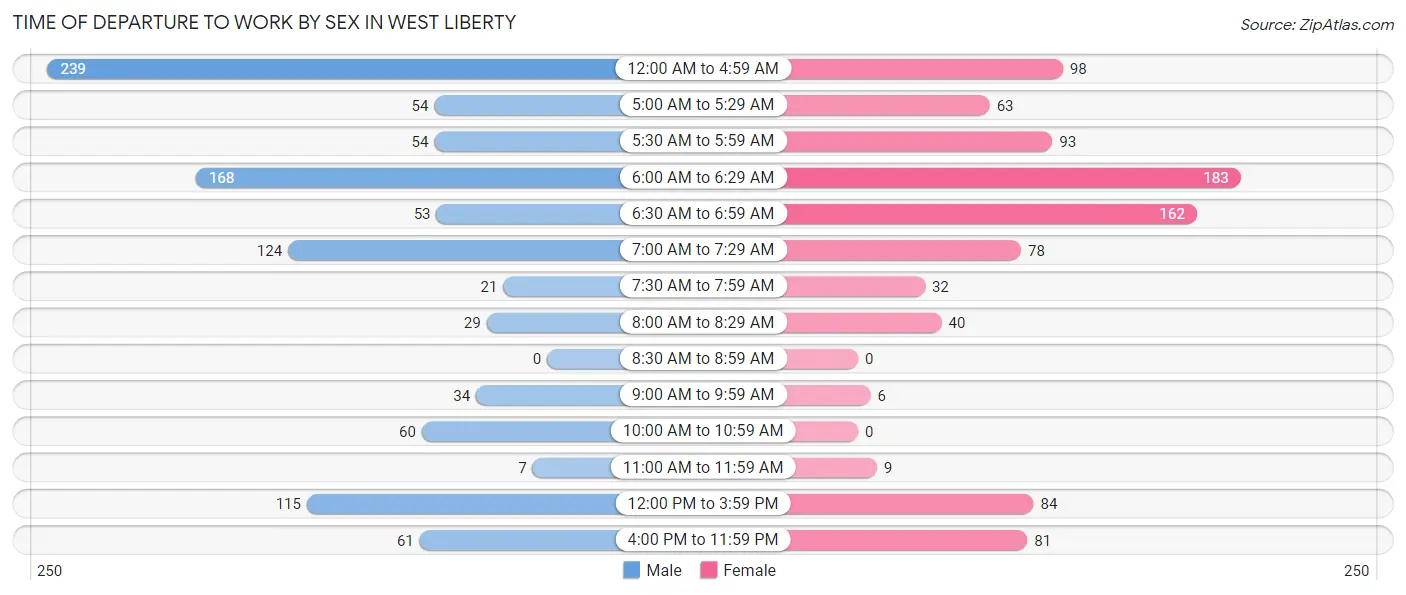
| Time of Departure | Male | Female |
| 12:00 AM to 4:59 AM | 239 (23.4%) | 98 (10.5%) |
| 5:00 AM to 5:29 AM | 54 (5.3%) | 63 (6.8%) |
| 5:30 AM to 5:59 AM | 54 (5.3%) | 93 (10.0%) |
| 6:00 AM to 6:29 AM | 168 (16.5%) | 183 (19.7%) |
| 6:30 AM to 6:59 AM | 53 (5.2%) | 162 (17.4%) |
| 7:00 AM to 7:29 AM | 124 (12.2%) | 78 (8.4%) |
| 7:30 AM to 7:59 AM | 21 (2.1%) | 32 (3.4%) |
| 8:00 AM to 8:29 AM | 29 (2.9%) | 40 (4.3%) |
| 8:30 AM to 8:59 AM | 0 (0.0%) | 0 (0.0%) |
| 9:00 AM to 9:59 AM | 34 (3.3%) | 6 (0.6%) |
| 10:00 AM to 10:59 AM | 60 (5.9%) | 0 (0.0%) |
| 11:00 AM to 11:59 AM | 7 (0.7%) | 9 (1.0%) |
| 12:00 PM to 3:59 PM | 115 (11.3%) | 84 (9.0%) |
| 4:00 PM to 11:59 PM | 61 (6.0%) | 81 (8.7%) |
| Total | 1,019 (100.0%) | 929 (100.0%) |
Housing Occupancy in West Liberty
Occupancy by Ownership in West Liberty
Of the total 1,315 dwellings in West Liberty, owner-occupied units account for 889 (67.6%), while renter-occupied units make up 426 (32.4%).
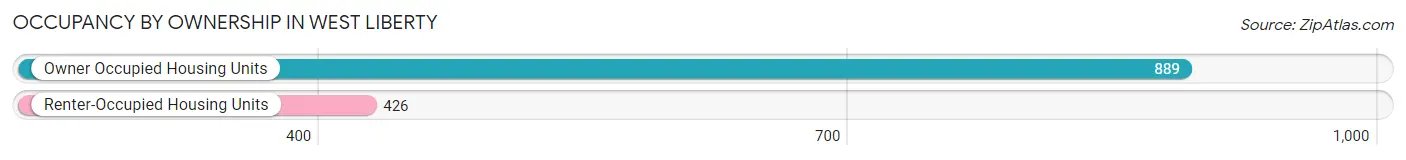
| Occupancy | # Housing Units | % Housing Units |
| Owner Occupied Housing Units | 889 | 67.6% |
| Renter-Occupied Housing Units | 426 | 32.4% |
| Total Occupied Housing Units | 1,315 | 100.0% |
Occupancy by Household Size in West Liberty
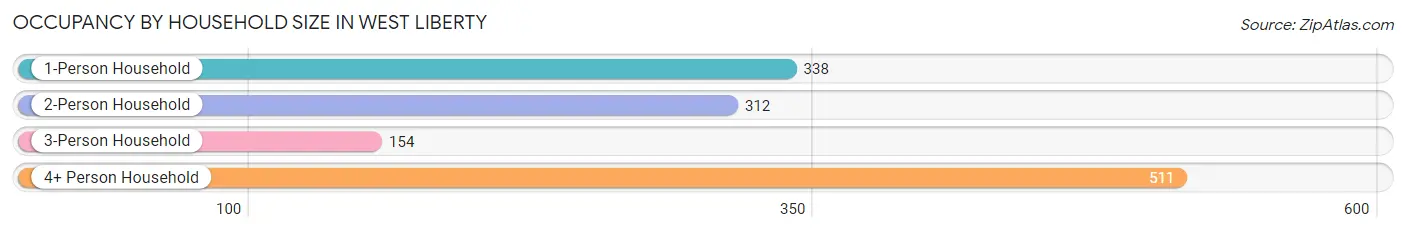
| Household Size | # Housing Units | % Housing Units |
| 1-Person Household | 338 | 25.7% |
| 2-Person Household | 312 | 23.7% |
| 3-Person Household | 154 | 11.7% |
| 4+ Person Household | 511 | 38.9% |
| Total Housing Units | 1,315 | 100.0% |
Occupancy by Ownership by Household Size in West Liberty
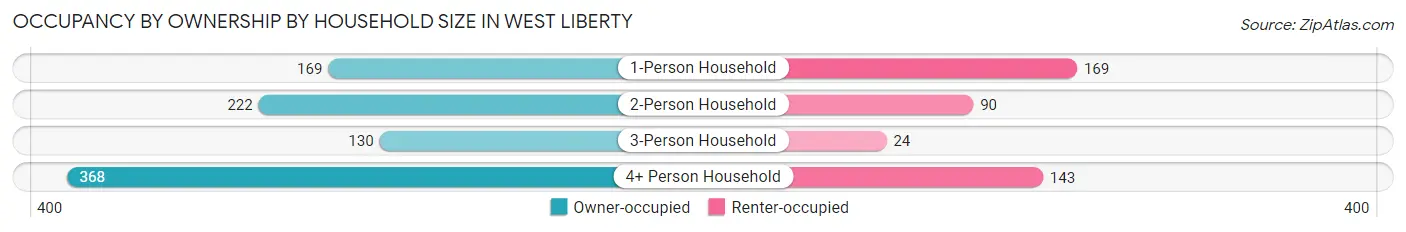
| Household Size | Owner-occupied | Renter-occupied |
| 1-Person Household | 169 (50.0%) | 169 (50.0%) |
| 2-Person Household | 222 (71.2%) | 90 (28.8%) |
| 3-Person Household | 130 (84.4%) | 24 (15.6%) |
| 4+ Person Household | 368 (72.0%) | 143 (28.0%) |
| Total Housing Units | 889 (67.6%) | 426 (32.4%) |
Occupancy by Educational Attainment in West Liberty
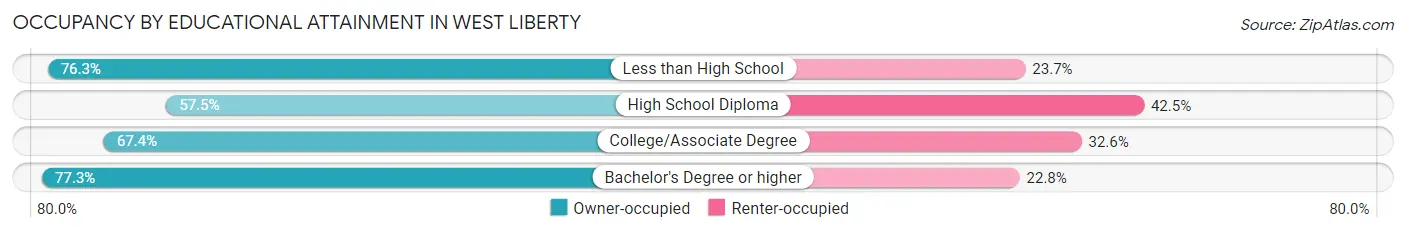
| Household Size | Owner-occupied | Renter-occupied |
| Less than High School | 229 (76.3%) | 71 (23.7%) |
| High School Diploma | 237 (57.5%) | 175 (42.5%) |
| College/Associate Degree | 294 (67.4%) | 142 (32.6%) |
| Bachelor's Degree or higher | 129 (77.2%) | 38 (22.8%) |
Occupancy by Age of Householder in West Liberty
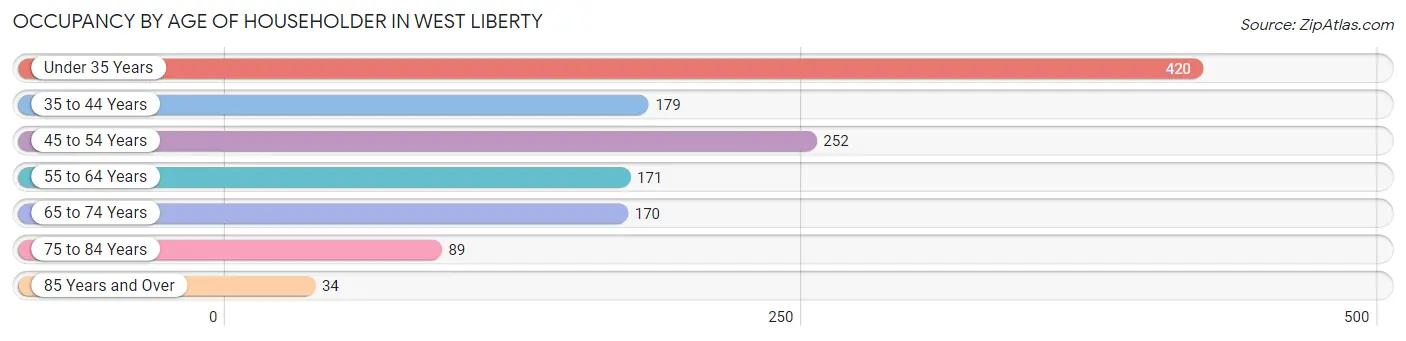
| Age Bracket | # Households | % Households |
| Under 35 Years | 420 | 31.9% |
| 35 to 44 Years | 179 | 13.6% |
| 45 to 54 Years | 252 | 19.2% |
| 55 to 64 Years | 171 | 13.0% |
| 65 to 74 Years | 170 | 12.9% |
| 75 to 84 Years | 89 | 6.8% |
| 85 Years and Over | 34 | 2.6% |
| Total | 1,315 | 100.0% |
Housing Finances in West Liberty
Median Income by Occupancy in West Liberty
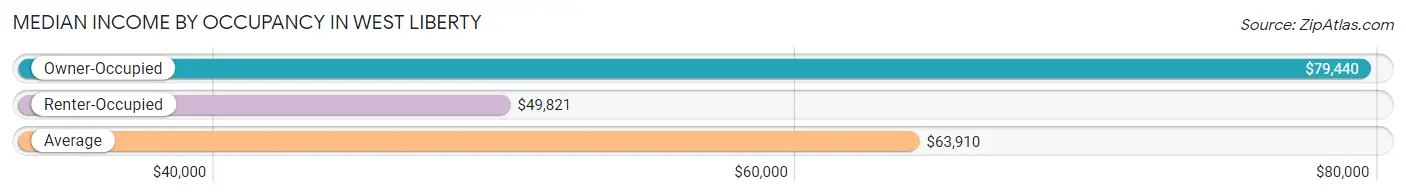
| Occupancy Type | # Households | Median Income |
| Owner-Occupied | 889 (67.6%) | $79,440 |
| Renter-Occupied | 426 (32.4%) | $49,821 |
| Average | 1,315 (100.0%) | $63,910 |
Occupancy by Householder Income Bracket in West Liberty
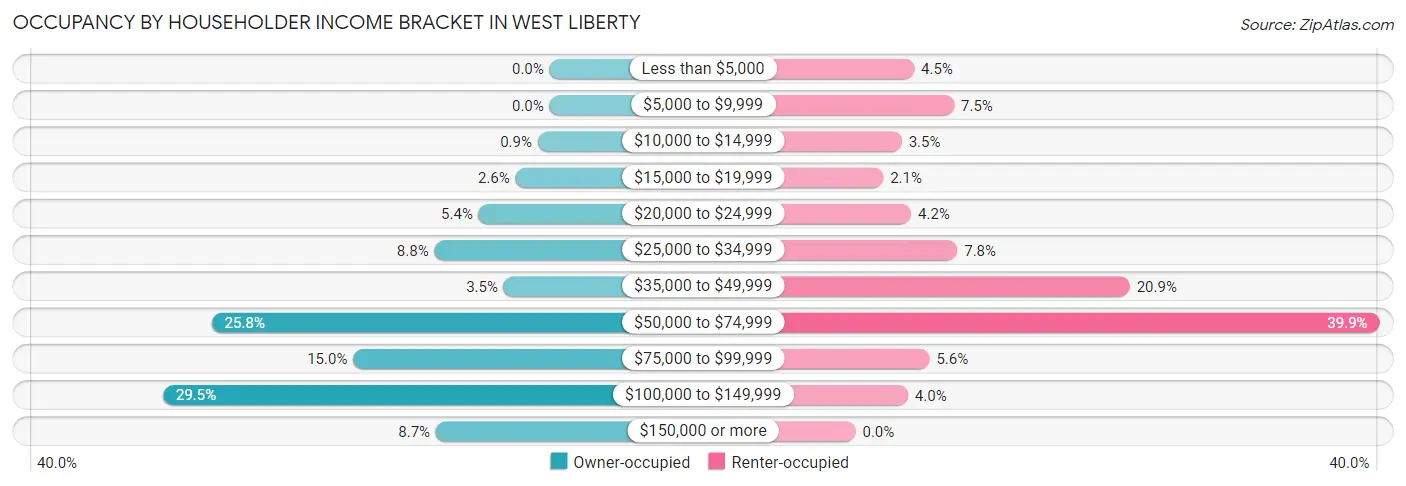
| Income Bracket | Owner-occupied | Renter-occupied |
| Less than $5,000 | 0 (0.0%) | 19 (4.5%) |
| $5,000 to $9,999 | 0 (0.0%) | 32 (7.5%) |
| $10,000 to $14,999 | 8 (0.9%) | 15 (3.5%) |
| $15,000 to $19,999 | 23 (2.6%) | 9 (2.1%) |
| $20,000 to $24,999 | 48 (5.4%) | 18 (4.2%) |
| $25,000 to $34,999 | 78 (8.8%) | 33 (7.7%) |
| $35,000 to $49,999 | 31 (3.5%) | 89 (20.9%) |
| $50,000 to $74,999 | 229 (25.8%) | 170 (39.9%) |
| $75,000 to $99,999 | 133 (15.0%) | 24 (5.6%) |
| $100,000 to $149,999 | 262 (29.5%) | 17 (4.0%) |
| $150,000 or more | 77 (8.7%) | 0 (0.0%) |
| Total | 889 (100.0%) | 426 (100.0%) |
Monthly Housing Cost Tiers in West Liberty
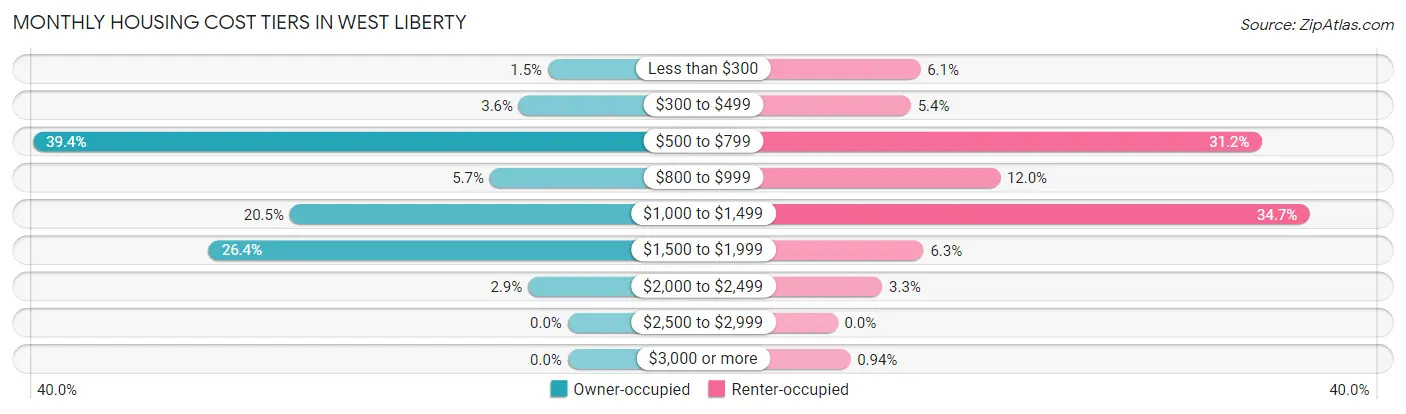
| Monthly Cost | Owner-occupied | Renter-occupied |
| Less than $300 | 13 (1.5%) | 26 (6.1%) |
| $300 to $499 | 32 (3.6%) | 23 (5.4%) |
| $500 to $799 | 350 (39.4%) | 133 (31.2%) |
| $800 to $999 | 51 (5.7%) | 51 (12.0%) |
| $1,000 to $1,499 | 182 (20.5%) | 148 (34.7%) |
| $1,500 to $1,999 | 235 (26.4%) | 27 (6.3%) |
| $2,000 to $2,499 | 26 (2.9%) | 14 (3.3%) |
| $2,500 to $2,999 | 0 (0.0%) | 0 (0.0%) |
| $3,000 or more | 0 (0.0%) | 4 (0.9%) |
| Total | 889 (100.0%) | 426 (100.0%) |
Physical Housing Characteristics in West Liberty
Housing Structures in West Liberty
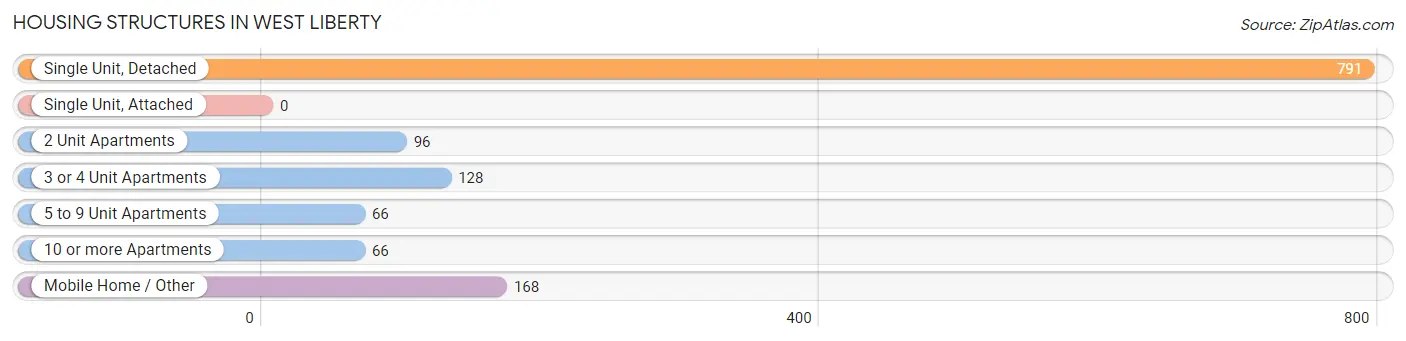
| Structure Type | # Housing Units | % Housing Units |
| Single Unit, Detached | 791 | 60.2% |
| Single Unit, Attached | 0 | 0.0% |
| 2 Unit Apartments | 96 | 7.3% |
| 3 or 4 Unit Apartments | 128 | 9.7% |
| 5 to 9 Unit Apartments | 66 | 5.0% |
| 10 or more Apartments | 66 | 5.0% |
| Mobile Home / Other | 168 | 12.8% |
| Total | 1,315 | 100.0% |
Housing Structures by Occupancy in West Liberty
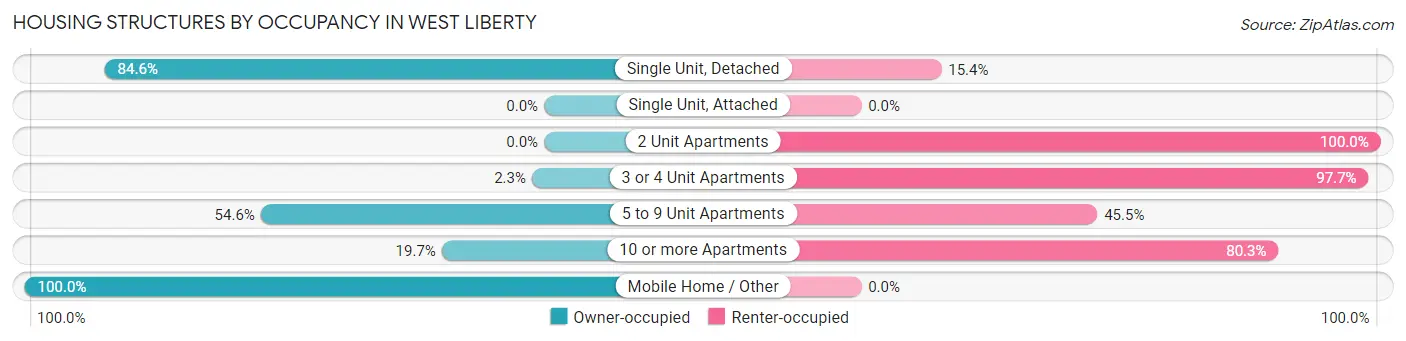
| Structure Type | Owner-occupied | Renter-occupied |
| Single Unit, Detached | 669 (84.6%) | 122 (15.4%) |
| Single Unit, Attached | 0 (0.0%) | 0 (0.0%) |
| 2 Unit Apartments | 0 (0.0%) | 96 (100.0%) |
| 3 or 4 Unit Apartments | 3 (2.3%) | 125 (97.7%) |
| 5 to 9 Unit Apartments | 36 (54.5%) | 30 (45.5%) |
| 10 or more Apartments | 13 (19.7%) | 53 (80.3%) |
| Mobile Home / Other | 168 (100.0%) | 0 (0.0%) |
| Total | 889 (67.6%) | 426 (32.4%) |
Housing Structures by Number of Rooms in West Liberty
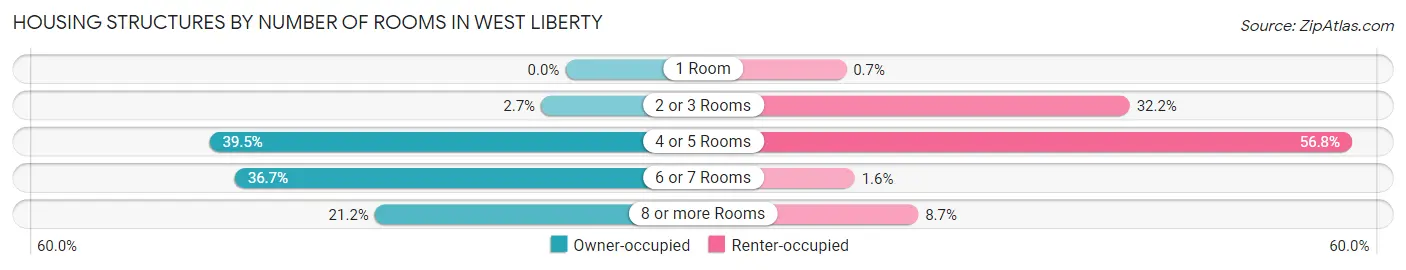
| Number of Rooms | Owner-occupied | Renter-occupied |
| 1 Room | 0 (0.0%) | 3 (0.7%) |
| 2 or 3 Rooms | 24 (2.7%) | 137 (32.2%) |
| 4 or 5 Rooms | 351 (39.5%) | 242 (56.8%) |
| 6 or 7 Rooms | 326 (36.7%) | 7 (1.6%) |
| 8 or more Rooms | 188 (21.1%) | 37 (8.7%) |
| Total | 889 (100.0%) | 426 (100.0%) |
Housing Structure by Heating Type in West Liberty
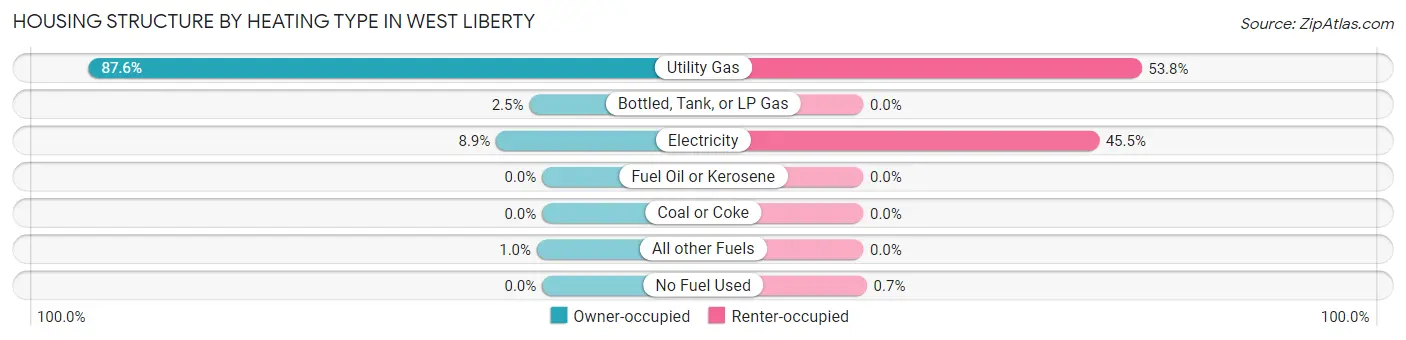
| Heating Type | Owner-occupied | Renter-occupied |
| Utility Gas | 779 (87.6%) | 229 (53.8%) |
| Bottled, Tank, or LP Gas | 22 (2.5%) | 0 (0.0%) |
| Electricity | 79 (8.9%) | 194 (45.5%) |
| Fuel Oil or Kerosene | 0 (0.0%) | 0 (0.0%) |
| Coal or Coke | 0 (0.0%) | 0 (0.0%) |
| All other Fuels | 9 (1.0%) | 0 (0.0%) |
| No Fuel Used | 0 (0.0%) | 3 (0.7%) |
| Total | 889 (100.0%) | 426 (100.0%) |
Household Vehicle Usage in West Liberty
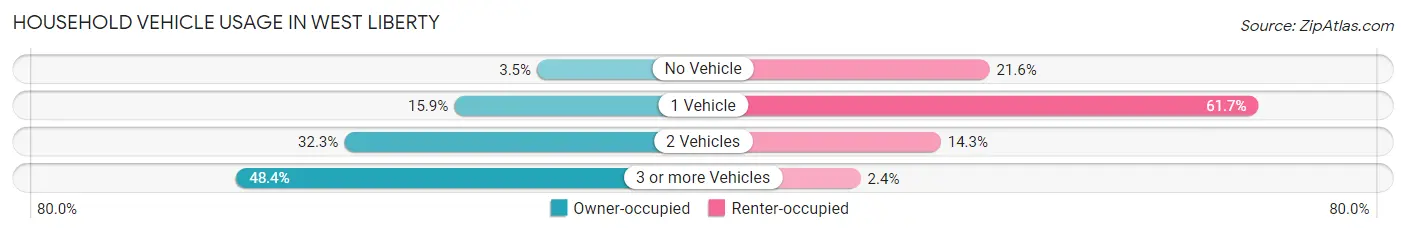
| Vehicles per Household | Owner-occupied | Renter-occupied |
| No Vehicle | 31 (3.5%) | 92 (21.6%) |
| 1 Vehicle | 141 (15.9%) | 263 (61.7%) |
| 2 Vehicles | 287 (32.3%) | 61 (14.3%) |
| 3 or more Vehicles | 430 (48.4%) | 10 (2.4%) |
| Total | 889 (100.0%) | 426 (100.0%) |
Real Estate & Mortgages in West Liberty
Real Estate and Mortgage Overview in West Liberty
| Characteristic | Without Mortgage | With Mortgage |
| Housing Units | 377 | 512 |
| Median Property Value | $99,700 | $168,800 |
| Median Household Income | $64,199 | $69 |
| Monthly Housing Costs | $574 | $0 |
| Real Estate Taxes | $2,292 | $0 |
Property Value by Mortgage Status in West Liberty
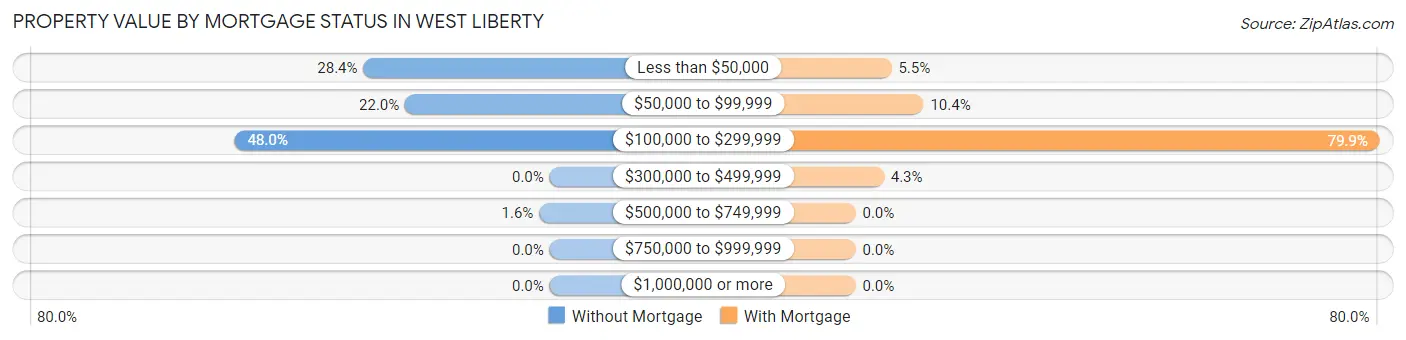
| Property Value | Without Mortgage | With Mortgage |
| Less than $50,000 | 107 (28.4%) | 28 (5.5%) |
| $50,000 to $99,999 | 83 (22.0%) | 53 (10.3%) |
| $100,000 to $299,999 | 181 (48.0%) | 409 (79.9%) |
| $300,000 to $499,999 | 0 (0.0%) | 22 (4.3%) |
| $500,000 to $749,999 | 6 (1.6%) | 0 (0.0%) |
| $750,000 to $999,999 | 0 (0.0%) | 0 (0.0%) |
| $1,000,000 or more | 0 (0.0%) | 0 (0.0%) |
| Total | 377 (100.0%) | 512 (100.0%) |
Household Income by Mortgage Status in West Liberty
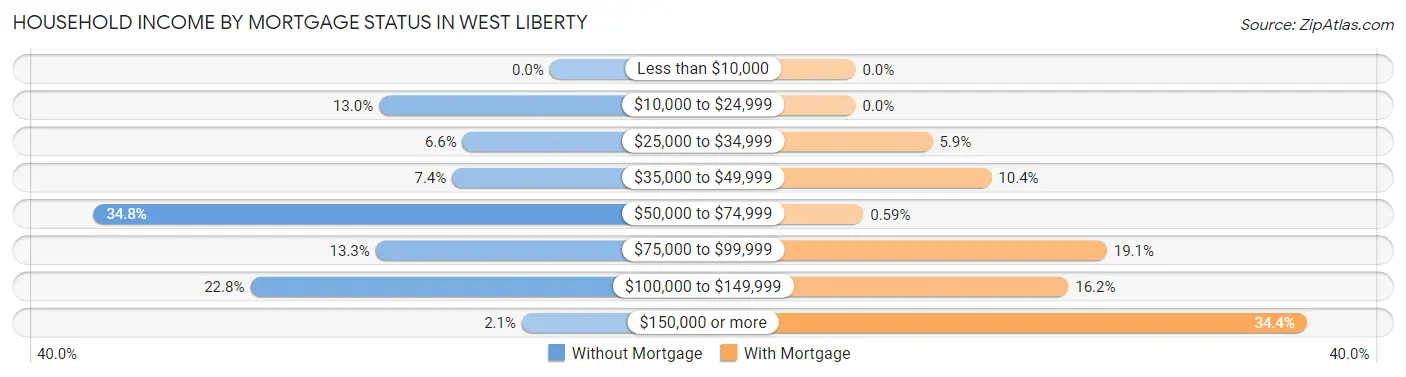
| Household Income | Without Mortgage | With Mortgage |
| Less than $10,000 | 0 (0.0%) | 0 (0.0%) |
| $10,000 to $24,999 | 49 (13.0%) | 0 (0.0%) |
| $25,000 to $34,999 | 25 (6.6%) | 30 (5.9%) |
| $35,000 to $49,999 | 28 (7.4%) | 53 (10.3%) |
| $50,000 to $74,999 | 131 (34.7%) | 3 (0.6%) |
| $75,000 to $99,999 | 50 (13.3%) | 98 (19.1%) |
| $100,000 to $149,999 | 86 (22.8%) | 83 (16.2%) |
| $150,000 or more | 8 (2.1%) | 176 (34.4%) |
| Total | 377 (100.0%) | 512 (100.0%) |
Property Value to Household Income Ratio in West Liberty
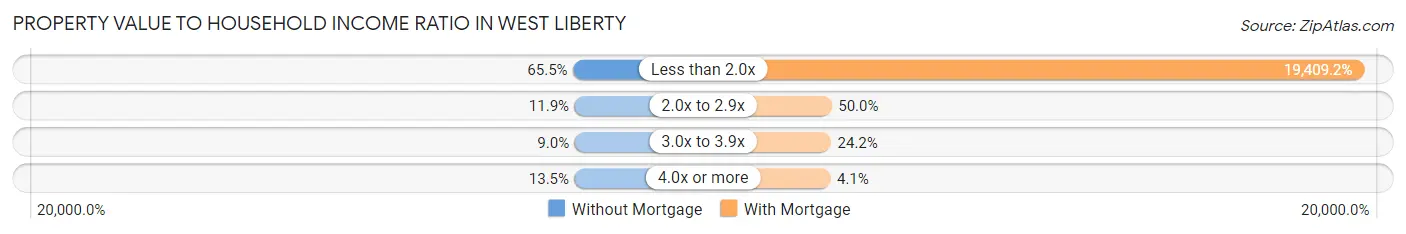
| Value-to-Income Ratio | Without Mortgage | With Mortgage |
| Less than 2.0x | 247 (65.5%) | 99,375 (19,409.2%) |
| 2.0x to 2.9x | 45 (11.9%) | 256 (50.0%) |
| 3.0x to 3.9x | 34 (9.0%) | 124 (24.2%) |
| 4.0x or more | 51 (13.5%) | 21 (4.1%) |
| Total | 377 (100.0%) | 512 (100.0%) |
Real Estate Taxes by Mortgage Status in West Liberty
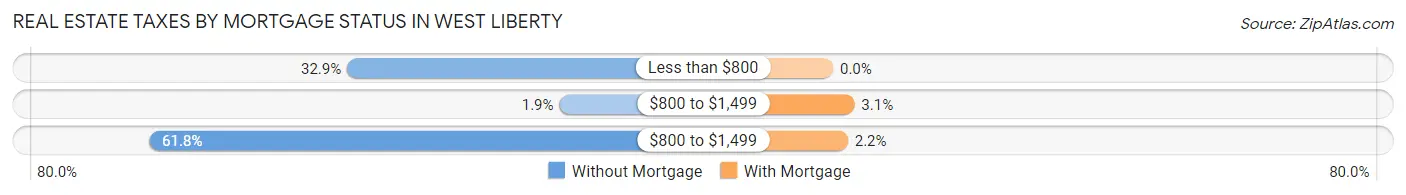
| Property Taxes | Without Mortgage | With Mortgage |
| Less than $800 | 124 (32.9%) | 0 (0.0%) |
| $800 to $1,499 | 7 (1.9%) | 16 (3.1%) |
| $800 to $1,499 | 233 (61.8%) | 11 (2.1%) |
| Total | 377 (100.0%) | 512 (100.0%) |
Health & Disability in West Liberty
Health Insurance Coverage by Age in West Liberty
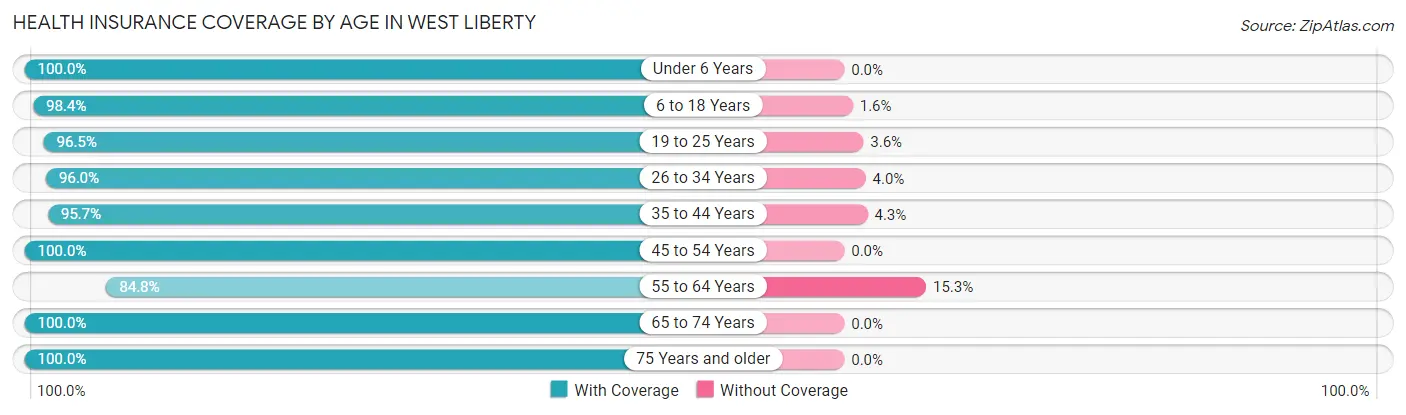
| Age Bracket | With Coverage | Without Coverage |
| Under 6 Years | 253 (100.0%) | 0 (0.0%) |
| 6 to 18 Years | 810 (98.4%) | 13 (1.6%) |
| 19 to 25 Years | 380 (96.5%) | 14 (3.5%) |
| 26 to 34 Years | 580 (96.0%) | 24 (4.0%) |
| 35 to 44 Years | 486 (95.7%) | 22 (4.3%) |
| 45 to 54 Years | 392 (100.0%) | 0 (0.0%) |
| 55 to 64 Years | 300 (84.8%) | 54 (15.2%) |
| 65 to 74 Years | 282 (100.0%) | 0 (0.0%) |
| 75 Years and older | 162 (100.0%) | 0 (0.0%) |
| Total | 3,645 (96.6%) | 127 (3.4%) |
Health Insurance Coverage by Citizenship Status in West Liberty
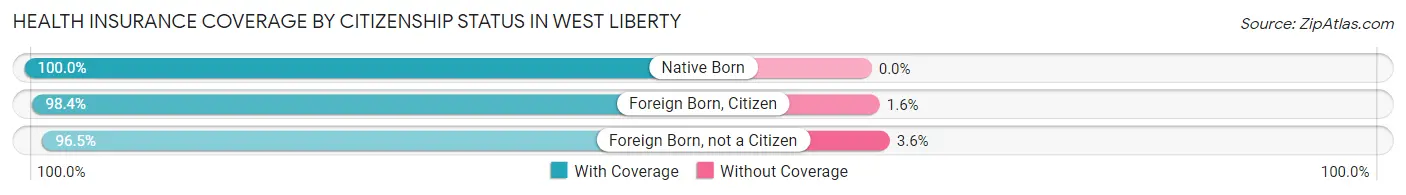
| Citizenship Status | With Coverage | Without Coverage |
| Native Born | 253 (100.0%) | 0 (0.0%) |
| Foreign Born, Citizen | 810 (98.4%) | 13 (1.6%) |
| Foreign Born, not a Citizen | 380 (96.5%) | 14 (3.5%) |
Health Insurance Coverage by Household Income in West Liberty
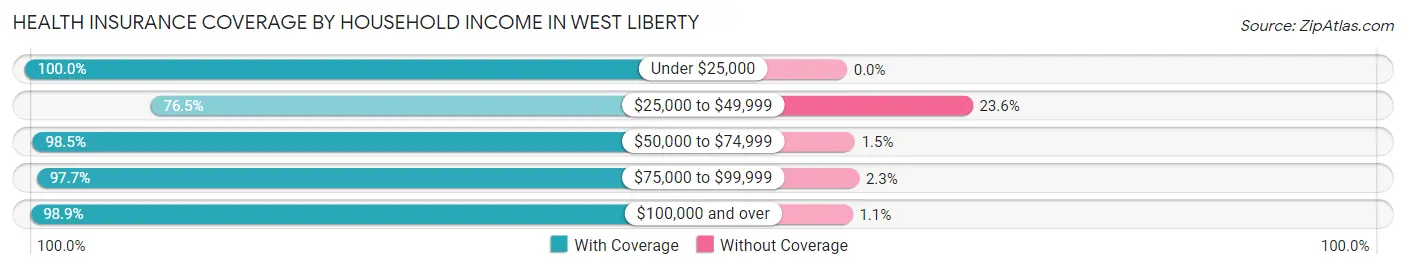
| Household Income | With Coverage | Without Coverage |
| Under $25,000 | 247 (100.0%) | 0 (0.0%) |
| $25,000 to $49,999 | 263 (76.4%) | 81 (23.5%) |
| $50,000 to $74,999 | 1,265 (98.5%) | 19 (1.5%) |
| $75,000 to $99,999 | 557 (97.7%) | 13 (2.3%) |
| $100,000 and over | 1,313 (98.9%) | 14 (1.1%) |
Public vs Private Health Insurance Coverage by Age in West Liberty
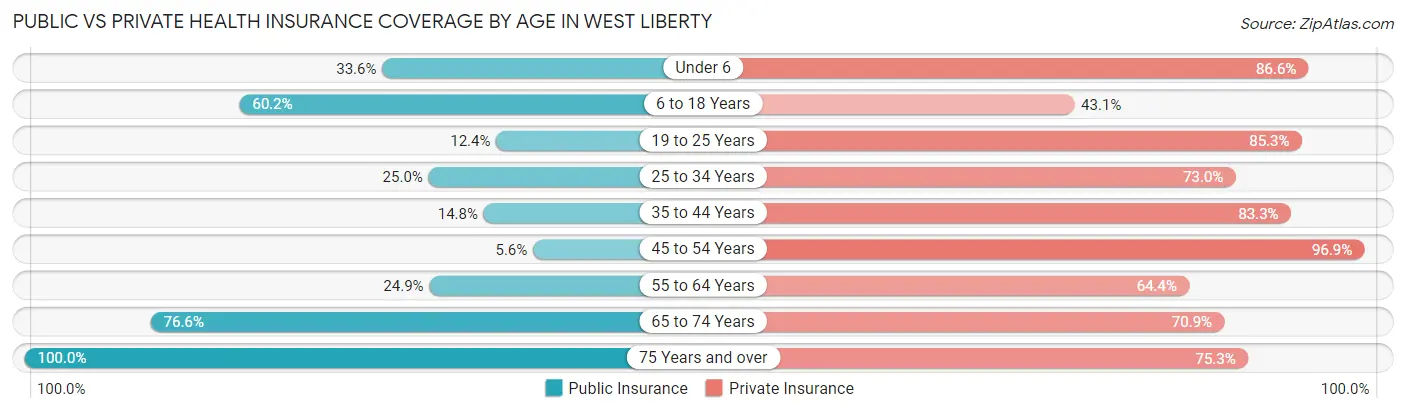
| Age Bracket | Public Insurance | Private Insurance |
| Under 6 | 85 (33.6%) | 219 (86.6%) |
| 6 to 18 Years | 495 (60.2%) | 355 (43.1%) |
| 19 to 25 Years | 49 (12.4%) | 336 (85.3%) |
| 25 to 34 Years | 151 (25.0%) | 441 (73.0%) |
| 35 to 44 Years | 75 (14.8%) | 423 (83.3%) |
| 45 to 54 Years | 22 (5.6%) | 380 (96.9%) |
| 55 to 64 Years | 88 (24.9%) | 228 (64.4%) |
| 65 to 74 Years | 216 (76.6%) | 200 (70.9%) |
| 75 Years and over | 162 (100.0%) | 122 (75.3%) |
| Total | 1,343 (35.6%) | 2,704 (71.7%) |
Disability Status by Sex by Age in West Liberty
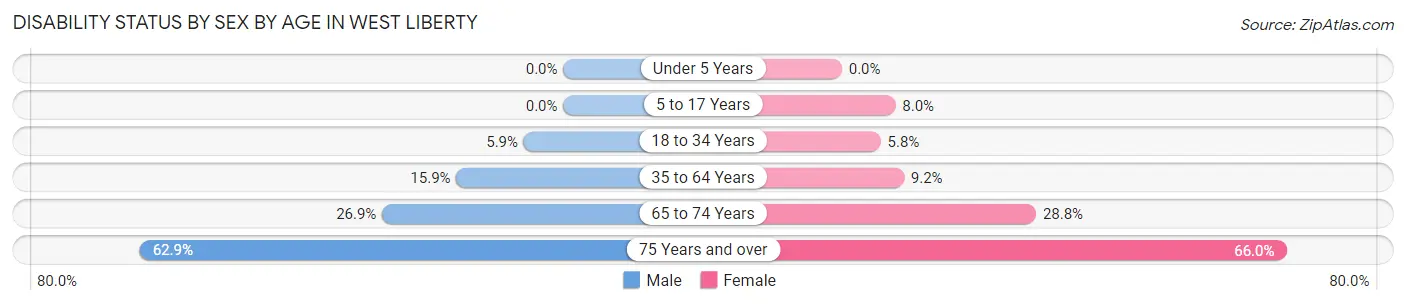
| Age Bracket | Male | Female |
| Under 5 Years | 0 (0.0%) | 0 (0.0%) |
| 5 to 17 Years | 0 (0.0%) | 36 (8.0%) |
| 18 to 34 Years | 35 (5.9%) | 26 (5.8%) |
| 35 to 64 Years | 94 (15.9%) | 61 (9.2%) |
| 65 to 74 Years | 46 (26.9%) | 32 (28.8%) |
| 75 Years and over | 39 (62.9%) | 66 (66.0%) |
Disability Class by Sex by Age in West Liberty
Disability Class: Hearing Difficulty
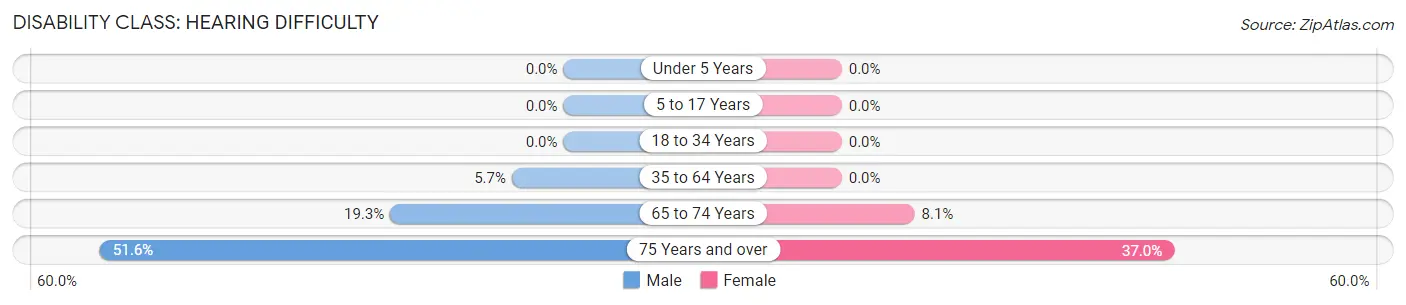
| Age Bracket | Male | Female |
| Under 5 Years | 0 (0.0%) | 0 (0.0%) |
| 5 to 17 Years | 0 (0.0%) | 0 (0.0%) |
| 18 to 34 Years | 0 (0.0%) | 0 (0.0%) |
| 35 to 64 Years | 34 (5.7%) | 0 (0.0%) |
| 65 to 74 Years | 33 (19.3%) | 9 (8.1%) |
| 75 Years and over | 32 (51.6%) | 37 (37.0%) |
Disability Class: Vision Difficulty
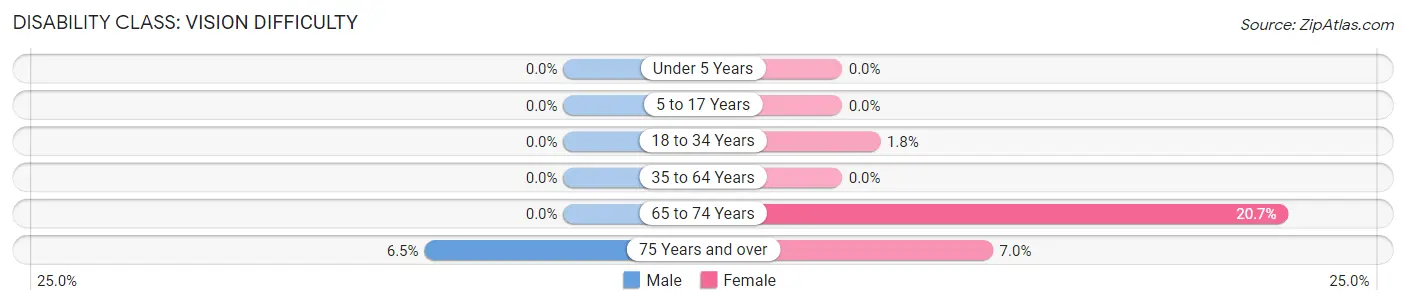
| Age Bracket | Male | Female |
| Under 5 Years | 0 (0.0%) | 0 (0.0%) |
| 5 to 17 Years | 0 (0.0%) | 0 (0.0%) |
| 18 to 34 Years | 0 (0.0%) | 8 (1.8%) |
| 35 to 64 Years | 0 (0.0%) | 0 (0.0%) |
| 65 to 74 Years | 0 (0.0%) | 23 (20.7%) |
| 75 Years and over | 4 (6.5%) | 7 (7.0%) |
Disability Class: Cognitive Difficulty
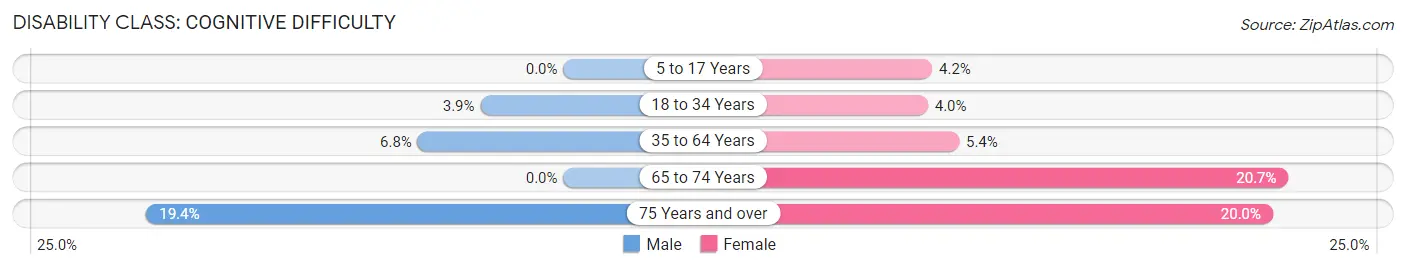
| Age Bracket | Male | Female |
| 5 to 17 Years | 0 (0.0%) | 19 (4.2%) |
| 18 to 34 Years | 23 (3.8%) | 18 (4.0%) |
| 35 to 64 Years | 40 (6.8%) | 36 (5.4%) |
| 65 to 74 Years | 0 (0.0%) | 23 (20.7%) |
| 75 Years and over | 12 (19.4%) | 20 (20.0%) |
Disability Class: Ambulatory Difficulty
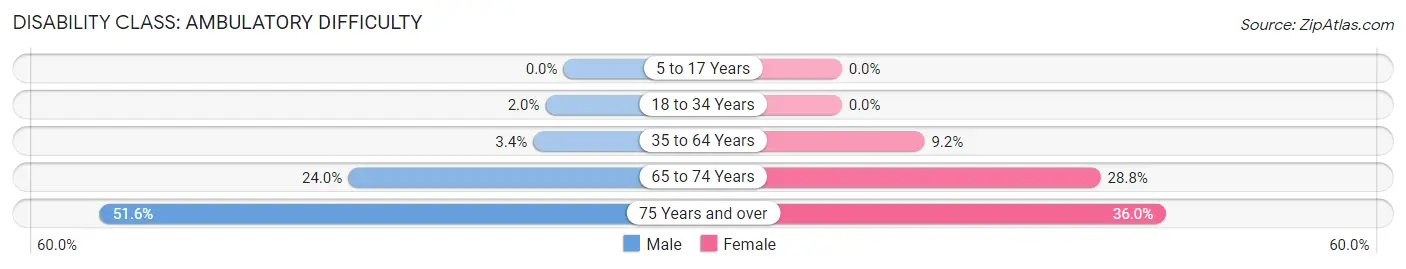
| Age Bracket | Male | Female |
| 5 to 17 Years | 0 (0.0%) | 0 (0.0%) |
| 18 to 34 Years | 12 (2.0%) | 0 (0.0%) |
| 35 to 64 Years | 20 (3.4%) | 61 (9.2%) |
| 65 to 74 Years | 41 (24.0%) | 32 (28.8%) |
| 75 Years and over | 32 (51.6%) | 36 (36.0%) |
Disability Class: Self-Care Difficulty
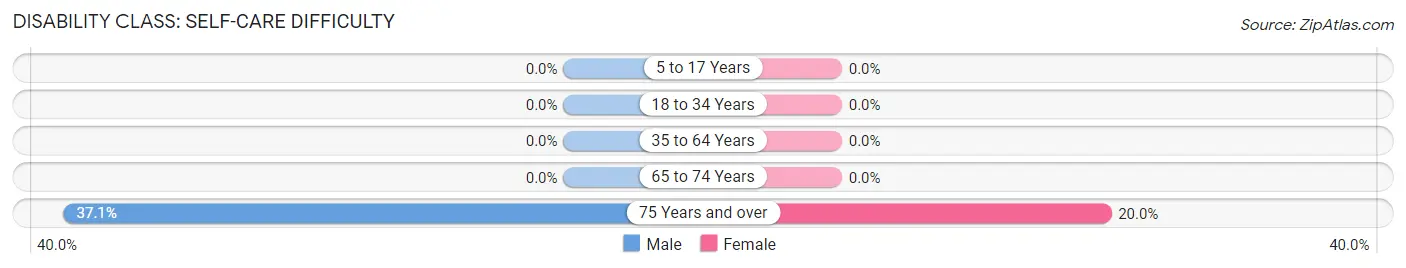
| Age Bracket | Male | Female |
| 5 to 17 Years | 0 (0.0%) | 0 (0.0%) |
| 18 to 34 Years | 0 (0.0%) | 0 (0.0%) |
| 35 to 64 Years | 0 (0.0%) | 0 (0.0%) |
| 65 to 74 Years | 0 (0.0%) | 0 (0.0%) |
| 75 Years and over | 23 (37.1%) | 20 (20.0%) |
Technology Access in West Liberty
Computing Device Access in West Liberty
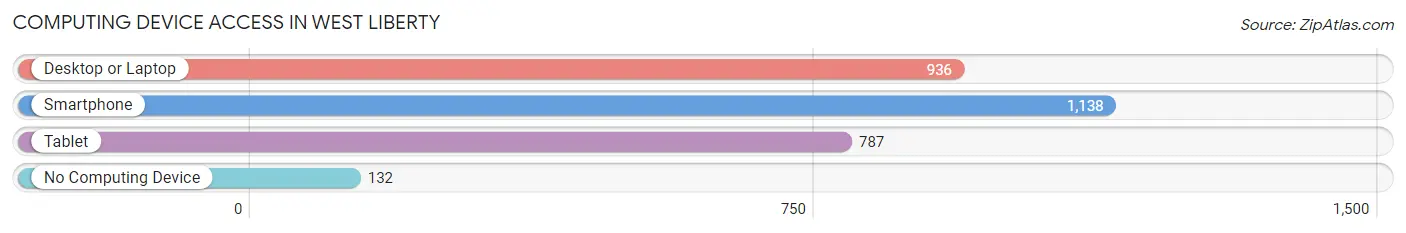
| Device Type | # Households | % Households |
| Desktop or Laptop | 936 | 71.2% |
| Smartphone | 1,138 | 86.5% |
| Tablet | 787 | 59.9% |
| No Computing Device | 132 | 10.0% |
| Total | 1,315 | 100.0% |
Internet Access in West Liberty
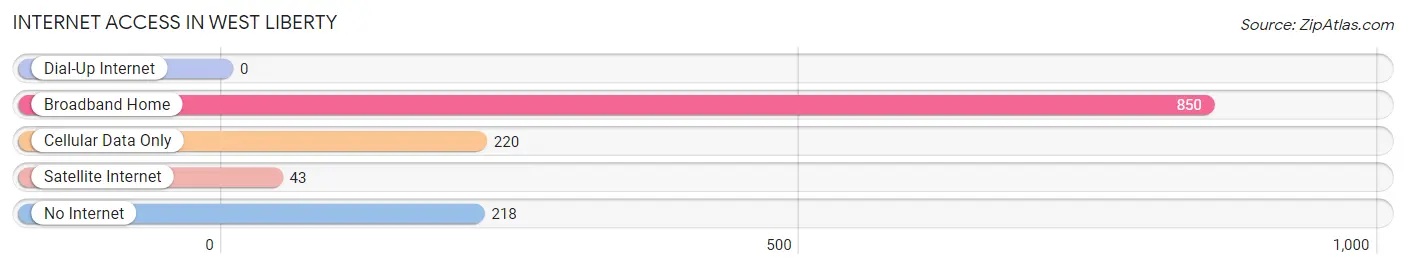
| Internet Type | # Households | % Households |
| Dial-Up Internet | 0 | 0.0% |
| Broadband Home | 850 | 64.6% |
| Cellular Data Only | 220 | 16.7% |
| Satellite Internet | 43 | 3.3% |
| No Internet | 218 | 16.6% |
| Total | 1,315 | 100.0% |
West Liberty Summary
West Liberty, Iowa is a small city located in Muscatine County, Iowa. It is situated on the banks of the Cedar River, approximately 25 miles southeast of Iowa City. The city has a population of 3,726 people, according to the 2010 census.
History
West Liberty was founded in 1836 by a group of settlers from Ohio. The town was originally named Liberty, but the name was changed to West Liberty in 1837 to avoid confusion with another town in the state. The town was incorporated in 1853.
In the late 19th century, West Liberty was a thriving agricultural center. The town was home to several grain elevators, a flour mill, and a creamery. The town also had a large number of businesses, including a hotel, a bank, a newspaper, and a variety of stores.
In the early 20th century, West Liberty experienced a period of growth and prosperity. The town was home to several factories, including a furniture factory, a canning factory, and a brickyard. The town also had a movie theater, a bowling alley, and a variety of other businesses.
Geography
West Liberty is located in Muscatine County, Iowa. The city is situated on the banks of the Cedar River, approximately 25 miles southeast of Iowa City. The city has a total area of 2.3 square miles, all of which is land.
The city is located in the Central Lowland region of the United States. The climate is humid continental, with hot summers and cold winters. The average annual temperature is 48°F, and the average annual precipitation is 36 inches.
Economy
West Liberty’s economy is largely based on agriculture. The city is home to several grain elevators, a flour mill, and a creamery. The town also has a variety of businesses, including a hotel, a bank, a newspaper, and a variety of stores.
The city is also home to several manufacturing companies, including a furniture factory, a canning factory, and a brickyard. The city also has a variety of other businesses, including a movie theater, a bowling alley, and a variety of other stores.
Demographics
According to the 2010 census, West Liberty has a population of 3,726 people. The racial makeup of the city is 95.3% White, 0.7% African American, 0.3% Native American, 0.7% Asian, 0.1% Pacific Islander, 1.2% from other races, and 1.7% from two or more races. The median household income is $41,944, and the median family income is $50,917. The per capita income is $20,845.
Conclusion
West Liberty, Iowa is a small city located in Muscatine County, Iowa. It is situated on the banks of the Cedar River, approximately 25 miles southeast of Iowa City. The city has a population of 3,726 people, according to the 2010 census. The city’s economy is largely based on agriculture, and it is home to several manufacturing companies. The racial makeup of the city is 95.3% White, 0.7% African American, 0.3% Native American, 0.7% Asian, 0.1% Pacific Islander, 1.2% from other races, and 1.7% from two or more races. The median household income is $41,944, and the median family income is $50,917. The per capita income is $20,845.
Common Questions
What is Per Capita Income in West Liberty?
Per Capita income in West Liberty is $25,783.
What is the Median Family Income in West Liberty?
Median Family Income in West Liberty is $73,456.
What is the Median Household income in West Liberty?
Median Household Income in West Liberty is $63,910.
What is Income or Wage Gap in West Liberty?
Income or Wage Gap in West Liberty is 6.4%.
Women in West Liberty earn 93.6 cents for every dollar earned by a man.
What is Inequality or Gini Index in West Liberty?
Inequality or Gini Index in West Liberty is 0.32.
What is the Total Population of West Liberty?
Total Population of West Liberty is 3,821.
What is the Total Male Population of West Liberty?
Total Male Population of West Liberty is 1,901.
What is the Total Female Population of West Liberty?
Total Female Population of West Liberty is 1,920.
What is the Ratio of Males per 100 Females in West Liberty?
There are 99.01 Males per 100 Females in West Liberty.
What is the Ratio of Females per 100 Males in West Liberty?
There are 101.00 Females per 100 Males in West Liberty.
What is the Median Population Age in West Liberty?
Median Population Age in West Liberty is 33.5 Years.
What is the Average Family Size in West Liberty
Average Family Size in West Liberty is 3.6 People.
What is the Average Household Size in West Liberty
Average Household Size in West Liberty is 2.9 People.
How Large is the Labor Force in West Liberty?
There are 2,145 People in the Labor Forcein in West Liberty.
What is the Percentage of People in the Labor Force in West Liberty?
73.6% of People are in the Labor Force in West Liberty.
What is the Unemployment Rate in West Liberty?
Unemployment Rate in West Liberty is 4.2%.