Wedgefield, FL Map & Demographics
Wedgefield Map
Wedgefield Overview
$38,572
PER CAPITA INCOME
$113,447
AVG FAMILY INCOME
$107,446
AVG HOUSEHOLD INCOME
11.1%
WAGE / INCOME GAP [ % ]
88.9¢/ $1
WAGE / INCOME GAP [ $ ]
0.31
INEQUALITY / GINI INDEX
8,277
TOTAL POPULATION
3,625
MALE POPULATION
4,652
FEMALE POPULATION
77.92
MALES / 100 FEMALES
128.33
FEMALES / 100 MALES
43.2
MEDIAN AGE
3.5
AVG FAMILY SIZE
3.2
AVG HOUSEHOLD SIZE
3,913
LABOR FORCE [ PEOPLE ]
58.9%
PERCENT IN LABOR FORCE
1.8%
UNEMPLOYMENT RATE
Income in Wedgefield
Income Overview in Wedgefield
Per Capita Income in Wedgefield is $38,572, while median incomes of families and households are $113,447 and $107,446 respectively.
| Characteristic | Number | Measure |
| Per Capita Income | 8,277 | $38,572 |
| Median Family Income | 2,239 | $113,447 |
| Mean Family Income | 2,239 | $122,360 |
| Median Household Income | 2,604 | $107,446 |
| Mean Household Income | 2,604 | $118,231 |
| Income Deficit | 2,239 | $0 |
| Wage / Income Gap (%) | 8,277 | 11.05% |
| Wage / Income Gap ($) | 8,277 | 88.95¢ per $1 |
| Gini / Inequality Index | 8,277 | 0.31 |
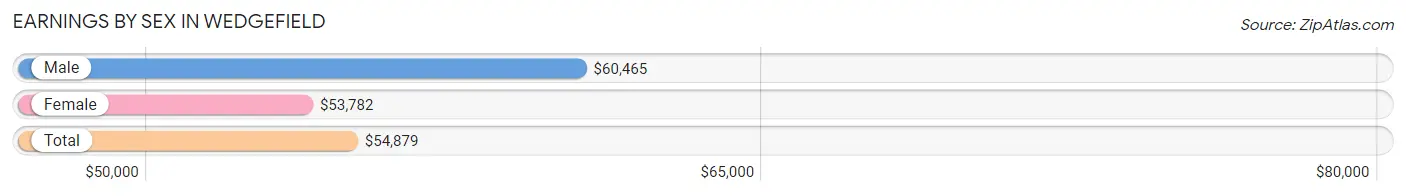
Earnings by Sex in Wedgefield
Average Earnings in Wedgefield are $54,879, $60,465 for men and $53,782 for women, a difference of 11.1%.
| Sex | Number | Average Earnings |
| Male | 1,928 (48.9%) | $60,465 |
| Female | 2,013 (51.1%) | $53,782 |
| Total | 3,941 (100.0%) | $54,879 |
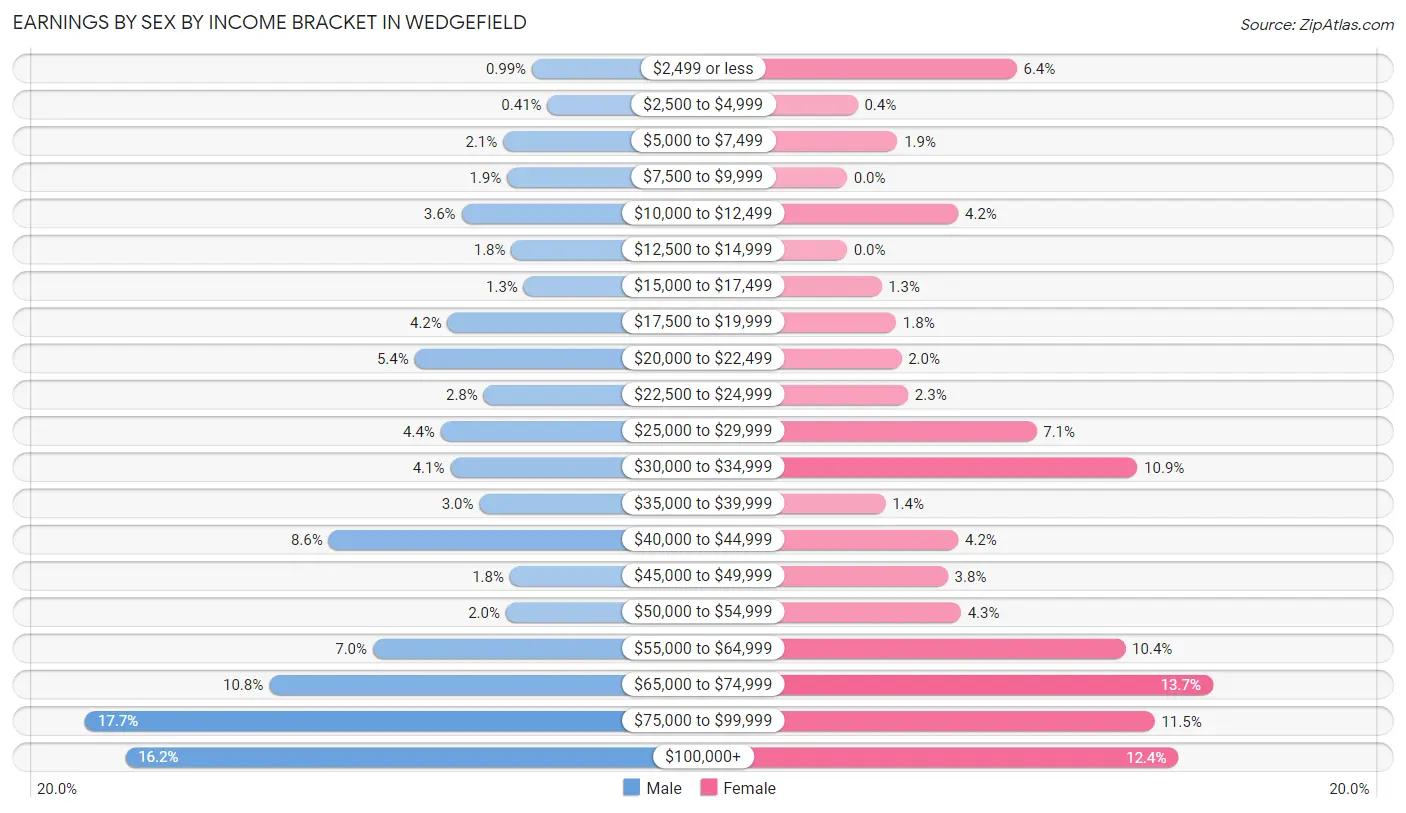
Earnings by Sex by Income Bracket in Wedgefield
The most common earnings brackets in Wedgefield are $75,000 to $99,999 for men (342 | 17.7%) and $65,000 to $74,999 for women (276 | 13.7%).
| Income | Male | Female |
| $2,499 or less | 19 (1.0%) | 128 (6.4%) |
| $2,500 to $4,999 | 8 (0.4%) | 8 (0.4%) |
| $5,000 to $7,499 | 40 (2.1%) | 38 (1.9%) |
| $7,500 to $9,999 | 37 (1.9%) | 0 (0.0%) |
| $10,000 to $12,499 | 70 (3.6%) | 84 (4.2%) |
| $12,500 to $14,999 | 34 (1.8%) | 0 (0.0%) |
| $15,000 to $17,499 | 25 (1.3%) | 26 (1.3%) |
| $17,500 to $19,999 | 80 (4.2%) | 37 (1.8%) |
| $20,000 to $22,499 | 104 (5.4%) | 41 (2.0%) |
| $22,500 to $24,999 | 54 (2.8%) | 46 (2.3%) |
| $25,000 to $29,999 | 85 (4.4%) | 143 (7.1%) |
| $30,000 to $34,999 | 78 (4.1%) | 219 (10.9%) |
| $35,000 to $39,999 | 57 (3.0%) | 29 (1.4%) |
| $40,000 to $44,999 | 166 (8.6%) | 84 (4.2%) |
| $45,000 to $49,999 | 35 (1.8%) | 76 (3.8%) |
| $50,000 to $54,999 | 38 (2.0%) | 86 (4.3%) |
| $55,000 to $64,999 | 134 (7.0%) | 210 (10.4%) |
| $65,000 to $74,999 | 209 (10.8%) | 276 (13.7%) |
| $75,000 to $99,999 | 342 (17.7%) | 232 (11.5%) |
| $100,000+ | 313 (16.2%) | 250 (12.4%) |
| Total | 1,928 (100.0%) | 2,013 (100.0%) |
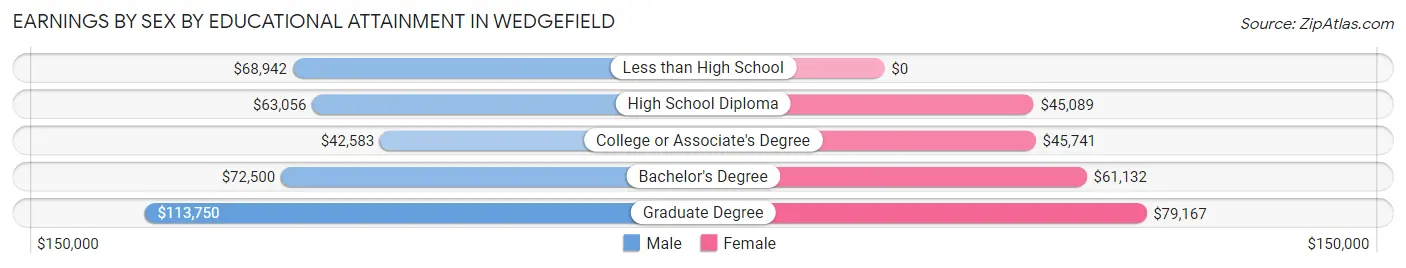
Earnings by Sex by Educational Attainment in Wedgefield
Average earnings in Wedgefield are $63,083 for men and $60,630 for women, a difference of 3.9%. Men with an educational attainment of graduate degree enjoy the highest average annual earnings of $113,750, while those with college or associate's degree education earn the least with $42,583. Women with an educational attainment of graduate degree earn the most with the average annual earnings of $79,167, while those with high school diploma education have the smallest earnings of $45,089.
| Educational Attainment | Male Income | Female Income |
| Less than High School | $68,942 | $0 |
| High School Diploma | $63,056 | $45,089 |
| College or Associate's Degree | $42,583 | $45,741 |
| Bachelor's Degree | $72,500 | $61,132 |
| Graduate Degree | $113,750 | $79,167 |
| Total | $63,083 | $60,630 |
Family Income in Wedgefield
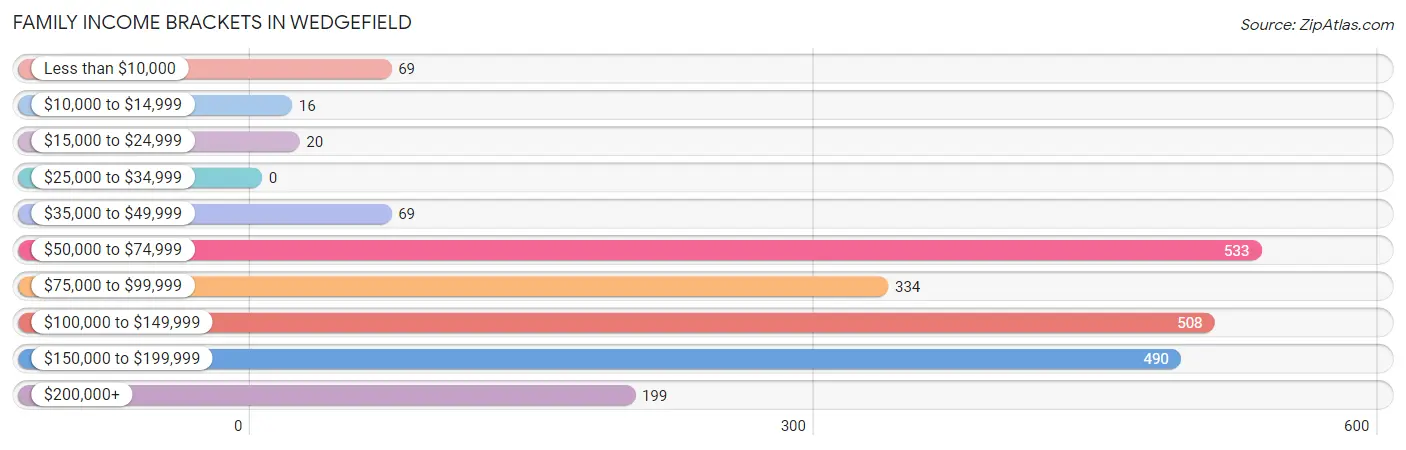
Family Income Brackets in Wedgefield
According to the Wedgefield family income data, there are 533 families falling into the $50,000 to $74,999 income range, which is the most common income bracket and makes up 23.8% of all families.
| Income Bracket | # Families | % Families |
| Less than $10,000 | 69 | 3.1% |
| $10,000 to $14,999 | 16 | 0.7% |
| $15,000 to $24,999 | 20 | 0.9% |
| $25,000 to $34,999 | 0 | 0.0% |
| $35,000 to $49,999 | 69 | 3.1% |
| $50,000 to $74,999 | 533 | 23.8% |
| $75,000 to $99,999 | 334 | 14.9% |
| $100,000 to $149,999 | 508 | 22.7% |
| $150,000 to $199,999 | 490 | 21.9% |
| $200,000+ | 199 | 8.9% |
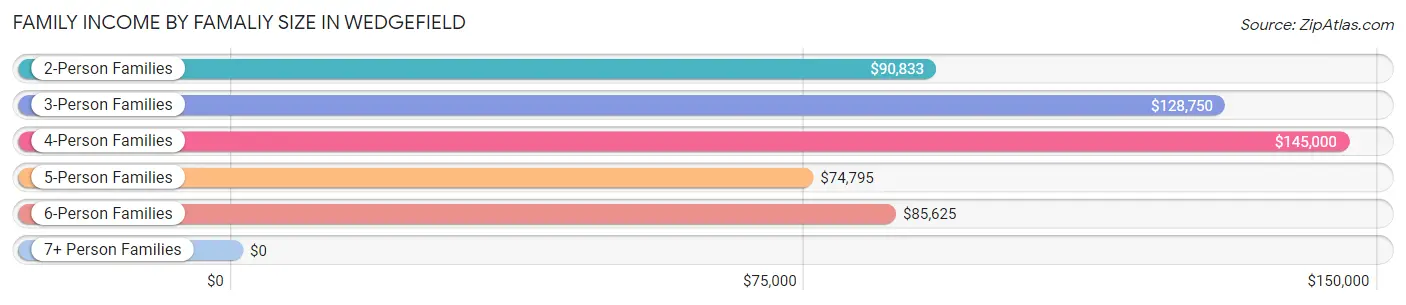
Family Income by Famaliy Size in Wedgefield
4-person families (534 | 23.8%) account for the highest median family income in Wedgefield with $145,000 per family, while 2-person families (846 | 37.8%) have the highest median income of $45,416 per family member.
| Income Bracket | # Families | Median Income |
| 2-Person Families | 846 (37.8%) | $90,833 |
| 3-Person Families | 650 (29.0%) | $128,750 |
| 4-Person Families | 534 (23.8%) | $145,000 |
| 5-Person Families | 123 (5.5%) | $74,795 |
| 6-Person Families | 61 (2.7%) | $85,625 |
| 7+ Person Families | 25 (1.1%) | $0 |
| Total | 2,239 (100.0%) | $113,447 |
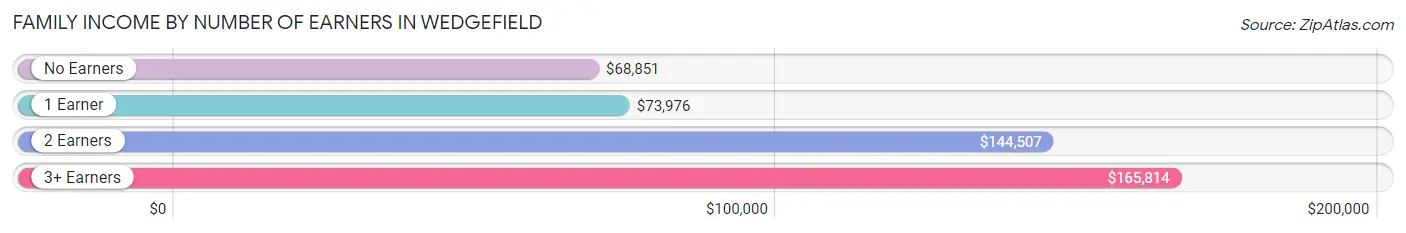
Family Income by Number of Earners in Wedgefield
The median family income in Wedgefield is $113,447, with families comprising 3+ earners (278) having the highest median family income of $165,814, while families with no earners (397) have the lowest median family income of $68,851, accounting for 12.4% and 17.7% of families, respectively.
| Number of Earners | # Families | Median Income |
| No Earners | 397 (17.7%) | $68,851 |
| 1 Earner | 680 (30.4%) | $73,976 |
| 2 Earners | 884 (39.5%) | $144,507 |
| 3+ Earners | 278 (12.4%) | $165,814 |
| Total | 2,239 (100.0%) | $113,447 |
Household Income in Wedgefield
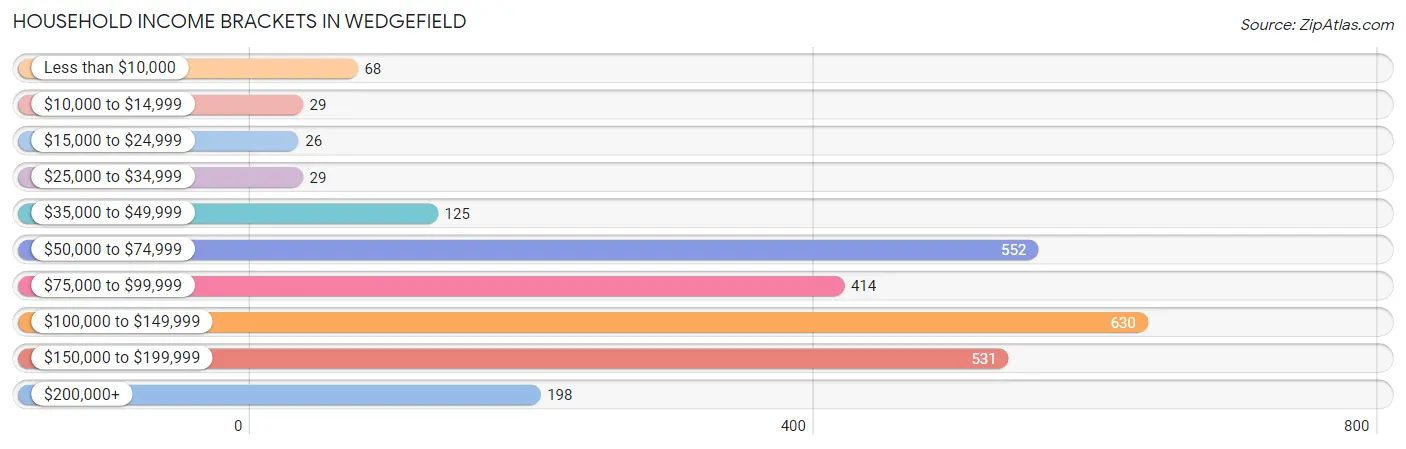
Household Income Brackets in Wedgefield
With 630 households falling in the category, the $100,000 to $149,999 income range is the most frequent in Wedgefield, accounting for 24.2% of all households. In contrast, only 26 households (1.0%) fall into the $15,000 to $24,999 income bracket, making it the least populous group.
| Income Bracket | # Households | % Households |
| Less than $10,000 | 68 | 2.6% |
| $10,000 to $14,999 | 29 | 1.1% |
| $15,000 to $24,999 | 26 | 1.0% |
| $25,000 to $34,999 | 29 | 1.1% |
| $35,000 to $49,999 | 125 | 4.8% |
| $50,000 to $74,999 | 552 | 21.2% |
| $75,000 to $99,999 | 414 | 15.9% |
| $100,000 to $149,999 | 630 | 24.2% |
| $150,000 to $199,999 | 531 | 20.4% |
| $200,000+ | 198 | 7.6% |
Household Income by Householder Age in Wedgefield
The median household income in Wedgefield is $107,446, with the highest median household income of $132,981 found in the 45 to 64 years age bracket for the primary householder. A total of 1,043 households (40.1%) fall into this category. Meanwhile, the 15 to 24 years age bracket for the primary householder has the lowest median household income of $0, with 34 households (1.3%) in this group.
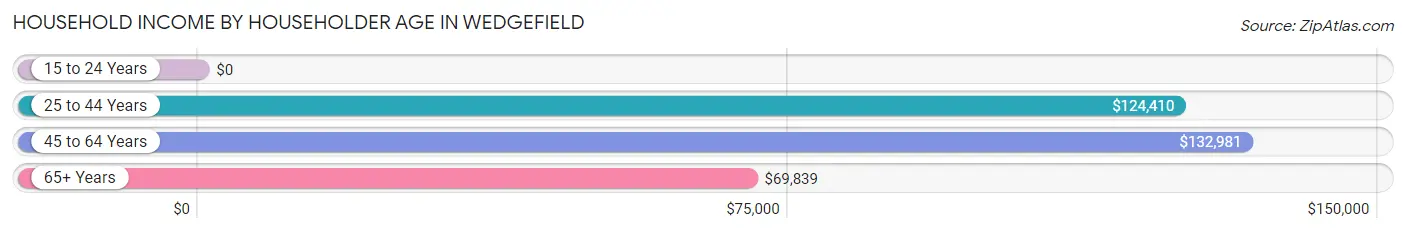
| Income Bracket | # Households | Median Income |
| 15 to 24 Years | 34 (1.3%) | $0 |
| 25 to 44 Years | 805 (30.9%) | $124,410 |
| 45 to 64 Years | 1,043 (40.1%) | $132,981 |
| 65+ Years | 722 (27.7%) | $69,839 |
| Total | 2,604 (100.0%) | $107,446 |
Poverty in Wedgefield
Income Below Poverty by Sex and Age in Wedgefield
With 5.5% poverty level for males and 3.5% for females among the residents of Wedgefield, under 5 year old males and 25 to 34 year old females are the most vulnerable to poverty, with 71 males (31.6%) and 63 females (14.2%) in their respective age groups living below the poverty level.
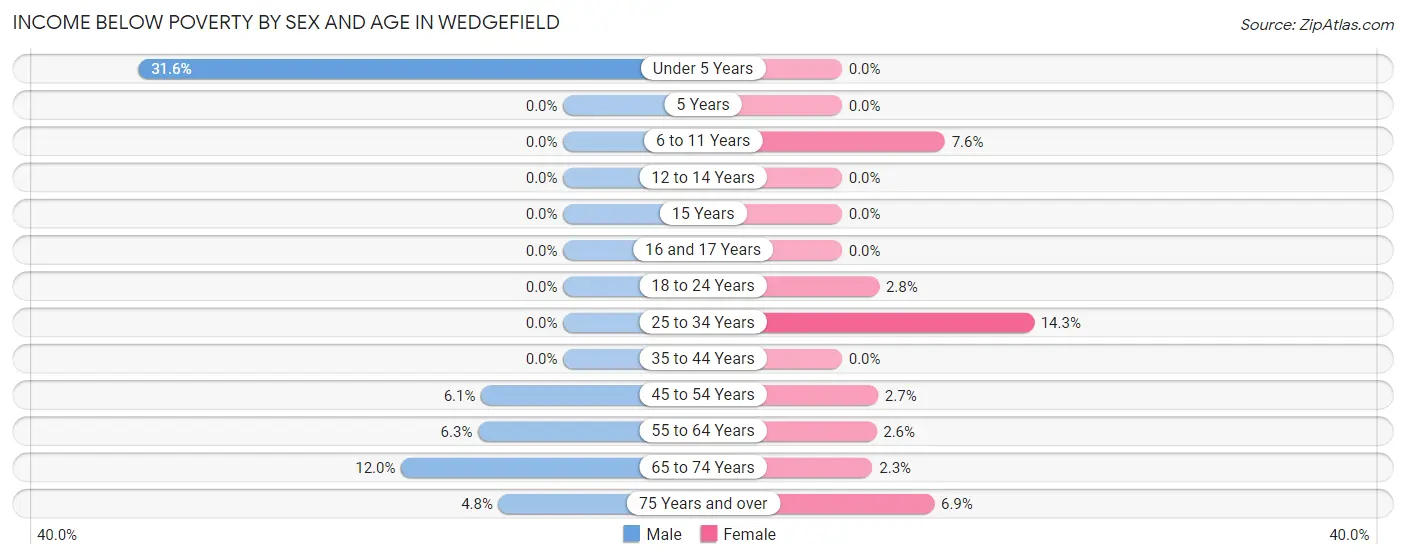
| Age Bracket | Male | Female |
| Under 5 Years | 71 (31.6%) | 0 (0.0%) |
| 5 Years | 0 (0.0%) | 0 (0.0%) |
| 6 to 11 Years | 0 (0.0%) | 22 (7.6%) |
| 12 to 14 Years | 0 (0.0%) | 0 (0.0%) |
| 15 Years | 0 (0.0%) | 0 (0.0%) |
| 16 and 17 Years | 0 (0.0%) | 0 (0.0%) |
| 18 to 24 Years | 0 (0.0%) | 10 (2.8%) |
| 25 to 34 Years | 0 (0.0%) | 63 (14.2%) |
| 35 to 44 Years | 0 (0.0%) | 0 (0.0%) |
| 45 to 54 Years | 27 (6.1%) | 15 (2.7%) |
| 55 to 64 Years | 43 (6.3%) | 18 (2.6%) |
| 65 to 74 Years | 42 (12.0%) | 9 (2.3%) |
| 75 Years and over | 16 (4.8%) | 27 (6.9%) |
| Total | 199 (5.5%) | 164 (3.5%) |
Income Above Poverty by Sex and Age in Wedgefield
According to the poverty statistics in Wedgefield, males aged 5 years and females aged under 5 years are the age groups that are most secure financially, with 100.0% of males and 100.0% of females in these age groups living above the poverty line.
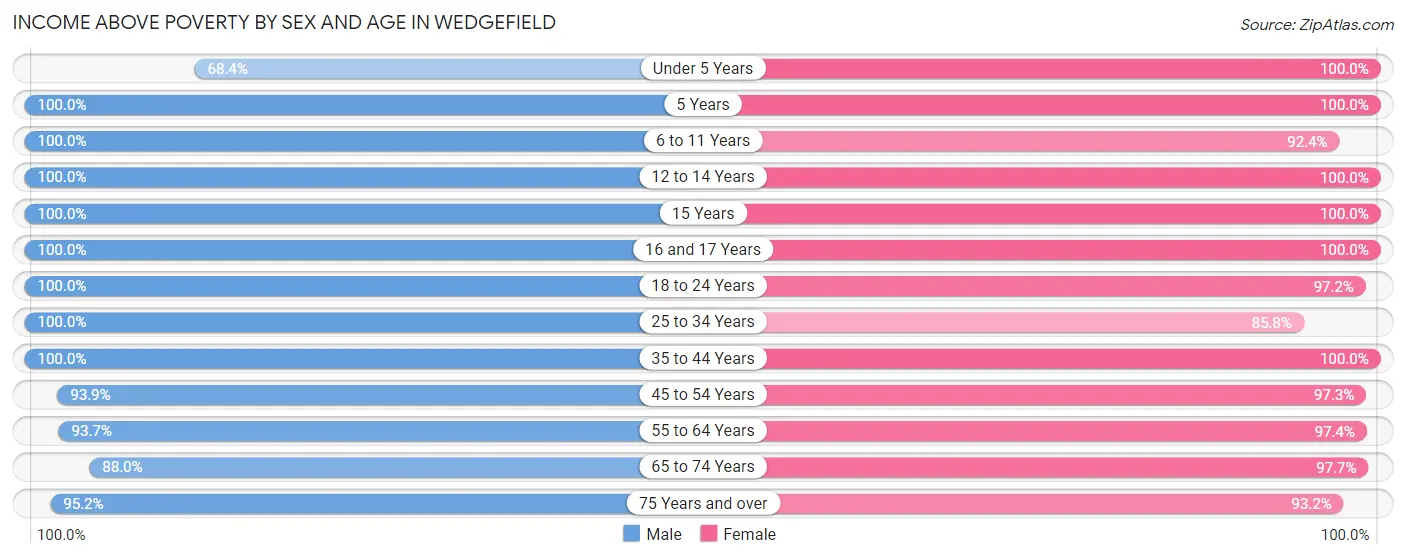
| Age Bracket | Male | Female |
| Under 5 Years | 154 (68.4%) | 342 (100.0%) |
| 5 Years | 43 (100.0%) | 23 (100.0%) |
| 6 to 11 Years | 202 (100.0%) | 266 (92.4%) |
| 12 to 14 Years | 224 (100.0%) | 147 (100.0%) |
| 15 Years | 60 (100.0%) | 79 (100.0%) |
| 16 and 17 Years | 10 (100.0%) | 231 (100.0%) |
| 18 to 24 Years | 176 (100.0%) | 352 (97.2%) |
| 25 to 34 Years | 307 (100.0%) | 379 (85.8%) |
| 35 to 44 Years | 572 (100.0%) | 684 (100.0%) |
| 45 to 54 Years | 416 (93.9%) | 545 (97.3%) |
| 55 to 64 Years | 637 (93.7%) | 686 (97.4%) |
| 65 to 74 Years | 307 (88.0%) | 387 (97.7%) |
| 75 Years and over | 318 (95.2%) | 367 (93.1%) |
| Total | 3,426 (94.5%) | 4,488 (96.5%) |
Income Below Poverty Among Married-Couple Families in Wedgefield
The poverty statistics for married-couple families in Wedgefield show that 2.4% or 45 of the total 1,870 families live below the poverty line. Families with no children have the highest poverty rate of 3.0%, comprising of 33 families. On the other hand, families with 3 or 4 children have the lowest poverty rate of 0.0%, which includes 0 families.
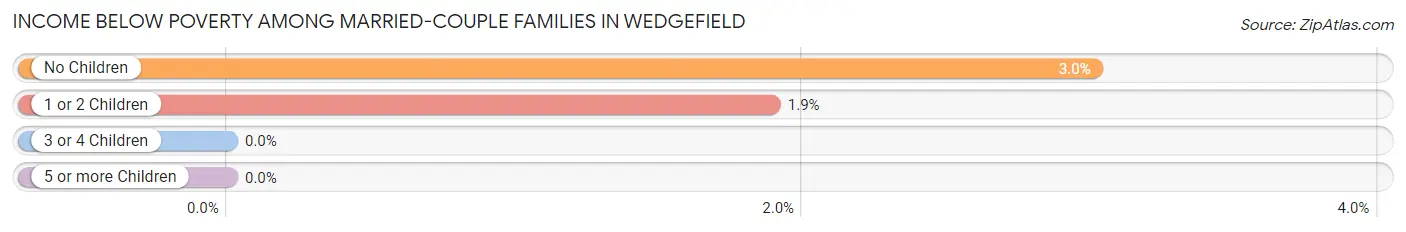
| Children | Above Poverty | Below Poverty |
| No Children | 1,062 (97.0%) | 33 (3.0%) |
| 1 or 2 Children | 624 (98.1%) | 12 (1.9%) |
| 3 or 4 Children | 139 (100.0%) | 0 (0.0%) |
| 5 or more Children | 0 (0.0%) | 0 (0.0%) |
| Total | 1,825 (97.6%) | 45 (2.4%) |
Income Below Poverty Among Single-Parent Households in Wedgefield
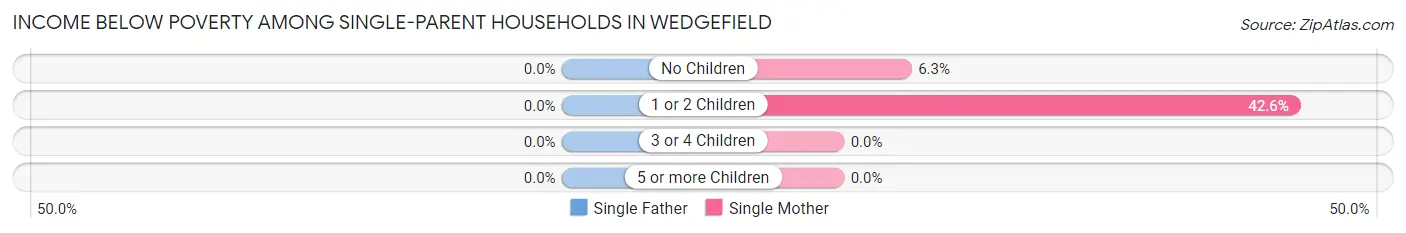
| Children | Single Father | Single Mother |
| No Children | 0 (0.0%) | 9 (6.3%) |
| 1 or 2 Children | 0 (0.0%) | 40 (42.5%) |
| 3 or 4 Children | 0 (0.0%) | 0 (0.0%) |
| 5 or more Children | 0 (0.0%) | 0 (0.0%) |
| Total | 0 (0.0%) | 49 (19.4%) |
Income Below Poverty Among Married-Couple vs Single-Parent Households in Wedgefield
The poverty data for Wedgefield shows that 45 of the married-couple family households (2.4%) and 49 of the single-parent households (13.3%) are living below the poverty level. Within the married-couple family households, those with no children have the highest poverty rate, with 33 households (3.0%) falling below the poverty line. Among the single-parent households, those with 1 or 2 children have the highest poverty rate, with 40 household (30.5%) living below poverty.
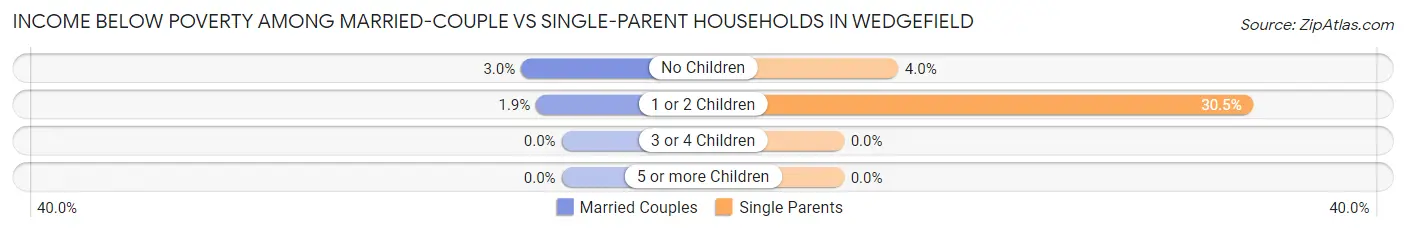
| Children | Married-Couple Families | Single-Parent Households |
| No Children | 33 (3.0%) | 9 (4.0%) |
| 1 or 2 Children | 12 (1.9%) | 40 (30.5%) |
| 3 or 4 Children | 0 (0.0%) | 0 (0.0%) |
| 5 or more Children | 0 (0.0%) | 0 (0.0%) |
| Total | 45 (2.4%) | 49 (13.3%) |
Race in Wedgefield
The most populous races in Wedgefield are White / Caucasian (4,901 | 59.2%), Hispanic or Latino (2,364 | 28.6%), and Some other Race (1,077 | 13.0%).
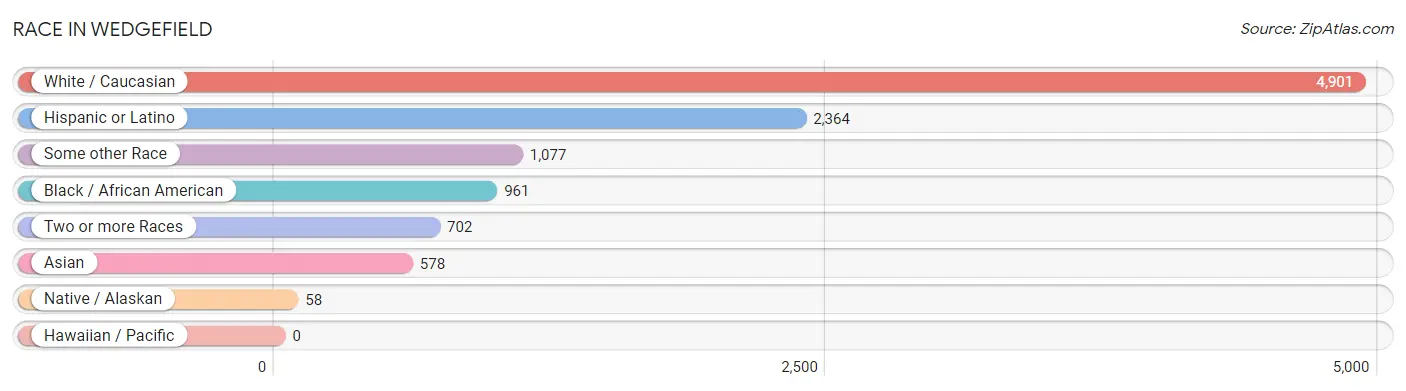
| Race | # Population | % Population |
| Asian | 578 | 7.0% |
| Black / African American | 961 | 11.6% |
| Hawaiian / Pacific | 0 | 0.0% |
| Hispanic or Latino | 2,364 | 28.6% |
| Native / Alaskan | 58 | 0.7% |
| White / Caucasian | 4,901 | 59.2% |
| Two or more Races | 702 | 8.5% |
| Some other Race | 1,077 | 13.0% |
| Total | 8,277 | 100.0% |
Ancestry in Wedgefield
The most populous ancestries reported in Wedgefield are Puerto Rican (1,610 | 19.5%), German (1,106 | 13.4%), English (874 | 10.6%), Irish (469 | 5.7%), and American (340 | 4.1%), together accounting for 53.1% of all Wedgefield residents.
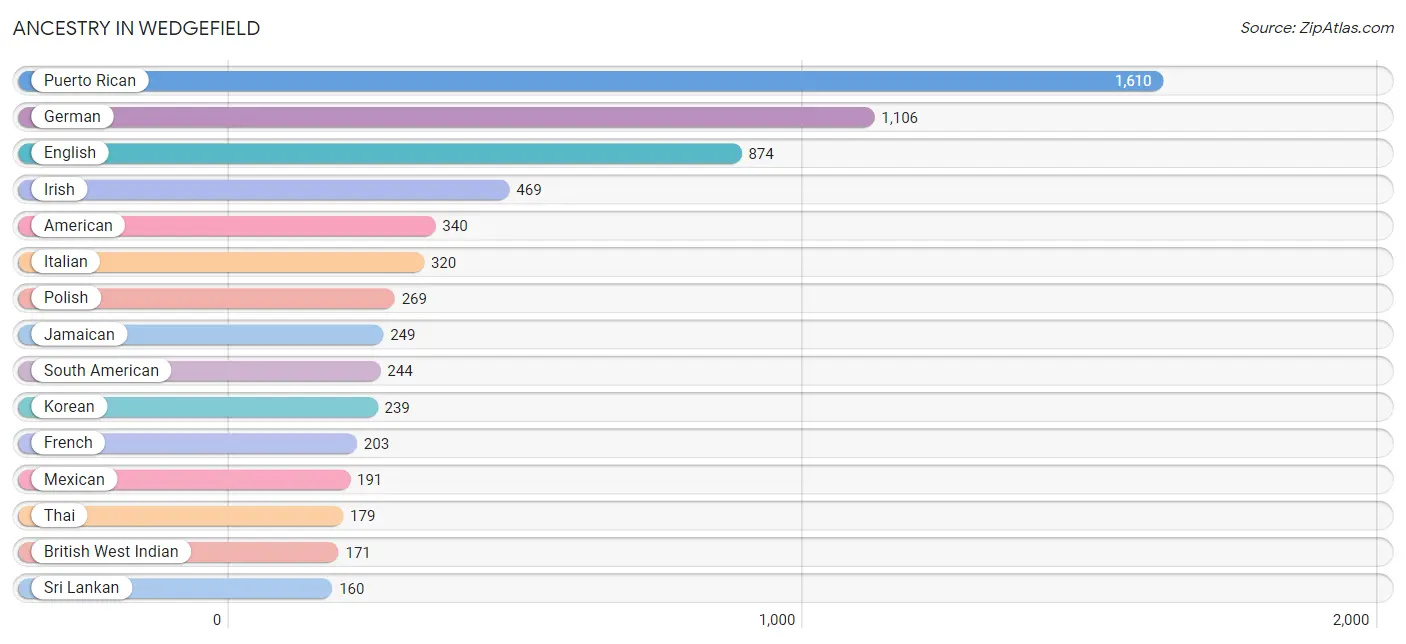
| Ancestry | # Population | % Population |
| African | 134 | 1.6% |
| American | 340 | 4.1% |
| Arab | 30 | 0.4% |
| Bahamian | 5 | 0.1% |
| Bermudan | 23 | 0.3% |
| Bhutanese | 26 | 0.3% |
| Brazilian | 14 | 0.2% |
| British West Indian | 171 | 2.1% |
| Canadian | 39 | 0.5% |
| Central American | 23 | 0.3% |
| Cherokee | 12 | 0.1% |
| Colombian | 123 | 1.5% |
| Costa Rican | 23 | 0.3% |
| Cuban | 140 | 1.7% |
| Dominican | 108 | 1.3% |
| Dutch | 26 | 0.3% |
| Eastern European | 13 | 0.2% |
| Egyptian | 30 | 0.4% |
| English | 874 | 10.6% |
| European | 128 | 1.5% |
| French | 203 | 2.5% |
| French Canadian | 28 | 0.3% |
| German | 1,106 | 13.4% |
| Greek | 143 | 1.7% |
| Guyanese | 17 | 0.2% |
| Haitian | 18 | 0.2% |
| Irish | 469 | 5.7% |
| Italian | 320 | 3.9% |
| Jamaican | 249 | 3.0% |
| Korean | 239 | 2.9% |
| Lithuanian | 13 | 0.2% |
| Mexican | 191 | 2.3% |
| Mexican American Indian | 44 | 0.5% |
| Northern European | 158 | 1.9% |
| Norwegian | 65 | 0.8% |
| Pennsylvania German | 50 | 0.6% |
| Peruvian | 121 | 1.5% |
| Polish | 269 | 3.3% |
| Portuguese | 36 | 0.4% |
| Puerto Rican | 1,610 | 19.5% |
| Romanian | 12 | 0.1% |
| Russian | 62 | 0.7% |
| Scandinavian | 15 | 0.2% |
| Scotch-Irish | 49 | 0.6% |
| Scottish | 61 | 0.7% |
| South American | 244 | 2.9% |
| Spaniard | 48 | 0.6% |
| Sri Lankan | 160 | 1.9% |
| Subsaharan African | 134 | 1.6% |
| Swedish | 7 | 0.1% |
| Swiss | 21 | 0.3% |
| Thai | 179 | 2.2% |
| Welsh | 5 | 0.1% | View All 53 Rows |
Immigrants in Wedgefield
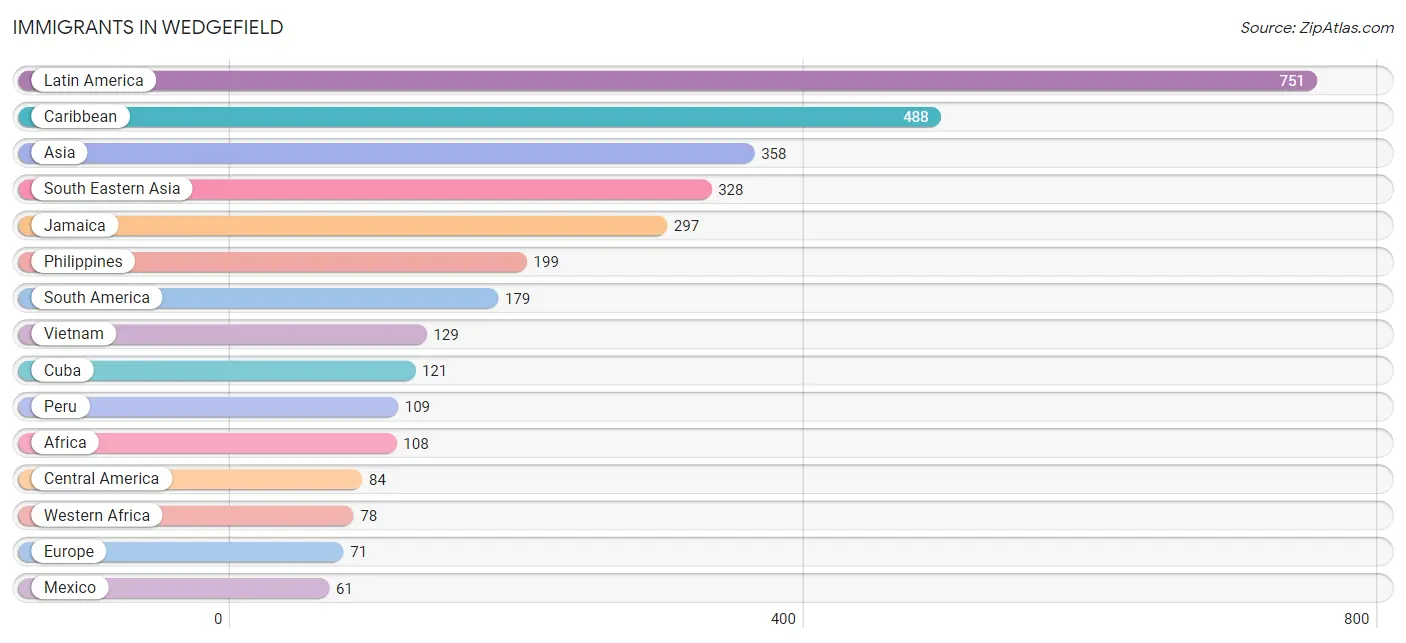
The most numerous immigrant groups reported in Wedgefield came from Latin America (751 | 9.1%), Caribbean (488 | 5.9%), Asia (358 | 4.3%), South Eastern Asia (328 | 4.0%), and Jamaica (297 | 3.6%), together accounting for 26.9% of all Wedgefield residents.
| Immigration Origin | # Population | % Population |
| Africa | 108 | 1.3% |
| Asia | 358 | 4.3% |
| Bahamas | 5 | 0.1% |
| Canada | 48 | 0.6% |
| Caribbean | 488 | 5.9% |
| Central America | 84 | 1.0% |
| Colombia | 25 | 0.3% |
| Costa Rica | 23 | 0.3% |
| Cuba | 121 | 1.5% |
| Dominican Republic | 15 | 0.2% |
| Egypt | 30 | 0.4% |
| Europe | 71 | 0.9% |
| Germany | 48 | 0.6% |
| Guyana | 45 | 0.5% |
| India | 30 | 0.4% |
| Jamaica | 297 | 3.6% |
| Latin America | 751 | 9.1% |
| Mexico | 61 | 0.7% |
| Nigeria | 39 | 0.5% |
| Northern Africa | 30 | 0.4% |
| Northern Europe | 23 | 0.3% |
| Peru | 109 | 1.3% |
| Philippines | 199 | 2.4% |
| Sierra Leone | 39 | 0.5% |
| South America | 179 | 2.2% |
| South Central Asia | 30 | 0.4% |
| South Eastern Asia | 328 | 4.0% |
| Trinidad and Tobago | 18 | 0.2% |
| Vietnam | 129 | 1.6% |
| Western Africa | 78 | 0.9% |
| Western Europe | 48 | 0.6% | View All 31 Rows |
Sex and Age in Wedgefield
Sex and Age in Wedgefield
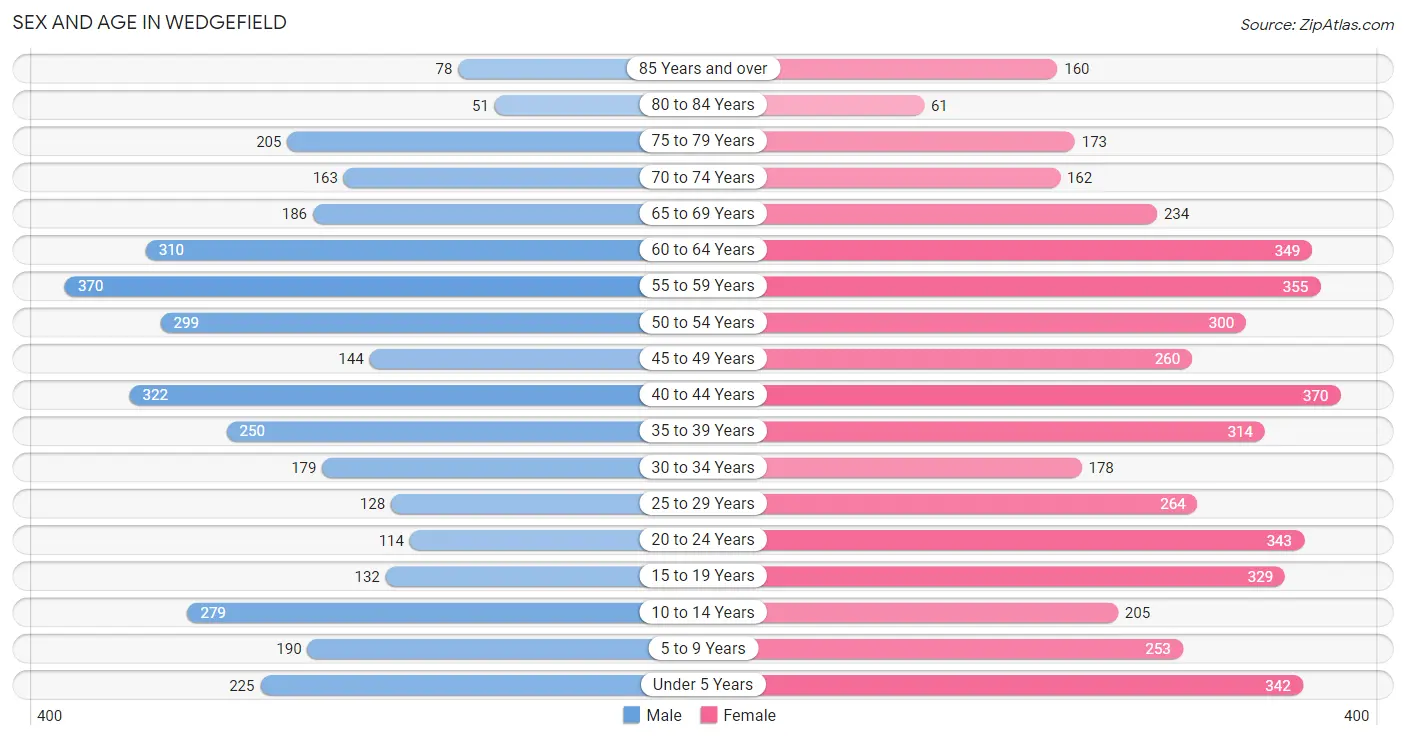
The most populous age groups in Wedgefield are 55 to 59 Years (370 | 10.2%) for men and 40 to 44 Years (370 | 8.0%) for women.
| Age Bracket | Male | Female |
| Under 5 Years | 225 (6.2%) | 342 (7.3%) |
| 5 to 9 Years | 190 (5.2%) | 253 (5.4%) |
| 10 to 14 Years | 279 (7.7%) | 205 (4.4%) |
| 15 to 19 Years | 132 (3.6%) | 329 (7.1%) |
| 20 to 24 Years | 114 (3.1%) | 343 (7.4%) |
| 25 to 29 Years | 128 (3.5%) | 264 (5.7%) |
| 30 to 34 Years | 179 (4.9%) | 178 (3.8%) |
| 35 to 39 Years | 250 (6.9%) | 314 (6.8%) |
| 40 to 44 Years | 322 (8.9%) | 370 (8.0%) |
| 45 to 49 Years | 144 (4.0%) | 260 (5.6%) |
| 50 to 54 Years | 299 (8.3%) | 300 (6.5%) |
| 55 to 59 Years | 370 (10.2%) | 355 (7.6%) |
| 60 to 64 Years | 310 (8.6%) | 349 (7.5%) |
| 65 to 69 Years | 186 (5.1%) | 234 (5.0%) |
| 70 to 74 Years | 163 (4.5%) | 162 (3.5%) |
| 75 to 79 Years | 205 (5.7%) | 173 (3.7%) |
| 80 to 84 Years | 51 (1.4%) | 61 (1.3%) |
| 85 Years and over | 78 (2.1%) | 160 (3.4%) |
| Total | 3,625 (100.0%) | 4,652 (100.0%) |
Families and Households in Wedgefield
Median Family Size in Wedgefield
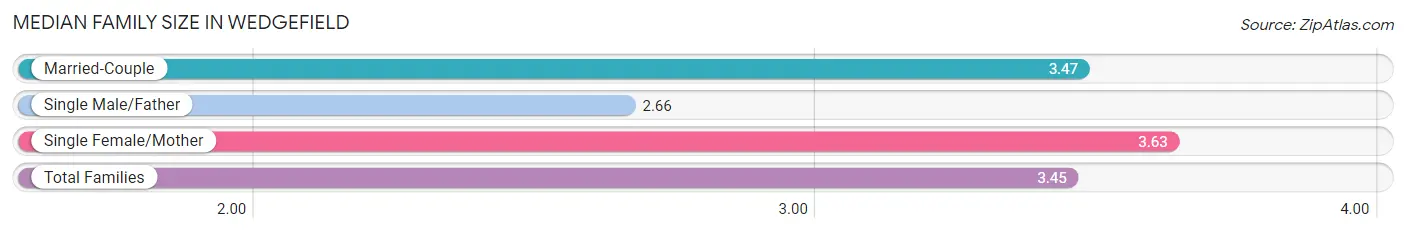
The median family size in Wedgefield is 3.45 persons per family, with single female/mother families (252 | 11.3%) accounting for the largest median family size of 3.63 persons per family. On the other hand, single male/father families (117 | 5.2%) represent the smallest median family size with 2.66 persons per family.
| Family Type | # Families | Family Size |
| Married-Couple | 1,870 (83.5%) | 3.47 |
| Single Male/Father | 117 (5.2%) | 2.66 |
| Single Female/Mother | 252 (11.3%) | 3.63 |
| Total Families | 2,239 (100.0%) | 3.45 |
Median Household Size in Wedgefield
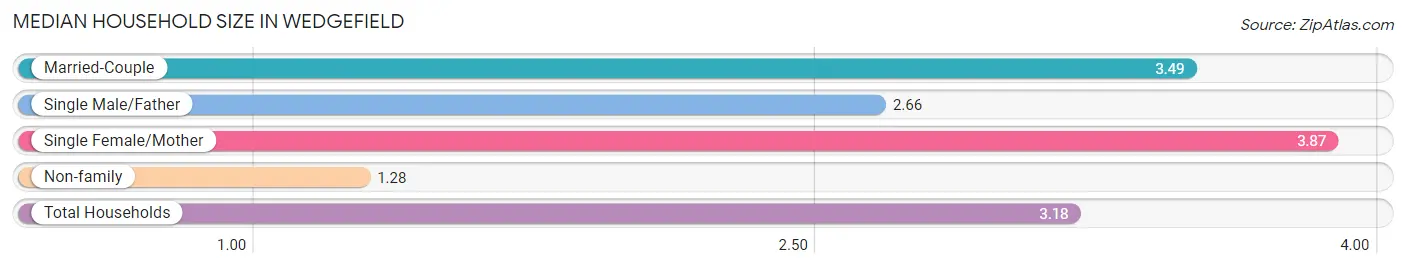
The median household size in Wedgefield is 3.18 persons per household, with single female/mother households (252 | 9.7%) accounting for the largest median household size of 3.87 persons per household. non-family households (365 | 14.0%) represent the smallest median household size with 1.28 persons per household.
| Household Type | # Households | Household Size |
| Married-Couple | 1,870 (71.8%) | 3.49 |
| Single Male/Father | 117 (4.5%) | 2.66 |
| Single Female/Mother | 252 (9.7%) | 3.87 |
| Non-family | 365 (14.0%) | 1.28 |
| Total Households | 2,604 (100.0%) | 3.18 |
Household Size by Marriage Status in Wedgefield
Out of a total of 2,604 households in Wedgefield, 2,239 (86.0%) are family households, while 365 (14.0%) are nonfamily households. The most numerous type of family households are 2-person households, comprising 846, and the most common type of nonfamily households are 1-person households, comprising 292.
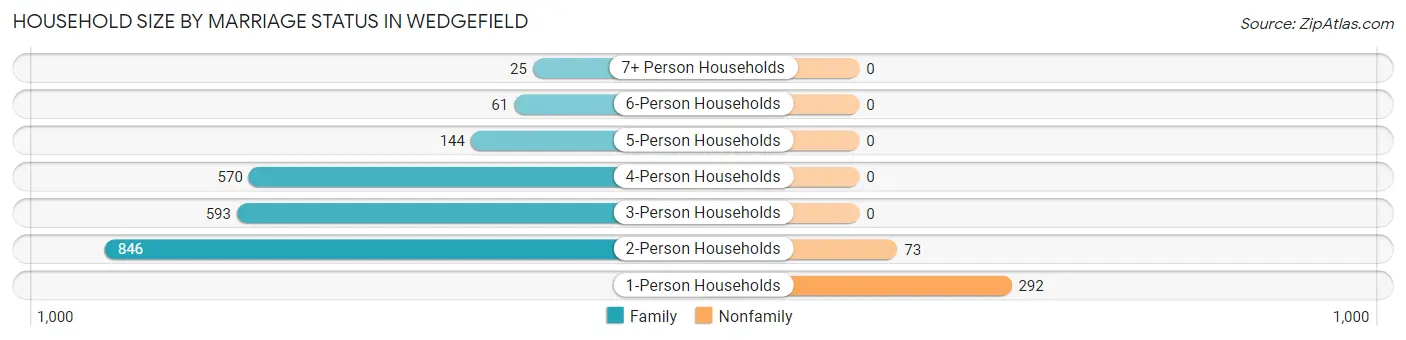
| Household Size | Family Households | Nonfamily Households |
| 1-Person Households | - | 292 (11.2%) |
| 2-Person Households | 846 (32.5%) | 73 (2.8%) |
| 3-Person Households | 593 (22.8%) | 0 (0.0%) |
| 4-Person Households | 570 (21.9%) | 0 (0.0%) |
| 5-Person Households | 144 (5.5%) | 0 (0.0%) |
| 6-Person Households | 61 (2.3%) | 0 (0.0%) |
| 7+ Person Households | 25 (1.0%) | 0 (0.0%) |
| Total | 2,239 (86.0%) | 365 (14.0%) |
Female Fertility in Wedgefield
Fertility by Age in Wedgefield
Average fertility rate in Wedgefield is 36.0 births per 1,000 women. Women in the age bracket of 20 to 34 years have the highest fertility rate with 94.0 births per 1,000 women. Women in the age bracket of 20 to 34 years acount for 100.0% of all women with births.
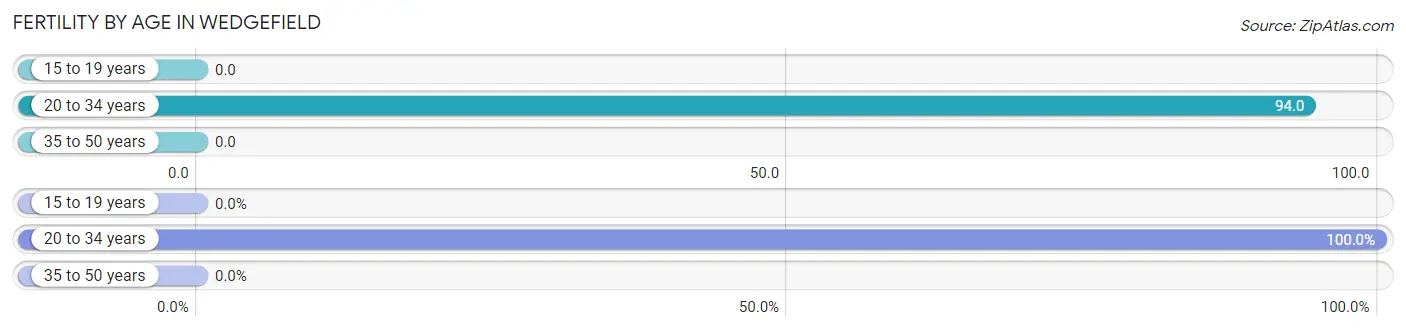
| Age Bracket | Women with Births | Births / 1,000 Women |
| 15 to 19 years | 0 (0.0%) | 0.0 |
| 20 to 34 years | 74 (100.0%) | 94.0 |
| 35 to 50 years | 0 (0.0%) | 0.0 |
| Total | 74 (100.0%) | 36.0 |
Fertility by Age by Marriage Status in Wedgefield
45.9% of women with births (74) in Wedgefield are married. The highest percentage of unmarried women with births falls into 20 to 34 years age bracket with 54.0% of them unmarried at the time of birth, while the lowest percentage of unmarried women with births belong to 20 to 34 years age bracket with 54.0% of them unmarried.
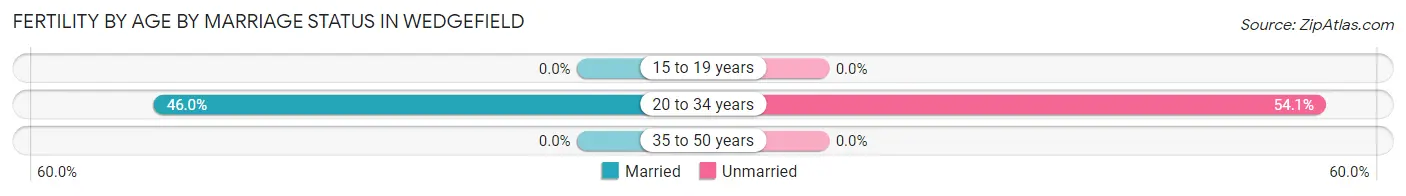
| Age Bracket | Married | Unmarried |
| 15 to 19 years | 0 (0.0%) | 0 (0.0%) |
| 20 to 34 years | 34 (46.0%) | 40 (54.0%) |
| 35 to 50 years | 0 (0.0%) | 0 (0.0%) |
| Total | 34 (46.0%) | 40 (54.0%) |
Fertility by Education in Wedgefield
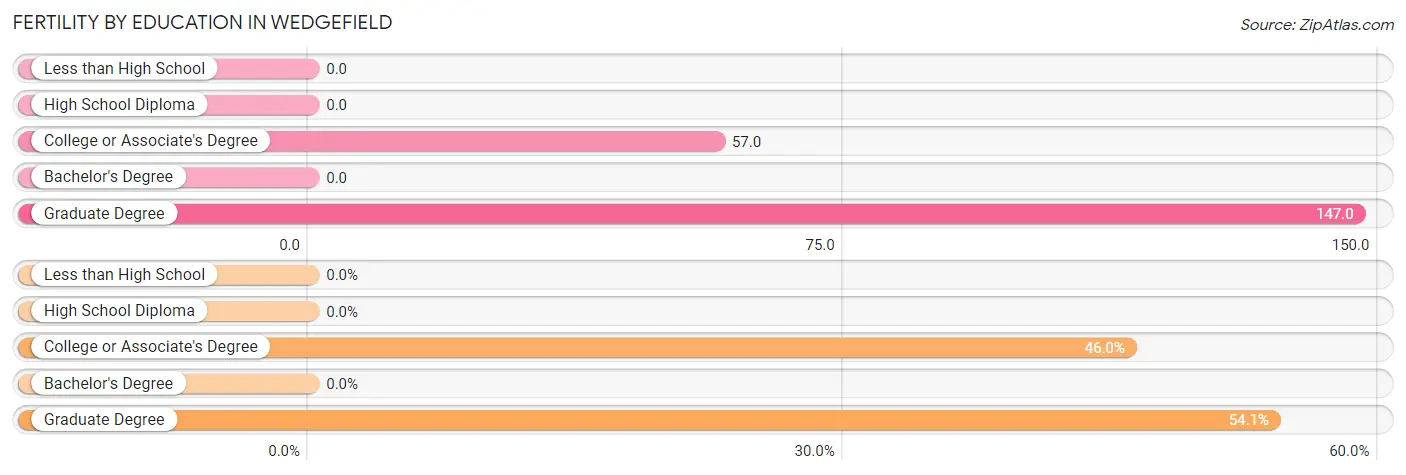
| Educational Attainment | Women with Births | Births / 1,000 Women |
| Less than High School | 0 (0.0%) | 0.0 |
| High School Diploma | 0 (0.0%) | 0.0 |
| College or Associate's Degree | 34 (46.0%) | 57.0 |
| Bachelor's Degree | 0 (0.0%) | 0.0 |
| Graduate Degree | 40 (54.0%) | 147.0 |
| Total | 74 (100.0%) | 36.0 |
Fertility by Education by Marriage Status in Wedgefield
54.0% of women with births in Wedgefield are unmarried. Women with the educational attainment of college or associate's degree are most likely to be married with 100.0% of them married at childbirth, while women with the educational attainment of graduate degree are least likely to be married with 100.0% of them unmarried at childbirth.
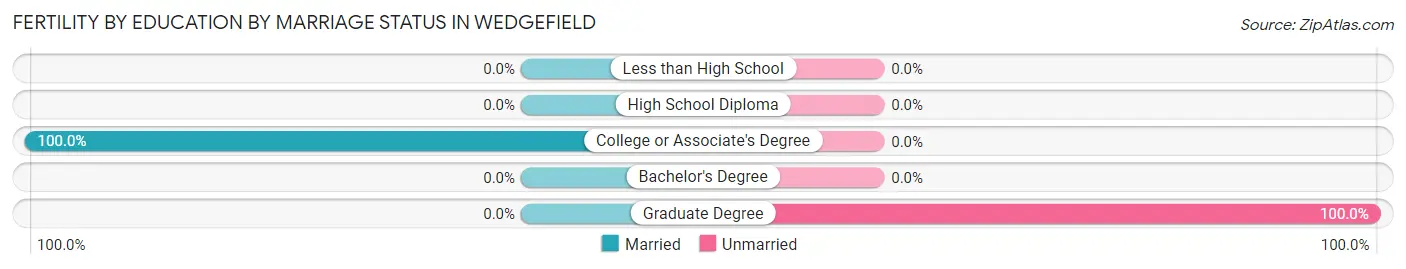
| Educational Attainment | Married | Unmarried |
| Less than High School | 0 (0.0%) | 0 (0.0%) |
| High School Diploma | 0 (0.0%) | 0 (0.0%) |
| College or Associate's Degree | 34 (100.0%) | 0 (0.0%) |
| Bachelor's Degree | 0 (0.0%) | 0 (0.0%) |
| Graduate Degree | 0 (0.0%) | 40 (100.0%) |
| Total | 34 (46.0%) | 40 (54.0%) |
Employment Characteristics in Wedgefield
Employment by Class of Employer in Wedgefield
Among the 3,780 employed individuals in Wedgefield, private company employees (2,590 | 68.5%), not-for-profit organizations (259 | 6.9%), and local government employees (259 | 6.9%) make up the most common classes of employment.
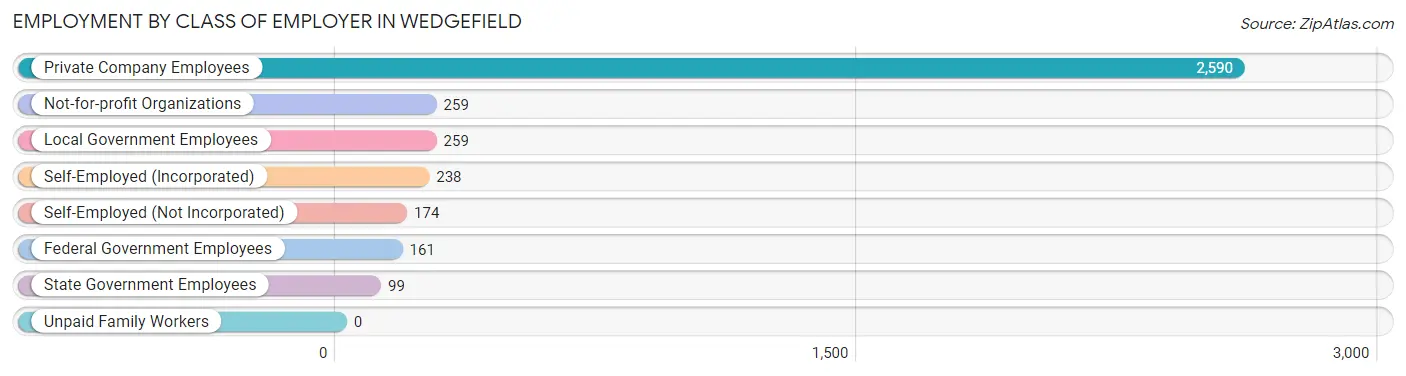
| Employer Class | # Employees | % Employees |
| Private Company Employees | 2,590 | 68.5% |
| Self-Employed (Incorporated) | 238 | 6.3% |
| Self-Employed (Not Incorporated) | 174 | 4.6% |
| Not-for-profit Organizations | 259 | 6.9% |
| Local Government Employees | 259 | 6.9% |
| State Government Employees | 99 | 2.6% |
| Federal Government Employees | 161 | 4.3% |
| Unpaid Family Workers | 0 | 0.0% |
| Total | 3,780 | 100.0% |
Employment Status by Age in Wedgefield
According to the labor force statistics for Wedgefield, out of the total population over 16 years of age (6,644), 58.9% or 3,913 individuals are in the labor force, with 1.8% or 70 of them unemployed. The age group with the highest labor force participation rate is 30 to 34 years, with 92.4% or 330 individuals in the labor force. Within the labor force, the 65 to 74 years age range has the highest percentage of unemployed individuals, with 20.9% or 37 of them being unemployed.
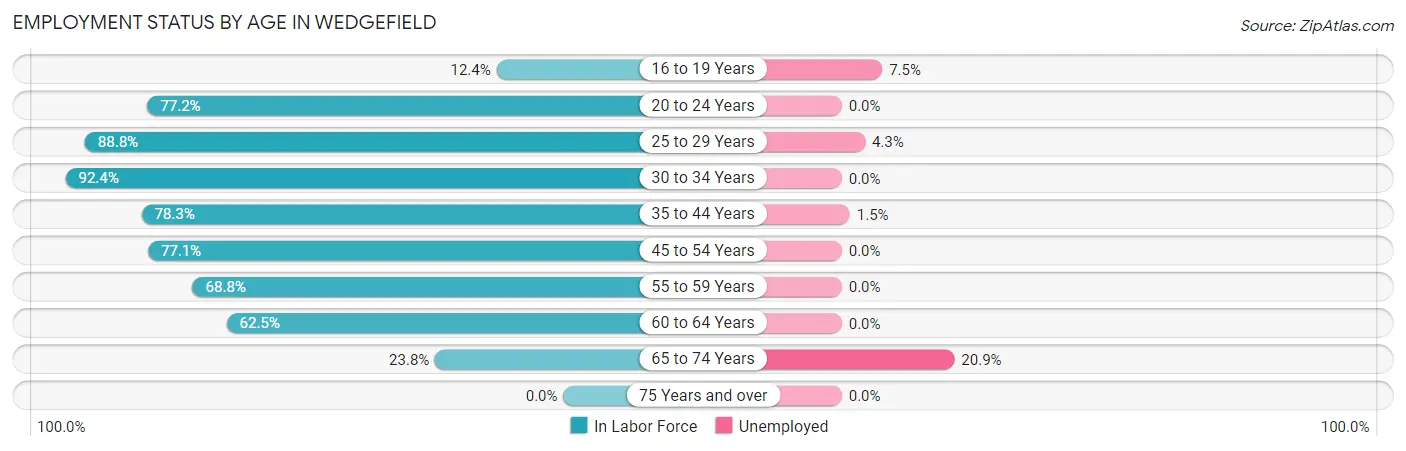
| Age Bracket | In Labor Force | Unemployed |
| 16 to 19 Years | 40 (12.4%) | 3 (7.5%) |
| 20 to 24 Years | 353 (77.2%) | 0 (0.0%) |
| 25 to 29 Years | 348 (88.8%) | 15 (4.3%) |
| 30 to 34 Years | 330 (92.4%) | 0 (0.0%) |
| 35 to 44 Years | 983 (78.3%) | 15 (1.5%) |
| 45 to 54 Years | 773 (77.1%) | 0 (0.0%) |
| 55 to 59 Years | 499 (68.8%) | 0 (0.0%) |
| 60 to 64 Years | 412 (62.5%) | 0 (0.0%) |
| 65 to 74 Years | 177 (23.8%) | 37 (20.9%) |
| 75 Years and over | 0 (0.0%) | 0 (0.0%) |
| Total | 3,913 (58.9%) | 70 (1.8%) |
Employment Status by Educational Attainment in Wedgefield
According to labor force statistics for Wedgefield, 76.2% of individuals (3,347) out of the total population between 25 and 64 years of age (4,392) are in the labor force, with 0.9% or 30 of them being unemployed. The group with the highest labor force participation rate are those with the educational attainment of bachelor's degree or higher, with 82.3% or 1,603 individuals in the labor force. Within the labor force, individuals with college / associate degree education have the highest percentage of unemployment, with 1.7% or 15 of them being unemployed.
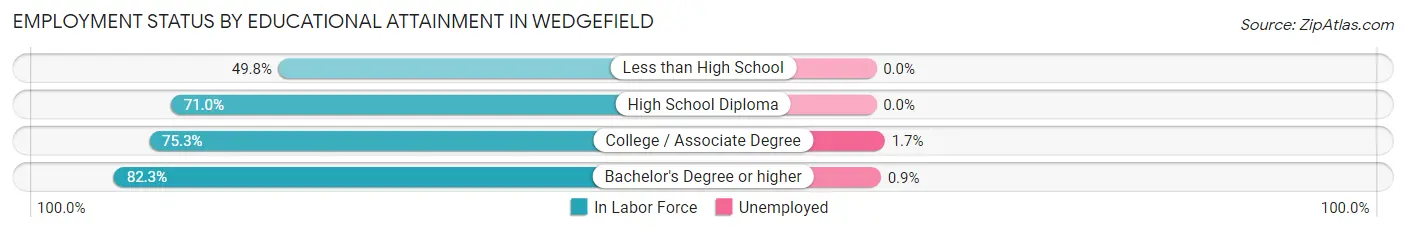
| Educational Attainment | In Labor Force | Unemployed |
| Less than High School | 105 (49.8%) | 0 (0.0%) |
| High School Diploma | 763 (71.0%) | 0 (0.0%) |
| College / Associate Degree | 873 (75.3%) | 20 (1.7%) |
| Bachelor's Degree or higher | 1,603 (82.3%) | 18 (0.9%) |
| Total | 3,347 (76.2%) | 40 (0.9%) |
Employment Occupations by Sex in Wedgefield
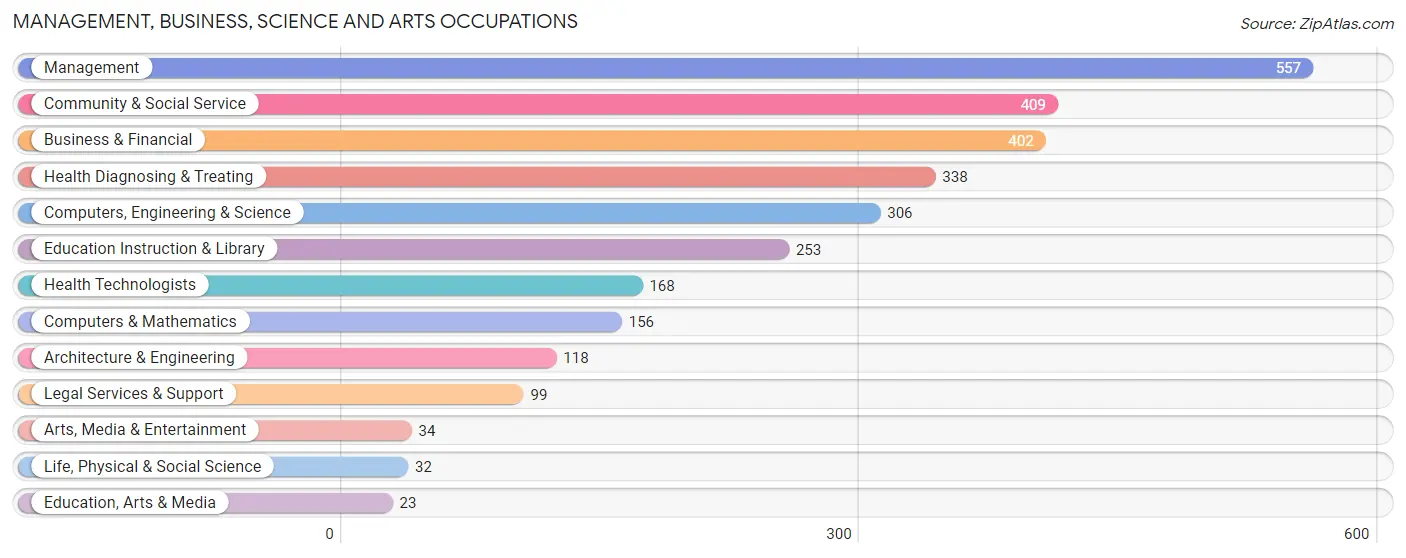
Management, Business, Science and Arts Occupations
The most common Management, Business, Science and Arts occupations in Wedgefield are Management (557 | 14.5%), Community & Social Service (409 | 10.6%), Business & Financial (402 | 10.5%), Health Diagnosing & Treating (338 | 8.8%), and Computers, Engineering & Science (306 | 8.0%).
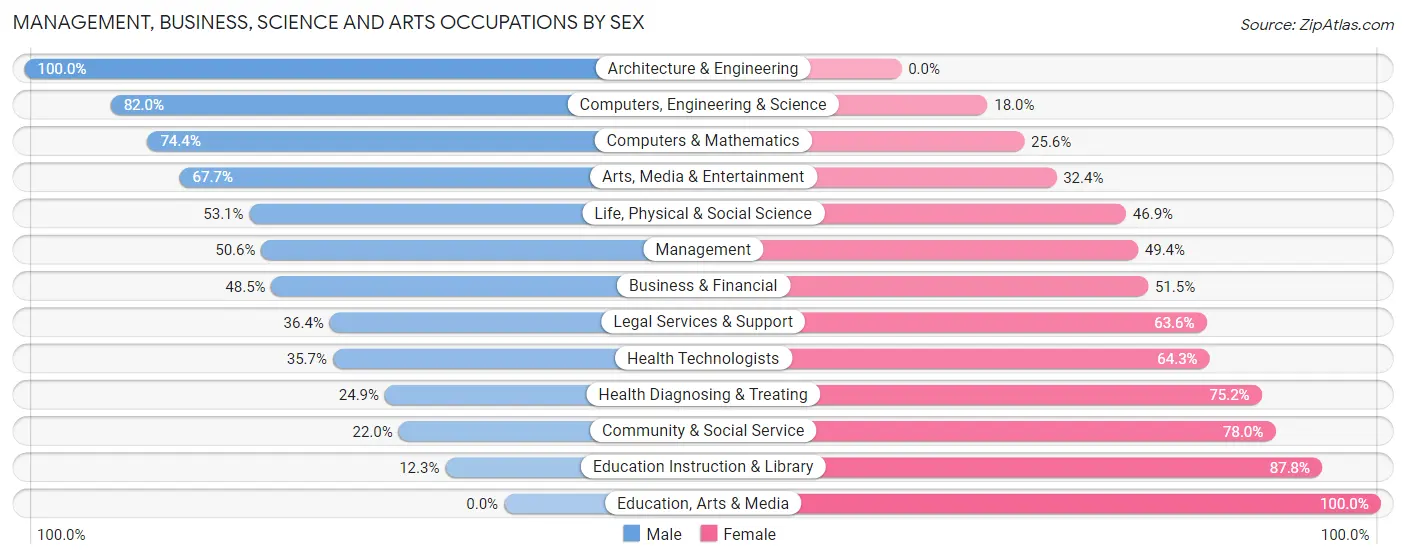
Management, Business, Science and Arts Occupations by Sex
Within the Management, Business, Science and Arts occupations in Wedgefield, the most male-oriented occupations are Architecture & Engineering (100.0%), Computers, Engineering & Science (82.0%), and Computers & Mathematics (74.4%), while the most female-oriented occupations are Education, Arts & Media (100.0%), Education Instruction & Library (87.7%), and Community & Social Service (78.0%).
| Occupation | Male | Female |
| Management | 282 (50.6%) | 275 (49.4%) |
| Business & Financial | 195 (48.5%) | 207 (51.5%) |
| Computers, Engineering & Science | 251 (82.0%) | 55 (18.0%) |
| Computers & Mathematics | 116 (74.4%) | 40 (25.6%) |
| Architecture & Engineering | 118 (100.0%) | 0 (0.0%) |
| Life, Physical & Social Science | 17 (53.1%) | 15 (46.9%) |
| Community & Social Service | 90 (22.0%) | 319 (78.0%) |
| Education, Arts & Media | 0 (0.0%) | 23 (100.0%) |
| Legal Services & Support | 36 (36.4%) | 63 (63.6%) |
| Education Instruction & Library | 31 (12.2%) | 222 (87.7%) |
| Arts, Media & Entertainment | 23 (67.6%) | 11 (32.4%) |
| Health Diagnosing & Treating | 84 (24.8%) | 254 (75.1%) |
| Health Technologists | 60 (35.7%) | 108 (64.3%) |
| Total (Category) | 902 (44.8%) | 1,110 (55.2%) |
| Total (Overall) | 1,888 (49.1%) | 1,957 (50.9%) |
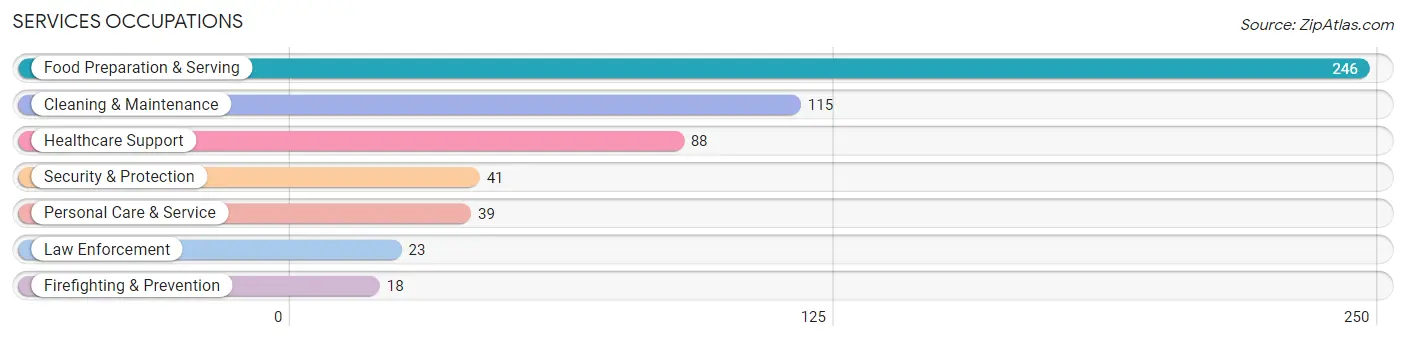
Services Occupations
The most common Services occupations in Wedgefield are Food Preparation & Serving (246 | 6.4%), Cleaning & Maintenance (115 | 3.0%), Healthcare Support (88 | 2.3%), Security & Protection (41 | 1.1%), and Personal Care & Service (39 | 1.0%).
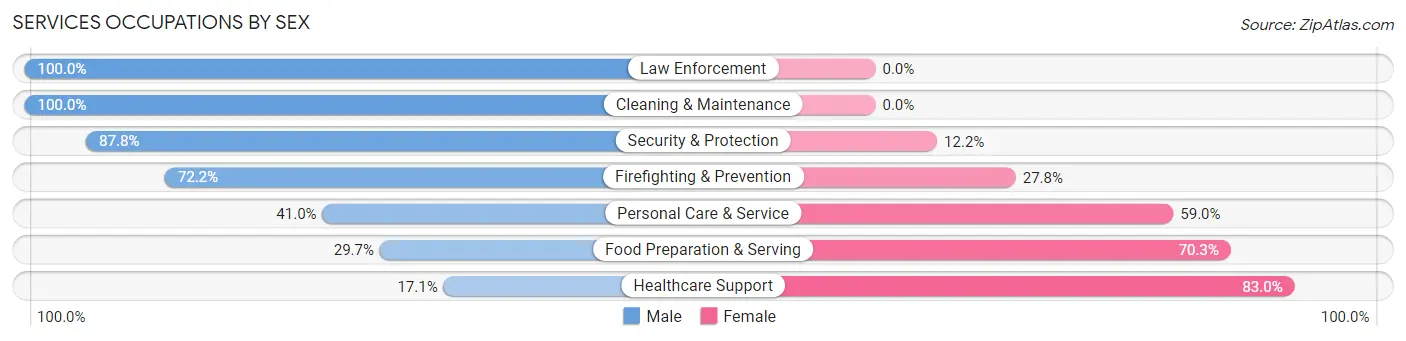
Services Occupations by Sex
Within the Services occupations in Wedgefield, the most male-oriented occupations are Law Enforcement (100.0%), Cleaning & Maintenance (100.0%), and Security & Protection (87.8%), while the most female-oriented occupations are Healthcare Support (83.0%), Food Preparation & Serving (70.3%), and Personal Care & Service (59.0%).
| Occupation | Male | Female |
| Healthcare Support | 15 (17.1%) | 73 (83.0%) |
| Security & Protection | 36 (87.8%) | 5 (12.2%) |
| Firefighting & Prevention | 13 (72.2%) | 5 (27.8%) |
| Law Enforcement | 23 (100.0%) | 0 (0.0%) |
| Food Preparation & Serving | 73 (29.7%) | 173 (70.3%) |
| Cleaning & Maintenance | 115 (100.0%) | 0 (0.0%) |
| Personal Care & Service | 16 (41.0%) | 23 (59.0%) |
| Total (Category) | 255 (48.2%) | 274 (51.8%) |
| Total (Overall) | 1,888 (49.1%) | 1,957 (50.9%) |
Sales and Office Occupations
The most common Sales and Office occupations in Wedgefield are Office & Administration (388 | 10.1%), and Sales & Related (370 | 9.6%).
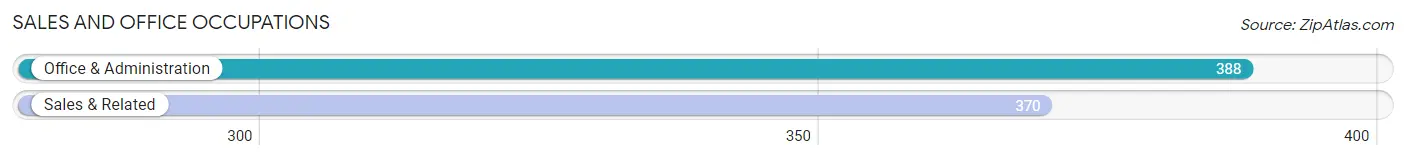
Sales and Office Occupations by Sex
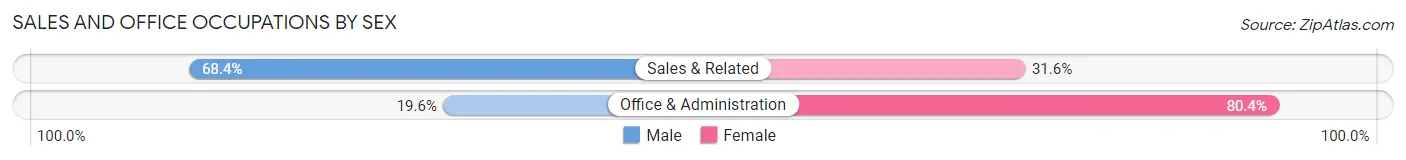
| Occupation | Male | Female |
| Sales & Related | 253 (68.4%) | 117 (31.6%) |
| Office & Administration | 76 (19.6%) | 312 (80.4%) |
| Total (Category) | 329 (43.4%) | 429 (56.6%) |
| Total (Overall) | 1,888 (49.1%) | 1,957 (50.9%) |
Natural Resources, Construction and Maintenance Occupations
The most common Natural Resources, Construction and Maintenance occupations in Wedgefield are Construction & Extraction (146 | 3.8%), and Installation, Maintenance & Repair (65 | 1.7%).
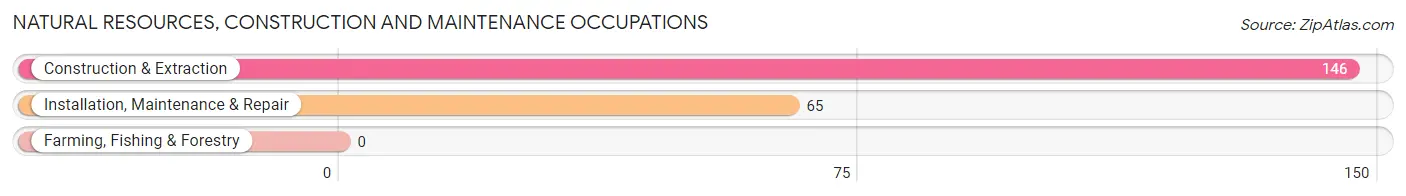
Natural Resources, Construction and Maintenance Occupations by Sex
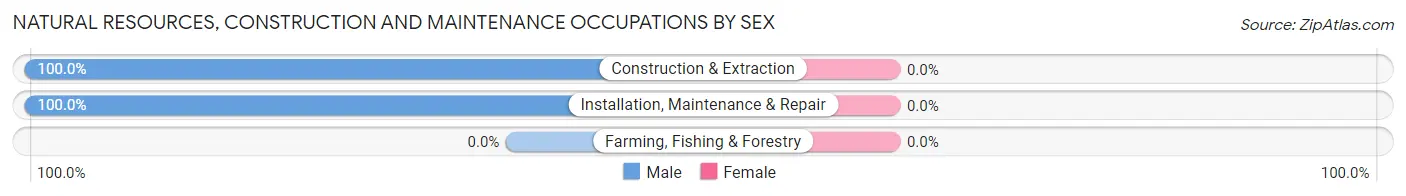
| Occupation | Male | Female |
| Farming, Fishing & Forestry | 0 (0.0%) | 0 (0.0%) |
| Construction & Extraction | 146 (100.0%) | 0 (0.0%) |
| Installation, Maintenance & Repair | 65 (100.0%) | 0 (0.0%) |
| Total (Category) | 211 (100.0%) | 0 (0.0%) |
| Total (Overall) | 1,888 (49.1%) | 1,957 (50.9%) |
Production, Transportation and Moving Occupations
The most common Production, Transportation and Moving occupations in Wedgefield are Transportation (131 | 3.4%), Material Moving (113 | 2.9%), and Production (91 | 2.4%).
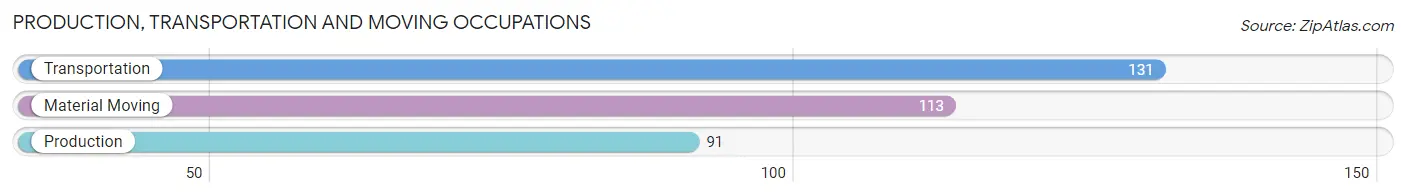
Production, Transportation and Moving Occupations by Sex
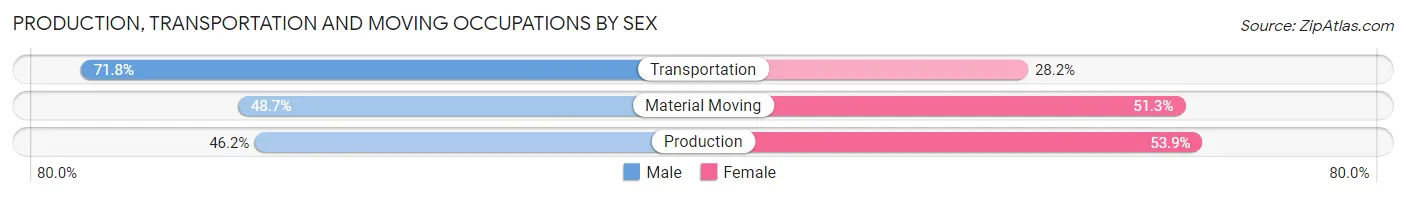
| Occupation | Male | Female |
| Production | 42 (46.2%) | 49 (53.8%) |
| Transportation | 94 (71.8%) | 37 (28.2%) |
| Material Moving | 55 (48.7%) | 58 (51.3%) |
| Total (Category) | 191 (57.0%) | 144 (43.0%) |
| Total (Overall) | 1,888 (49.1%) | 1,957 (50.9%) |
Employment Industries by Sex in Wedgefield
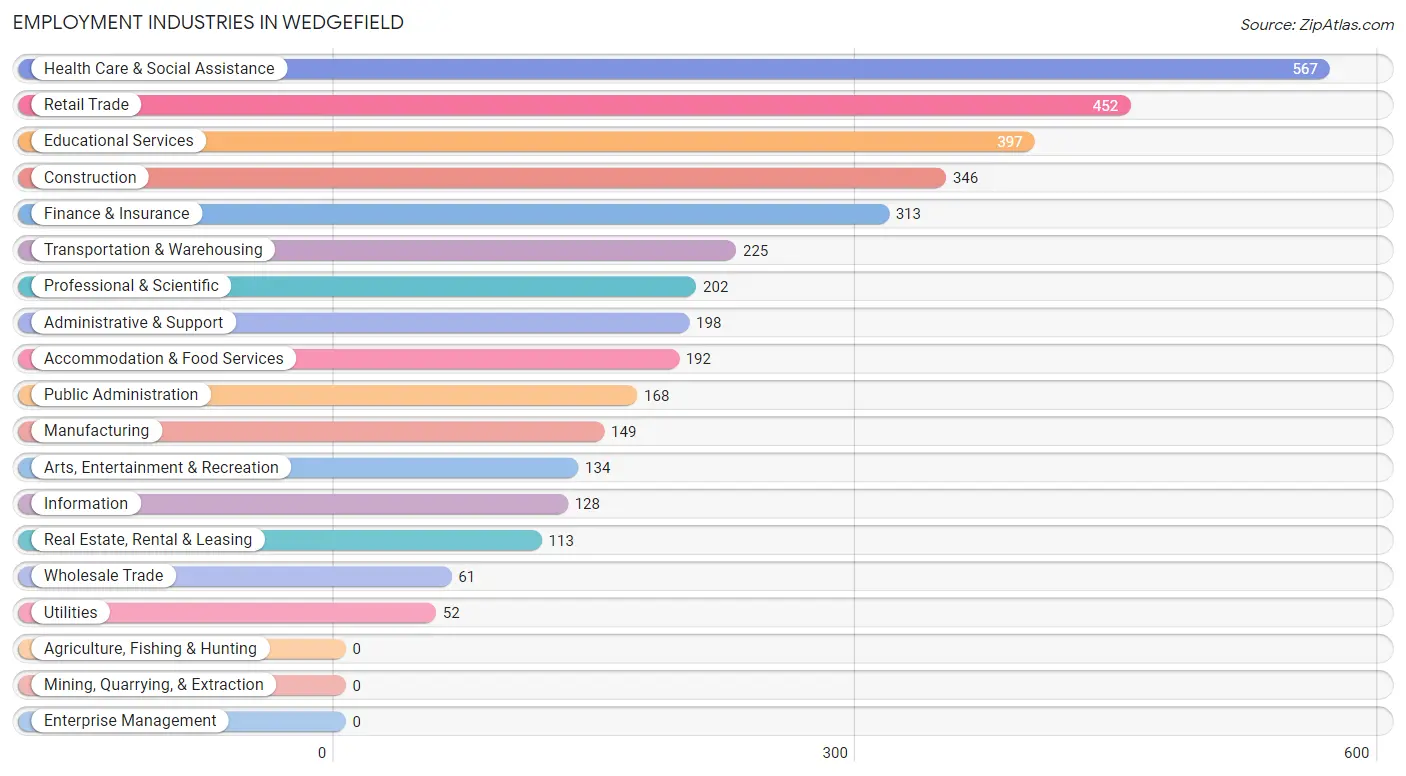
Employment Industries in Wedgefield
The major employment industries in Wedgefield include Health Care & Social Assistance (567 | 14.7%), Retail Trade (452 | 11.8%), Educational Services (397 | 10.3%), Construction (346 | 9.0%), and Finance & Insurance (313 | 8.1%).
Employment Industries by Sex in Wedgefield
The Wedgefield industries that see more men than women are Utilities (100.0%), Construction (88.7%), and Information (82.0%), whereas the industries that tend to have a higher number of women are Arts, Entertainment & Recreation (82.8%), Public Administration (78.6%), and Professional & Scientific (73.3%).
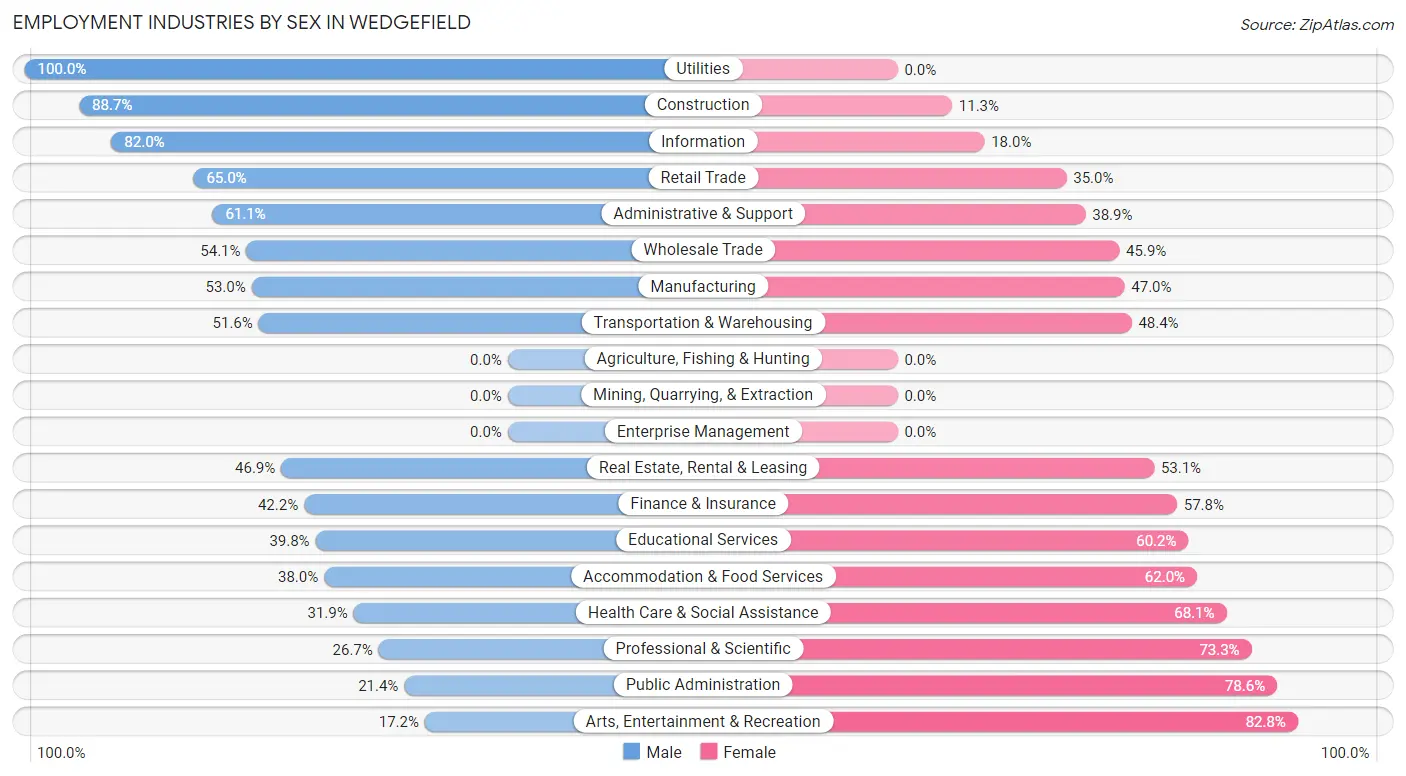
| Industry | Male | Female |
| Agriculture, Fishing & Hunting | 0 (0.0%) | 0 (0.0%) |
| Mining, Quarrying, & Extraction | 0 (0.0%) | 0 (0.0%) |
| Construction | 307 (88.7%) | 39 (11.3%) |
| Manufacturing | 79 (53.0%) | 70 (47.0%) |
| Wholesale Trade | 33 (54.1%) | 28 (45.9%) |
| Retail Trade | 294 (65.0%) | 158 (35.0%) |
| Transportation & Warehousing | 116 (51.6%) | 109 (48.4%) |
| Utilities | 52 (100.0%) | 0 (0.0%) |
| Information | 105 (82.0%) | 23 (18.0%) |
| Finance & Insurance | 132 (42.2%) | 181 (57.8%) |
| Real Estate, Rental & Leasing | 53 (46.9%) | 60 (53.1%) |
| Professional & Scientific | 54 (26.7%) | 148 (73.3%) |
| Enterprise Management | 0 (0.0%) | 0 (0.0%) |
| Administrative & Support | 121 (61.1%) | 77 (38.9%) |
| Educational Services | 158 (39.8%) | 239 (60.2%) |
| Health Care & Social Assistance | 181 (31.9%) | 386 (68.1%) |
| Arts, Entertainment & Recreation | 23 (17.2%) | 111 (82.8%) |
| Accommodation & Food Services | 73 (38.0%) | 119 (62.0%) |
| Public Administration | 36 (21.4%) | 132 (78.6%) |
| Total | 1,888 (49.1%) | 1,957 (50.9%) |
Education in Wedgefield
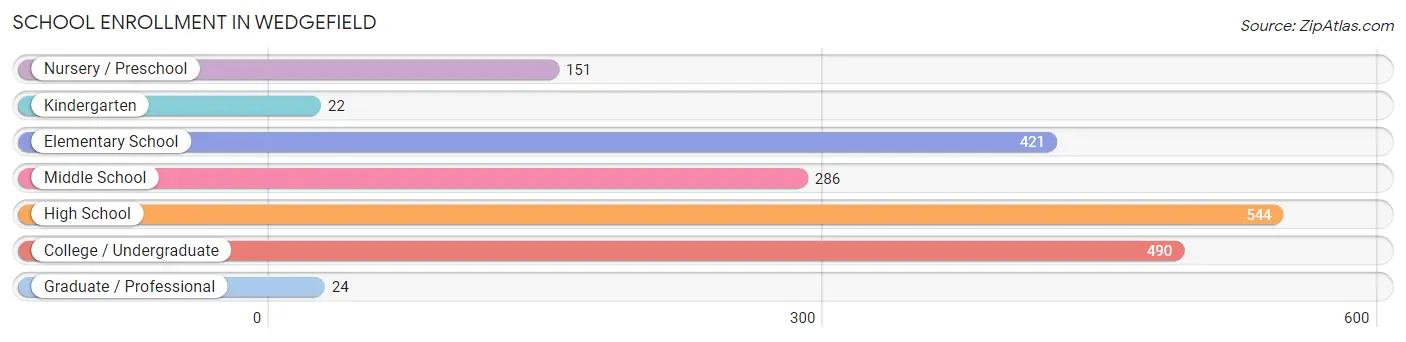
School Enrollment in Wedgefield
The most common levels of schooling among the 1,938 students in Wedgefield are high school (544 | 28.1%), college / undergraduate (490 | 25.3%), and elementary school (421 | 21.7%).
| School Level | # Students | % Students |
| Nursery / Preschool | 151 | 7.8% |
| Kindergarten | 22 | 1.1% |
| Elementary School | 421 | 21.7% |
| Middle School | 286 | 14.8% |
| High School | 544 | 28.1% |
| College / Undergraduate | 490 | 25.3% |
| Graduate / Professional | 24 | 1.2% |
| Total | 1,938 | 100.0% |
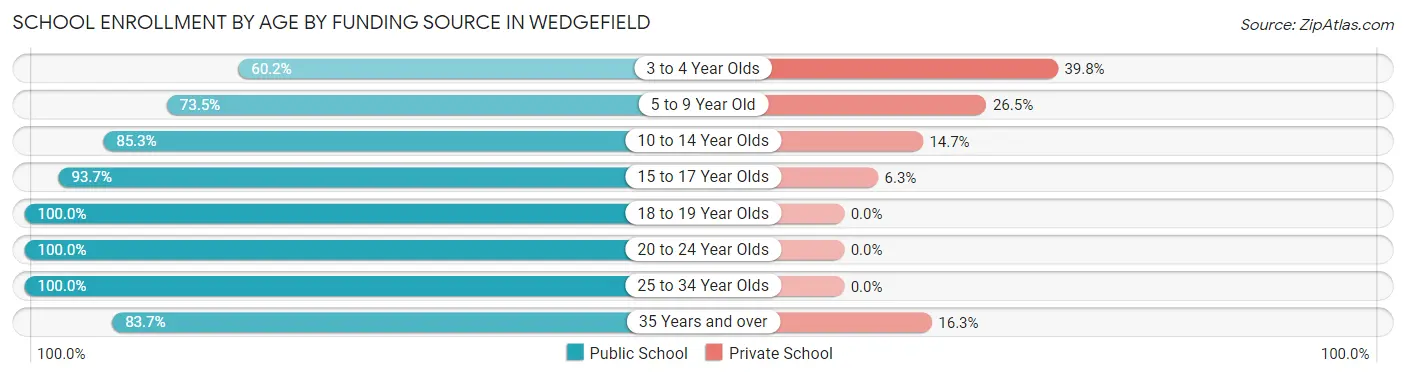
School Enrollment by Age by Funding Source in Wedgefield
Out of a total of 1,938 students who are enrolled in schools in Wedgefield, 273 (14.1%) attend a private institution, while the remaining 1,665 (85.9%) are enrolled in public schools. The age group of 3 to 4 year olds has the highest likelihood of being enrolled in private schools, with 45 (39.8% in the age bracket) enrolled. Conversely, the age group of 18 to 19 year olds has the lowest likelihood of being enrolled in a private school, with 62 (100.0% in the age bracket) attending a public institution.
| Age Bracket | Public School | Private School |
| 3 to 4 Year Olds | 68 (60.2%) | 45 (39.8%) |
| 5 to 9 Year Old | 305 (73.5%) | 110 (26.5%) |
| 10 to 14 Year Olds | 413 (85.3%) | 71 (14.7%) |
| 15 to 17 Year Olds | 356 (93.7%) | 24 (6.3%) |
| 18 to 19 Year Olds | 62 (100.0%) | 0 (0.0%) |
| 20 to 24 Year Olds | 191 (100.0%) | 0 (0.0%) |
| 25 to 34 Year Olds | 146 (100.0%) | 0 (0.0%) |
| 35 Years and over | 123 (83.7%) | 24 (16.3%) |
| Total | 1,665 (85.9%) | 273 (14.1%) |
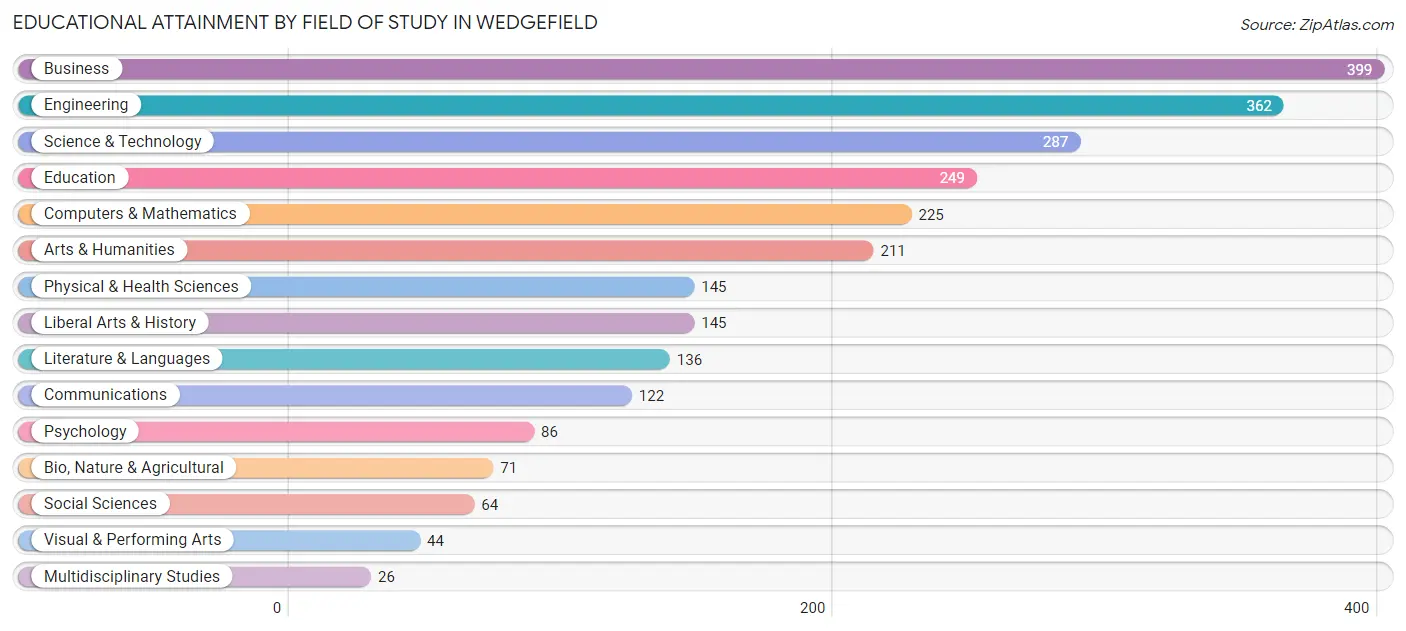
Educational Attainment by Field of Study in Wedgefield
Business (399 | 15.5%), engineering (362 | 14.1%), science & technology (287 | 11.2%), education (249 | 9.7%), and computers & mathematics (225 | 8.7%) are the most common fields of study among 2,572 individuals in Wedgefield who have obtained a bachelor's degree or higher.
| Field of Study | # Graduates | % Graduates |
| Computers & Mathematics | 225 | 8.7% |
| Bio, Nature & Agricultural | 71 | 2.8% |
| Physical & Health Sciences | 145 | 5.6% |
| Psychology | 86 | 3.3% |
| Social Sciences | 64 | 2.5% |
| Engineering | 362 | 14.1% |
| Multidisciplinary Studies | 26 | 1.0% |
| Science & Technology | 287 | 11.2% |
| Business | 399 | 15.5% |
| Education | 249 | 9.7% |
| Literature & Languages | 136 | 5.3% |
| Liberal Arts & History | 145 | 5.6% |
| Visual & Performing Arts | 44 | 1.7% |
| Communications | 122 | 4.7% |
| Arts & Humanities | 211 | 8.2% |
| Total | 2,572 | 100.0% |
Transportation & Commute in Wedgefield
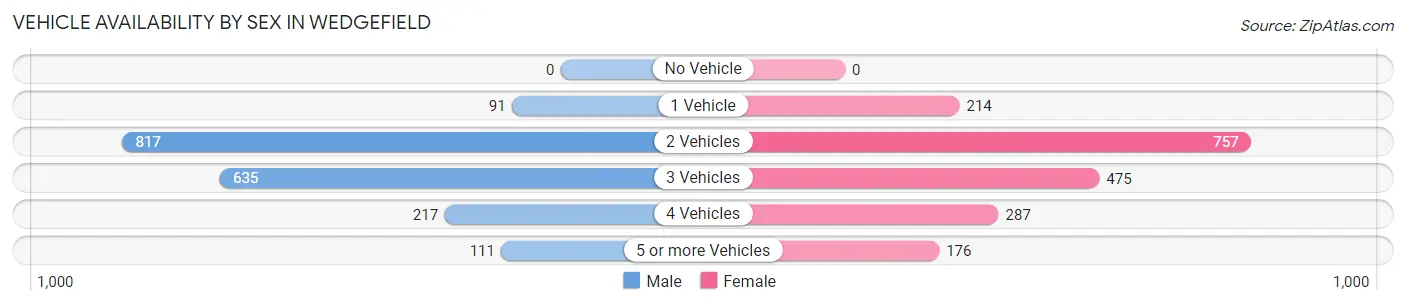
Vehicle Availability by Sex in Wedgefield
The most prevalent vehicle ownership categories in Wedgefield are males with 2 vehicles (817, accounting for 43.7%) and females with 2 vehicles (757, making up 42.8%).
| Vehicles Available | Male | Female |
| No Vehicle | 0 (0.0%) | 0 (0.0%) |
| 1 Vehicle | 91 (4.9%) | 214 (11.2%) |
| 2 Vehicles | 817 (43.7%) | 757 (39.7%) |
| 3 Vehicles | 635 (33.9%) | 475 (24.9%) |
| 4 Vehicles | 217 (11.6%) | 287 (15.0%) |
| 5 or more Vehicles | 111 (5.9%) | 176 (9.2%) |
| Total | 1,871 (100.0%) | 1,909 (100.0%) |
Commute Time in Wedgefield
The most frequently occuring commute durations in Wedgefield are 45 to 59 minutes (762 commuters, 24.5%), 30 to 34 minutes (730 commuters, 23.5%), and 60 to 89 minutes (420 commuters, 13.5%).
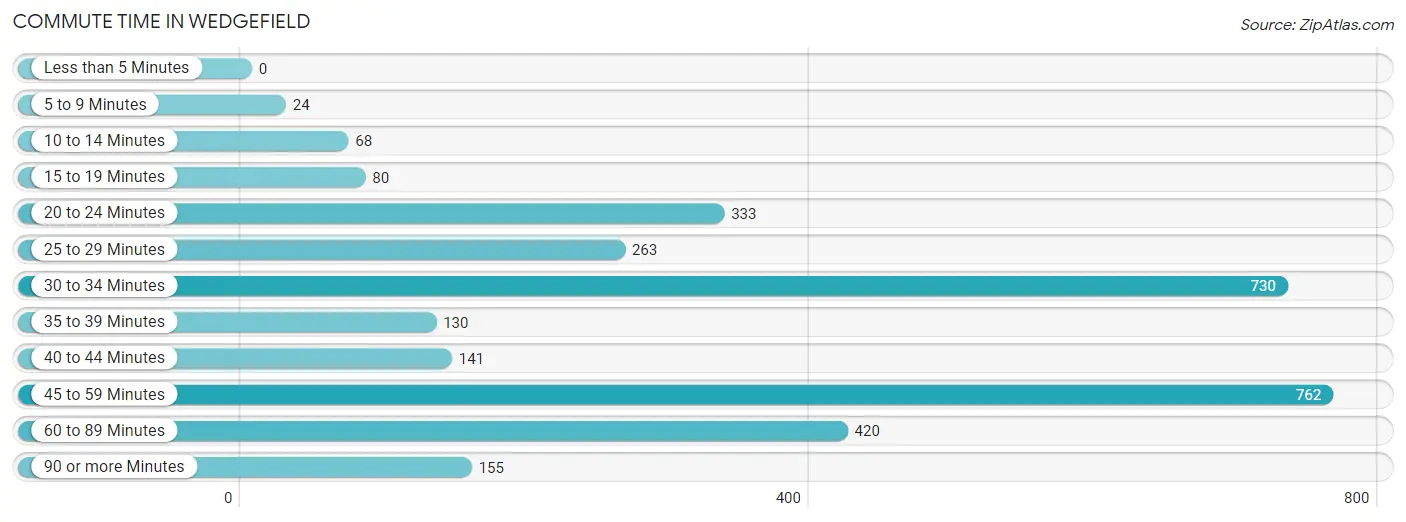
| Commute Time | # Commuters | % Commuters |
| Less than 5 Minutes | 0 | 0.0% |
| 5 to 9 Minutes | 24 | 0.8% |
| 10 to 14 Minutes | 68 | 2.2% |
| 15 to 19 Minutes | 80 | 2.6% |
| 20 to 24 Minutes | 333 | 10.7% |
| 25 to 29 Minutes | 263 | 8.5% |
| 30 to 34 Minutes | 730 | 23.5% |
| 35 to 39 Minutes | 130 | 4.2% |
| 40 to 44 Minutes | 141 | 4.5% |
| 45 to 59 Minutes | 762 | 24.5% |
| 60 to 89 Minutes | 420 | 13.5% |
| 90 or more Minutes | 155 | 5.0% |
Commute Time by Sex in Wedgefield
The most common commute times in Wedgefield are 60 to 89 minutes (332 commuters, 22.9%) for males and 30 to 34 minutes (465 commuters, 28.1%) for females.
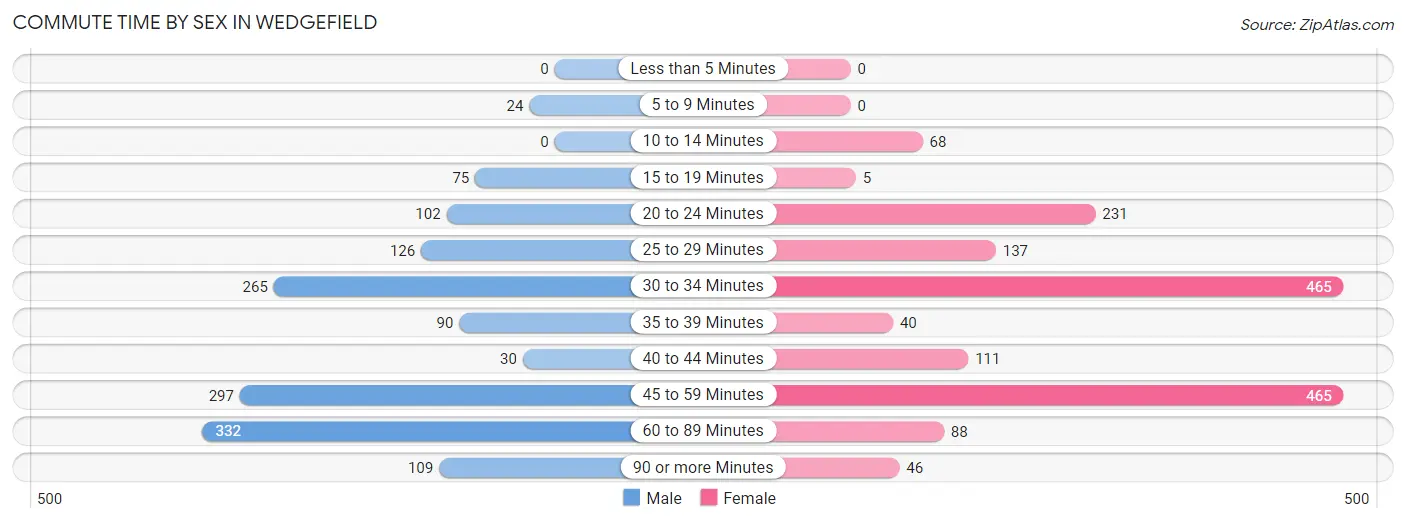
| Commute Time | Male | Female |
| Less than 5 Minutes | 0 (0.0%) | 0 (0.0%) |
| 5 to 9 Minutes | 24 (1.7%) | 0 (0.0%) |
| 10 to 14 Minutes | 0 (0.0%) | 68 (4.1%) |
| 15 to 19 Minutes | 75 (5.2%) | 5 (0.3%) |
| 20 to 24 Minutes | 102 (7.0%) | 231 (14.0%) |
| 25 to 29 Minutes | 126 (8.7%) | 137 (8.3%) |
| 30 to 34 Minutes | 265 (18.3%) | 465 (28.1%) |
| 35 to 39 Minutes | 90 (6.2%) | 40 (2.4%) |
| 40 to 44 Minutes | 30 (2.1%) | 111 (6.7%) |
| 45 to 59 Minutes | 297 (20.5%) | 465 (28.1%) |
| 60 to 89 Minutes | 332 (22.9%) | 88 (5.3%) |
| 90 or more Minutes | 109 (7.5%) | 46 (2.8%) |
Time of Departure to Work by Sex in Wedgefield
The most frequent times of departure to work in Wedgefield are 6:30 AM to 6:59 AM (223, 15.4%) for males and 7:00 AM to 7:29 AM (536, 32.4%) for females.
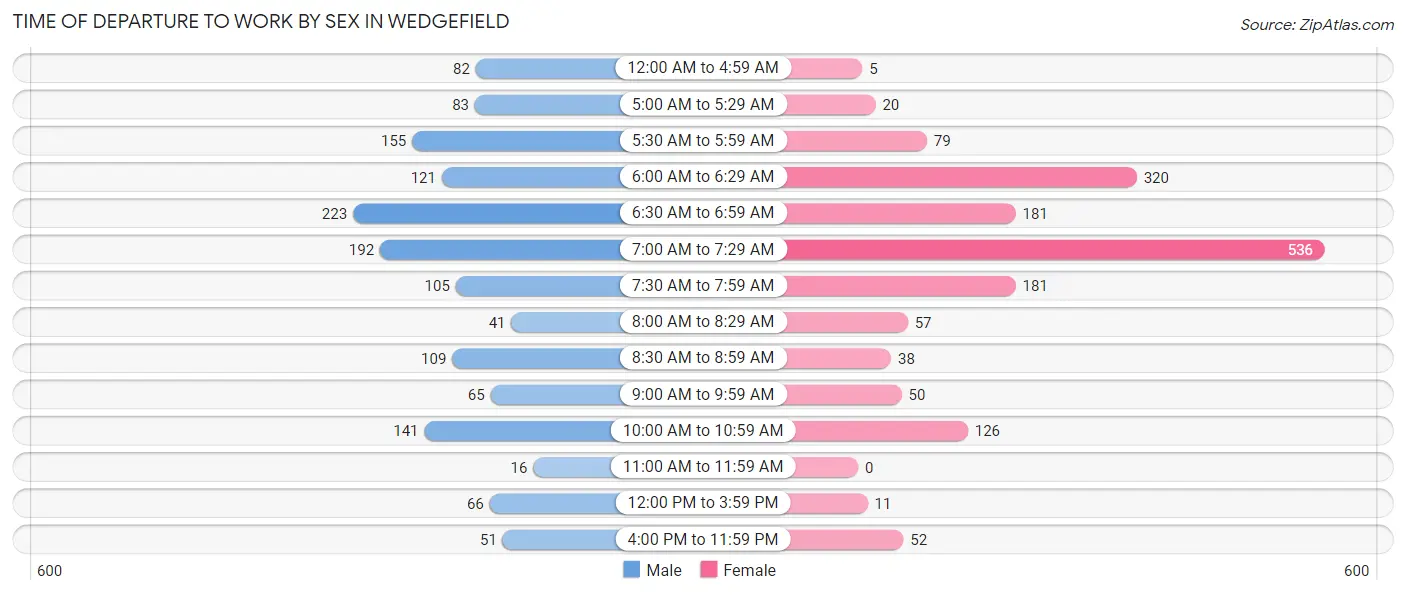
| Time of Departure | Male | Female |
| 12:00 AM to 4:59 AM | 82 (5.7%) | 5 (0.3%) |
| 5:00 AM to 5:29 AM | 83 (5.7%) | 20 (1.2%) |
| 5:30 AM to 5:59 AM | 155 (10.7%) | 79 (4.8%) |
| 6:00 AM to 6:29 AM | 121 (8.3%) | 320 (19.3%) |
| 6:30 AM to 6:59 AM | 223 (15.4%) | 181 (10.9%) |
| 7:00 AM to 7:29 AM | 192 (13.2%) | 536 (32.4%) |
| 7:30 AM to 7:59 AM | 105 (7.2%) | 181 (10.9%) |
| 8:00 AM to 8:29 AM | 41 (2.8%) | 57 (3.4%) |
| 8:30 AM to 8:59 AM | 109 (7.5%) | 38 (2.3%) |
| 9:00 AM to 9:59 AM | 65 (4.5%) | 50 (3.0%) |
| 10:00 AM to 10:59 AM | 141 (9.7%) | 126 (7.6%) |
| 11:00 AM to 11:59 AM | 16 (1.1%) | 0 (0.0%) |
| 12:00 PM to 3:59 PM | 66 (4.5%) | 11 (0.7%) |
| 4:00 PM to 11:59 PM | 51 (3.5%) | 52 (3.1%) |
| Total | 1,450 (100.0%) | 1,656 (100.0%) |
Housing Occupancy in Wedgefield
Occupancy by Ownership in Wedgefield
Of the total 2,604 dwellings in Wedgefield, owner-occupied units account for 2,367 (90.9%), while renter-occupied units make up 237 (9.1%).
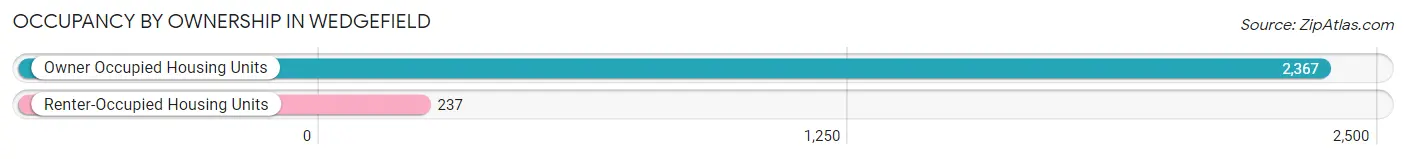
| Occupancy | # Housing Units | % Housing Units |
| Owner Occupied Housing Units | 2,367 | 90.9% |
| Renter-Occupied Housing Units | 237 | 9.1% |
| Total Occupied Housing Units | 2,604 | 100.0% |
Occupancy by Household Size in Wedgefield
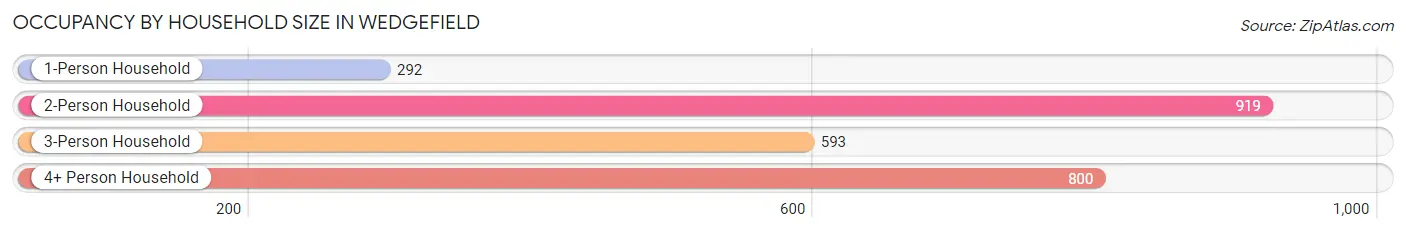
| Household Size | # Housing Units | % Housing Units |
| 1-Person Household | 292 | 11.2% |
| 2-Person Household | 919 | 35.3% |
| 3-Person Household | 593 | 22.8% |
| 4+ Person Household | 800 | 30.7% |
| Total Housing Units | 2,604 | 100.0% |
Occupancy by Ownership by Household Size in Wedgefield
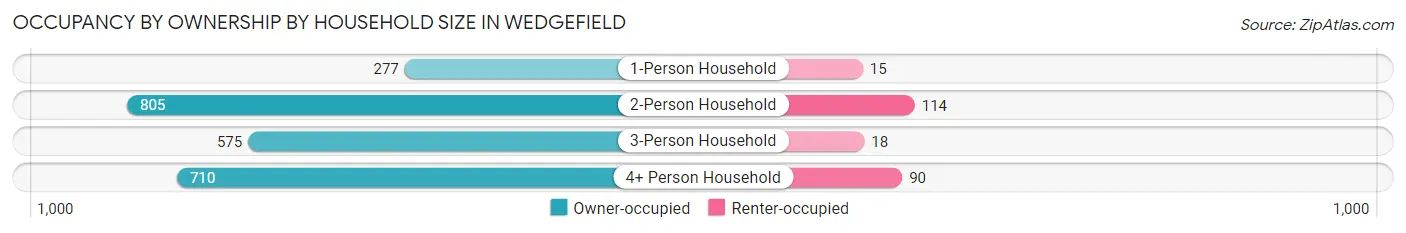
| Household Size | Owner-occupied | Renter-occupied |
| 1-Person Household | 277 (94.9%) | 15 (5.1%) |
| 2-Person Household | 805 (87.6%) | 114 (12.4%) |
| 3-Person Household | 575 (97.0%) | 18 (3.0%) |
| 4+ Person Household | 710 (88.7%) | 90 (11.3%) |
| Total Housing Units | 2,367 (90.9%) | 237 (9.1%) |
Occupancy by Educational Attainment in Wedgefield
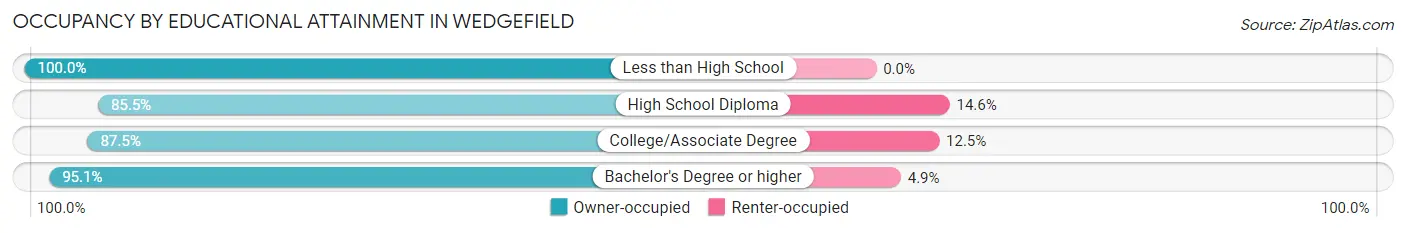
| Household Size | Owner-occupied | Renter-occupied |
| Less than High School | 122 (100.0%) | 0 (0.0%) |
| High School Diploma | 464 (85.5%) | 79 (14.5%) |
| College/Associate Degree | 729 (87.5%) | 104 (12.5%) |
| Bachelor's Degree or higher | 1,052 (95.1%) | 54 (4.9%) |
Occupancy by Age of Householder in Wedgefield
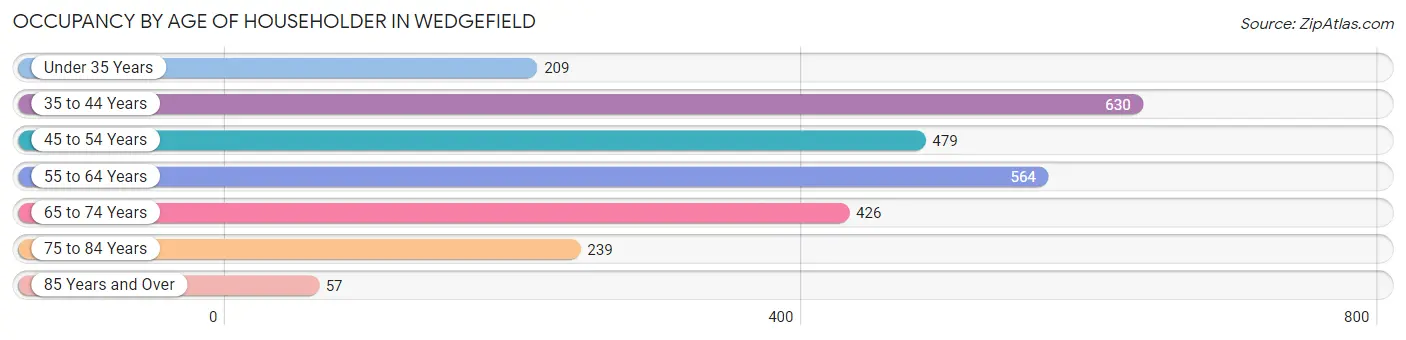
| Age Bracket | # Households | % Households |
| Under 35 Years | 209 | 8.0% |
| 35 to 44 Years | 630 | 24.2% |
| 45 to 54 Years | 479 | 18.4% |
| 55 to 64 Years | 564 | 21.7% |
| 65 to 74 Years | 426 | 16.4% |
| 75 to 84 Years | 239 | 9.2% |
| 85 Years and Over | 57 | 2.2% |
| Total | 2,604 | 100.0% |
Housing Finances in Wedgefield
Median Income by Occupancy in Wedgefield
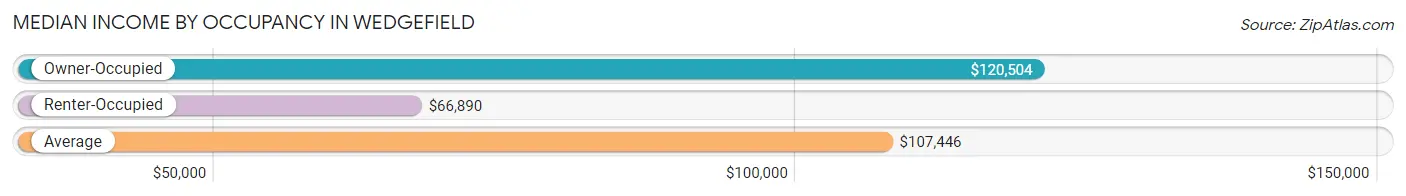
| Occupancy Type | # Households | Median Income |
| Owner-Occupied | 2,367 (90.9%) | $120,504 |
| Renter-Occupied | 237 (9.1%) | $66,890 |
| Average | 2,604 (100.0%) | $107,446 |
Occupancy by Householder Income Bracket in Wedgefield
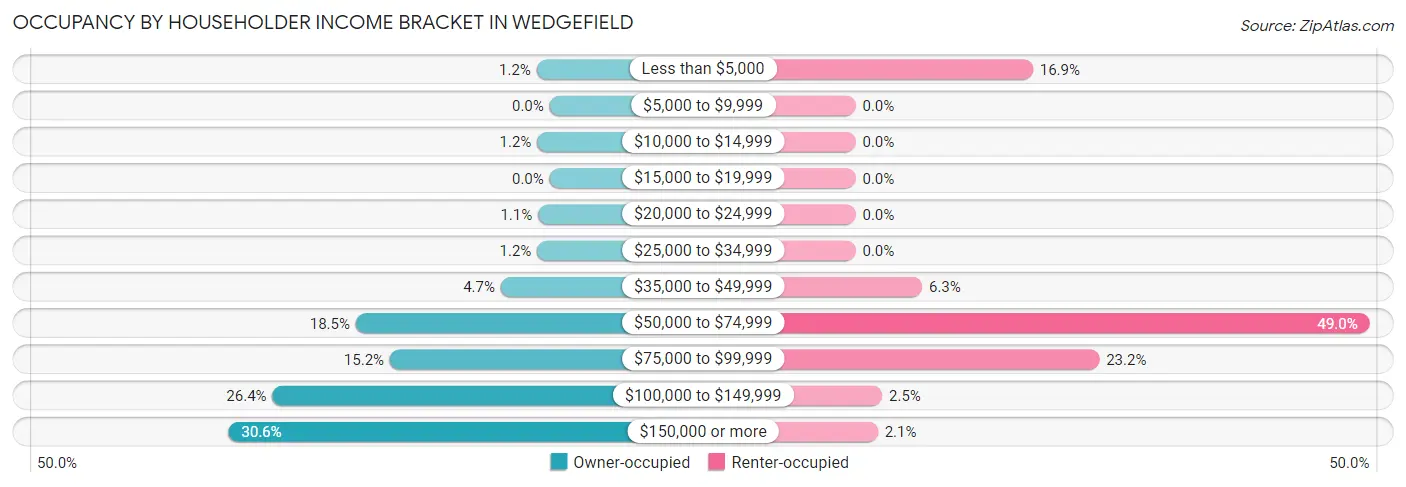
| Income Bracket | Owner-occupied | Renter-occupied |
| Less than $5,000 | 29 (1.2%) | 40 (16.9%) |
| $5,000 to $9,999 | 0 (0.0%) | 0 (0.0%) |
| $10,000 to $14,999 | 28 (1.2%) | 0 (0.0%) |
| $15,000 to $19,999 | 0 (0.0%) | 0 (0.0%) |
| $20,000 to $24,999 | 26 (1.1%) | 0 (0.0%) |
| $25,000 to $34,999 | 28 (1.2%) | 0 (0.0%) |
| $35,000 to $49,999 | 110 (4.6%) | 15 (6.3%) |
| $50,000 to $74,999 | 437 (18.5%) | 116 (48.9%) |
| $75,000 to $99,999 | 360 (15.2%) | 55 (23.2%) |
| $100,000 to $149,999 | 625 (26.4%) | 6 (2.5%) |
| $150,000 or more | 724 (30.6%) | 5 (2.1%) |
| Total | 2,367 (100.0%) | 237 (100.0%) |
Monthly Housing Cost Tiers in Wedgefield
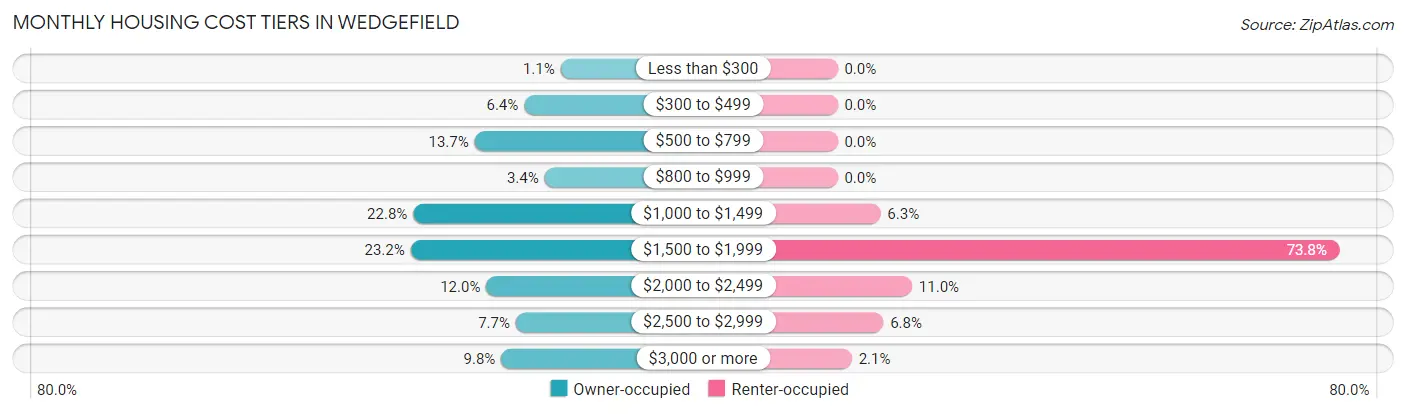
| Monthly Cost | Owner-occupied | Renter-occupied |
| Less than $300 | 25 (1.1%) | 0 (0.0%) |
| $300 to $499 | 152 (6.4%) | 0 (0.0%) |
| $500 to $799 | 325 (13.7%) | 0 (0.0%) |
| $800 to $999 | 81 (3.4%) | 0 (0.0%) |
| $1,000 to $1,499 | 539 (22.8%) | 15 (6.3%) |
| $1,500 to $1,999 | 548 (23.2%) | 175 (73.8%) |
| $2,000 to $2,499 | 284 (12.0%) | 26 (11.0%) |
| $2,500 to $2,999 | 181 (7.6%) | 16 (6.8%) |
| $3,000 or more | 232 (9.8%) | 5 (2.1%) |
| Total | 2,367 (100.0%) | 237 (100.0%) |
Physical Housing Characteristics in Wedgefield
Housing Structures in Wedgefield
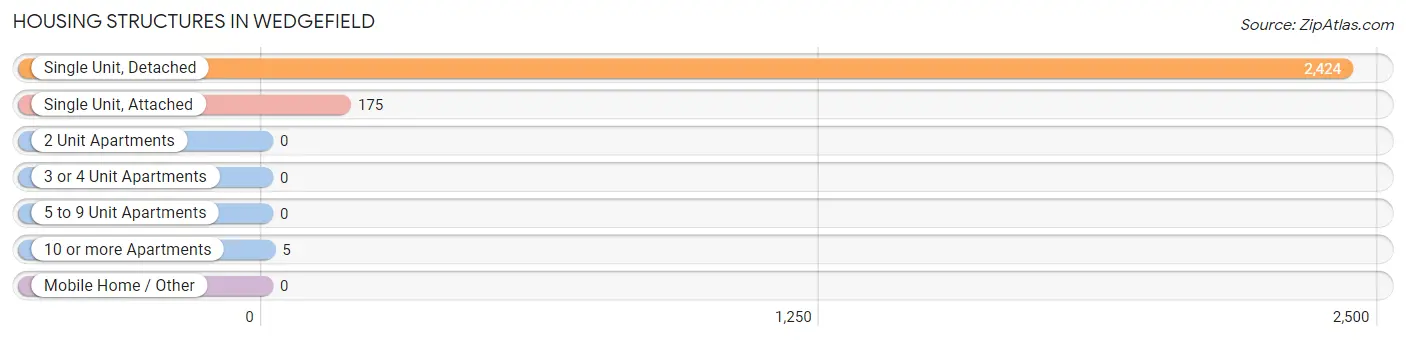
| Structure Type | # Housing Units | % Housing Units |
| Single Unit, Detached | 2,424 | 93.1% |
| Single Unit, Attached | 175 | 6.7% |
| 2 Unit Apartments | 0 | 0.0% |
| 3 or 4 Unit Apartments | 0 | 0.0% |
| 5 to 9 Unit Apartments | 0 | 0.0% |
| 10 or more Apartments | 5 | 0.2% |
| Mobile Home / Other | 0 | 0.0% |
| Total | 2,604 | 100.0% |
Housing Structures by Occupancy in Wedgefield
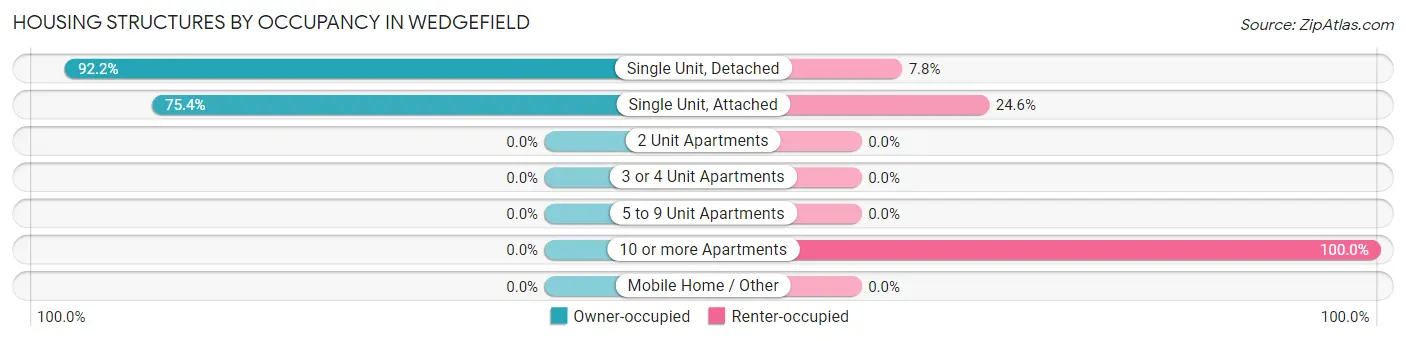
| Structure Type | Owner-occupied | Renter-occupied |
| Single Unit, Detached | 2,235 (92.2%) | 189 (7.8%) |
| Single Unit, Attached | 132 (75.4%) | 43 (24.6%) |
| 2 Unit Apartments | 0 (0.0%) | 0 (0.0%) |
| 3 or 4 Unit Apartments | 0 (0.0%) | 0 (0.0%) |
| 5 to 9 Unit Apartments | 0 (0.0%) | 0 (0.0%) |
| 10 or more Apartments | 0 (0.0%) | 5 (100.0%) |
| Mobile Home / Other | 0 (0.0%) | 0 (0.0%) |
| Total | 2,367 (90.9%) | 237 (9.1%) |
Housing Structures by Number of Rooms in Wedgefield
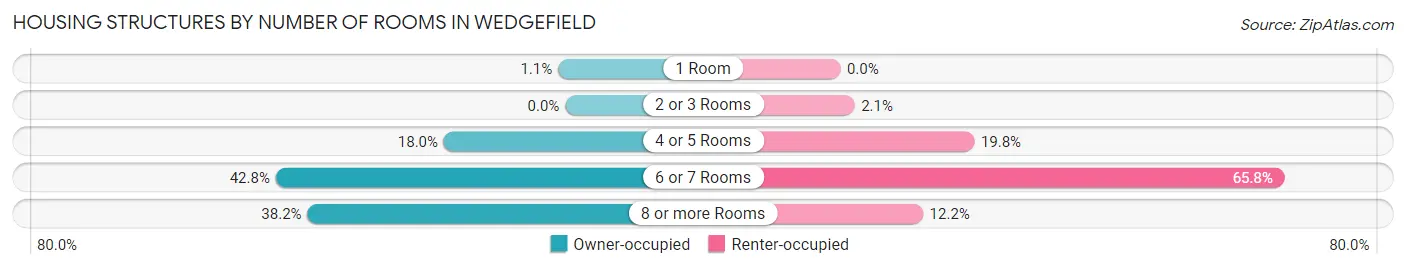
| Number of Rooms | Owner-occupied | Renter-occupied |
| 1 Room | 25 (1.1%) | 0 (0.0%) |
| 2 or 3 Rooms | 0 (0.0%) | 5 (2.1%) |
| 4 or 5 Rooms | 425 (18.0%) | 47 (19.8%) |
| 6 or 7 Rooms | 1,014 (42.8%) | 156 (65.8%) |
| 8 or more Rooms | 903 (38.2%) | 29 (12.2%) |
| Total | 2,367 (100.0%) | 237 (100.0%) |
Housing Structure by Heating Type in Wedgefield
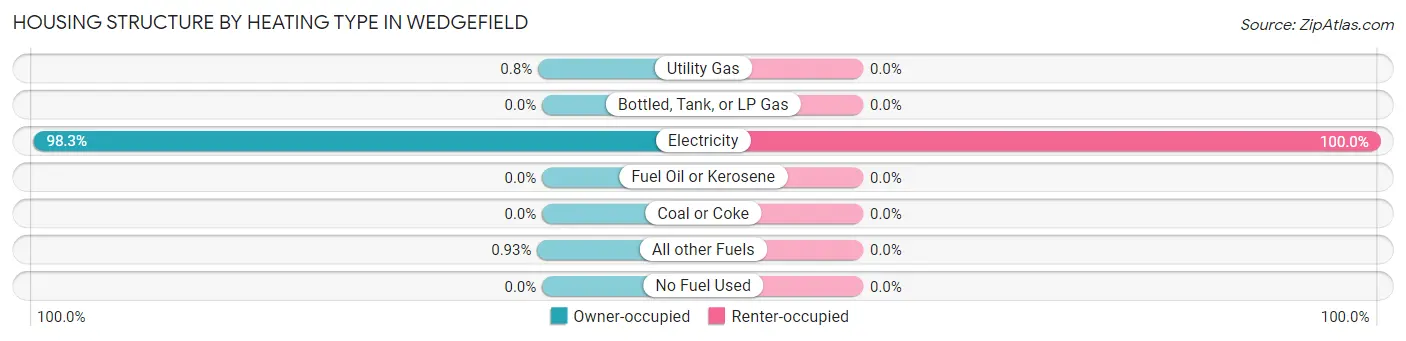
| Heating Type | Owner-occupied | Renter-occupied |
| Utility Gas | 19 (0.8%) | 0 (0.0%) |
| Bottled, Tank, or LP Gas | 0 (0.0%) | 0 (0.0%) |
| Electricity | 2,326 (98.3%) | 237 (100.0%) |
| Fuel Oil or Kerosene | 0 (0.0%) | 0 (0.0%) |
| Coal or Coke | 0 (0.0%) | 0 (0.0%) |
| All other Fuels | 22 (0.9%) | 0 (0.0%) |
| No Fuel Used | 0 (0.0%) | 0 (0.0%) |
| Total | 2,367 (100.0%) | 237 (100.0%) |
Household Vehicle Usage in Wedgefield
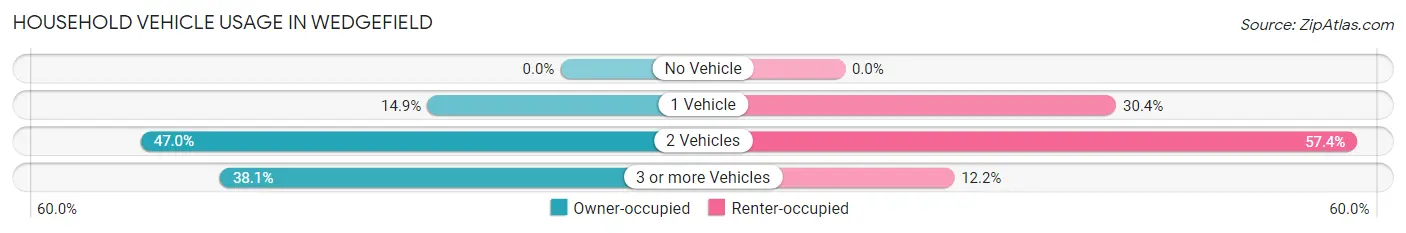
| Vehicles per Household | Owner-occupied | Renter-occupied |
| No Vehicle | 0 (0.0%) | 0 (0.0%) |
| 1 Vehicle | 353 (14.9%) | 72 (30.4%) |
| 2 Vehicles | 1,112 (47.0%) | 136 (57.4%) |
| 3 or more Vehicles | 902 (38.1%) | 29 (12.2%) |
| Total | 2,367 (100.0%) | 237 (100.0%) |
Real Estate & Mortgages in Wedgefield
Real Estate and Mortgage Overview in Wedgefield
| Characteristic | Without Mortgage | With Mortgage |
| Housing Units | 600 | 1,767 |
| Median Property Value | $408,700 | $357,500 |
| Median Household Income | $89,750 | $523 |
| Monthly Housing Costs | $621 | $232 |
| Real Estate Taxes | $2,729 | $13 |
Property Value by Mortgage Status in Wedgefield
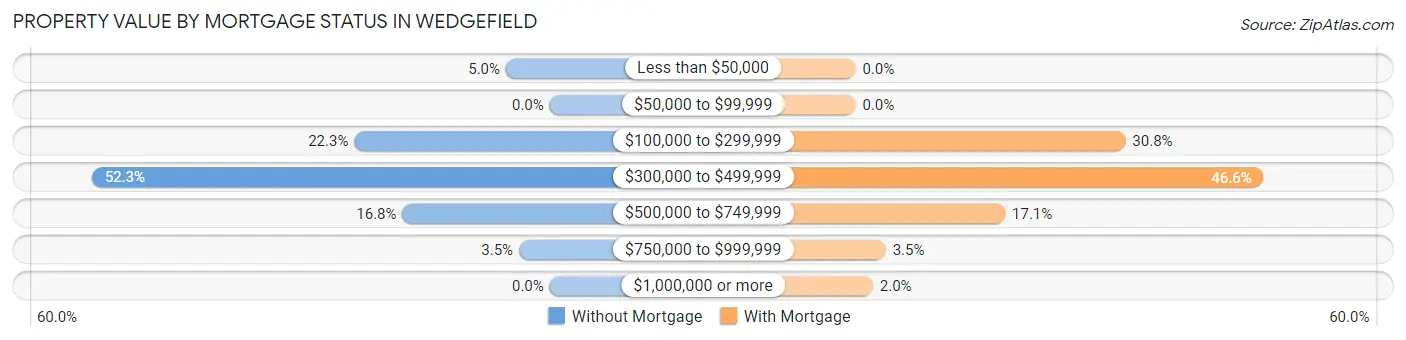
| Property Value | Without Mortgage | With Mortgage |
| Less than $50,000 | 30 (5.0%) | 0 (0.0%) |
| $50,000 to $99,999 | 0 (0.0%) | 0 (0.0%) |
| $100,000 to $299,999 | 134 (22.3%) | 545 (30.8%) |
| $300,000 to $499,999 | 314 (52.3%) | 824 (46.6%) |
| $500,000 to $749,999 | 101 (16.8%) | 302 (17.1%) |
| $750,000 to $999,999 | 21 (3.5%) | 61 (3.5%) |
| $1,000,000 or more | 0 (0.0%) | 35 (2.0%) |
| Total | 600 (100.0%) | 1,767 (100.0%) |
Household Income by Mortgage Status in Wedgefield
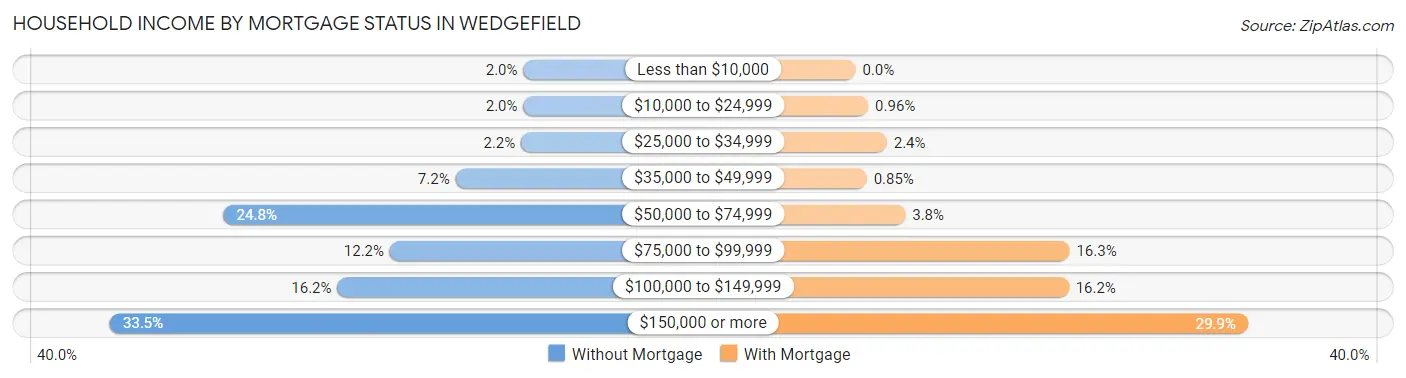
| Household Income | Without Mortgage | With Mortgage |
| Less than $10,000 | 12 (2.0%) | 0 (0.0%) |
| $10,000 to $24,999 | 12 (2.0%) | 17 (1.0%) |
| $25,000 to $34,999 | 13 (2.2%) | 42 (2.4%) |
| $35,000 to $49,999 | 43 (7.2%) | 15 (0.9%) |
| $50,000 to $74,999 | 149 (24.8%) | 67 (3.8%) |
| $75,000 to $99,999 | 73 (12.2%) | 288 (16.3%) |
| $100,000 to $149,999 | 97 (16.2%) | 287 (16.2%) |
| $150,000 or more | 201 (33.5%) | 528 (29.9%) |
| Total | 600 (100.0%) | 1,767 (100.0%) |
Property Value to Household Income Ratio in Wedgefield
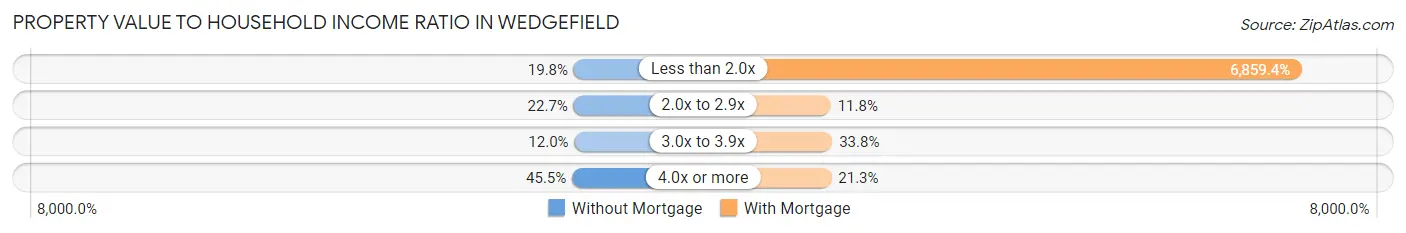
| Value-to-Income Ratio | Without Mortgage | With Mortgage |
| Less than 2.0x | 119 (19.8%) | 121,206 (6,859.4%) |
| 2.0x to 2.9x | 136 (22.7%) | 208 (11.8%) |
| 3.0x to 3.9x | 72 (12.0%) | 598 (33.8%) |
| 4.0x or more | 273 (45.5%) | 376 (21.3%) |
| Total | 600 (100.0%) | 1,767 (100.0%) |
Real Estate Taxes by Mortgage Status in Wedgefield
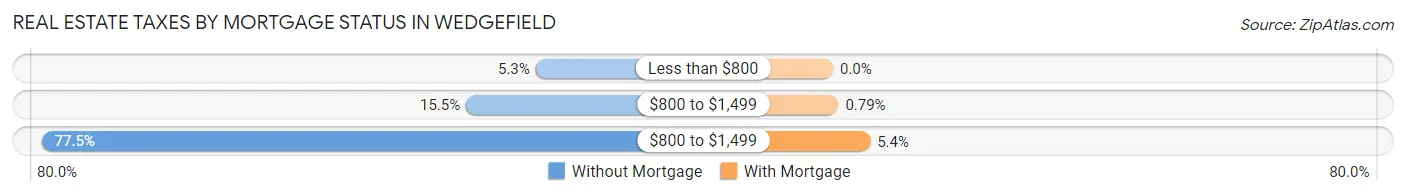
| Property Taxes | Without Mortgage | With Mortgage |
| Less than $800 | 32 (5.3%) | 0 (0.0%) |
| $800 to $1,499 | 93 (15.5%) | 14 (0.8%) |
| $800 to $1,499 | 465 (77.5%) | 96 (5.4%) |
| Total | 600 (100.0%) | 1,767 (100.0%) |
Health & Disability in Wedgefield
Health Insurance Coverage by Age in Wedgefield
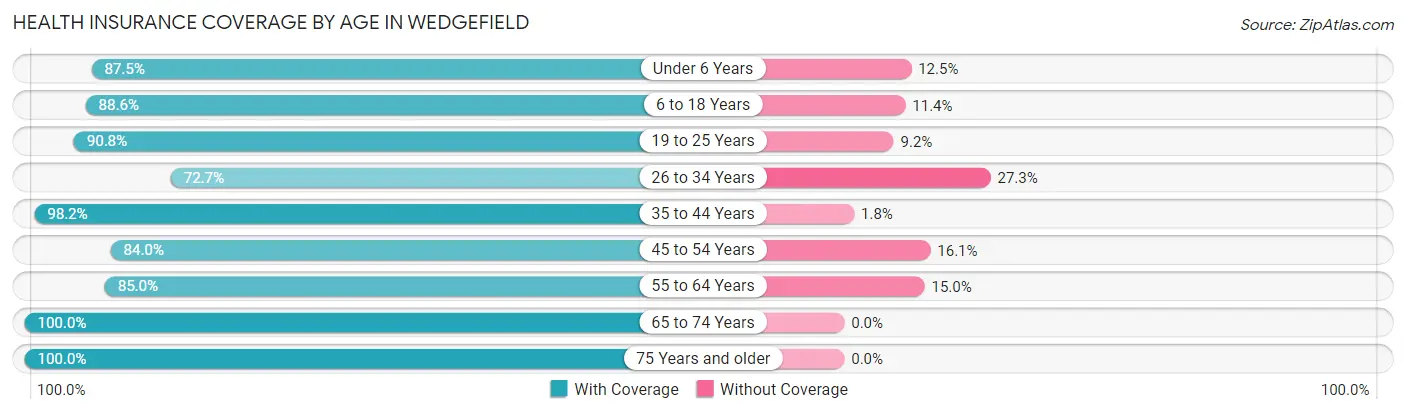
| Age Bracket | With Coverage | Without Coverage |
| Under 6 Years | 554 (87.5%) | 79 (12.5%) |
| 6 to 18 Years | 1,144 (88.6%) | 147 (11.4%) |
| 19 to 25 Years | 504 (90.8%) | 51 (9.2%) |
| 26 to 34 Years | 496 (72.7%) | 186 (27.3%) |
| 35 to 44 Years | 1,233 (98.2%) | 23 (1.8%) |
| 45 to 54 Years | 842 (84.0%) | 161 (16.1%) |
| 55 to 64 Years | 1,177 (85.0%) | 207 (15.0%) |
| 65 to 74 Years | 745 (100.0%) | 0 (0.0%) |
| 75 Years and older | 728 (100.0%) | 0 (0.0%) |
| Total | 7,423 (89.7%) | 854 (10.3%) |
Health Insurance Coverage by Citizenship Status in Wedgefield
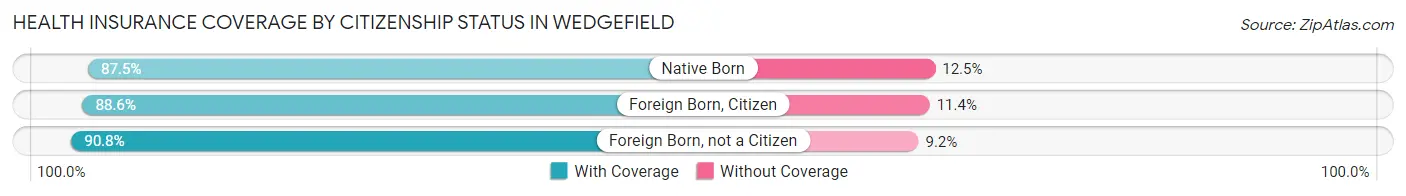
| Citizenship Status | With Coverage | Without Coverage |
| Native Born | 554 (87.5%) | 79 (12.5%) |
| Foreign Born, Citizen | 1,144 (88.6%) | 147 (11.4%) |
| Foreign Born, not a Citizen | 504 (90.8%) | 51 (9.2%) |
Health Insurance Coverage by Household Income in Wedgefield
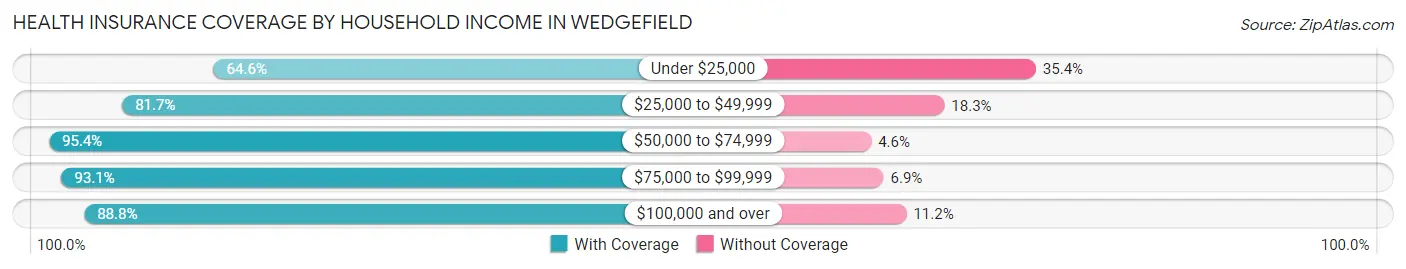
| Household Income | With Coverage | Without Coverage |
| Under $25,000 | 195 (64.6%) | 107 (35.4%) |
| $25,000 to $49,999 | 268 (81.7%) | 60 (18.3%) |
| $50,000 to $74,999 | 1,669 (95.4%) | 80 (4.6%) |
| $75,000 to $99,999 | 1,134 (93.1%) | 84 (6.9%) |
| $100,000 and over | 4,157 (88.8%) | 523 (11.2%) |
Public vs Private Health Insurance Coverage by Age in Wedgefield
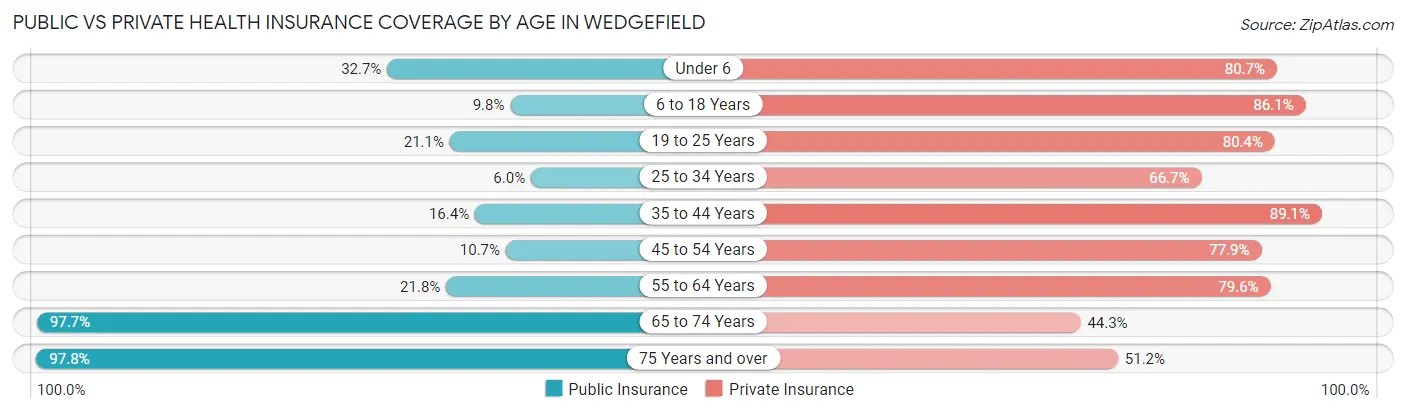
| Age Bracket | Public Insurance | Private Insurance |
| Under 6 | 207 (32.7%) | 511 (80.7%) |
| 6 to 18 Years | 127 (9.8%) | 1,111 (86.1%) |
| 19 to 25 Years | 117 (21.1%) | 446 (80.4%) |
| 25 to 34 Years | 41 (6.0%) | 455 (66.7%) |
| 35 to 44 Years | 206 (16.4%) | 1,119 (89.1%) |
| 45 to 54 Years | 107 (10.7%) | 781 (77.9%) |
| 55 to 64 Years | 301 (21.7%) | 1,101 (79.5%) |
| 65 to 74 Years | 728 (97.7%) | 330 (44.3%) |
| 75 Years and over | 712 (97.8%) | 373 (51.2%) |
| Total | 2,546 (30.8%) | 6,227 (75.2%) |
Disability Status by Sex by Age in Wedgefield
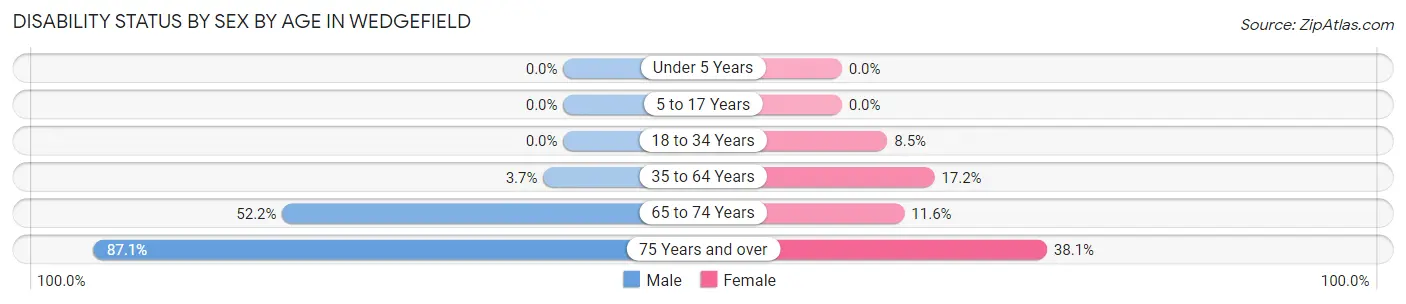
| Age Bracket | Male | Female |
| Under 5 Years | 0 (0.0%) | 0 (0.0%) |
| 5 to 17 Years | 0 (0.0%) | 0 (0.0%) |
| 18 to 34 Years | 0 (0.0%) | 68 (8.5%) |
| 35 to 64 Years | 63 (3.7%) | 335 (17.2%) |
| 65 to 74 Years | 182 (52.1%) | 46 (11.6%) |
| 75 Years and over | 291 (87.1%) | 150 (38.1%) |
Disability Class by Sex by Age in Wedgefield
Disability Class: Hearing Difficulty
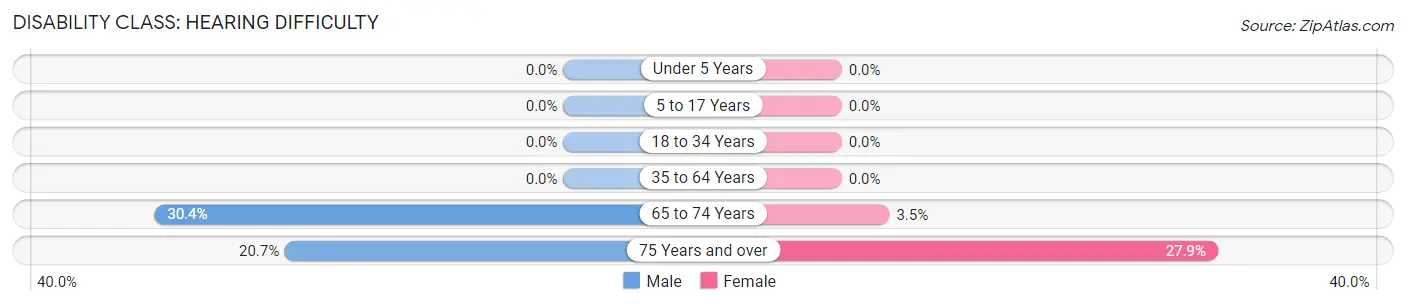
| Age Bracket | Male | Female |
| Under 5 Years | 0 (0.0%) | 0 (0.0%) |
| 5 to 17 Years | 0 (0.0%) | 0 (0.0%) |
| 18 to 34 Years | 0 (0.0%) | 0 (0.0%) |
| 35 to 64 Years | 0 (0.0%) | 0 (0.0%) |
| 65 to 74 Years | 106 (30.4%) | 14 (3.5%) |
| 75 Years and over | 69 (20.7%) | 110 (27.9%) |
Disability Class: Vision Difficulty
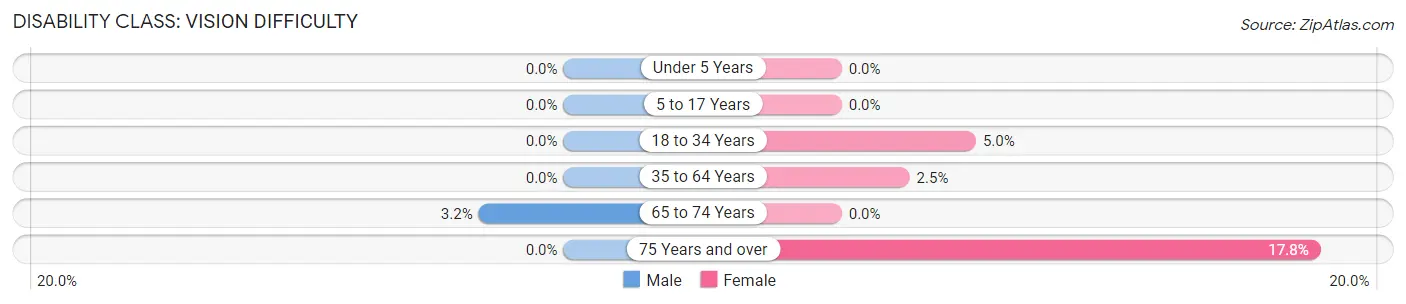
| Age Bracket | Male | Female |
| Under 5 Years | 0 (0.0%) | 0 (0.0%) |
| 5 to 17 Years | 0 (0.0%) | 0 (0.0%) |
| 18 to 34 Years | 0 (0.0%) | 40 (5.0%) |
| 35 to 64 Years | 0 (0.0%) | 49 (2.5%) |
| 65 to 74 Years | 11 (3.2%) | 0 (0.0%) |
| 75 Years and over | 0 (0.0%) | 70 (17.8%) |
Disability Class: Cognitive Difficulty
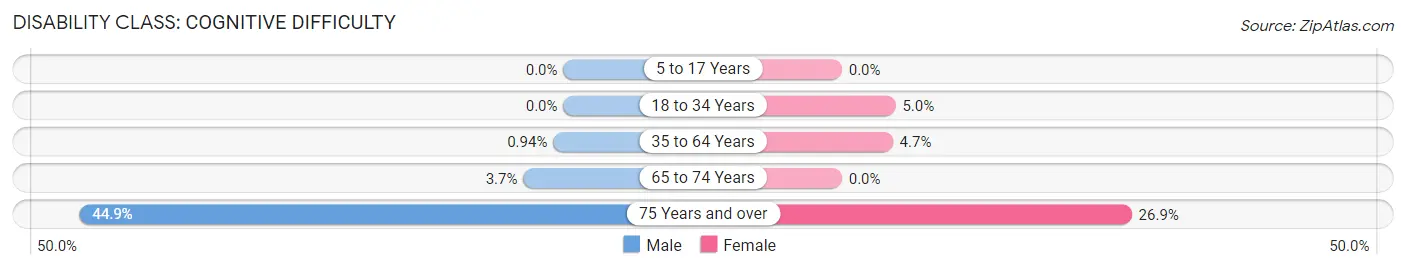
| Age Bracket | Male | Female |
| 5 to 17 Years | 0 (0.0%) | 0 (0.0%) |
| 18 to 34 Years | 0 (0.0%) | 40 (5.0%) |
| 35 to 64 Years | 16 (0.9%) | 92 (4.7%) |
| 65 to 74 Years | 13 (3.7%) | 0 (0.0%) |
| 75 Years and over | 150 (44.9%) | 106 (26.9%) |
Disability Class: Ambulatory Difficulty
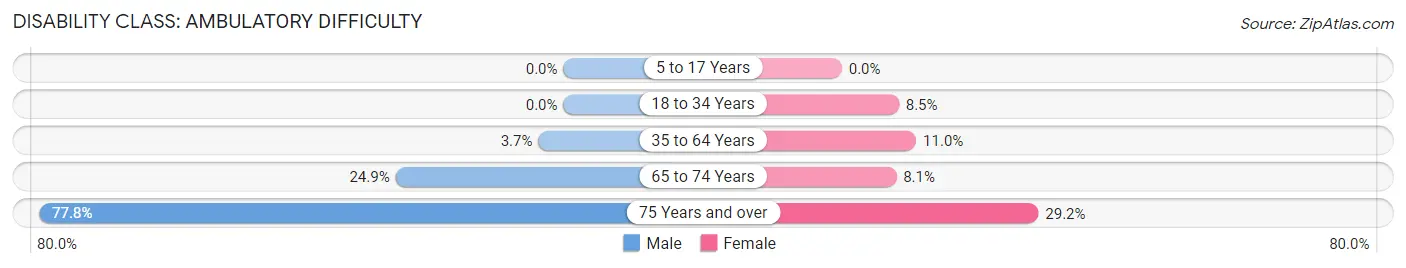
| Age Bracket | Male | Female |
| 5 to 17 Years | 0 (0.0%) | 0 (0.0%) |
| 18 to 34 Years | 0 (0.0%) | 68 (8.5%) |
| 35 to 64 Years | 63 (3.7%) | 215 (11.0%) |
| 65 to 74 Years | 87 (24.9%) | 32 (8.1%) |
| 75 Years and over | 260 (77.8%) | 115 (29.2%) |
Disability Class: Self-Care Difficulty
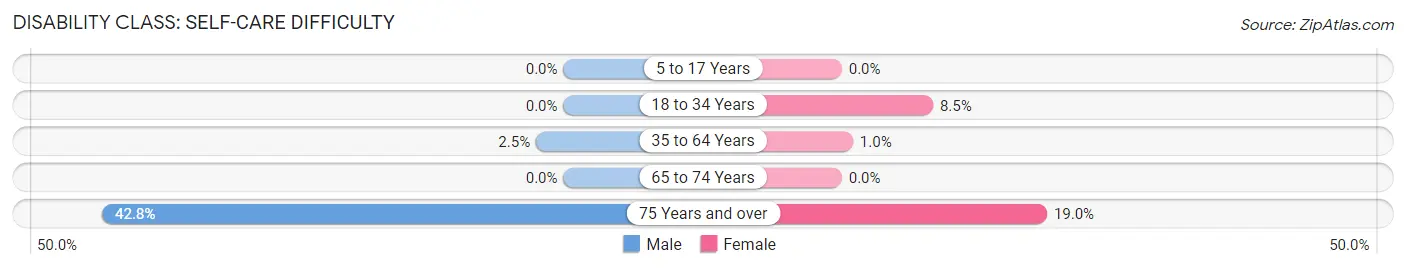
| Age Bracket | Male | Female |
| 5 to 17 Years | 0 (0.0%) | 0 (0.0%) |
| 18 to 34 Years | 0 (0.0%) | 68 (8.5%) |
| 35 to 64 Years | 43 (2.5%) | 20 (1.0%) |
| 65 to 74 Years | 0 (0.0%) | 0 (0.0%) |
| 75 Years and over | 143 (42.8%) | 75 (19.0%) |
Technology Access in Wedgefield
Computing Device Access in Wedgefield
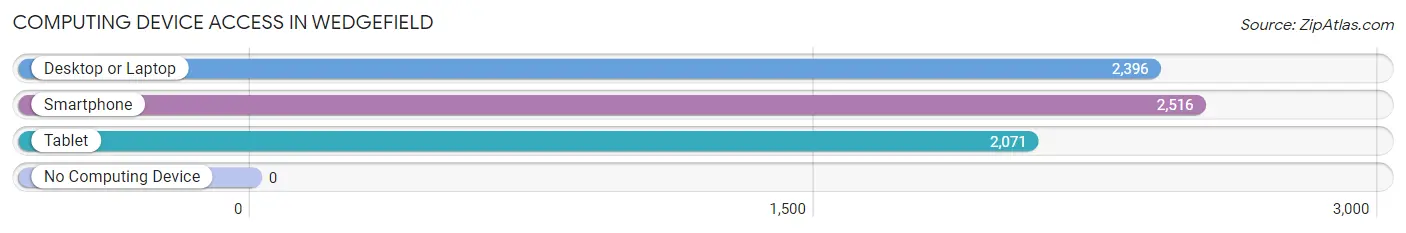
| Device Type | # Households | % Households |
| Desktop or Laptop | 2,396 | 92.0% |
| Smartphone | 2,516 | 96.6% |
| Tablet | 2,071 | 79.5% |
| No Computing Device | 0 | 0.0% |
| Total | 2,604 | 100.0% |
Internet Access in Wedgefield
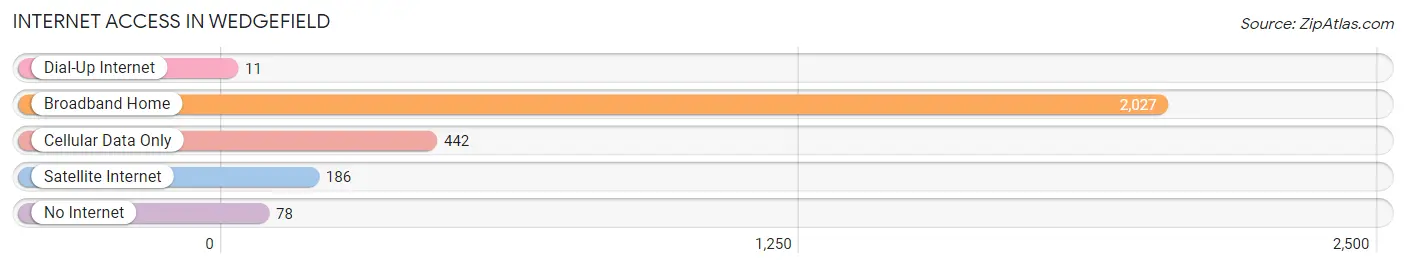
| Internet Type | # Households | % Households |
| Dial-Up Internet | 11 | 0.4% |
| Broadband Home | 2,027 | 77.8% |
| Cellular Data Only | 442 | 17.0% |
| Satellite Internet | 186 | 7.1% |
| No Internet | 78 | 3.0% |
| Total | 2,604 | 100.0% |
Wedgefield Summary
Wedgefield is an unincorporated community located in Orange County, Florida, United States. It is situated in the southeastern part of the county, approximately 20 miles east of downtown Orlando. The community is bordered by the cities of Orlando, Bithlo, and Christmas. Wedgefield is part of the Orlando–Kissimmee–Sanford Metropolitan Statistical Area.
History
Wedgefield was originally part of a large cattle ranch owned by the Wedge family. The family sold the land to developers in the late 1970s, and the community was established in the early 1980s. The community was named after the Wedge family, who had owned the land for many years.
Geography
Wedgefield is located in southeastern Orange County, approximately 20 miles east of downtown Orlando. It is bordered by the cities of Orlando, Bithlo, and Christmas. The community is situated on a flat, sandy plain, with an elevation of approximately 100 feet above sea level. The area is characterized by a mix of residential and agricultural land, with some commercial development.
Economy
Wedgefield is primarily a residential community, with a small commercial sector. The main employers in the area are in the retail and hospitality industries. The community is home to several small businesses, including restaurants, convenience stores, and auto repair shops. The area also has a few light industrial businesses.
Demographics
As of the 2010 census, the population of Wedgefield was 8,845. The racial makeup of the community was 79.3% White, 11.2% African American, 0.7% Native American, 1.3% Asian, 0.1% Pacific Islander, 5.2% from other races, and 2.4% from two or more races. Hispanic or Latino of any race were 15.2% of the population.
The median household income in Wedgefield was $50,945, and the median family income was $54,945. The per capita income was $21,945. About 11.2% of families and 13.2% of the population were below the poverty line, including 17.2% of those under age 18 and 8.2% of those age 65 or over.
Conclusion
Wedgefield is a small, unincorporated community located in Orange County, Florida. It is situated in the southeastern part of the county, approximately 20 miles east of downtown Orlando. The community is primarily residential, with a small commercial sector. The population of Wedgefield was 8,845 as of the 2010 census, with a median household income of $50,945. Wedgefield is part of the Orlando–Kissimmee–Sanford Metropolitan Statistical Area.
Common Questions
What is Per Capita Income in Wedgefield?
Per Capita income in Wedgefield is $38,572.
What is the Median Family Income in Wedgefield?
Median Family Income in Wedgefield is $113,447.
What is the Median Household income in Wedgefield?
Median Household Income in Wedgefield is $107,446.
What is Income or Wage Gap in Wedgefield?
Income or Wage Gap in Wedgefield is 11.1%.
Women in Wedgefield earn 88.9 cents for every dollar earned by a man.
What is Inequality or Gini Index in Wedgefield?
Inequality or Gini Index in Wedgefield is 0.31.
What is the Total Population of Wedgefield?
Total Population of Wedgefield is 8,277.
What is the Total Male Population of Wedgefield?
Total Male Population of Wedgefield is 3,625.
What is the Total Female Population of Wedgefield?
Total Female Population of Wedgefield is 4,652.
What is the Ratio of Males per 100 Females in Wedgefield?
There are 77.92 Males per 100 Females in Wedgefield.
What is the Ratio of Females per 100 Males in Wedgefield?
There are 128.33 Females per 100 Males in Wedgefield.
What is the Median Population Age in Wedgefield?
Median Population Age in Wedgefield is 43.2 Years.
What is the Average Family Size in Wedgefield
Average Family Size in Wedgefield is 3.5 People.
What is the Average Household Size in Wedgefield
Average Household Size in Wedgefield is 3.2 People.
How Large is the Labor Force in Wedgefield?
There are 3,913 People in the Labor Forcein in Wedgefield.
What is the Percentage of People in the Labor Force in Wedgefield?
58.9% of People are in the Labor Force in Wedgefield.
What is the Unemployment Rate in Wedgefield?
Unemployment Rate in Wedgefield is 1.8%.