Tonopah, NV Map & Demographics
Tonopah Map
Tonopah Overview
$31,090
PER CAPITA INCOME
$36,071
AVG FAMILY INCOME
$35,931
AVG HOUSEHOLD INCOME
25.6%
WAGE / INCOME GAP [ % ]
74.4¢/ $1
WAGE / INCOME GAP [ $ ]
0.44
INEQUALITY / GINI INDEX
1,777
TOTAL POPULATION
928
MALE POPULATION
849
FEMALE POPULATION
109.31
MALES / 100 FEMALES
91.49
FEMALES / 100 MALES
58.4
MEDIAN AGE
2.1
AVG FAMILY SIZE
1.6
AVG HOUSEHOLD SIZE
763
LABOR FORCE [ PEOPLE ]
44.7%
PERCENT IN LABOR FORCE
3.0%
UNEMPLOYMENT RATE
Tonopah Zip Codes
Tonopah Area Codes
Income in Tonopah
Income Overview in Tonopah
Per Capita Income in Tonopah is $31,090, while median incomes of families and households are $36,071 and $35,931 respectively.
| Characteristic | Number | Measure |
| Per Capita Income | 1,777 | $31,090 |
| Median Family Income | 326 | $36,071 |
| Mean Family Income | 326 | $49,154 |
| Median Household Income | 1,006 | $35,931 |
| Mean Household Income | 1,006 | $51,325 |
| Income Deficit | 326 | $0 |
| Wage / Income Gap (%) | 1,777 | 25.65% |
| Wage / Income Gap ($) | 1,777 | 74.35¢ per $1 |
| Gini / Inequality Index | 1,777 | 0.44 |
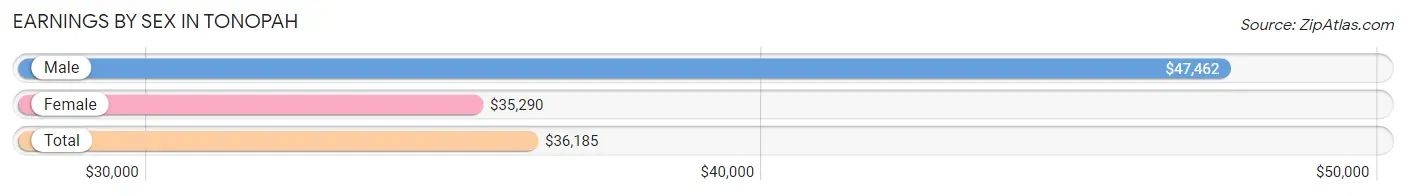
Earnings by Sex in Tonopah
Average Earnings in Tonopah are $36,185, $47,462 for men and $35,290 for women, a difference of 25.7%.
| Sex | Number | Average Earnings |
| Male | 479 (56.1%) | $47,462 |
| Female | 374 (43.9%) | $35,290 |
| Total | 853 (100.0%) | $36,185 |
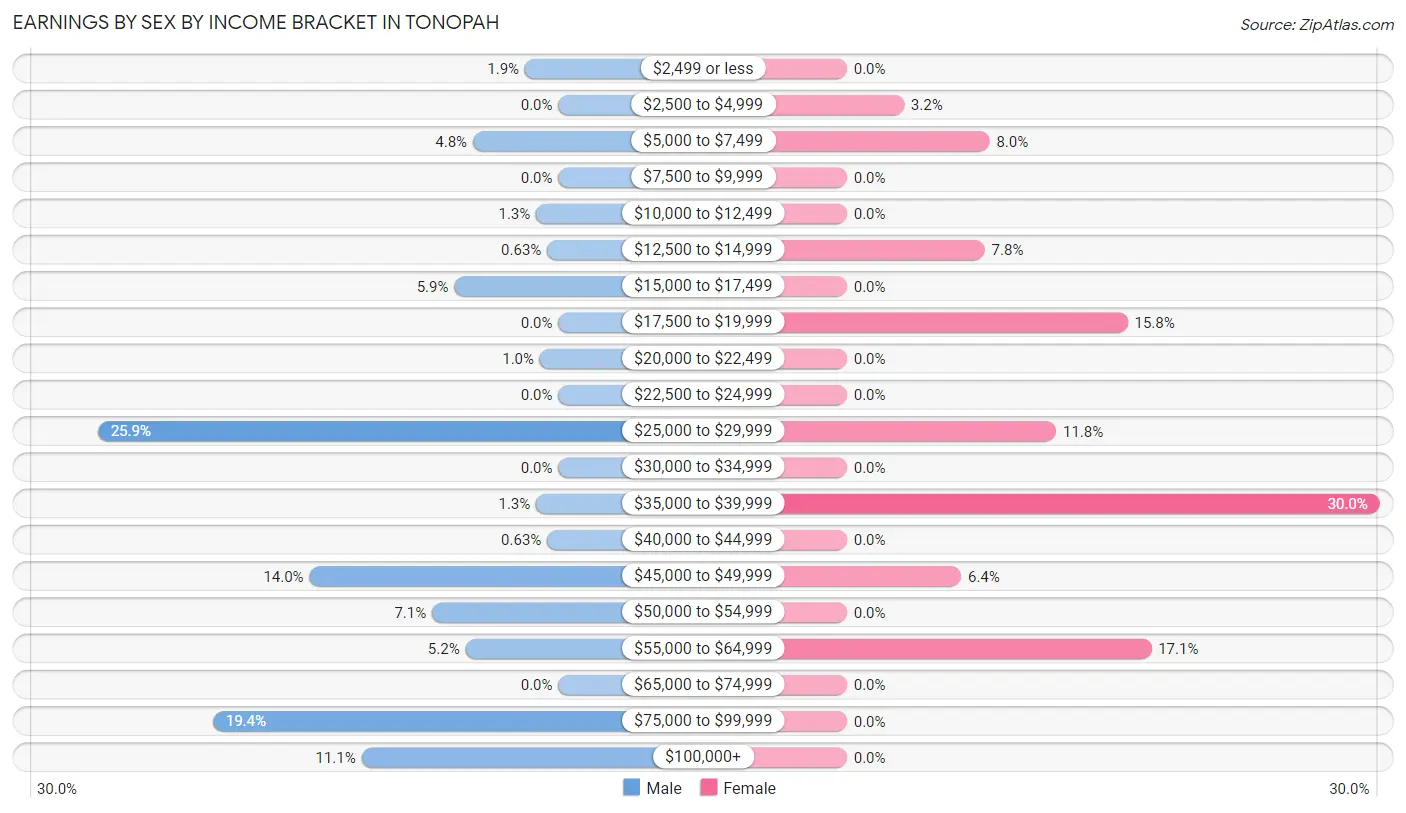
Earnings by Sex by Income Bracket in Tonopah
The most common earnings brackets in Tonopah are $25,000 to $29,999 for men (124 | 25.9%) and $35,000 to $39,999 for women (112 | 29.9%).
| Income | Male | Female |
| $2,499 or less | 9 (1.9%) | 0 (0.0%) |
| $2,500 to $4,999 | 0 (0.0%) | 12 (3.2%) |
| $5,000 to $7,499 | 23 (4.8%) | 30 (8.0%) |
| $7,500 to $9,999 | 0 (0.0%) | 0 (0.0%) |
| $10,000 to $12,499 | 6 (1.3%) | 0 (0.0%) |
| $12,500 to $14,999 | 3 (0.6%) | 29 (7.7%) |
| $15,000 to $17,499 | 28 (5.9%) | 0 (0.0%) |
| $17,500 to $19,999 | 0 (0.0%) | 59 (15.8%) |
| $20,000 to $22,499 | 5 (1.0%) | 0 (0.0%) |
| $22,500 to $24,999 | 0 (0.0%) | 0 (0.0%) |
| $25,000 to $29,999 | 124 (25.9%) | 44 (11.8%) |
| $30,000 to $34,999 | 0 (0.0%) | 0 (0.0%) |
| $35,000 to $39,999 | 6 (1.3%) | 112 (29.9%) |
| $40,000 to $44,999 | 3 (0.6%) | 0 (0.0%) |
| $45,000 to $49,999 | 67 (14.0%) | 24 (6.4%) |
| $50,000 to $54,999 | 34 (7.1%) | 0 (0.0%) |
| $55,000 to $64,999 | 25 (5.2%) | 64 (17.1%) |
| $65,000 to $74,999 | 0 (0.0%) | 0 (0.0%) |
| $75,000 to $99,999 | 93 (19.4%) | 0 (0.0%) |
| $100,000+ | 53 (11.1%) | 0 (0.0%) |
| Total | 479 (100.0%) | 374 (100.0%) |
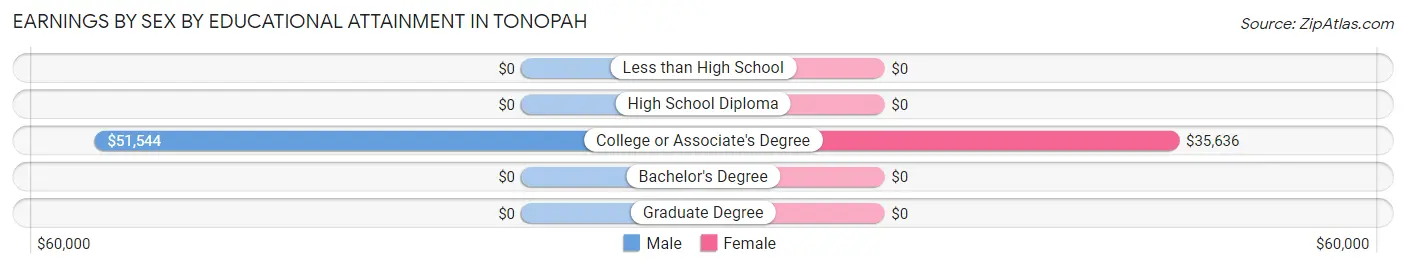
Earnings by Sex by Educational Attainment in Tonopah
Average earnings in Tonopah are $47,574 for men and $35,290 for women, a difference of 25.8%. Men with an educational attainment of college or associate's degree enjoy the highest average annual earnings of $51,544, while those with college or associate's degree education earn the least with $51,544. Women with an educational attainment of college or associate's degree earn the most with the average annual earnings of $35,636, while those with college or associate's degree education have the smallest earnings of $35,636.
| Educational Attainment | Male Income | Female Income |
| Less than High School | - | - |
| High School Diploma | - | - |
| College or Associate's Degree | $51,544 | $35,636 |
| Bachelor's Degree | - | - |
| Graduate Degree | - | - |
| Total | $47,574 | $35,290 |
Family Income in Tonopah
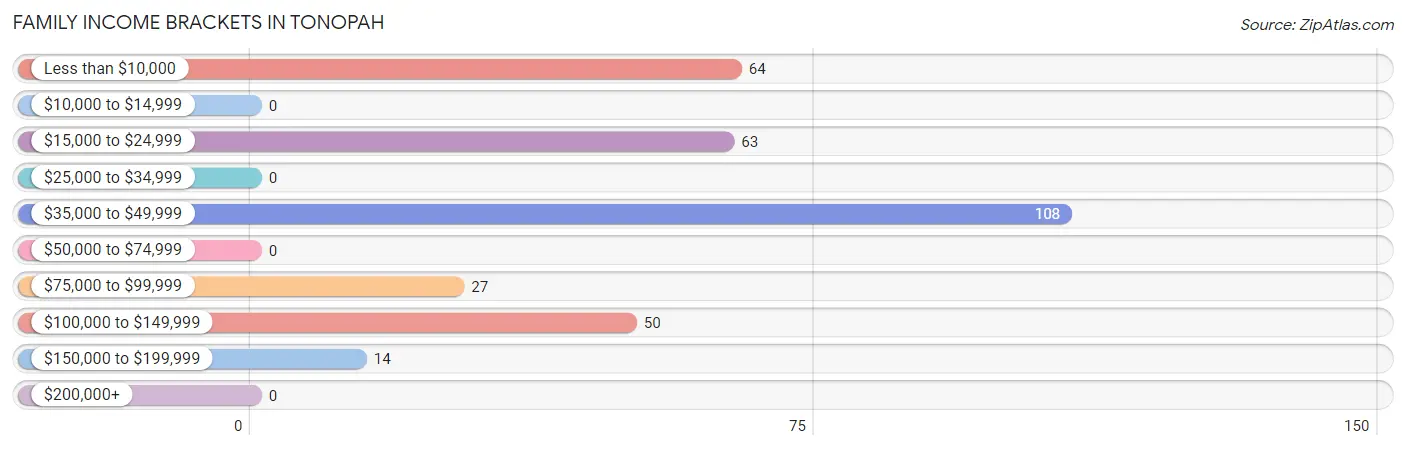
Family Income Brackets in Tonopah
According to the Tonopah family income data, there are 108 families falling into the $35,000 to $49,999 income range, which is the most common income bracket and makes up 33.1% of all families.
| Income Bracket | # Families | % Families |
| Less than $10,000 | 64 | 19.6% |
| $10,000 to $14,999 | 0 | 0.0% |
| $15,000 to $24,999 | 63 | 19.3% |
| $25,000 to $34,999 | 0 | 0.0% |
| $35,000 to $49,999 | 108 | 33.1% |
| $50,000 to $74,999 | 0 | 0.0% |
| $75,000 to $99,999 | 27 | 8.3% |
| $100,000 to $149,999 | 50 | 15.3% |
| $150,000 to $199,999 | 14 | 4.3% |
| $200,000+ | 0 | 0.0% |
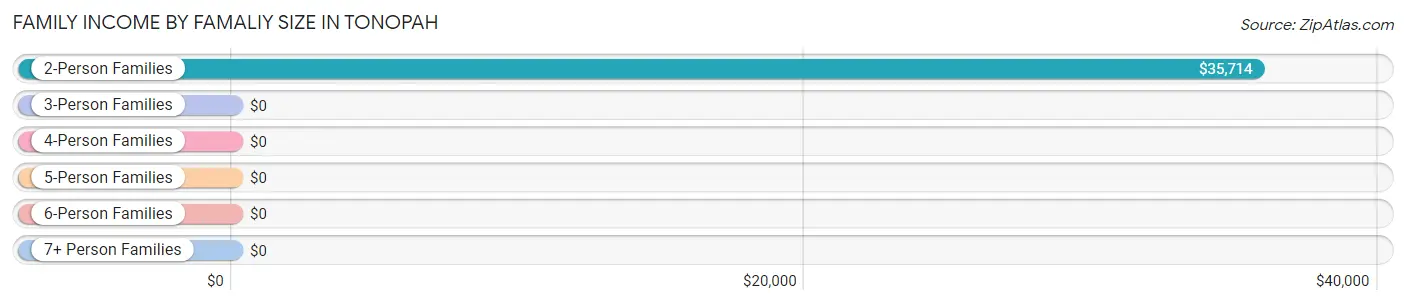
Family Income by Famaliy Size in Tonopah
2-person families (302 | 92.6%) account for the highest median family income in Tonopah with $35,714 per family, while 2-person families (302 | 92.6%) have the highest median income of $17,857 per family member.
| Income Bracket | # Families | Median Income |
| 2-Person Families | 302 (92.6%) | $35,714 |
| 3-Person Families | 24 (7.4%) | $0 |
| 4-Person Families | 0 (0.0%) | $0 |
| 5-Person Families | 0 (0.0%) | $0 |
| 6-Person Families | 0 (0.0%) | $0 |
| 7+ Person Families | 0 (0.0%) | $0 |
| Total | 326 (100.0%) | $36,071 |
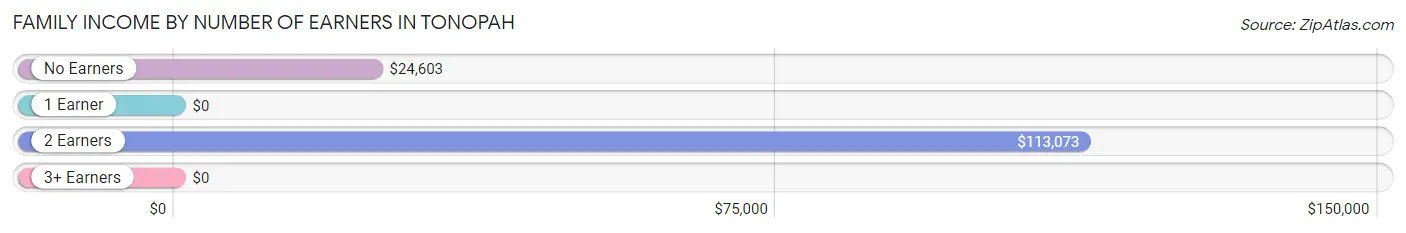
Family Income by Number of Earners in Tonopah
| Number of Earners | # Families | Median Income |
| No Earners | 188 (57.7%) | $24,603 |
| 1 Earner | 73 (22.4%) | $0 |
| 2 Earners | 65 (19.9%) | $113,073 |
| 3+ Earners | 0 (0.0%) | $0 |
| Total | 326 (100.0%) | $36,071 |
Household Income in Tonopah
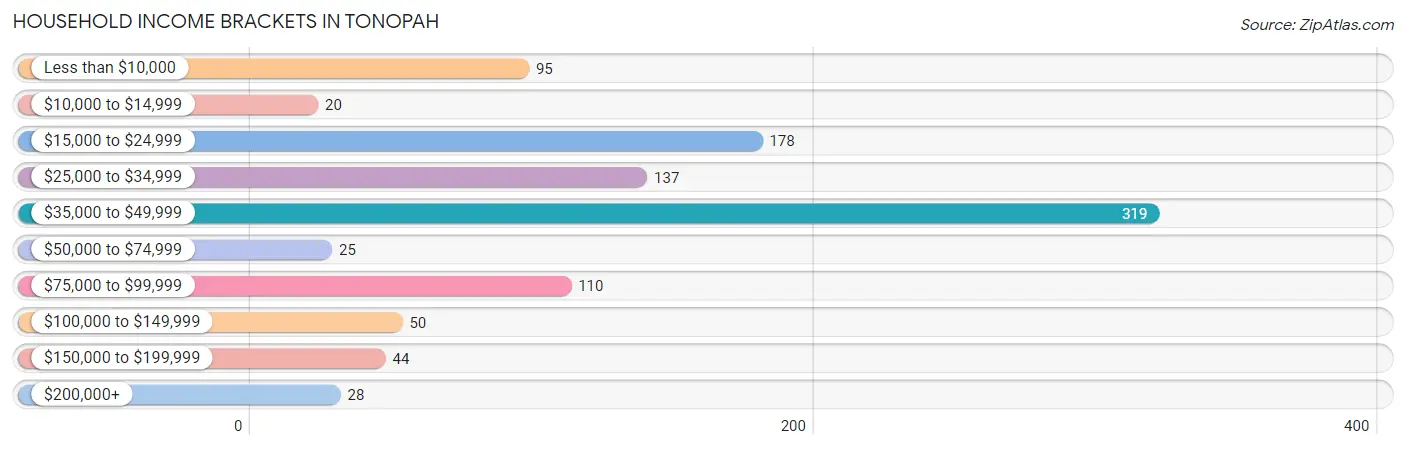
Household Income Brackets in Tonopah
With 319 households falling in the category, the $35,000 to $49,999 income range is the most frequent in Tonopah, accounting for 31.7% of all households. In contrast, only 20 households (2.0%) fall into the $10,000 to $14,999 income bracket, making it the least populous group.
| Income Bracket | # Households | % Households |
| Less than $10,000 | 95 | 9.4% |
| $10,000 to $14,999 | 20 | 2.0% |
| $15,000 to $24,999 | 178 | 17.7% |
| $25,000 to $34,999 | 137 | 13.6% |
| $35,000 to $49,999 | 319 | 31.7% |
| $50,000 to $74,999 | 25 | 2.5% |
| $75,000 to $99,999 | 110 | 10.9% |
| $100,000 to $149,999 | 50 | 5.0% |
| $150,000 to $199,999 | 44 | 4.4% |
| $200,000+ | 28 | 2.8% |
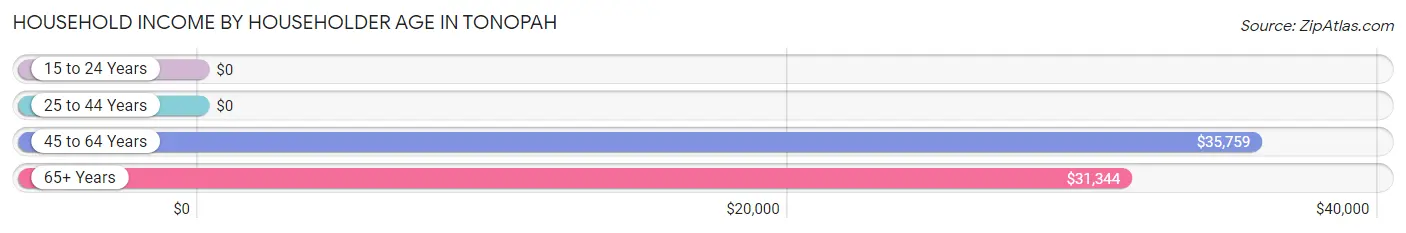
Household Income by Householder Age in Tonopah
The median household income in Tonopah is $35,931, with the highest median household income of $35,759 found in the 45 to 64 years age bracket for the primary householder. A total of 420 households (41.7%) fall into this category. Meanwhile, the 15 to 24 years age bracket for the primary householder has the lowest median household income of $0, with 16 households (1.6%) in this group.
| Income Bracket | # Households | Median Income |
| 15 to 24 Years | 16 (1.6%) | $0 |
| 25 to 44 Years | 226 (22.5%) | $0 |
| 45 to 64 Years | 420 (41.7%) | $35,759 |
| 65+ Years | 344 (34.2%) | $31,344 |
| Total | 1,006 (100.0%) | $35,931 |
Poverty in Tonopah
Income Below Poverty by Sex and Age in Tonopah
With 11.6% poverty level for males and 28.7% for females among the residents of Tonopah, under 5 year old males and 18 to 24 year old females are the most vulnerable to poverty, with 21 males (100.0%) and 16 females (100.0%) in their respective age groups living below the poverty level.
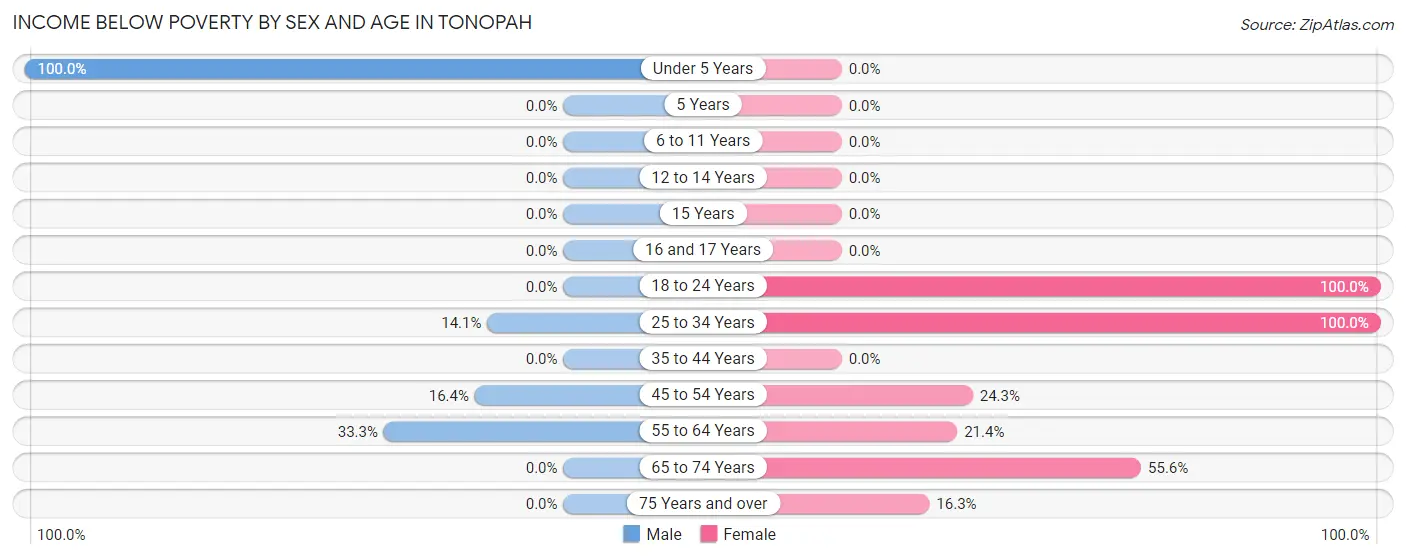
| Age Bracket | Male | Female |
| Under 5 Years | 21 (100.0%) | 0 (0.0%) |
| 5 Years | 0 (0.0%) | 0 (0.0%) |
| 6 to 11 Years | 0 (0.0%) | 0 (0.0%) |
| 12 to 14 Years | 0 (0.0%) | 0 (0.0%) |
| 15 Years | 0 (0.0%) | 0 (0.0%) |
| 16 and 17 Years | 0 (0.0%) | 0 (0.0%) |
| 18 to 24 Years | 0 (0.0%) | 16 (100.0%) |
| 25 to 34 Years | 23 (14.1%) | 27 (100.0%) |
| 35 to 44 Years | 0 (0.0%) | 0 (0.0%) |
| 45 to 54 Years | 12 (16.4%) | 36 (24.3%) |
| 55 to 64 Years | 41 (33.3%) | 30 (21.4%) |
| 65 to 74 Years | 0 (0.0%) | 105 (55.6%) |
| 75 Years and over | 0 (0.0%) | 20 (16.3%) |
| Total | 97 (11.6%) | 234 (28.7%) |
Income Above Poverty by Sex and Age in Tonopah
According to the poverty statistics in Tonopah, males aged 35 to 44 years and females aged 6 to 11 years are the age groups that are most secure financially, with 100.0% of males and 100.0% of females in these age groups living above the poverty line.
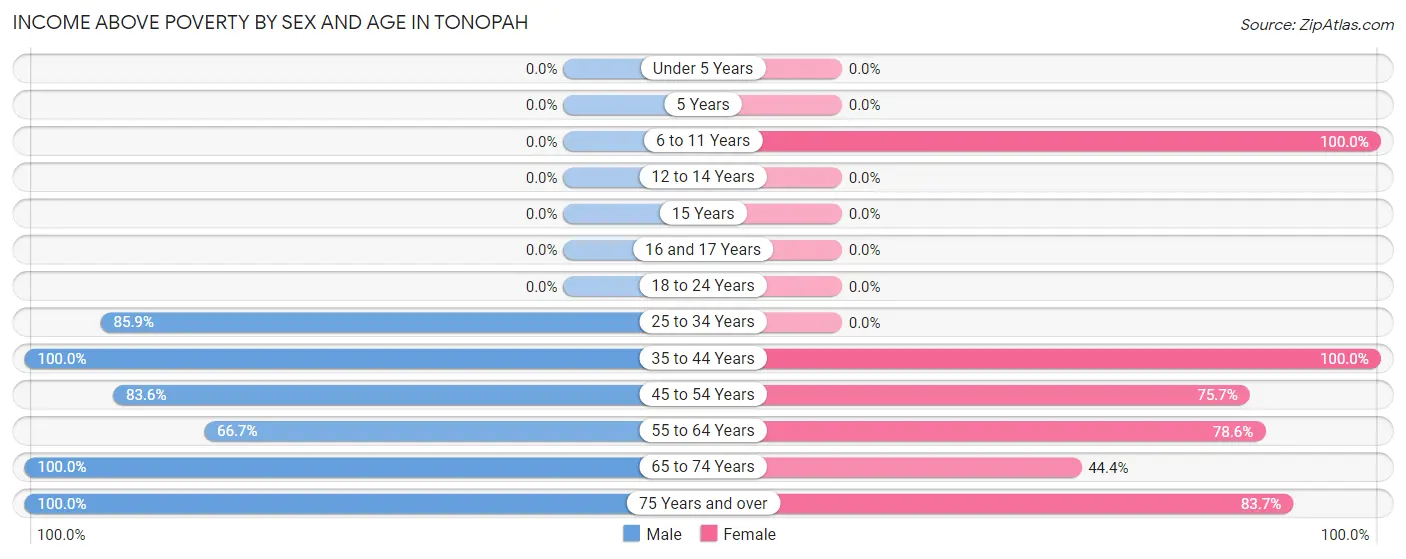
| Age Bracket | Male | Female |
| Under 5 Years | 0 (0.0%) | 0 (0.0%) |
| 5 Years | 0 (0.0%) | 0 (0.0%) |
| 6 to 11 Years | 0 (0.0%) | 50 (100.0%) |
| 12 to 14 Years | 0 (0.0%) | 0 (0.0%) |
| 15 Years | 0 (0.0%) | 0 (0.0%) |
| 16 and 17 Years | 0 (0.0%) | 0 (0.0%) |
| 18 to 24 Years | 0 (0.0%) | 0 (0.0%) |
| 25 to 34 Years | 140 (85.9%) | 0 (0.0%) |
| 35 to 44 Years | 143 (100.0%) | 121 (100.0%) |
| 45 to 54 Years | 61 (83.6%) | 112 (75.7%) |
| 55 to 64 Years | 82 (66.7%) | 110 (78.6%) |
| 65 to 74 Years | 248 (100.0%) | 84 (44.4%) |
| 75 Years and over | 63 (100.0%) | 103 (83.7%) |
| Total | 737 (88.4%) | 580 (71.3%) |
Income Below Poverty Among Married-Couple Families in Tonopah
The poverty statistics for married-couple families in Tonopah show that 16.3% or 41 of the total 252 families live below the poverty line. Families with no children have the highest poverty rate of 18.0%, comprising of 41 families. On the other hand, families with 1 or 2 children have the lowest poverty rate of 0.0%, which includes 0 families.
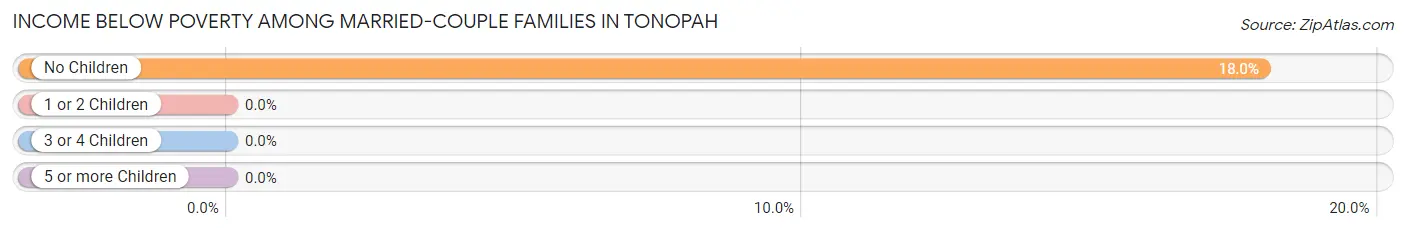
| Children | Above Poverty | Below Poverty |
| No Children | 187 (82.0%) | 41 (18.0%) |
| 1 or 2 Children | 24 (100.0%) | 0 (0.0%) |
| 3 or 4 Children | 0 (0.0%) | 0 (0.0%) |
| 5 or more Children | 0 (0.0%) | 0 (0.0%) |
| Total | 211 (83.7%) | 41 (16.3%) |
Income Below Poverty Among Single-Parent Households in Tonopah
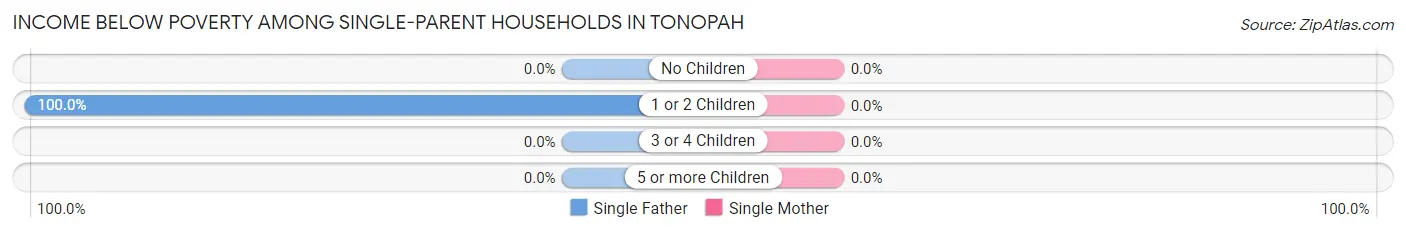
| Children | Single Father | Single Mother |
| No Children | 0 (0.0%) | 0 (0.0%) |
| 1 or 2 Children | 23 (100.0%) | 0 (0.0%) |
| 3 or 4 Children | 0 (0.0%) | 0 (0.0%) |
| 5 or more Children | 0 (0.0%) | 0 (0.0%) |
| Total | 23 (100.0%) | 0 (0.0%) |
Income Below Poverty Among Married-Couple vs Single-Parent Households in Tonopah
The poverty data for Tonopah shows that 41 of the married-couple family households (16.3%) and 23 of the single-parent households (31.1%) are living below the poverty level. Within the married-couple family households, those with no children have the highest poverty rate, with 41 households (18.0%) falling below the poverty line. Among the single-parent households, those with 1 or 2 children have the highest poverty rate, with 23 household (48.9%) living below poverty.
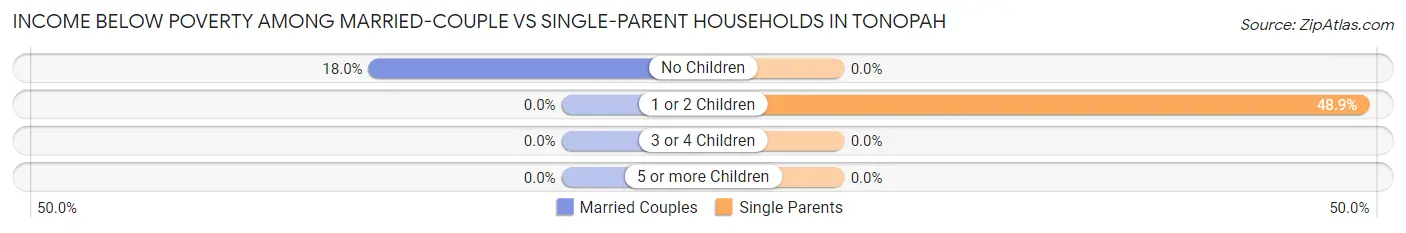
| Children | Married-Couple Families | Single-Parent Households |
| No Children | 41 (18.0%) | 0 (0.0%) |
| 1 or 2 Children | 0 (0.0%) | 23 (48.9%) |
| 3 or 4 Children | 0 (0.0%) | 0 (0.0%) |
| 5 or more Children | 0 (0.0%) | 0 (0.0%) |
| Total | 41 (16.3%) | 23 (31.1%) |
Race in Tonopah
The most populous races in Tonopah are White / Caucasian (1,485 | 83.6%), Hispanic or Latino (206 | 11.6%), and Black / African American (133 | 7.5%).
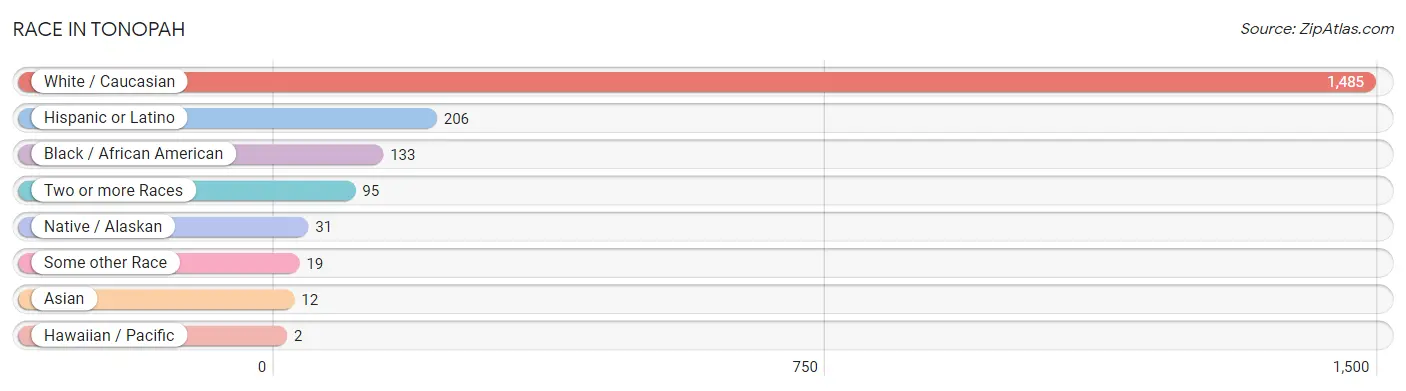
| Race | # Population | % Population |
| Asian | 12 | 0.7% |
| Black / African American | 133 | 7.5% |
| Hawaiian / Pacific | 2 | 0.1% |
| Hispanic or Latino | 206 | 11.6% |
| Native / Alaskan | 31 | 1.7% |
| White / Caucasian | 1,485 | 83.6% |
| Two or more Races | 95 | 5.3% |
| Some other Race | 19 | 1.1% |
| Total | 1,777 | 100.0% |
Ancestry in Tonopah
The most populous ancestries reported in Tonopah are Irish (383 | 21.5%), German (293 | 16.5%), English (206 | 11.6%), Mexican (200 | 11.3%), and Jamaican (112 | 6.3%), together accounting for 67.2% of all Tonopah residents.
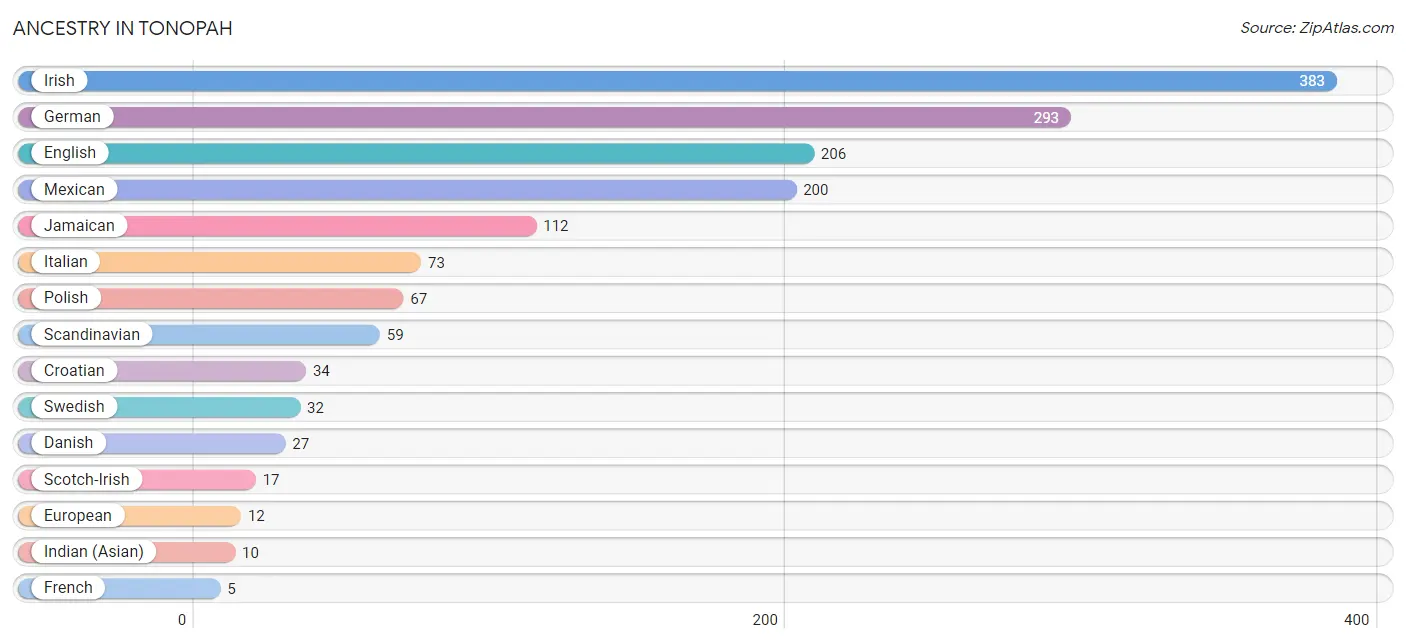
| Ancestry | # Population | % Population |
| Alaska Native | 3 | 0.2% |
| American | 3 | 0.2% |
| Austrian | 3 | 0.2% |
| British | 2 | 0.1% |
| Croatian | 34 | 1.9% |
| Cuban | 3 | 0.2% |
| Danish | 27 | 1.5% |
| English | 206 | 11.6% |
| European | 12 | 0.7% |
| French | 5 | 0.3% |
| German | 293 | 16.5% |
| Indian (Asian) | 10 | 0.6% |
| Irish | 383 | 21.5% |
| Italian | 73 | 4.1% |
| Jamaican | 112 | 6.3% |
| Mexican | 200 | 11.3% |
| Native Hawaiian | 2 | 0.1% |
| Polish | 67 | 3.8% |
| Scandinavian | 59 | 3.3% |
| Scotch-Irish | 17 | 1.0% |
| Scottish | 3 | 0.2% |
| Swedish | 32 | 1.8% |
| Welsh | 3 | 0.2% |
| Yaqui | 3 | 0.2% | View All 24 Rows |
Immigrants in Tonopah
The most numerous immigrant groups reported in Tonopah came from Latin America (116 | 6.5%), Caribbean (112 | 6.3%), Jamaica (112 | 6.3%), Europe (16 | 0.9%), and Germany (14 | 0.8%), together accounting for 20.8% of all Tonopah residents.
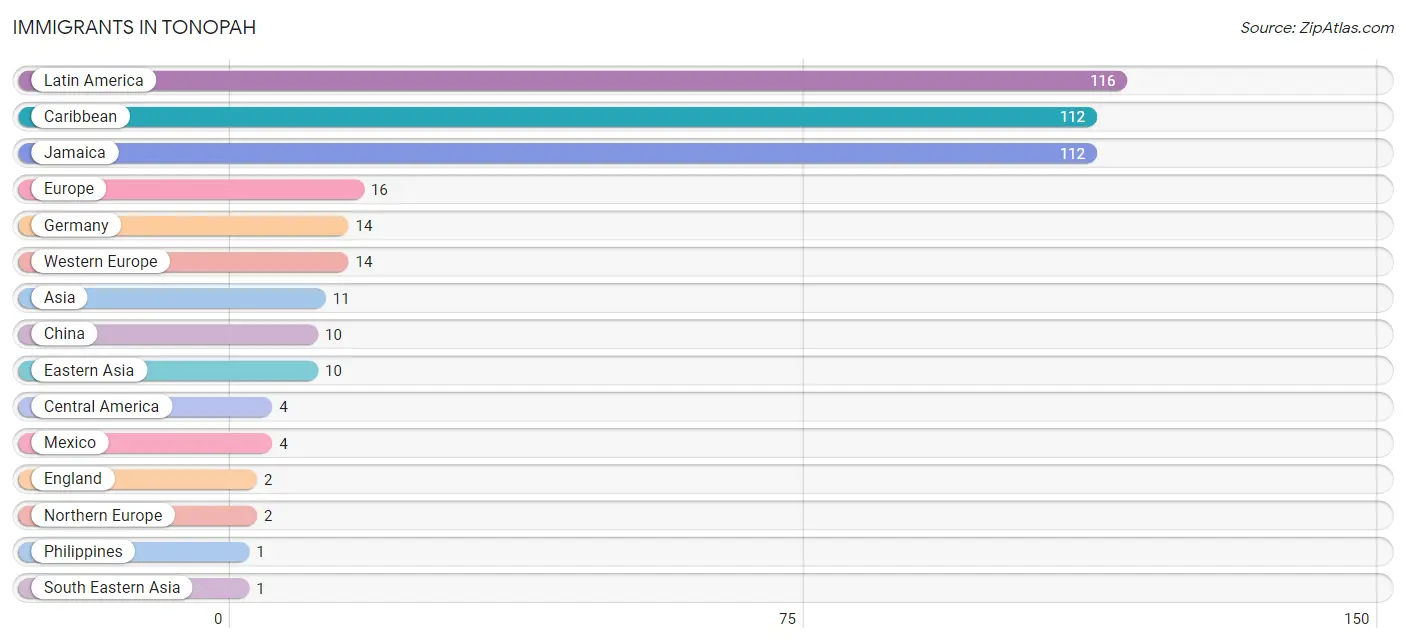
| Immigration Origin | # Population | % Population |
| Asia | 11 | 0.6% |
| Caribbean | 112 | 6.3% |
| Central America | 4 | 0.2% |
| China | 10 | 0.6% |
| Eastern Asia | 10 | 0.6% |
| England | 2 | 0.1% |
| Europe | 16 | 0.9% |
| Germany | 14 | 0.8% |
| Jamaica | 112 | 6.3% |
| Latin America | 116 | 6.5% |
| Mexico | 4 | 0.2% |
| Northern Europe | 2 | 0.1% |
| Philippines | 1 | 0.1% |
| South Eastern Asia | 1 | 0.1% |
| Western Europe | 14 | 0.8% | View All 15 Rows |
Sex and Age in Tonopah
Sex and Age in Tonopah
The most populous age groups in Tonopah are 70 to 74 Years (223 | 24.0%) for men and 50 to 54 Years (148 | 17.4%) for women.
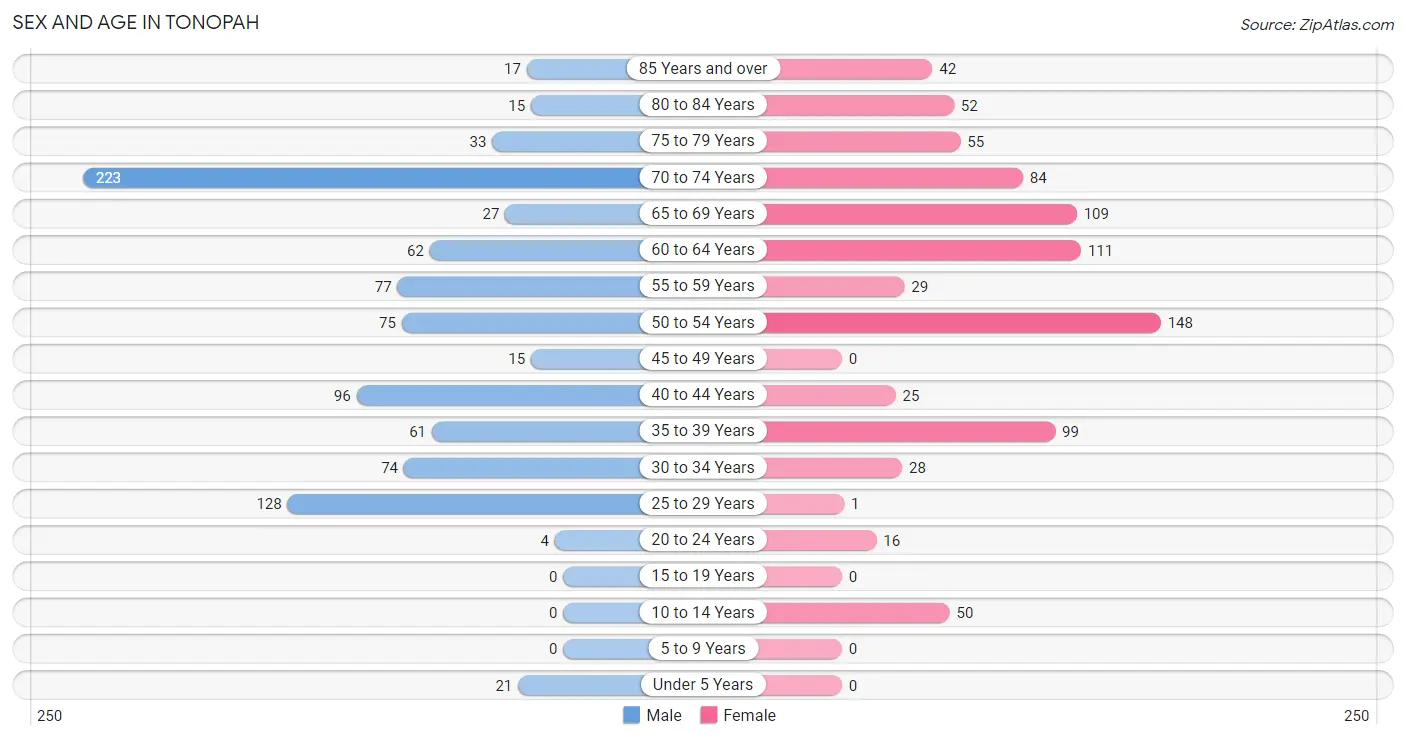
| Age Bracket | Male | Female |
| Under 5 Years | 21 (2.3%) | 0 (0.0%) |
| 5 to 9 Years | 0 (0.0%) | 0 (0.0%) |
| 10 to 14 Years | 0 (0.0%) | 50 (5.9%) |
| 15 to 19 Years | 0 (0.0%) | 0 (0.0%) |
| 20 to 24 Years | 4 (0.4%) | 16 (1.9%) |
| 25 to 29 Years | 128 (13.8%) | 1 (0.1%) |
| 30 to 34 Years | 74 (8.0%) | 28 (3.3%) |
| 35 to 39 Years | 61 (6.6%) | 99 (11.7%) |
| 40 to 44 Years | 96 (10.3%) | 25 (2.9%) |
| 45 to 49 Years | 15 (1.6%) | 0 (0.0%) |
| 50 to 54 Years | 75 (8.1%) | 148 (17.4%) |
| 55 to 59 Years | 77 (8.3%) | 29 (3.4%) |
| 60 to 64 Years | 62 (6.7%) | 111 (13.1%) |
| 65 to 69 Years | 27 (2.9%) | 109 (12.8%) |
| 70 to 74 Years | 223 (24.0%) | 84 (9.9%) |
| 75 to 79 Years | 33 (3.6%) | 55 (6.5%) |
| 80 to 84 Years | 15 (1.6%) | 52 (6.1%) |
| 85 Years and over | 17 (1.8%) | 42 (5.0%) |
| Total | 928 (100.0%) | 849 (100.0%) |
Families and Households in Tonopah
Median Family Size in Tonopah
The median family size in Tonopah is 2.09 persons per family, with single female/mother families (51 | 15.6%) accounting for the largest median family size of 2.16 persons per family. On the other hand, single male/father families (23 | 7.1%) represent the smallest median family size with 1.91 persons per family.
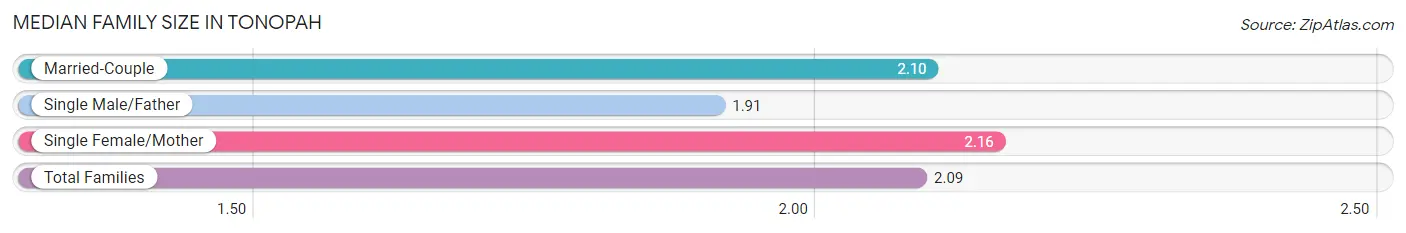
| Family Type | # Families | Family Size |
| Married-Couple | 252 (77.3%) | 2.10 |
| Single Male/Father | 23 (7.1%) | 1.91 |
| Single Female/Mother | 51 (15.6%) | 2.16 |
| Total Families | 326 (100.0%) | 2.09 |
Median Household Size in Tonopah
The median household size in Tonopah is 1.64 persons per household, with single male/father households (23 | 2.3%) accounting for the largest median household size of 3.09 persons per household. non-family households (680 | 67.6%) represent the smallest median household size with 1.33 persons per household.
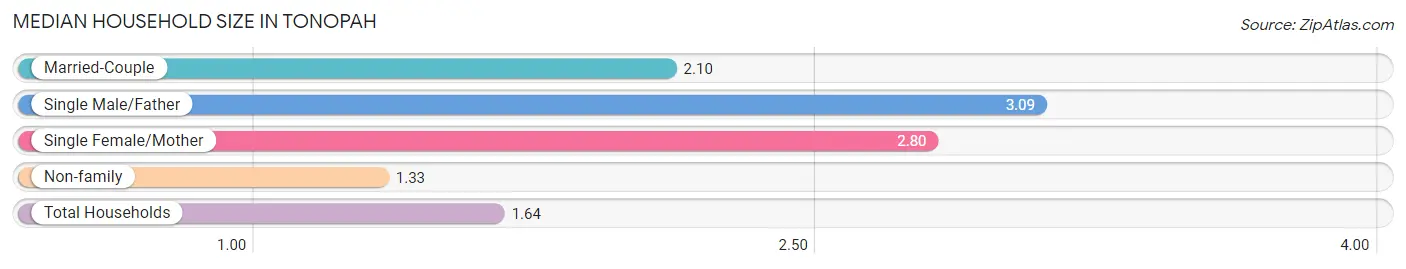
| Household Type | # Households | Household Size |
| Married-Couple | 252 (25.1%) | 2.10 |
| Single Male/Father | 23 (2.3%) | 3.09 |
| Single Female/Mother | 51 (5.1%) | 2.80 |
| Non-family | 680 (67.6%) | 1.33 |
| Total Households | 1,006 (100.0%) | 1.64 |
Household Size by Marriage Status in Tonopah
Out of a total of 1,006 households in Tonopah, 326 (32.4%) are family households, while 680 (67.6%) are nonfamily households. The most numerous type of family households are 2-person households, comprising 255, and the most common type of nonfamily households are 1-person households, comprising 437.
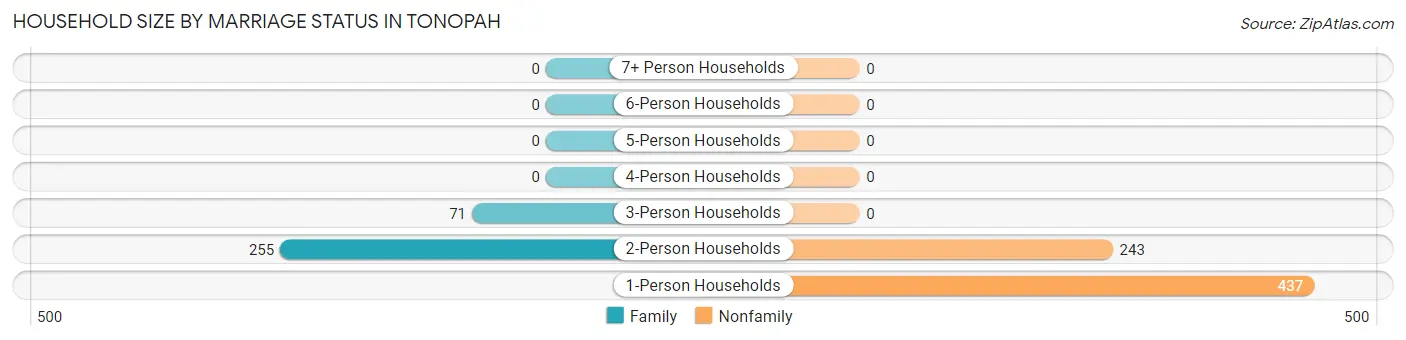
| Household Size | Family Households | Nonfamily Households |
| 1-Person Households | - | 437 (43.4%) |
| 2-Person Households | 255 (25.4%) | 243 (24.2%) |
| 3-Person Households | 71 (7.1%) | 0 (0.0%) |
| 4-Person Households | 0 (0.0%) | 0 (0.0%) |
| 5-Person Households | 0 (0.0%) | 0 (0.0%) |
| 6-Person Households | 0 (0.0%) | 0 (0.0%) |
| 7+ Person Households | 0 (0.0%) | 0 (0.0%) |
| Total | 326 (32.4%) | 680 (67.6%) |
Female Fertility in Tonopah
Fertility by Age in Tonopah
Average fertility rate in Tonopah is 288.0 births per 1,000 women. Women in the age bracket of 35 to 50 years have the highest fertility rate with 369.0 births per 1,000 women. Women in the age bracket of 35 to 50 years acount for 100.0% of all women with births.
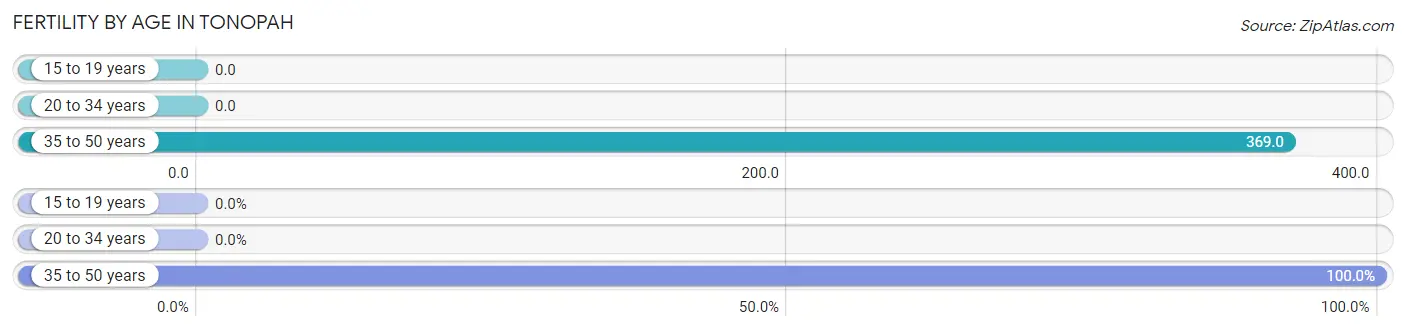
| Age Bracket | Women with Births | Births / 1,000 Women |
| 15 to 19 years | 0 (0.0%) | 0.0 |
| 20 to 34 years | 0 (0.0%) | 0.0 |
| 35 to 50 years | 59 (100.0%) | 369.0 |
| Total | 59 (100.0%) | 288.0 |
Fertility by Age by Marriage Status in Tonopah
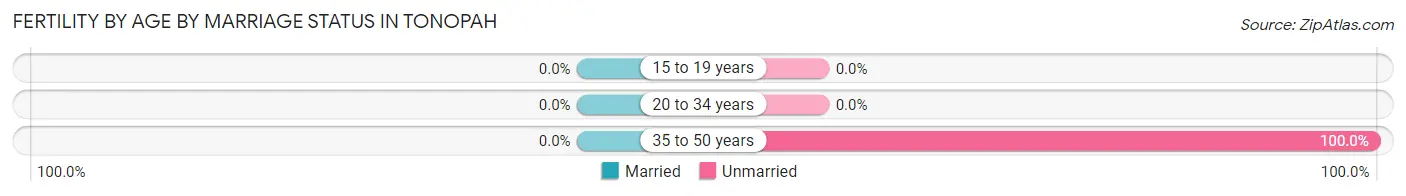
| Age Bracket | Married | Unmarried |
| 15 to 19 years | 0 (0.0%) | 0 (0.0%) |
| 20 to 34 years | 0 (0.0%) | 0 (0.0%) |
| 35 to 50 years | 0 (0.0%) | 59 (100.0%) |
| Total | 0 (0.0%) | 59 (100.0%) |
Fertility by Education in Tonopah
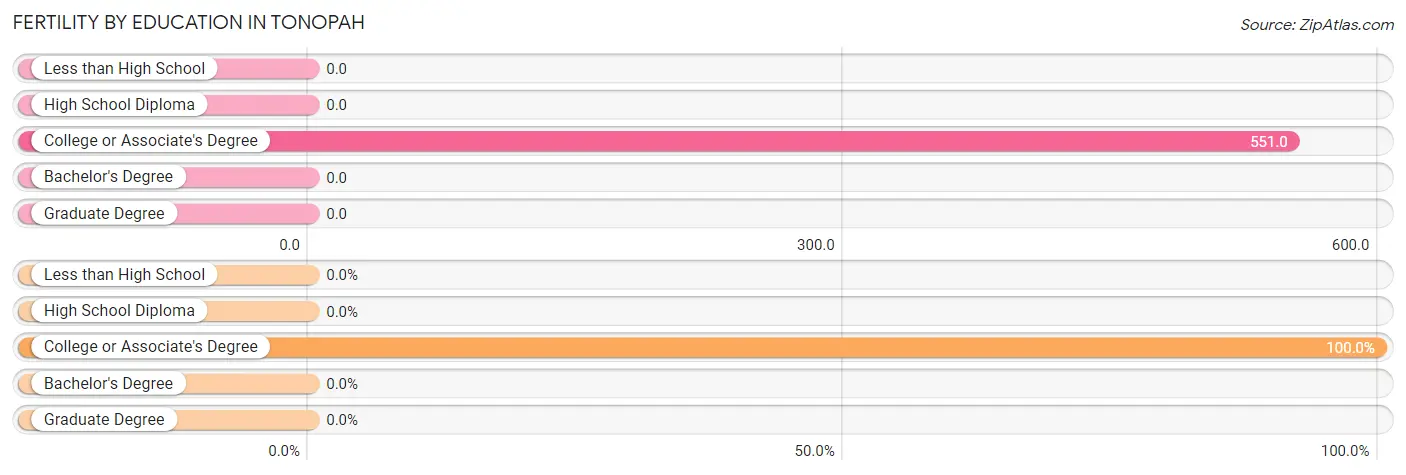
| Educational Attainment | Women with Births | Births / 1,000 Women |
| Less than High School | 0 (0.0%) | 0.0 |
| High School Diploma | 0 (0.0%) | 0.0 |
| College or Associate's Degree | 59 (100.0%) | 551.0 |
| Bachelor's Degree | 0 (0.0%) | 0.0 |
| Graduate Degree | 0 (0.0%) | 0.0 |
| Total | 59 (100.0%) | 288.0 |
Fertility by Education by Marriage Status in Tonopah
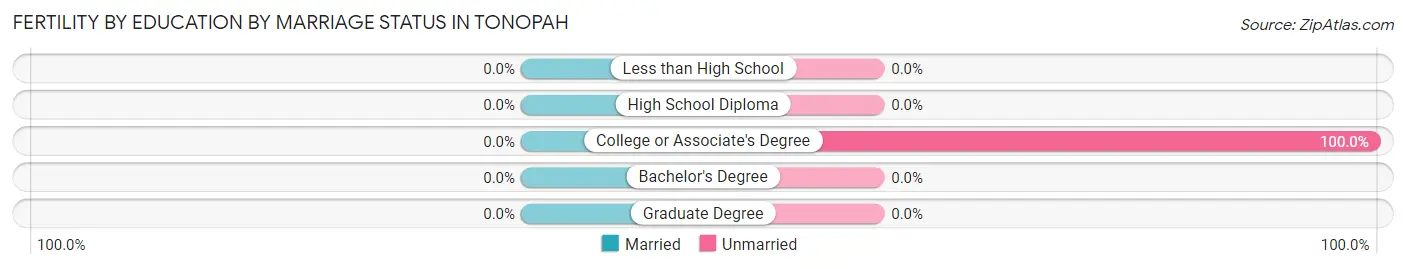
| Educational Attainment | Married | Unmarried |
| Less than High School | 0 (0.0%) | 0 (0.0%) |
| High School Diploma | 0 (0.0%) | 0 (0.0%) |
| College or Associate's Degree | 0 (0.0%) | 59 (100.0%) |
| Bachelor's Degree | 0 (0.0%) | 0 (0.0%) |
| Graduate Degree | 0 (0.0%) | 0 (0.0%) |
| Total | 0 (0.0%) | 59 (100.0%) |
Employment Characteristics in Tonopah
Employment by Class of Employer in Tonopah
Among the 740 employed individuals in Tonopah, private company employees (563 | 76.1%), local government employees (105 | 14.2%), and federal government employees (47 | 6.4%) make up the most common classes of employment.
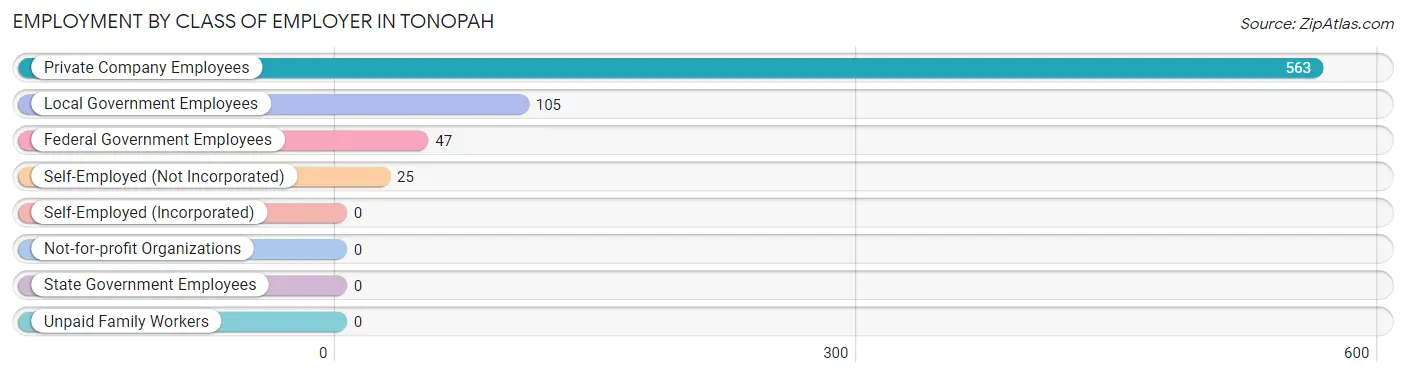
| Employer Class | # Employees | % Employees |
| Private Company Employees | 563 | 76.1% |
| Self-Employed (Incorporated) | 0 | 0.0% |
| Self-Employed (Not Incorporated) | 25 | 3.4% |
| Not-for-profit Organizations | 0 | 0.0% |
| Local Government Employees | 105 | 14.2% |
| State Government Employees | 0 | 0.0% |
| Federal Government Employees | 47 | 6.4% |
| Unpaid Family Workers | 0 | 0.0% |
| Total | 740 | 100.0% |
Employment Status by Age in Tonopah
According to the labor force statistics for Tonopah, out of the total population over 16 years of age (1,706), 44.7% or 763 individuals are in the labor force, with 3.0% or 23 of them unemployed. The age group with the highest labor force participation rate is 35 to 44 years, with 94.0% or 264 individuals in the labor force. Within the labor force, the 30 to 34 years age range has the highest percentage of unemployed individuals, with 40.4% or 23 of them being unemployed.
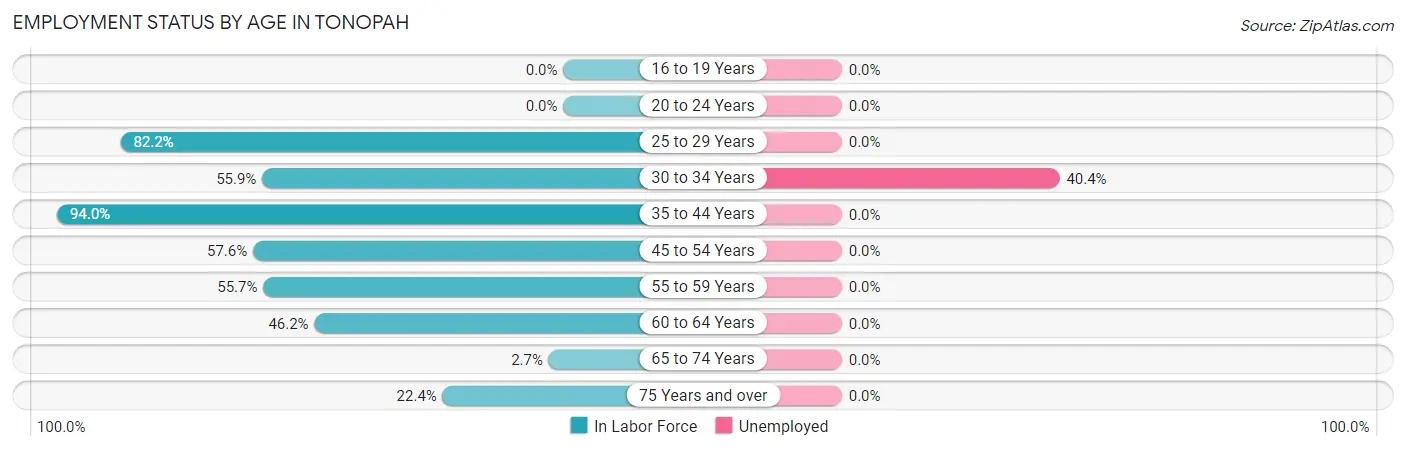
| Age Bracket | In Labor Force | Unemployed |
| 16 to 19 Years | 0 (0.0%) | 0 (0.0%) |
| 20 to 24 Years | 0 (0.0%) | 0 (0.0%) |
| 25 to 29 Years | 106 (82.2%) | 0 (0.0%) |
| 30 to 34 Years | 57 (55.9%) | 23 (40.4%) |
| 35 to 44 Years | 264 (94.0%) | 0 (0.0%) |
| 45 to 54 Years | 137 (57.6%) | 0 (0.0%) |
| 55 to 59 Years | 59 (55.7%) | 0 (0.0%) |
| 60 to 64 Years | 80 (46.2%) | 0 (0.0%) |
| 65 to 74 Years | 12 (2.7%) | 0 (0.0%) |
| 75 Years and over | 48 (22.4%) | 0 (0.0%) |
| Total | 763 (44.7%) | 23 (3.0%) |
Employment Status by Educational Attainment in Tonopah
According to labor force statistics for Tonopah, 68.3% of individuals (703) out of the total population between 25 and 64 years of age (1,029) are in the labor force, with 3.3% or 23 of them being unemployed. The group with the highest labor force participation rate are those with the educational attainment of college / associate degree, with 75.5% or 346 individuals in the labor force. Within the labor force, individuals with less than high school education have the highest percentage of unemployment, with 100.0% or 23 of them being unemployed.
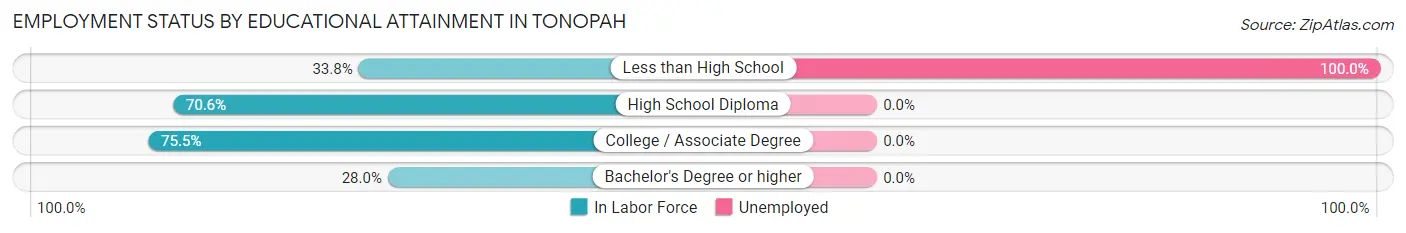
| Educational Attainment | In Labor Force | Unemployed |
| Less than High School | 23 (33.8%) | 68 (100.0%) |
| High School Diploma | 320 (70.6%) | 0 (0.0%) |
| College / Associate Degree | 346 (75.5%) | 0 (0.0%) |
| Bachelor's Degree or higher | 14 (28.0%) | 0 (0.0%) |
| Total | 703 (68.3%) | 34 (3.3%) |
Employment Occupations by Sex in Tonopah
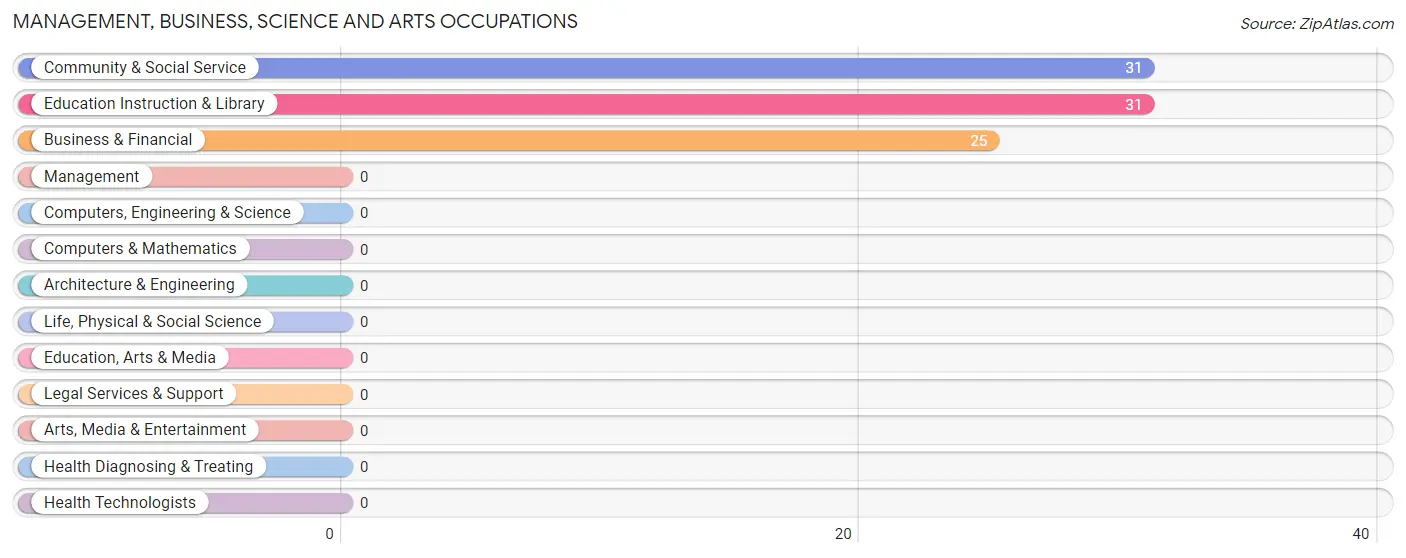
Management, Business, Science and Arts Occupations
The most common Management, Business, Science and Arts occupations in Tonopah are Community & Social Service (31 | 4.2%), Education Instruction & Library (31 | 4.2%), and Business & Financial (25 | 3.4%).
Management, Business, Science and Arts Occupations by Sex
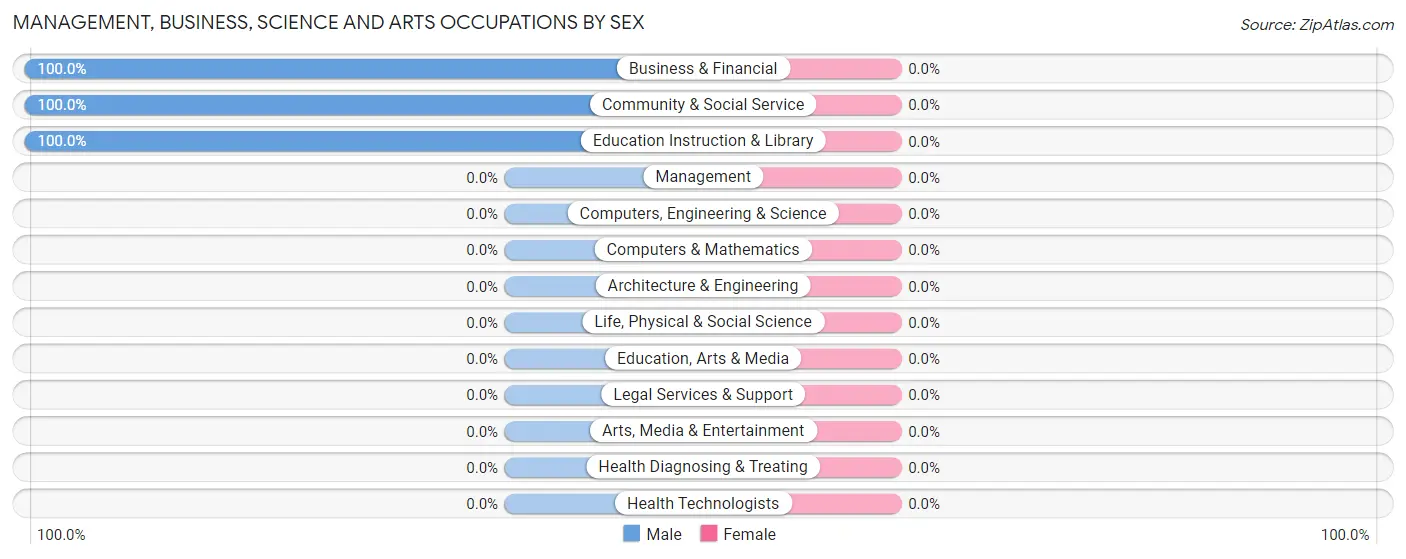
| Occupation | Male | Female |
| Management | 0 (0.0%) | 0 (0.0%) |
| Business & Financial | 25 (100.0%) | 0 (0.0%) |
| Computers, Engineering & Science | 0 (0.0%) | 0 (0.0%) |
| Computers & Mathematics | 0 (0.0%) | 0 (0.0%) |
| Architecture & Engineering | 0 (0.0%) | 0 (0.0%) |
| Life, Physical & Social Science | 0 (0.0%) | 0 (0.0%) |
| Community & Social Service | 31 (100.0%) | 0 (0.0%) |
| Education, Arts & Media | 0 (0.0%) | 0 (0.0%) |
| Legal Services & Support | 0 (0.0%) | 0 (0.0%) |
| Education Instruction & Library | 31 (100.0%) | 0 (0.0%) |
| Arts, Media & Entertainment | 0 (0.0%) | 0 (0.0%) |
| Health Diagnosing & Treating | 0 (0.0%) | 0 (0.0%) |
| Health Technologists | 0 (0.0%) | 0 (0.0%) |
| Total (Category) | 56 (100.0%) | 0 (0.0%) |
| Total (Overall) | 393 (53.1%) | 347 (46.9%) |
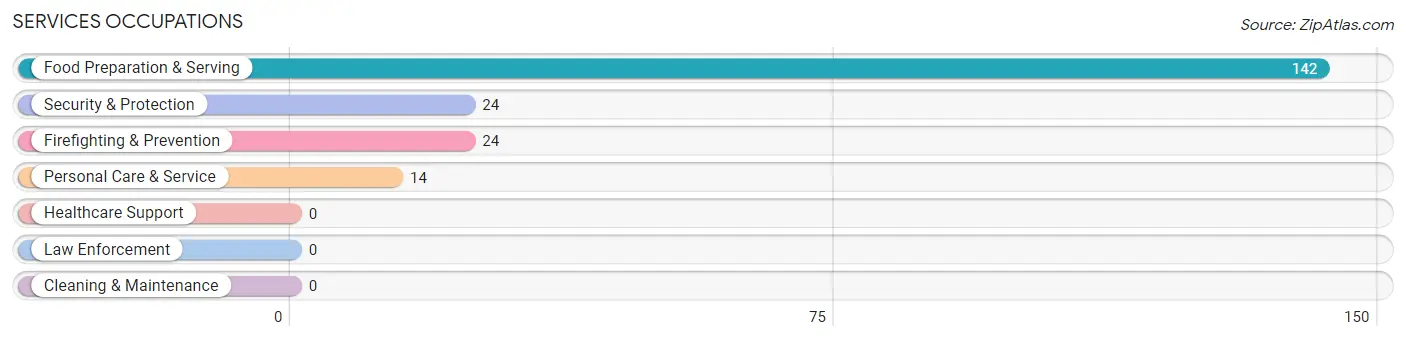
Services Occupations
The most common Services occupations in Tonopah are Food Preparation & Serving (142 | 19.2%), Security & Protection (24 | 3.2%), Firefighting & Prevention (24 | 3.2%), and Personal Care & Service (14 | 1.9%).
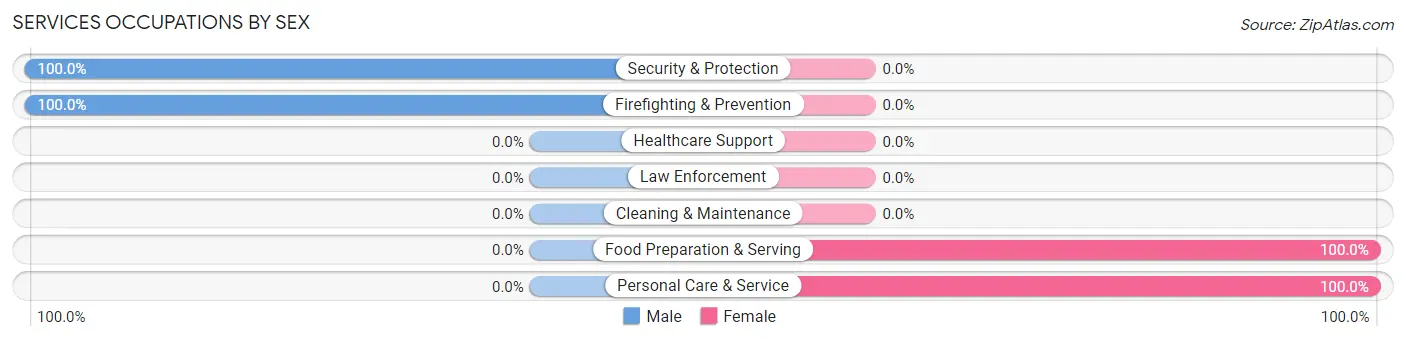
Services Occupations by Sex
Within the Services occupations in Tonopah, the most male-oriented occupations are Security & Protection (100.0%), and Firefighting & Prevention (100.0%), while the most female-oriented occupations are Food Preparation & Serving (100.0%), and Personal Care & Service (100.0%).
| Occupation | Male | Female |
| Healthcare Support | 0 (0.0%) | 0 (0.0%) |
| Security & Protection | 24 (100.0%) | 0 (0.0%) |
| Firefighting & Prevention | 24 (100.0%) | 0 (0.0%) |
| Law Enforcement | 0 (0.0%) | 0 (0.0%) |
| Food Preparation & Serving | 0 (0.0%) | 142 (100.0%) |
| Cleaning & Maintenance | 0 (0.0%) | 0 (0.0%) |
| Personal Care & Service | 0 (0.0%) | 14 (100.0%) |
| Total (Category) | 24 (13.3%) | 156 (86.7%) |
| Total (Overall) | 393 (53.1%) | 347 (46.9%) |
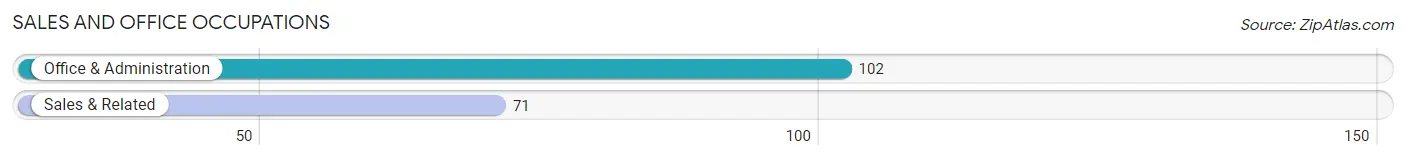
Sales and Office Occupations
The most common Sales and Office occupations in Tonopah are Office & Administration (102 | 13.8%), and Sales & Related (71 | 9.6%).
Sales and Office Occupations by Sex
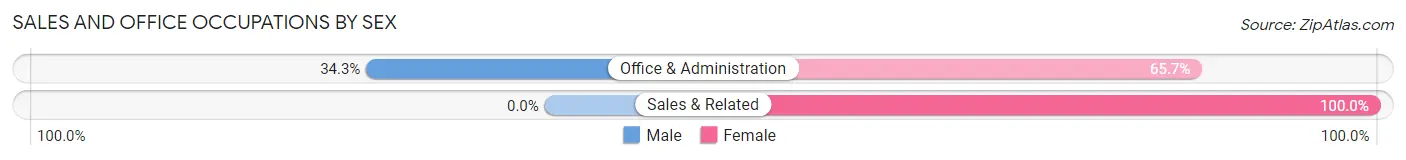
| Occupation | Male | Female |
| Sales & Related | 0 (0.0%) | 71 (100.0%) |
| Office & Administration | 35 (34.3%) | 67 (65.7%) |
| Total (Category) | 35 (20.2%) | 138 (79.8%) |
| Total (Overall) | 393 (53.1%) | 347 (46.9%) |
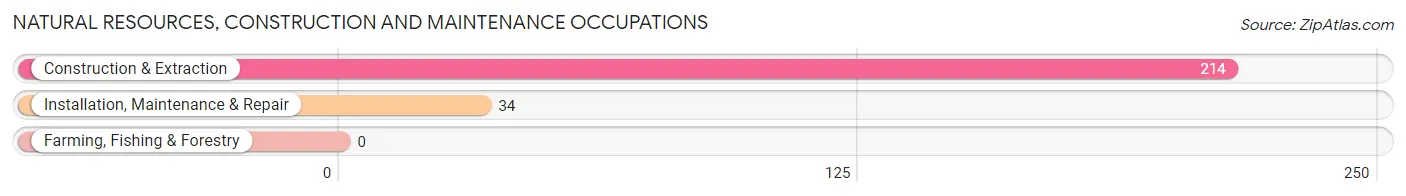
Natural Resources, Construction and Maintenance Occupations
The most common Natural Resources, Construction and Maintenance occupations in Tonopah are Construction & Extraction (214 | 28.9%), and Installation, Maintenance & Repair (34 | 4.6%).
Natural Resources, Construction and Maintenance Occupations by Sex
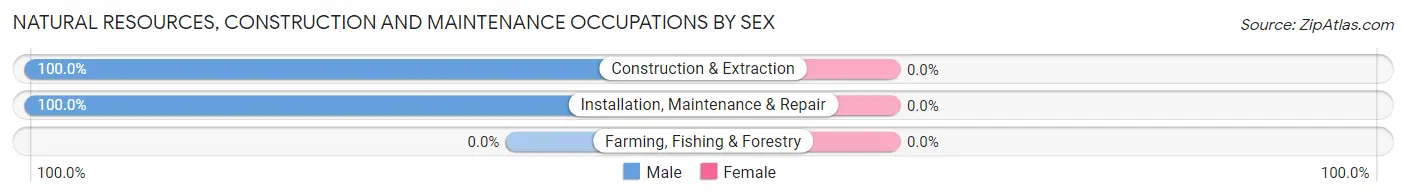
| Occupation | Male | Female |
| Farming, Fishing & Forestry | 0 (0.0%) | 0 (0.0%) |
| Construction & Extraction | 214 (100.0%) | 0 (0.0%) |
| Installation, Maintenance & Repair | 34 (100.0%) | 0 (0.0%) |
| Total (Category) | 248 (100.0%) | 0 (0.0%) |
| Total (Overall) | 393 (53.1%) | 347 (46.9%) |
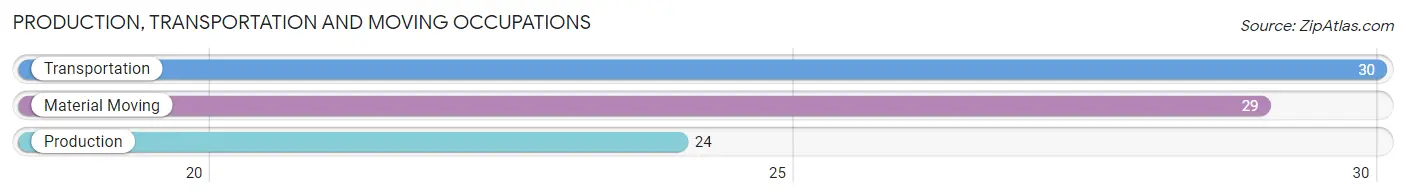
Production, Transportation and Moving Occupations
The most common Production, Transportation and Moving occupations in Tonopah are Transportation (30 | 4.1%), Material Moving (29 | 3.9%), and Production (24 | 3.2%).
Production, Transportation and Moving Occupations by Sex
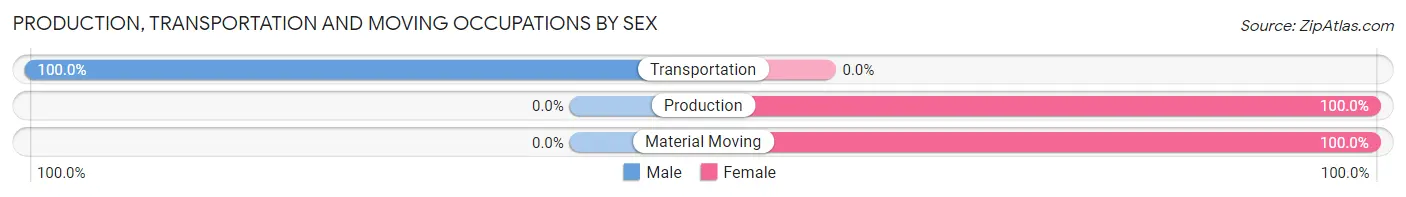
| Occupation | Male | Female |
| Production | 0 (0.0%) | 24 (100.0%) |
| Transportation | 30 (100.0%) | 0 (0.0%) |
| Material Moving | 0 (0.0%) | 29 (100.0%) |
| Total (Category) | 30 (36.1%) | 53 (63.9%) |
| Total (Overall) | 393 (53.1%) | 347 (46.9%) |
Employment Industries by Sex in Tonopah
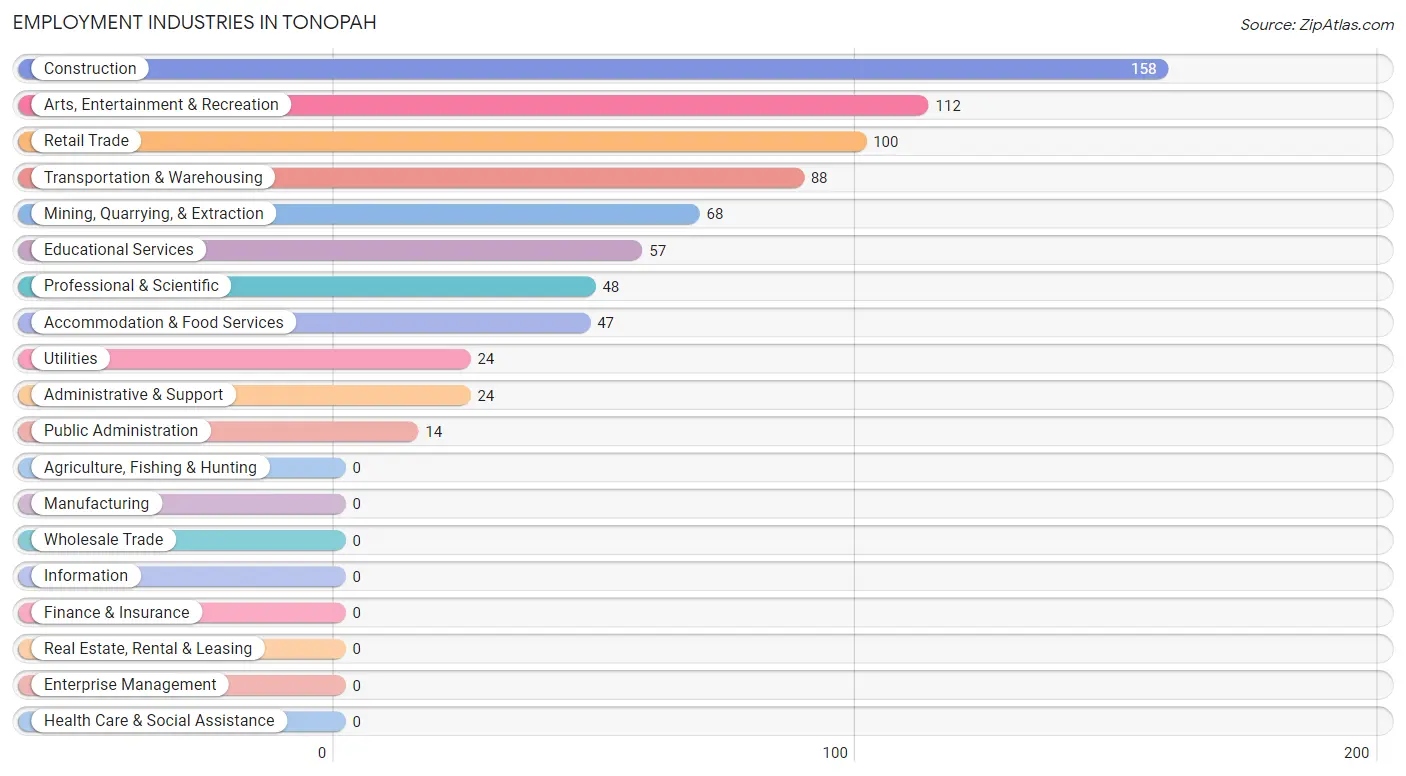
Employment Industries in Tonopah
The major employment industries in Tonopah include Construction (158 | 21.3%), Arts, Entertainment & Recreation (112 | 15.1%), Retail Trade (100 | 13.5%), Transportation & Warehousing (88 | 11.9%), and Mining, Quarrying, & Extraction (68 | 9.2%).
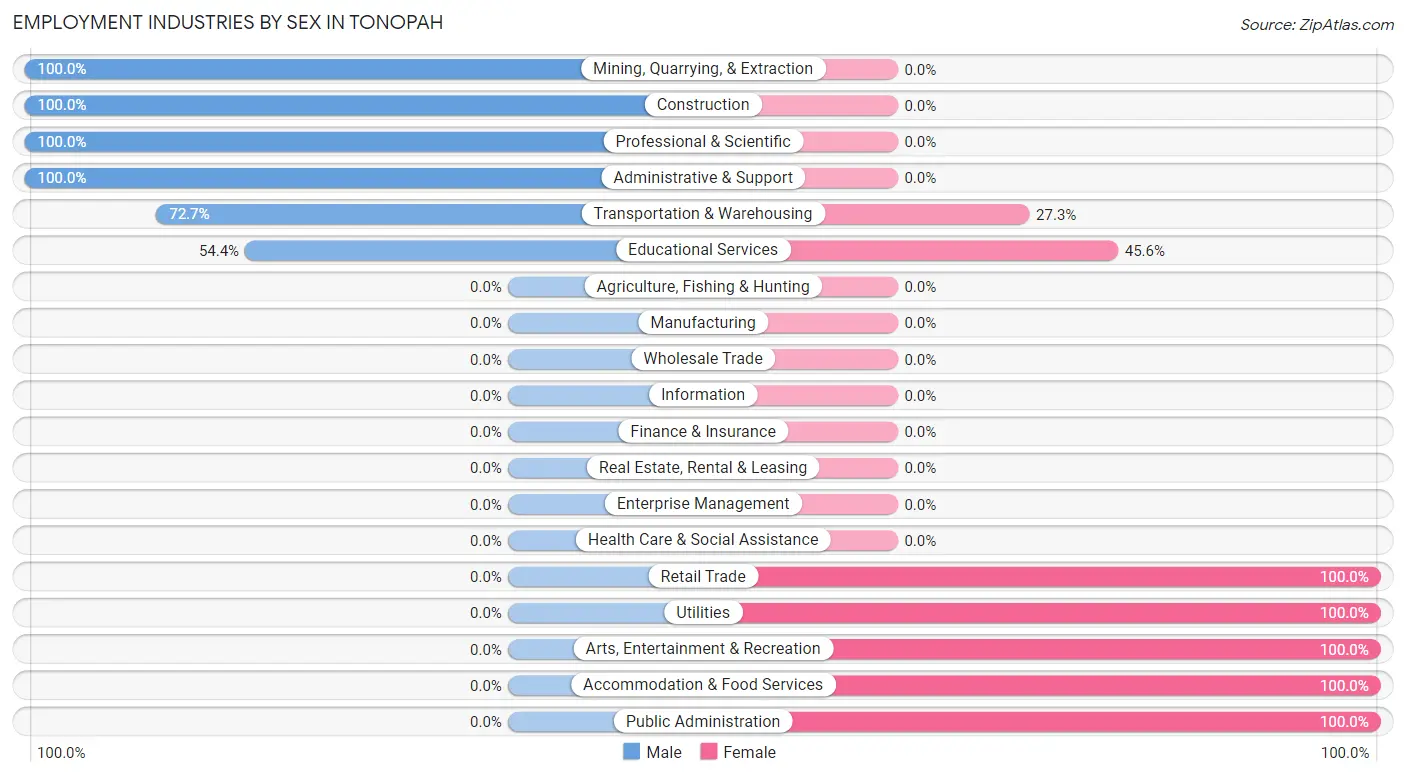
Employment Industries by Sex in Tonopah
The Tonopah industries that see more men than women are Mining, Quarrying, & Extraction (100.0%), Construction (100.0%), and Professional & Scientific (100.0%), whereas the industries that tend to have a higher number of women are Retail Trade (100.0%), Utilities (100.0%), and Arts, Entertainment & Recreation (100.0%).
| Industry | Male | Female |
| Agriculture, Fishing & Hunting | 0 (0.0%) | 0 (0.0%) |
| Mining, Quarrying, & Extraction | 68 (100.0%) | 0 (0.0%) |
| Construction | 158 (100.0%) | 0 (0.0%) |
| Manufacturing | 0 (0.0%) | 0 (0.0%) |
| Wholesale Trade | 0 (0.0%) | 0 (0.0%) |
| Retail Trade | 0 (0.0%) | 100 (100.0%) |
| Transportation & Warehousing | 64 (72.7%) | 24 (27.3%) |
| Utilities | 0 (0.0%) | 24 (100.0%) |
| Information | 0 (0.0%) | 0 (0.0%) |
| Finance & Insurance | 0 (0.0%) | 0 (0.0%) |
| Real Estate, Rental & Leasing | 0 (0.0%) | 0 (0.0%) |
| Professional & Scientific | 48 (100.0%) | 0 (0.0%) |
| Enterprise Management | 0 (0.0%) | 0 (0.0%) |
| Administrative & Support | 24 (100.0%) | 0 (0.0%) |
| Educational Services | 31 (54.4%) | 26 (45.6%) |
| Health Care & Social Assistance | 0 (0.0%) | 0 (0.0%) |
| Arts, Entertainment & Recreation | 0 (0.0%) | 112 (100.0%) |
| Accommodation & Food Services | 0 (0.0%) | 47 (100.0%) |
| Public Administration | 0 (0.0%) | 14 (100.0%) |
| Total | 393 (53.1%) | 347 (46.9%) |
Education in Tonopah
School Enrollment in Tonopah
The most common levels of schooling among the 68 students in Tonopah are middle school (50 | 73.5%), college / undergraduate (11 | 16.2%), and high school (7 | 10.3%).
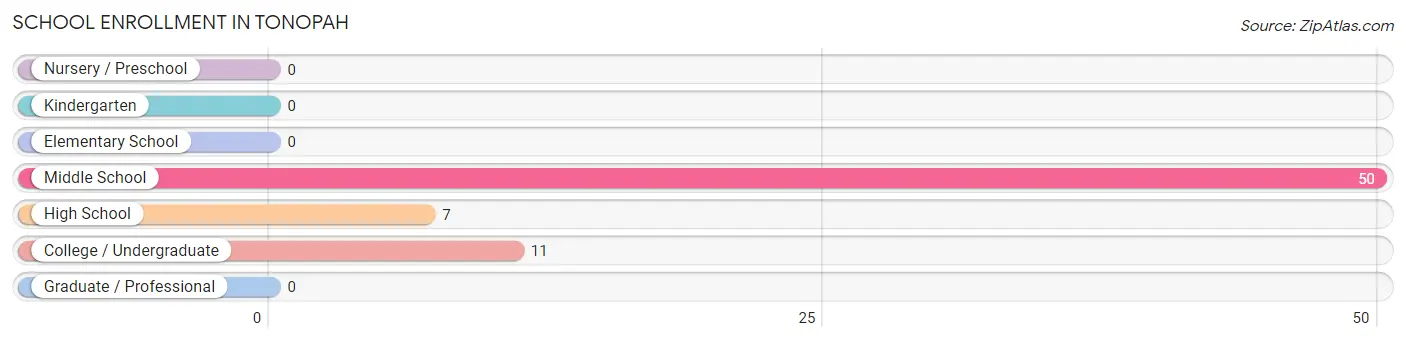
| School Level | # Students | % Students |
| Nursery / Preschool | 0 | 0.0% |
| Kindergarten | 0 | 0.0% |
| Elementary School | 0 | 0.0% |
| Middle School | 50 | 73.5% |
| High School | 7 | 10.3% |
| College / Undergraduate | 11 | 16.2% |
| Graduate / Professional | 0 | 0.0% |
| Total | 68 | 100.0% |
School Enrollment by Age by Funding Source in Tonopah
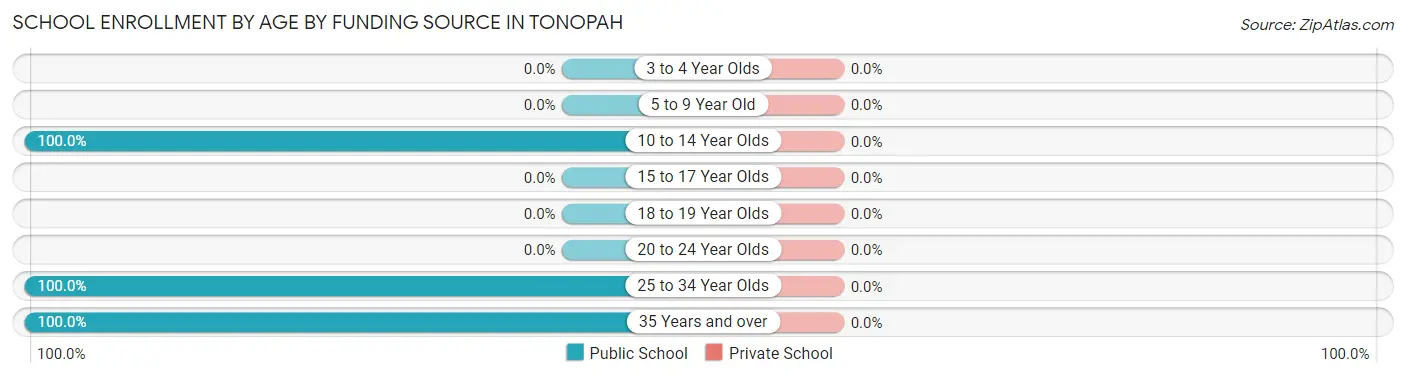
| Age Bracket | Public School | Private School |
| 3 to 4 Year Olds | 0 (0.0%) | 0 (0.0%) |
| 5 to 9 Year Old | 0 (0.0%) | 0 (0.0%) |
| 10 to 14 Year Olds | 50 (100.0%) | 0 (0.0%) |
| 15 to 17 Year Olds | 0 (0.0%) | 0 (0.0%) |
| 18 to 19 Year Olds | 0 (0.0%) | 0 (0.0%) |
| 20 to 24 Year Olds | 0 (0.0%) | 0 (0.0%) |
| 25 to 34 Year Olds | 9 (100.0%) | 0 (0.0%) |
| 35 Years and over | 9 (100.0%) | 0 (0.0%) |
| Total | 68 (100.0%) | 0 (0.0%) |
Educational Attainment by Field of Study in Tonopah
Literature & languages (73 | 29.9%), education (42 | 17.2%), arts & humanities (36 | 14.7%), business (31 | 12.7%), and bio, nature & agricultural (28 | 11.5%) are the most common fields of study among 244 individuals in Tonopah who have obtained a bachelor's degree or higher.
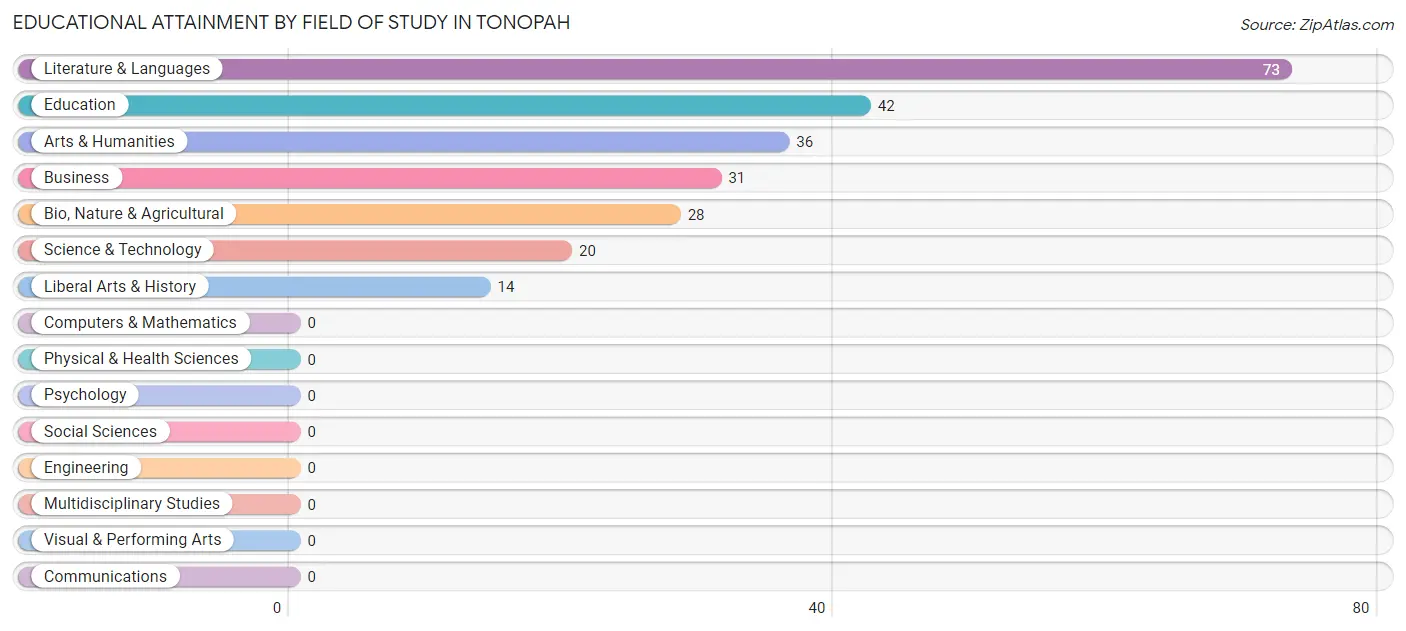
| Field of Study | # Graduates | % Graduates |
| Computers & Mathematics | 0 | 0.0% |
| Bio, Nature & Agricultural | 28 | 11.5% |
| Physical & Health Sciences | 0 | 0.0% |
| Psychology | 0 | 0.0% |
| Social Sciences | 0 | 0.0% |
| Engineering | 0 | 0.0% |
| Multidisciplinary Studies | 0 | 0.0% |
| Science & Technology | 20 | 8.2% |
| Business | 31 | 12.7% |
| Education | 42 | 17.2% |
| Literature & Languages | 73 | 29.9% |
| Liberal Arts & History | 14 | 5.7% |
| Visual & Performing Arts | 0 | 0.0% |
| Communications | 0 | 0.0% |
| Arts & Humanities | 36 | 14.7% |
| Total | 244 | 100.0% |
Transportation & Commute in Tonopah
Vehicle Availability by Sex in Tonopah
The most prevalent vehicle ownership categories in Tonopah are males with 3 vehicles (124, accounting for 31.6%) and females with 3 vehicles (88, making up 35.7%).
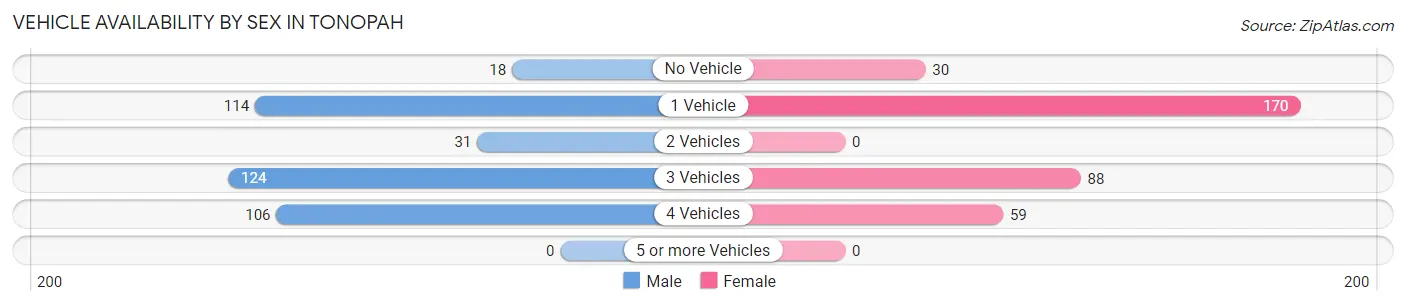
| Vehicles Available | Male | Female |
| No Vehicle | 18 (4.6%) | 30 (8.6%) |
| 1 Vehicle | 114 (29.0%) | 170 (49.0%) |
| 2 Vehicles | 31 (7.9%) | 0 (0.0%) |
| 3 Vehicles | 124 (31.6%) | 88 (25.4%) |
| 4 Vehicles | 106 (27.0%) | 59 (17.0%) |
| 5 or more Vehicles | 0 (0.0%) | 0 (0.0%) |
| Total | 393 (100.0%) | 347 (100.0%) |
Commute Time in Tonopah
The most frequently occuring commute durations in Tonopah are 10 to 14 minutes (206 commuters, 30.1%), 60 to 89 minutes (169 commuters, 24.7%), and 5 to 9 minutes (110 commuters, 16.1%).
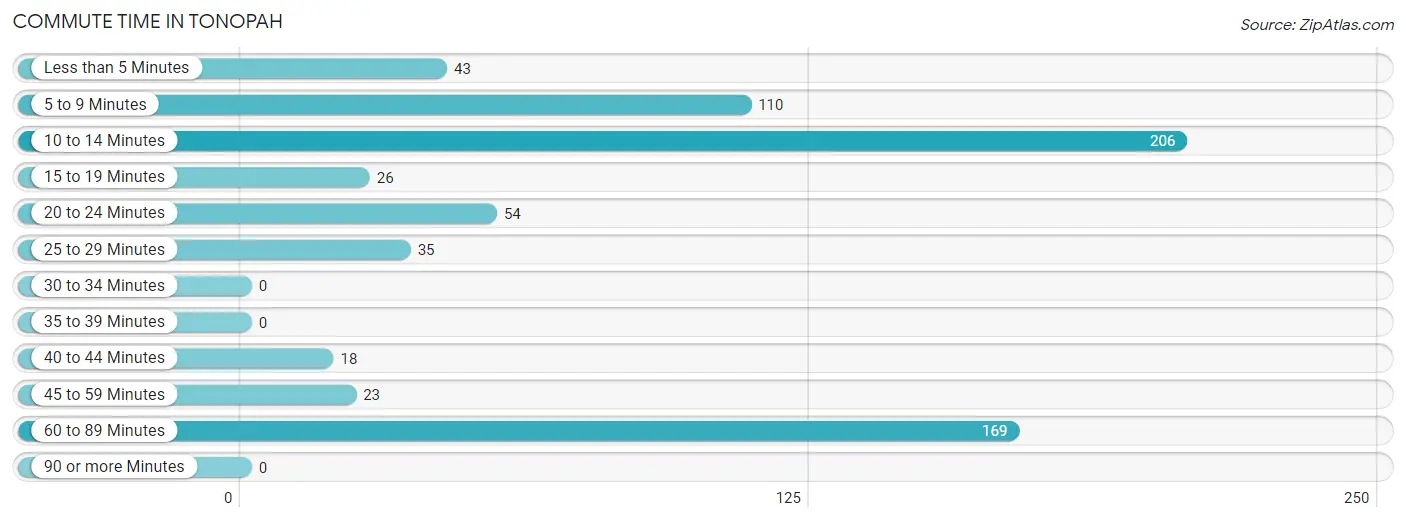
| Commute Time | # Commuters | % Commuters |
| Less than 5 Minutes | 43 | 6.3% |
| 5 to 9 Minutes | 110 | 16.1% |
| 10 to 14 Minutes | 206 | 30.1% |
| 15 to 19 Minutes | 26 | 3.8% |
| 20 to 24 Minutes | 54 | 7.9% |
| 25 to 29 Minutes | 35 | 5.1% |
| 30 to 34 Minutes | 0 | 0.0% |
| 35 to 39 Minutes | 0 | 0.0% |
| 40 to 44 Minutes | 18 | 2.6% |
| 45 to 59 Minutes | 23 | 3.4% |
| 60 to 89 Minutes | 169 | 24.7% |
| 90 or more Minutes | 0 | 0.0% |
Commute Time by Sex in Tonopah
The most common commute times in Tonopah are 10 to 14 minutes (170 commuters, 50.4%) for males and 60 to 89 minutes (112 commuters, 32.3%) for females.
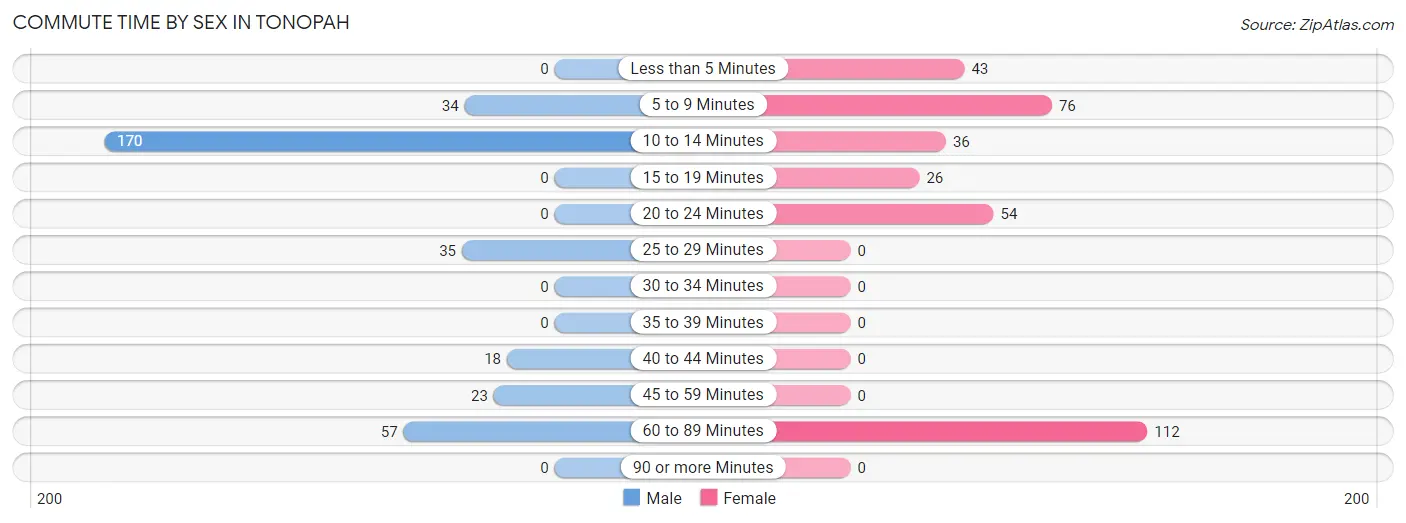
| Commute Time | Male | Female |
| Less than 5 Minutes | 0 (0.0%) | 43 (12.4%) |
| 5 to 9 Minutes | 34 (10.1%) | 76 (21.9%) |
| 10 to 14 Minutes | 170 (50.4%) | 36 (10.4%) |
| 15 to 19 Minutes | 0 (0.0%) | 26 (7.5%) |
| 20 to 24 Minutes | 0 (0.0%) | 54 (15.6%) |
| 25 to 29 Minutes | 35 (10.4%) | 0 (0.0%) |
| 30 to 34 Minutes | 0 (0.0%) | 0 (0.0%) |
| 35 to 39 Minutes | 0 (0.0%) | 0 (0.0%) |
| 40 to 44 Minutes | 18 (5.3%) | 0 (0.0%) |
| 45 to 59 Minutes | 23 (6.8%) | 0 (0.0%) |
| 60 to 89 Minutes | 57 (16.9%) | 112 (32.3%) |
| 90 or more Minutes | 0 (0.0%) | 0 (0.0%) |
Time of Departure to Work by Sex in Tonopah
The most frequent times of departure to work in Tonopah are 5:30 AM to 5:59 AM (139, 41.2%) for males and 8:30 AM to 8:59 AM (112, 32.3%) for females.
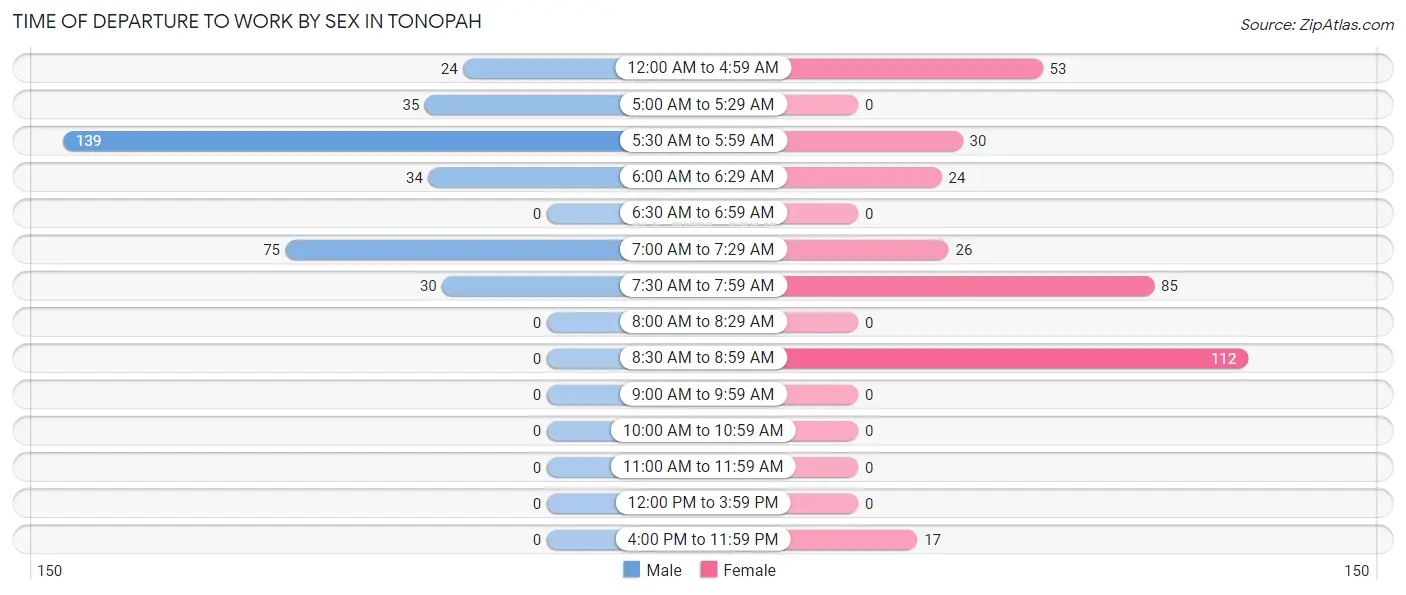
| Time of Departure | Male | Female |
| 12:00 AM to 4:59 AM | 24 (7.1%) | 53 (15.3%) |
| 5:00 AM to 5:29 AM | 35 (10.4%) | 0 (0.0%) |
| 5:30 AM to 5:59 AM | 139 (41.2%) | 30 (8.6%) |
| 6:00 AM to 6:29 AM | 34 (10.1%) | 24 (6.9%) |
| 6:30 AM to 6:59 AM | 0 (0.0%) | 0 (0.0%) |
| 7:00 AM to 7:29 AM | 75 (22.3%) | 26 (7.5%) |
| 7:30 AM to 7:59 AM | 30 (8.9%) | 85 (24.5%) |
| 8:00 AM to 8:29 AM | 0 (0.0%) | 0 (0.0%) |
| 8:30 AM to 8:59 AM | 0 (0.0%) | 112 (32.3%) |
| 9:00 AM to 9:59 AM | 0 (0.0%) | 0 (0.0%) |
| 10:00 AM to 10:59 AM | 0 (0.0%) | 0 (0.0%) |
| 11:00 AM to 11:59 AM | 0 (0.0%) | 0 (0.0%) |
| 12:00 PM to 3:59 PM | 0 (0.0%) | 0 (0.0%) |
| 4:00 PM to 11:59 PM | 0 (0.0%) | 17 (4.9%) |
| Total | 337 (100.0%) | 347 (100.0%) |
Housing Occupancy in Tonopah
Occupancy by Ownership in Tonopah
Of the total 1,006 dwellings in Tonopah, owner-occupied units account for 606 (60.2%), while renter-occupied units make up 400 (39.8%).
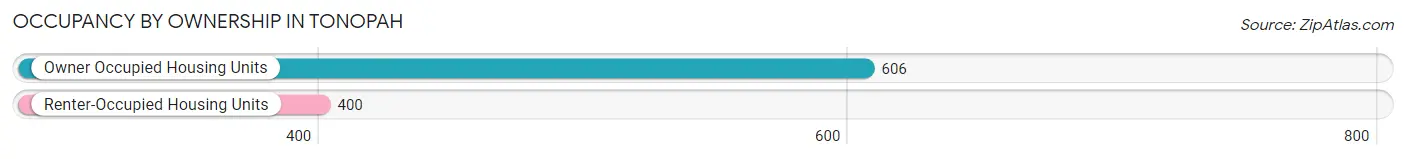
| Occupancy | # Housing Units | % Housing Units |
| Owner Occupied Housing Units | 606 | 60.2% |
| Renter-Occupied Housing Units | 400 | 39.8% |
| Total Occupied Housing Units | 1,006 | 100.0% |
Occupancy by Household Size in Tonopah
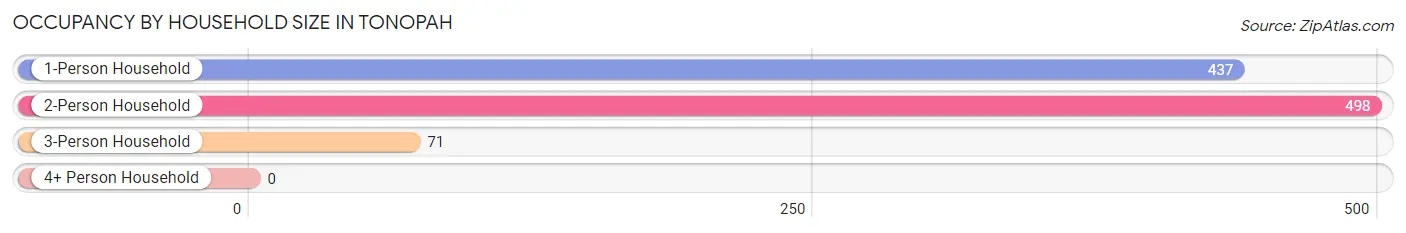
| Household Size | # Housing Units | % Housing Units |
| 1-Person Household | 437 | 43.4% |
| 2-Person Household | 498 | 49.5% |
| 3-Person Household | 71 | 7.1% |
| 4+ Person Household | 0 | 0.0% |
| Total Housing Units | 1,006 | 100.0% |
Occupancy by Ownership by Household Size in Tonopah
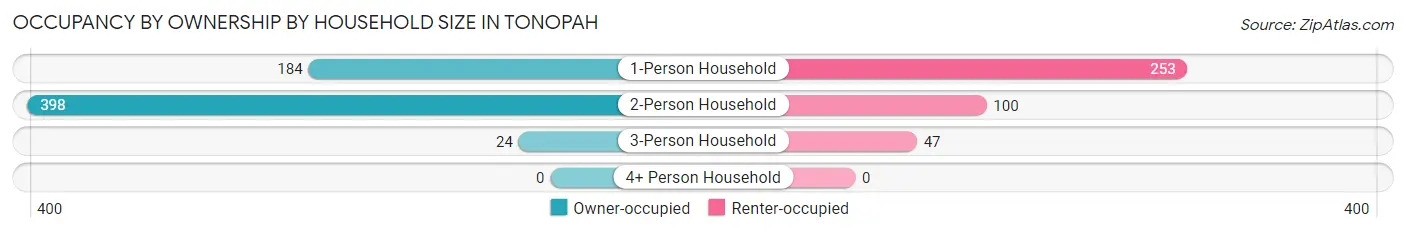
| Household Size | Owner-occupied | Renter-occupied |
| 1-Person Household | 184 (42.1%) | 253 (57.9%) |
| 2-Person Household | 398 (79.9%) | 100 (20.1%) |
| 3-Person Household | 24 (33.8%) | 47 (66.2%) |
| 4+ Person Household | 0 (0.0%) | 0 (0.0%) |
| Total Housing Units | 606 (60.2%) | 400 (39.8%) |
Occupancy by Educational Attainment in Tonopah
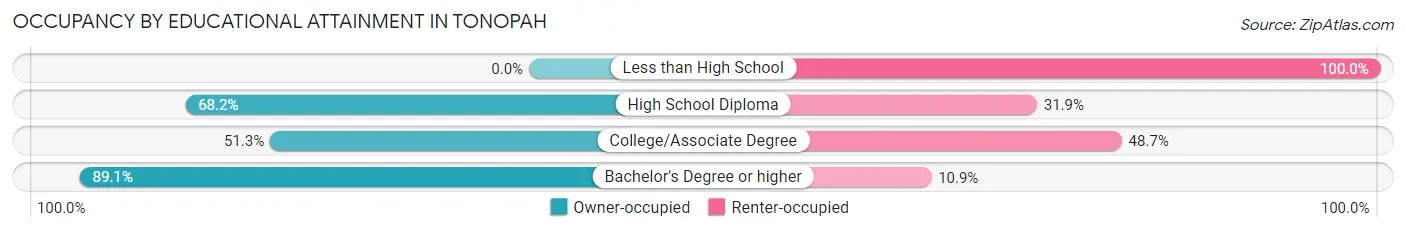
| Household Size | Owner-occupied | Renter-occupied |
| Less than High School | 0 (0.0%) | 39 (100.0%) |
| High School Diploma | 276 (68.1%) | 129 (31.9%) |
| College/Associate Degree | 232 (51.3%) | 220 (48.7%) |
| Bachelor's Degree or higher | 98 (89.1%) | 12 (10.9%) |
Occupancy by Age of Householder in Tonopah
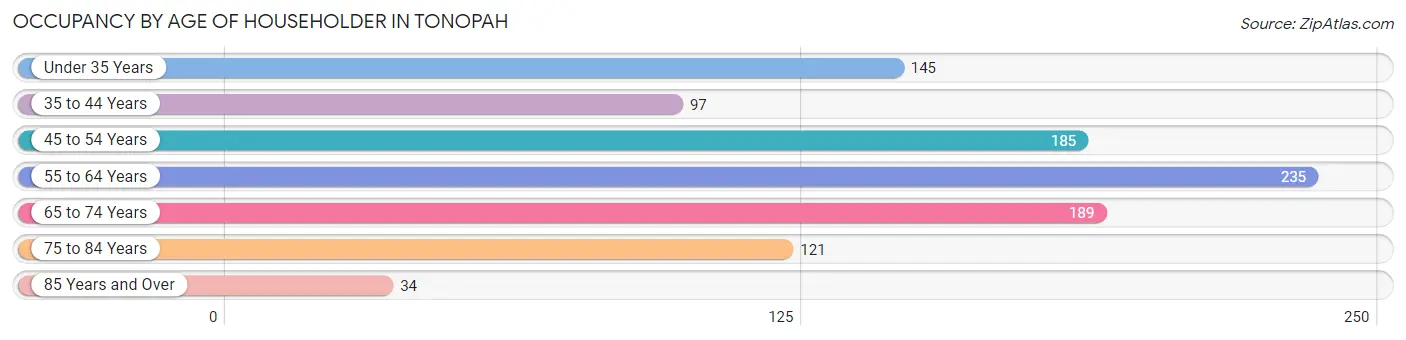
| Age Bracket | # Households | % Households |
| Under 35 Years | 145 | 14.4% |
| 35 to 44 Years | 97 | 9.6% |
| 45 to 54 Years | 185 | 18.4% |
| 55 to 64 Years | 235 | 23.4% |
| 65 to 74 Years | 189 | 18.8% |
| 75 to 84 Years | 121 | 12.0% |
| 85 Years and Over | 34 | 3.4% |
| Total | 1,006 | 100.0% |
Housing Finances in Tonopah
Median Income by Occupancy in Tonopah
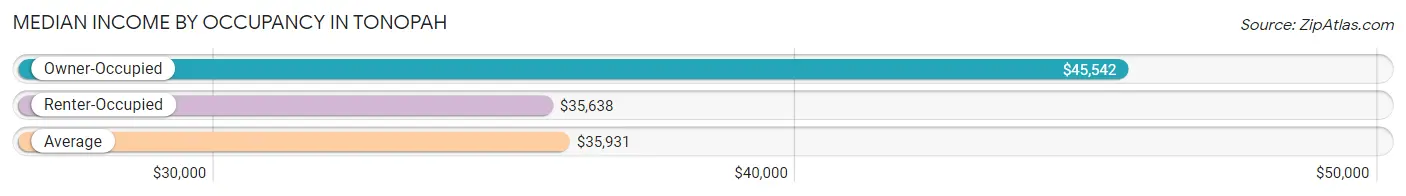
| Occupancy Type | # Households | Median Income |
| Owner-Occupied | 606 (60.2%) | $45,542 |
| Renter-Occupied | 400 (39.8%) | $35,638 |
| Average | 1,006 (100.0%) | $35,931 |
Occupancy by Householder Income Bracket in Tonopah
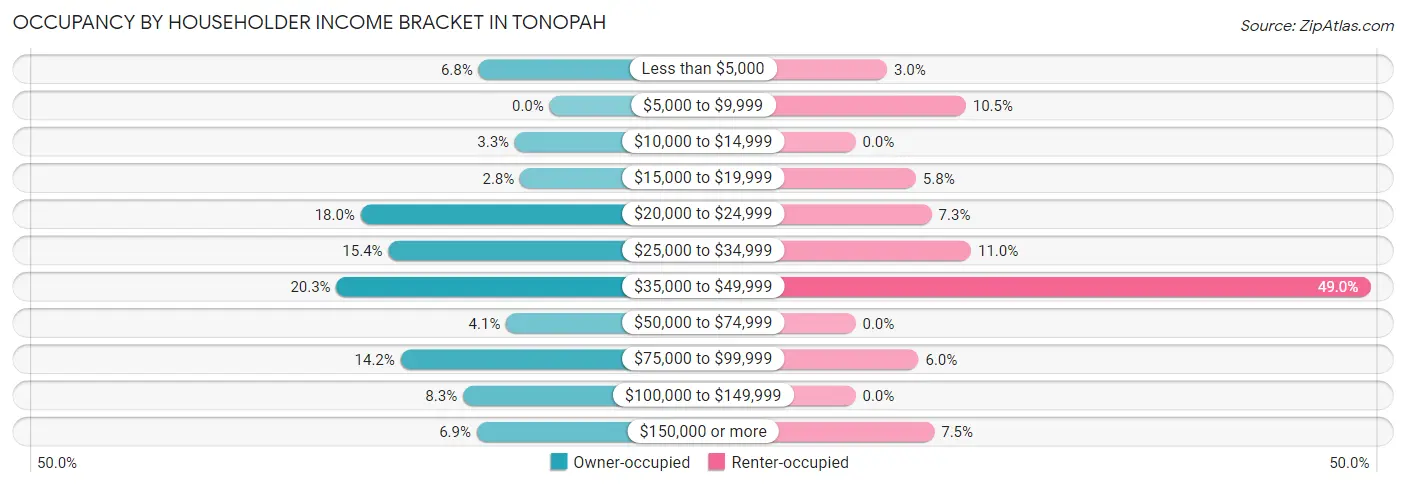
| Income Bracket | Owner-occupied | Renter-occupied |
| Less than $5,000 | 41 (6.8%) | 12 (3.0%) |
| $5,000 to $9,999 | 0 (0.0%) | 42 (10.5%) |
| $10,000 to $14,999 | 20 (3.3%) | 0 (0.0%) |
| $15,000 to $19,999 | 17 (2.8%) | 23 (5.8%) |
| $20,000 to $24,999 | 109 (18.0%) | 29 (7.2%) |
| $25,000 to $34,999 | 93 (15.3%) | 44 (11.0%) |
| $35,000 to $49,999 | 123 (20.3%) | 196 (49.0%) |
| $50,000 to $74,999 | 25 (4.1%) | 0 (0.0%) |
| $75,000 to $99,999 | 86 (14.2%) | 24 (6.0%) |
| $100,000 to $149,999 | 50 (8.3%) | 0 (0.0%) |
| $150,000 or more | 42 (6.9%) | 30 (7.5%) |
| Total | 606 (100.0%) | 400 (100.0%) |
Monthly Housing Cost Tiers in Tonopah
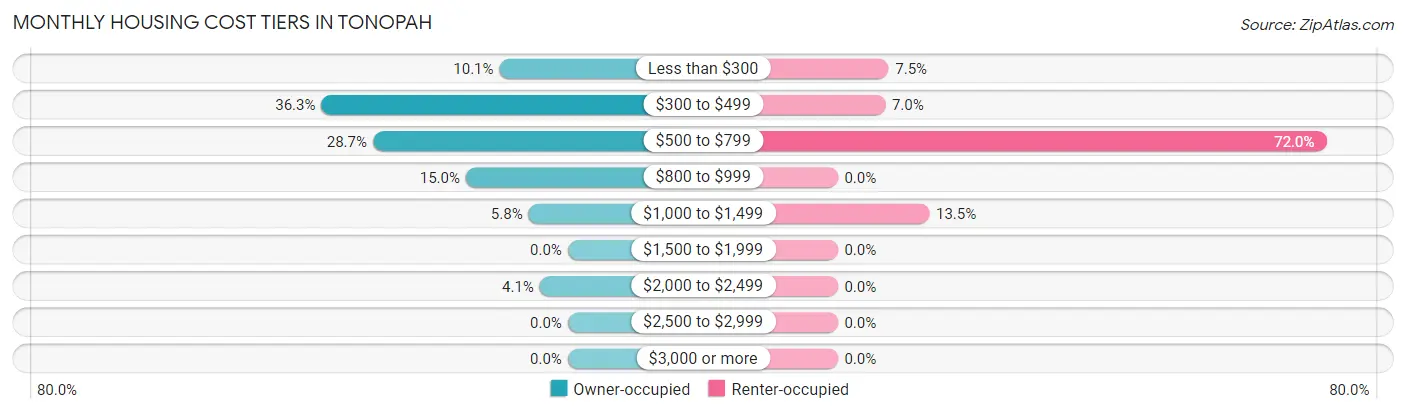
| Monthly Cost | Owner-occupied | Renter-occupied |
| Less than $300 | 61 (10.1%) | 30 (7.5%) |
| $300 to $499 | 220 (36.3%) | 28 (7.0%) |
| $500 to $799 | 174 (28.7%) | 288 (72.0%) |
| $800 to $999 | 91 (15.0%) | 0 (0.0%) |
| $1,000 to $1,499 | 35 (5.8%) | 54 (13.5%) |
| $1,500 to $1,999 | 0 (0.0%) | 0 (0.0%) |
| $2,000 to $2,499 | 25 (4.1%) | 0 (0.0%) |
| $2,500 to $2,999 | 0 (0.0%) | 0 (0.0%) |
| $3,000 or more | 0 (0.0%) | 0 (0.0%) |
| Total | 606 (100.0%) | 400 (100.0%) |
Physical Housing Characteristics in Tonopah
Housing Structures in Tonopah
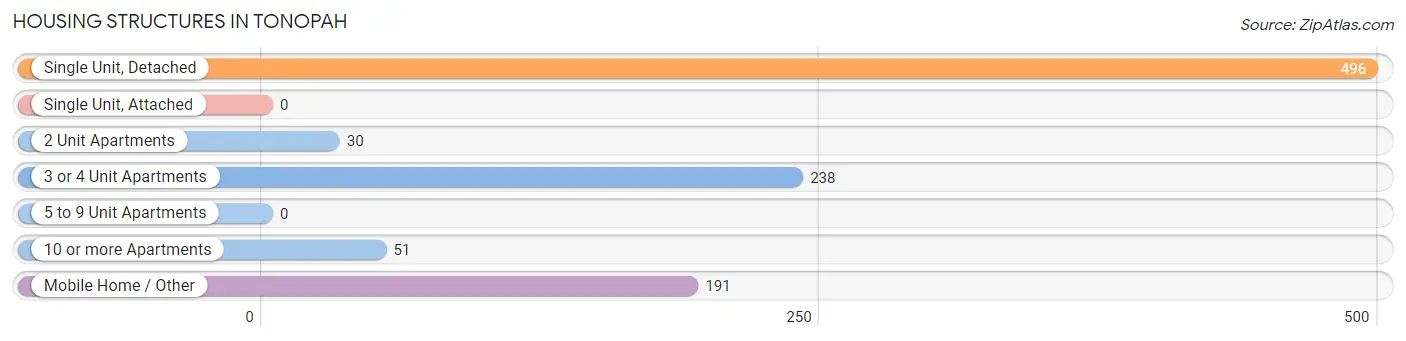
| Structure Type | # Housing Units | % Housing Units |
| Single Unit, Detached | 496 | 49.3% |
| Single Unit, Attached | 0 | 0.0% |
| 2 Unit Apartments | 30 | 3.0% |
| 3 or 4 Unit Apartments | 238 | 23.7% |
| 5 to 9 Unit Apartments | 0 | 0.0% |
| 10 or more Apartments | 51 | 5.1% |
| Mobile Home / Other | 191 | 19.0% |
| Total | 1,006 | 100.0% |
Housing Structures by Occupancy in Tonopah
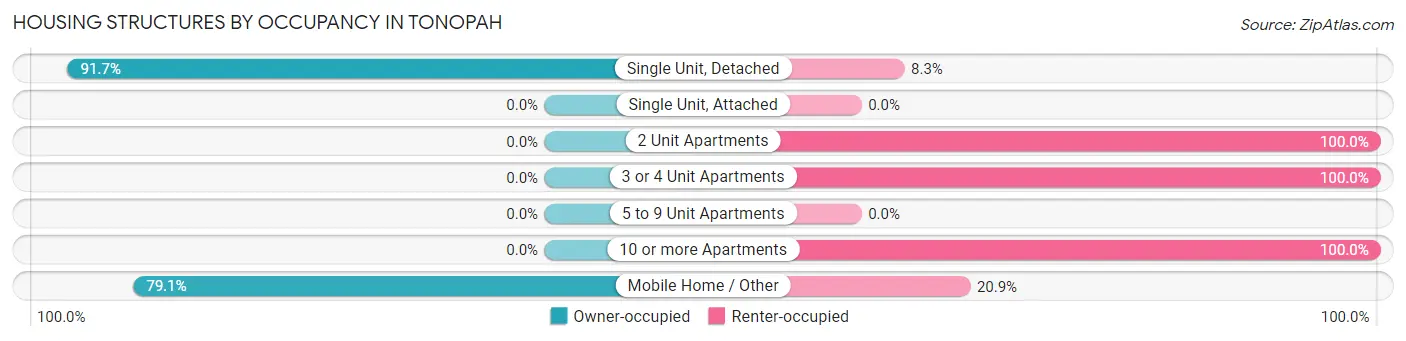
| Structure Type | Owner-occupied | Renter-occupied |
| Single Unit, Detached | 455 (91.7%) | 41 (8.3%) |
| Single Unit, Attached | 0 (0.0%) | 0 (0.0%) |
| 2 Unit Apartments | 0 (0.0%) | 30 (100.0%) |
| 3 or 4 Unit Apartments | 0 (0.0%) | 238 (100.0%) |
| 5 to 9 Unit Apartments | 0 (0.0%) | 0 (0.0%) |
| 10 or more Apartments | 0 (0.0%) | 51 (100.0%) |
| Mobile Home / Other | 151 (79.1%) | 40 (20.9%) |
| Total | 606 (60.2%) | 400 (39.8%) |
Housing Structures by Number of Rooms in Tonopah
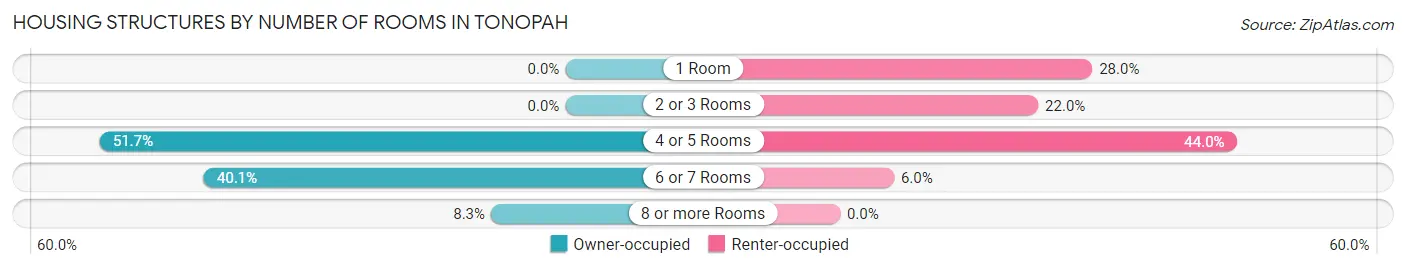
| Number of Rooms | Owner-occupied | Renter-occupied |
| 1 Room | 0 (0.0%) | 112 (28.0%) |
| 2 or 3 Rooms | 0 (0.0%) | 88 (22.0%) |
| 4 or 5 Rooms | 313 (51.6%) | 176 (44.0%) |
| 6 or 7 Rooms | 243 (40.1%) | 24 (6.0%) |
| 8 or more Rooms | 50 (8.3%) | 0 (0.0%) |
| Total | 606 (100.0%) | 400 (100.0%) |
Housing Structure by Heating Type in Tonopah
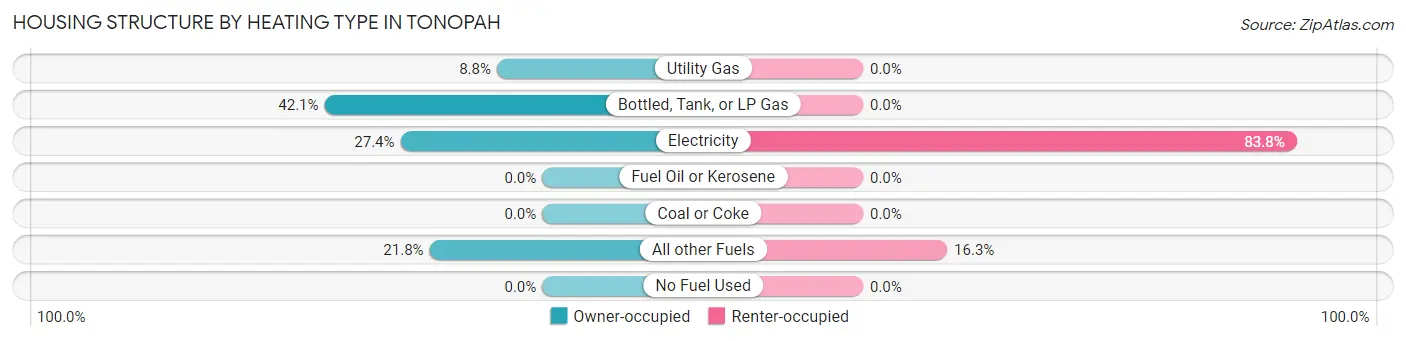
| Heating Type | Owner-occupied | Renter-occupied |
| Utility Gas | 53 (8.7%) | 0 (0.0%) |
| Bottled, Tank, or LP Gas | 255 (42.1%) | 0 (0.0%) |
| Electricity | 166 (27.4%) | 335 (83.8%) |
| Fuel Oil or Kerosene | 0 (0.0%) | 0 (0.0%) |
| Coal or Coke | 0 (0.0%) | 0 (0.0%) |
| All other Fuels | 132 (21.8%) | 65 (16.3%) |
| No Fuel Used | 0 (0.0%) | 0 (0.0%) |
| Total | 606 (100.0%) | 400 (100.0%) |
Household Vehicle Usage in Tonopah
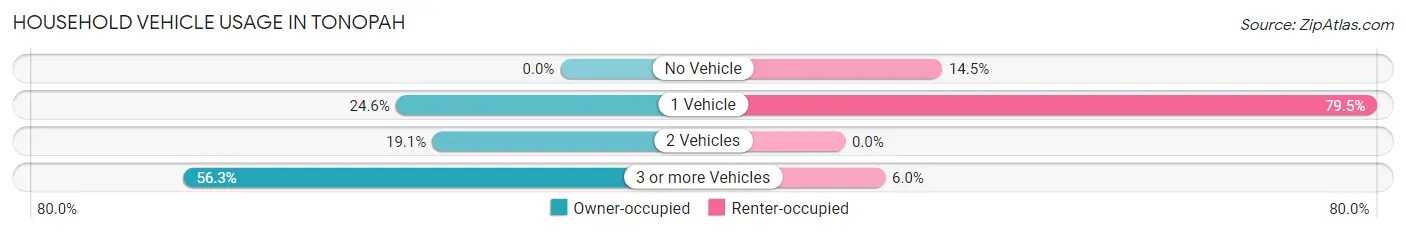
| Vehicles per Household | Owner-occupied | Renter-occupied |
| No Vehicle | 0 (0.0%) | 58 (14.5%) |
| 1 Vehicle | 149 (24.6%) | 318 (79.5%) |
| 2 Vehicles | 116 (19.1%) | 0 (0.0%) |
| 3 or more Vehicles | 341 (56.3%) | 24 (6.0%) |
| Total | 606 (100.0%) | 400 (100.0%) |
Real Estate & Mortgages in Tonopah
Real Estate and Mortgage Overview in Tonopah
| Characteristic | Without Mortgage | With Mortgage |
| Housing Units | 414 | 192 |
| Median Property Value | $145,100 | $182,500 |
| Median Household Income | $32,339 | $14 |
| Monthly Housing Costs | $399 | $0 |
| Real Estate Taxes | $686 | $0 |
Property Value by Mortgage Status in Tonopah
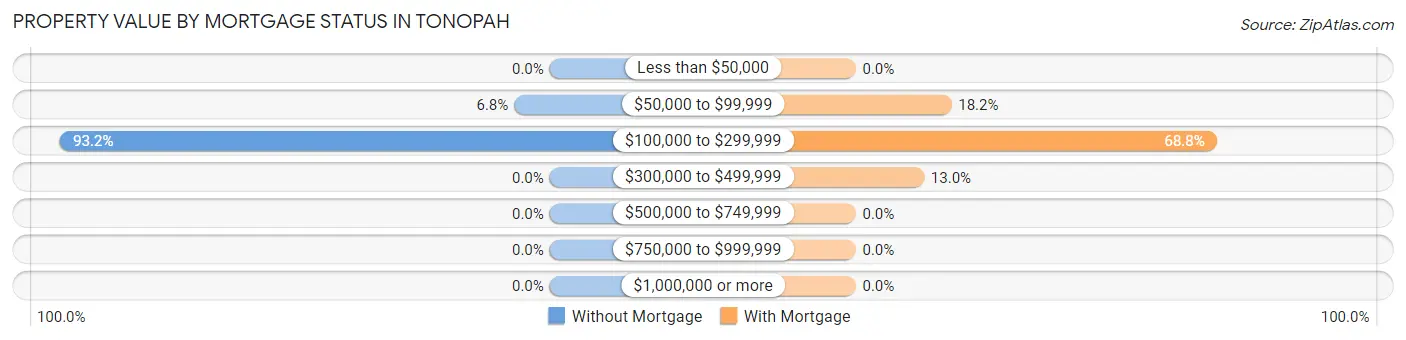
| Property Value | Without Mortgage | With Mortgage |
| Less than $50,000 | 0 (0.0%) | 0 (0.0%) |
| $50,000 to $99,999 | 28 (6.8%) | 35 (18.2%) |
| $100,000 to $299,999 | 386 (93.2%) | 132 (68.8%) |
| $300,000 to $499,999 | 0 (0.0%) | 25 (13.0%) |
| $500,000 to $749,999 | 0 (0.0%) | 0 (0.0%) |
| $750,000 to $999,999 | 0 (0.0%) | 0 (0.0%) |
| $1,000,000 or more | 0 (0.0%) | 0 (0.0%) |
| Total | 414 (100.0%) | 192 (100.0%) |
Household Income by Mortgage Status in Tonopah
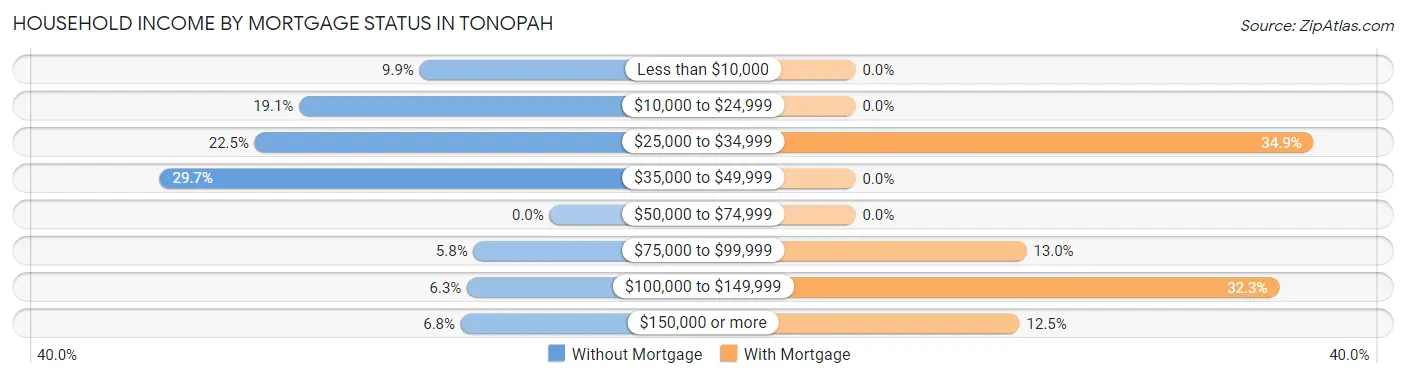
| Household Income | Without Mortgage | With Mortgage |
| Less than $10,000 | 41 (9.9%) | 0 (0.0%) |
| $10,000 to $24,999 | 79 (19.1%) | 0 (0.0%) |
| $25,000 to $34,999 | 93 (22.5%) | 67 (34.9%) |
| $35,000 to $49,999 | 123 (29.7%) | 0 (0.0%) |
| $50,000 to $74,999 | 0 (0.0%) | 0 (0.0%) |
| $75,000 to $99,999 | 24 (5.8%) | 25 (13.0%) |
| $100,000 to $149,999 | 26 (6.3%) | 62 (32.3%) |
| $150,000 or more | 28 (6.8%) | 24 (12.5%) |
| Total | 414 (100.0%) | 192 (100.0%) |
Property Value to Household Income Ratio in Tonopah
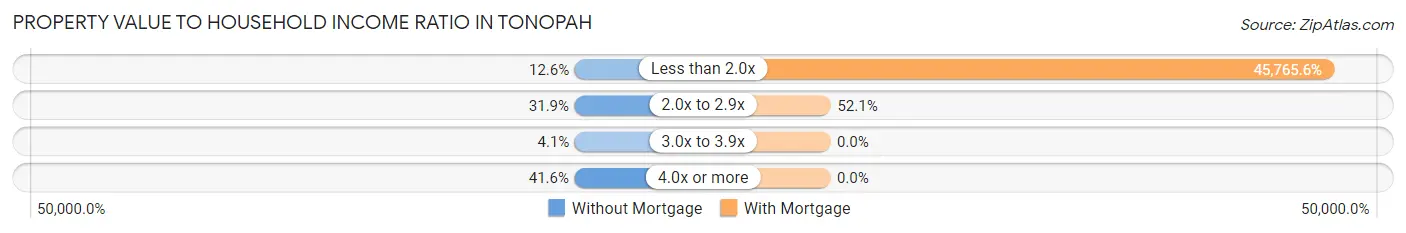
| Value-to-Income Ratio | Without Mortgage | With Mortgage |
| Less than 2.0x | 52 (12.6%) | 87,870 (45,765.6%) |
| 2.0x to 2.9x | 132 (31.9%) | 100 (52.1%) |
| 3.0x to 3.9x | 17 (4.1%) | 0 (0.0%) |
| 4.0x or more | 172 (41.5%) | 0 (0.0%) |
| Total | 414 (100.0%) | 192 (100.0%) |
Real Estate Taxes by Mortgage Status in Tonopah
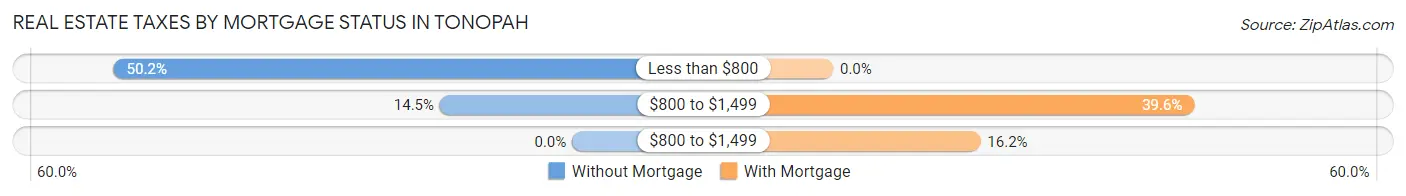
| Property Taxes | Without Mortgage | With Mortgage |
| Less than $800 | 208 (50.2%) | 0 (0.0%) |
| $800 to $1,499 | 60 (14.5%) | 76 (39.6%) |
| $800 to $1,499 | 0 (0.0%) | 31 (16.2%) |
| Total | 414 (100.0%) | 192 (100.0%) |
Health & Disability in Tonopah
Health Insurance Coverage by Age in Tonopah
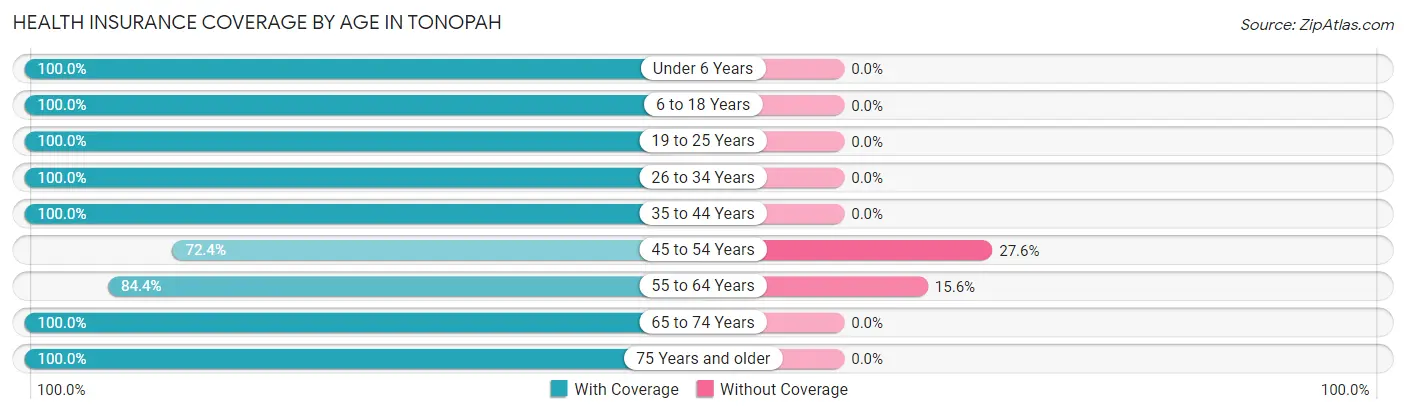
| Age Bracket | With Coverage | Without Coverage |
| Under 6 Years | 21 (100.0%) | 0 (0.0%) |
| 6 to 18 Years | 50 (100.0%) | 0 (0.0%) |
| 19 to 25 Years | 16 (100.0%) | 0 (0.0%) |
| 26 to 34 Years | 190 (100.0%) | 0 (0.0%) |
| 35 to 44 Years | 264 (100.0%) | 0 (0.0%) |
| 45 to 54 Years | 160 (72.4%) | 61 (27.6%) |
| 55 to 64 Years | 222 (84.4%) | 41 (15.6%) |
| 65 to 74 Years | 437 (100.0%) | 0 (0.0%) |
| 75 Years and older | 186 (100.0%) | 0 (0.0%) |
| Total | 1,546 (93.8%) | 102 (6.2%) |
Health Insurance Coverage by Citizenship Status in Tonopah
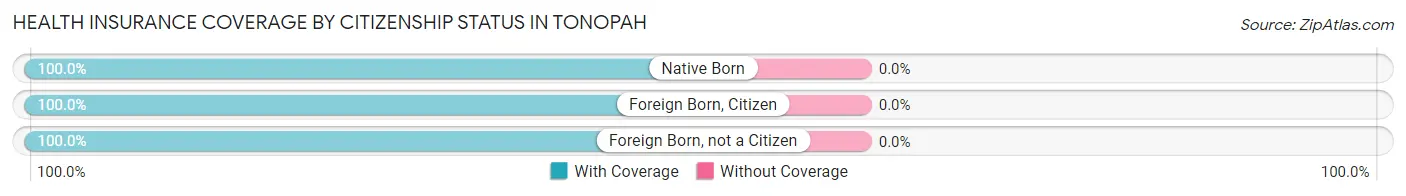
| Citizenship Status | With Coverage | Without Coverage |
| Native Born | 21 (100.0%) | 0 (0.0%) |
| Foreign Born, Citizen | 50 (100.0%) | 0 (0.0%) |
| Foreign Born, not a Citizen | 16 (100.0%) | 0 (0.0%) |
Health Insurance Coverage by Household Income in Tonopah
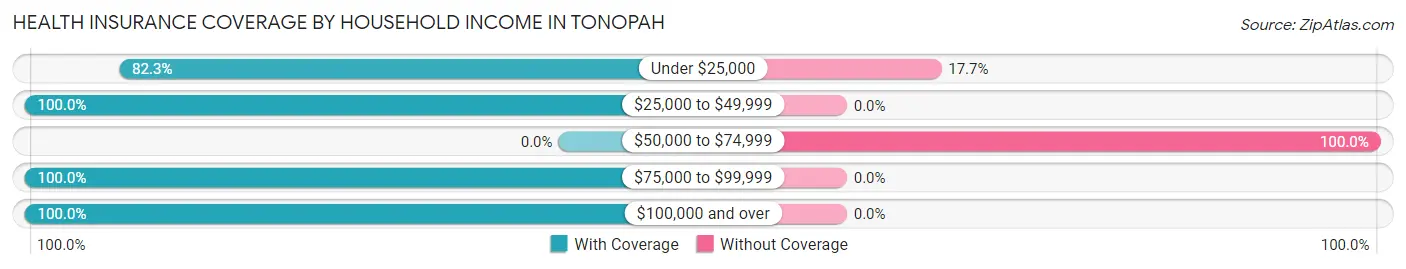
| Household Income | With Coverage | Without Coverage |
| Under $25,000 | 358 (82.3%) | 77 (17.7%) |
| $25,000 to $49,999 | 724 (100.0%) | 0 (0.0%) |
| $50,000 to $74,999 | 0 (0.0%) | 25 (100.0%) |
| $75,000 to $99,999 | 202 (100.0%) | 0 (0.0%) |
| $100,000 and over | 262 (100.0%) | 0 (0.0%) |
Public vs Private Health Insurance Coverage by Age in Tonopah

| Age Bracket | Public Insurance | Private Insurance |
| Under 6 | 21 (100.0%) | 0 (0.0%) |
| 6 to 18 Years | 0 (0.0%) | 50 (100.0%) |
| 19 to 25 Years | 16 (100.0%) | 0 (0.0%) |
| 25 to 34 Years | 50 (26.3%) | 140 (73.7%) |
| 35 to 44 Years | 0 (0.0%) | 264 (100.0%) |
| 45 to 54 Years | 12 (5.4%) | 148 (67.0%) |
| 55 to 64 Years | 87 (33.1%) | 135 (51.3%) |
| 65 to 74 Years | 425 (97.3%) | 199 (45.5%) |
| 75 Years and over | 186 (100.0%) | 118 (63.4%) |
| Total | 797 (48.4%) | 1,054 (64.0%) |
Disability Status by Sex by Age in Tonopah
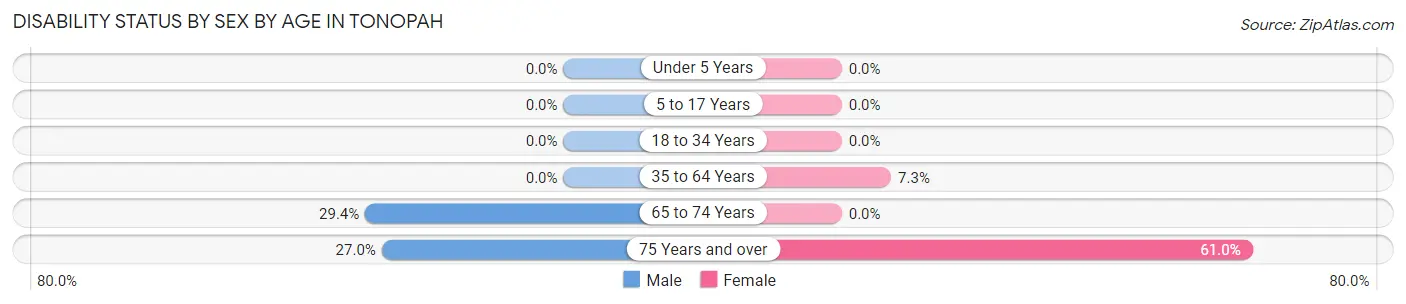
| Age Bracket | Male | Female |
| Under 5 Years | 0 (0.0%) | 0 (0.0%) |
| 5 to 17 Years | 0 (0.0%) | 0 (0.0%) |
| 18 to 34 Years | 0 (0.0%) | 0 (0.0%) |
| 35 to 64 Years | 0 (0.0%) | 30 (7.3%) |
| 65 to 74 Years | 73 (29.4%) | 0 (0.0%) |
| 75 Years and over | 17 (27.0%) | 75 (61.0%) |
Disability Class by Sex by Age in Tonopah
Disability Class: Hearing Difficulty
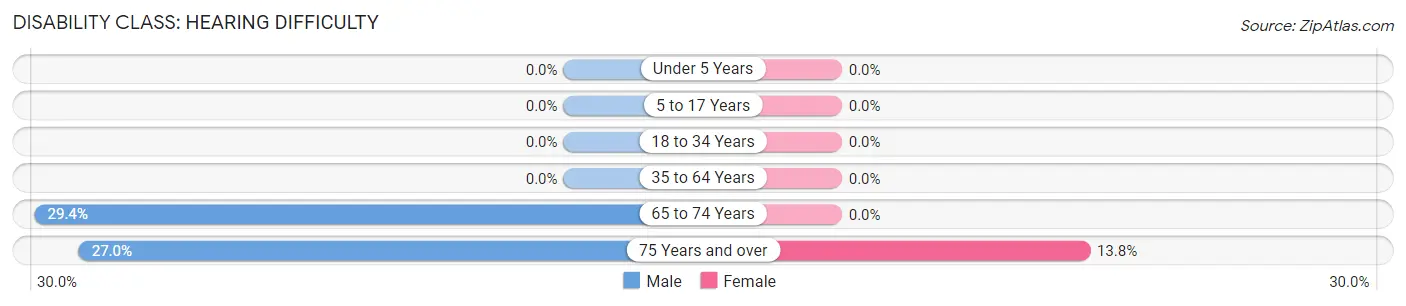
| Age Bracket | Male | Female |
| Under 5 Years | 0 (0.0%) | 0 (0.0%) |
| 5 to 17 Years | 0 (0.0%) | 0 (0.0%) |
| 18 to 34 Years | 0 (0.0%) | 0 (0.0%) |
| 35 to 64 Years | 0 (0.0%) | 0 (0.0%) |
| 65 to 74 Years | 73 (29.4%) | 0 (0.0%) |
| 75 Years and over | 17 (27.0%) | 17 (13.8%) |
Disability Class: Vision Difficulty
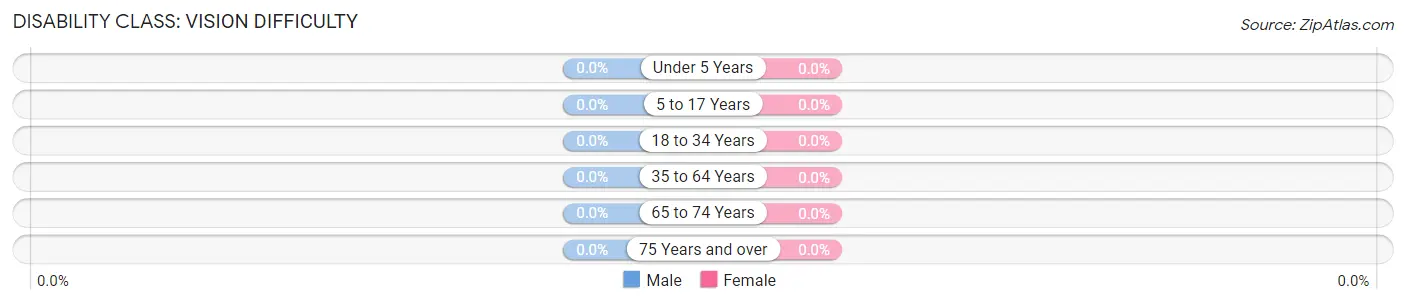
| Age Bracket | Male | Female |
| Under 5 Years | 0 (0.0%) | 0 (0.0%) |
| 5 to 17 Years | 0 (0.0%) | 0 (0.0%) |
| 18 to 34 Years | 0 (0.0%) | 0 (0.0%) |
| 35 to 64 Years | 0 (0.0%) | 0 (0.0%) |
| 65 to 74 Years | 0 (0.0%) | 0 (0.0%) |
| 75 Years and over | 0 (0.0%) | 0 (0.0%) |
Disability Class: Cognitive Difficulty
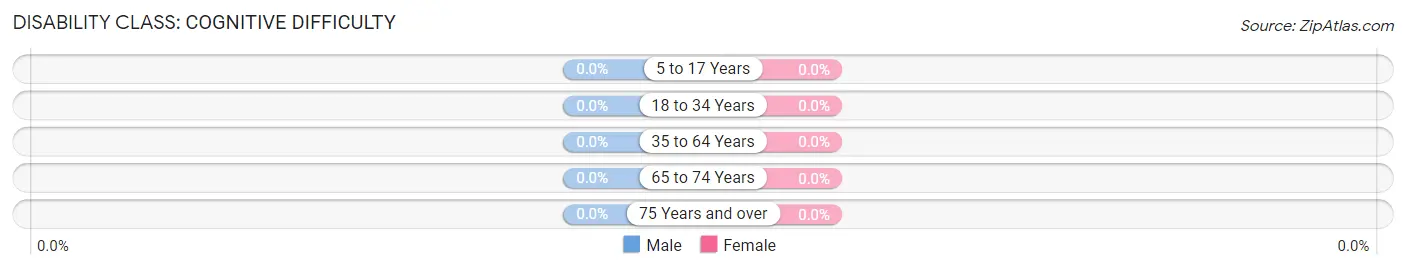
| Age Bracket | Male | Female |
| 5 to 17 Years | 0 (0.0%) | 0 (0.0%) |
| 18 to 34 Years | 0 (0.0%) | 0 (0.0%) |
| 35 to 64 Years | 0 (0.0%) | 0 (0.0%) |
| 65 to 74 Years | 0 (0.0%) | 0 (0.0%) |
| 75 Years and over | 0 (0.0%) | 0 (0.0%) |
Disability Class: Ambulatory Difficulty
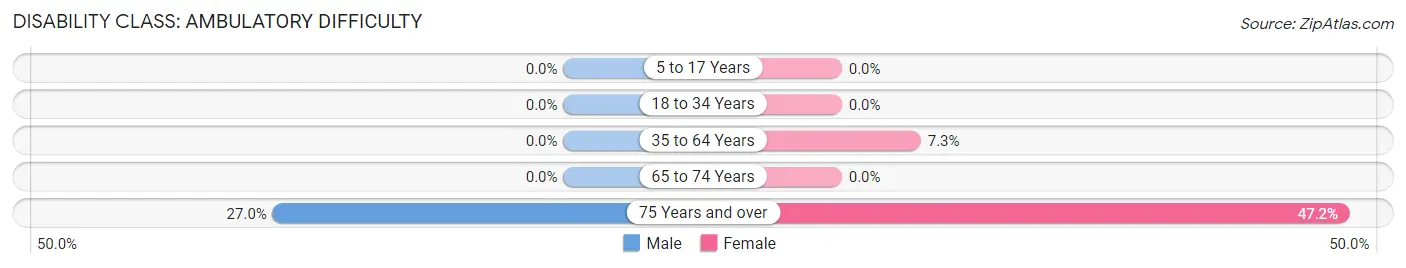
| Age Bracket | Male | Female |
| 5 to 17 Years | 0 (0.0%) | 0 (0.0%) |
| 18 to 34 Years | 0 (0.0%) | 0 (0.0%) |
| 35 to 64 Years | 0 (0.0%) | 30 (7.3%) |
| 65 to 74 Years | 0 (0.0%) | 0 (0.0%) |
| 75 Years and over | 17 (27.0%) | 58 (47.1%) |
Disability Class: Self-Care Difficulty
| Age Bracket | Male | Female |
| 5 to 17 Years | 0 (0.0%) | 0 (0.0%) |
| 18 to 34 Years | 0 (0.0%) | 0 (0.0%) |
| 35 to 64 Years | 0 (0.0%) | 0 (0.0%) |
| 65 to 74 Years | 0 (0.0%) | 0 (0.0%) |
| 75 Years and over | 0 (0.0%) | 0 (0.0%) |
Technology Access in Tonopah
Computing Device Access in Tonopah
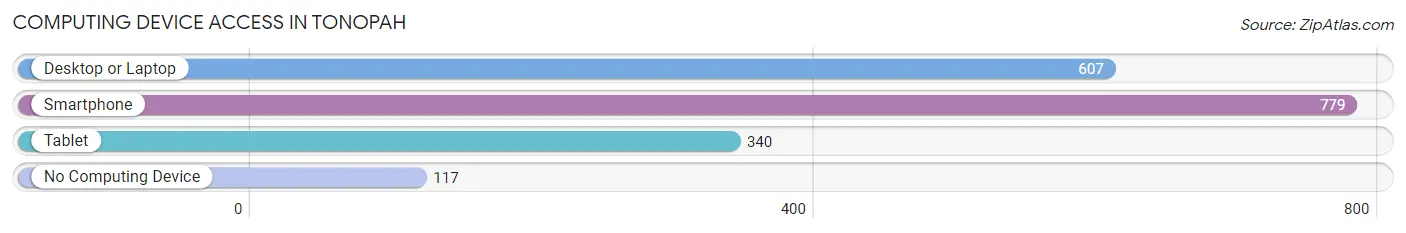
| Device Type | # Households | % Households |
| Desktop or Laptop | 607 | 60.3% |
| Smartphone | 779 | 77.4% |
| Tablet | 340 | 33.8% |
| No Computing Device | 117 | 11.6% |
| Total | 1,006 | 100.0% |
Internet Access in Tonopah
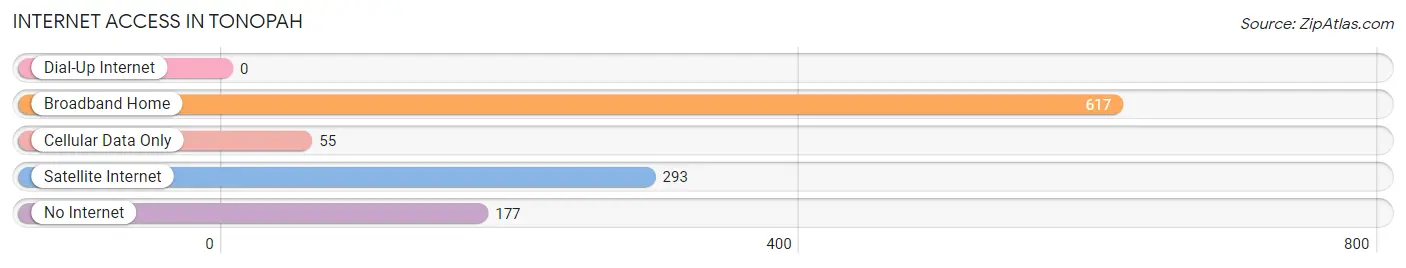
| Internet Type | # Households | % Households |
| Dial-Up Internet | 0 | 0.0% |
| Broadband Home | 617 | 61.3% |
| Cellular Data Only | 55 | 5.5% |
| Satellite Internet | 293 | 29.1% |
| No Internet | 177 | 17.6% |
| Total | 1,006 | 100.0% |
Tonopah Summary
Introduction
Tonopah is a small town located in the heart of Nevada, United States. It is the county seat of Nye County and is located in the middle of the state, about halfway between Las Vegas and Reno. The town was founded in 1900 and has a population of about 2,500 people. It is known for its mining history, its unique geography, and its diverse economy.
History
Tonopah was founded in 1900 by Jim Butler, a prospector who discovered a rich silver deposit in the area. He named the town after the local Native American word for “hidden spring”. The town quickly grew as miners flocked to the area to take advantage of the silver boom. By 1910, the population had grown to over 5,000 people.
The town was also home to a number of famous people, including Wyatt Earp, who owned a saloon in Tonopah. The town was also the site of the first airmail flight in the United States, which took place in 1911.
The town’s fortunes changed in the 1920s, when the silver market crashed and the mines closed. The population declined and the town became a quiet, sleepy place.
Geography
Tonopah is located in the middle of Nevada, about halfway between Las Vegas and Reno. It is situated in the Tonopah Basin, a large desert valley surrounded by mountains. The town is located at an elevation of 5,000 feet, making it one of the highest towns in the state.
The climate in Tonopah is semi-arid, with hot summers and cold winters. The average annual temperature is around 50 degrees Fahrenheit. The town receives an average of 8 inches of precipitation per year.
Economy
Tonopah’s economy is largely based on mining and tourism. The town is home to several gold and silver mines, as well as a number of tourist attractions. The town is also home to a number of businesses, including restaurants, hotels, and retail stores.
The town is also home to a number of government agencies, including the Bureau of Land Management and the Nevada Department of Transportation.
Demographics
As of the 2010 census, the population of Tonopah was 2,478. The racial makeup of the town was 90.3% White, 0.7% African American, 0.7% Native American, 0.3% Asian, 0.1% Pacific Islander, 5.2% from other races, and 2.9% from two or more races. Hispanic or Latino of any race were 11.3% of the population.
Conclusion
Tonopah is a small town located in the heart of Nevada. It is known for its mining history, its unique geography, and its diverse economy. The town is home to a number of businesses, government agencies, and tourist attractions. The population of Tonopah is largely white, but there is a significant Hispanic population as well. The town is a great place to visit and explore, and it is sure to provide an interesting and unique experience.
Common Questions
What is Per Capita Income in Tonopah?
Per Capita income in Tonopah is $31,090.
What is the Median Family Income in Tonopah?
Median Family Income in Tonopah is $36,071.
What is the Median Household income in Tonopah?
Median Household Income in Tonopah is $35,931.
What is Income or Wage Gap in Tonopah?
Income or Wage Gap in Tonopah is 25.6%.
Women in Tonopah earn 74.4 cents for every dollar earned by a man.
What is Inequality or Gini Index in Tonopah?
Inequality or Gini Index in Tonopah is 0.44.
What is the Total Population of Tonopah?
Total Population of Tonopah is 1,777.
What is the Total Male Population of Tonopah?
Total Male Population of Tonopah is 928.
What is the Total Female Population of Tonopah?
Total Female Population of Tonopah is 849.
What is the Ratio of Males per 100 Females in Tonopah?
There are 109.31 Males per 100 Females in Tonopah.
What is the Ratio of Females per 100 Males in Tonopah?
There are 91.49 Females per 100 Males in Tonopah.
What is the Median Population Age in Tonopah?
Median Population Age in Tonopah is 58.4 Years.
What is the Average Family Size in Tonopah
Average Family Size in Tonopah is 2.1 People.
What is the Average Household Size in Tonopah
Average Household Size in Tonopah is 1.6 People.
How Large is the Labor Force in Tonopah?
There are 763 People in the Labor Forcein in Tonopah.
What is the Percentage of People in the Labor Force in Tonopah?
44.7% of People are in the Labor Force in Tonopah.
What is the Unemployment Rate in Tonopah?
Unemployment Rate in Tonopah is 3.0%.