South Dennis, MA Map & Demographics
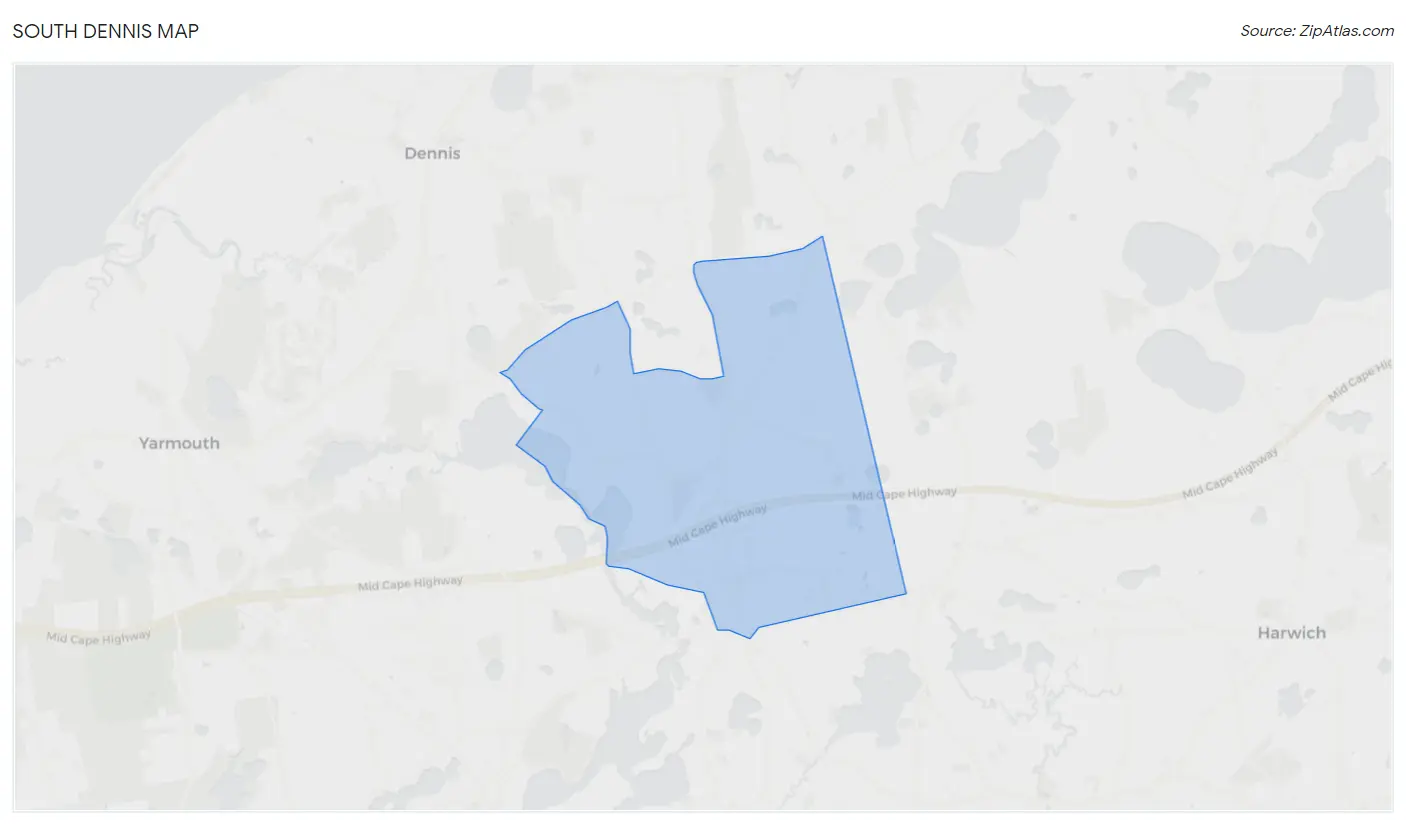
South Dennis Map
South Dennis Overview
$46,966
PER CAPITA INCOME
$110,903
AVG FAMILY INCOME
$81,607
AVG HOUSEHOLD INCOME
16.1%
WAGE / INCOME GAP [ % ]
83.9¢/ $1
WAGE / INCOME GAP [ $ ]
$6,103
FAMILY INCOME DEFICIT
0.37
INEQUALITY / GINI INDEX
3,101
TOTAL POPULATION
1,585
MALE POPULATION
1,516
FEMALE POPULATION
104.55
MALES / 100 FEMALES
95.65
FEMALES / 100 MALES
53.3
MEDIAN AGE
2.8
AVG FAMILY SIZE
2.1
AVG HOUSEHOLD SIZE
1,678
LABOR FORCE [ PEOPLE ]
61.0%
PERCENT IN LABOR FORCE
3.0%
UNEMPLOYMENT RATE
South Dennis Zip Codes
South Dennis Area Codes
Income in South Dennis
Income Overview in South Dennis
Per Capita Income in South Dennis is $46,966, while median incomes of families and households are $110,903 and $81,607 respectively.
| Characteristic | Number | Measure |
| Per Capita Income | 3,101 | $46,966 |
| Median Family Income | 807 | $110,903 |
| Mean Family Income | 807 | $122,230 |
| Median Household Income | 1,422 | $81,607 |
| Mean Household Income | 1,422 | $100,543 |
| Income Deficit | 807 | $6,103 |
| Wage / Income Gap (%) | 3,101 | 16.09% |
| Wage / Income Gap ($) | 3,101 | 83.91¢ per $1 |
| Gini / Inequality Index | 3,101 | 0.37 |
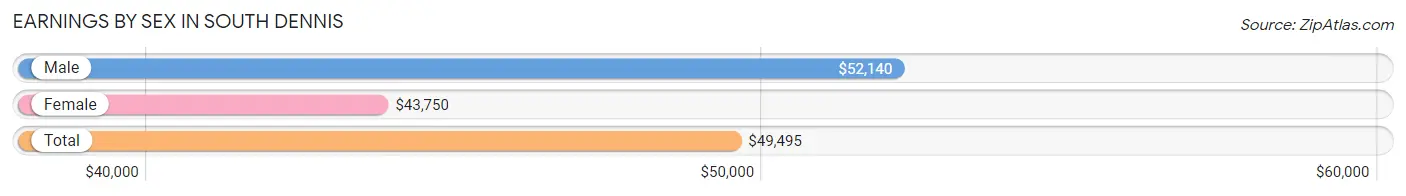
Earnings by Sex in South Dennis
Average Earnings in South Dennis are $49,495, $52,140 for men and $43,750 for women, a difference of 16.1%.
| Sex | Number | Average Earnings |
| Male | 907 (50.1%) | $52,140 |
| Female | 902 (49.9%) | $43,750 |
| Total | 1,809 (100.0%) | $49,495 |
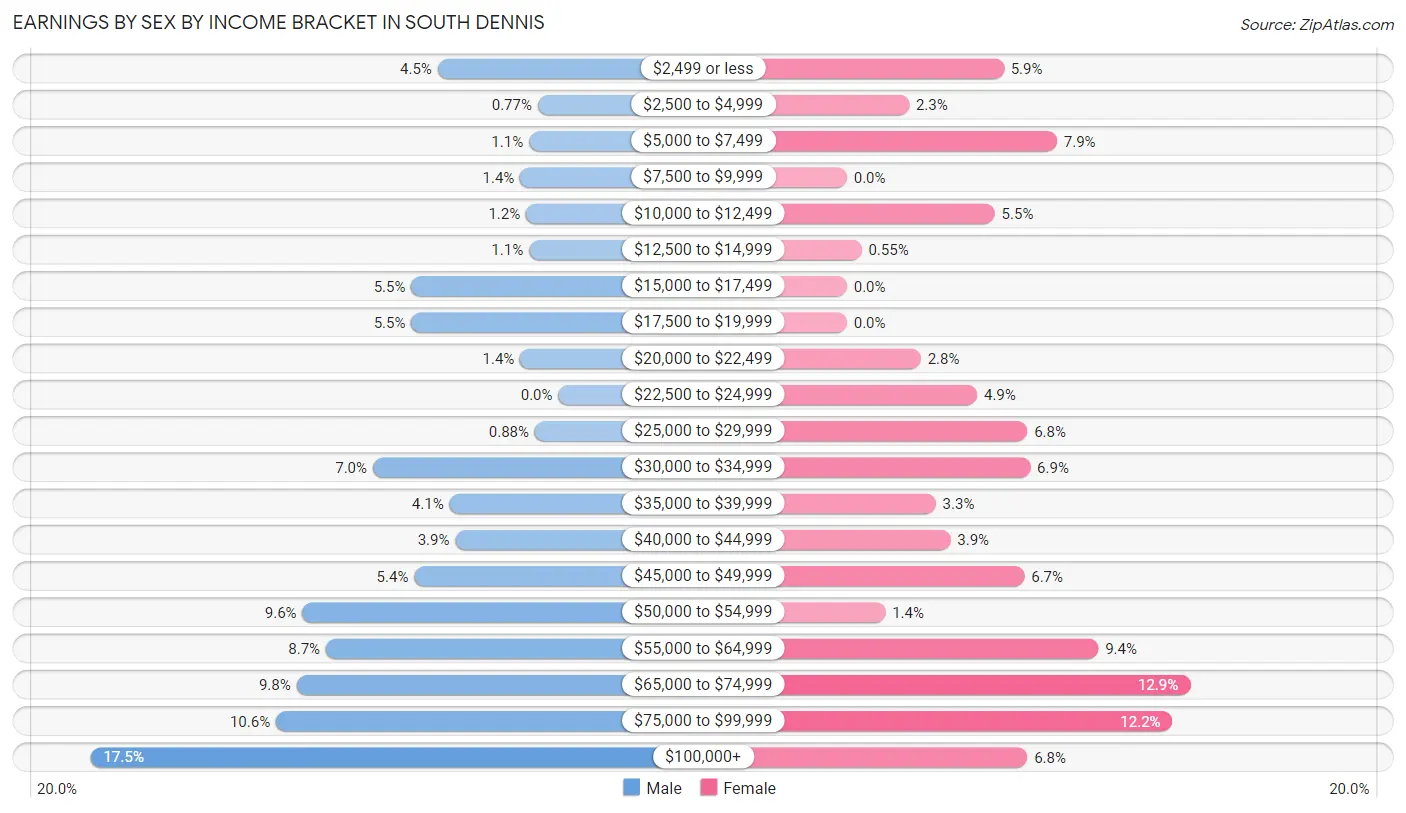
Earnings by Sex by Income Bracket in South Dennis
The most common earnings brackets in South Dennis are $100,000+ for men (159 | 17.5%) and $65,000 to $74,999 for women (116 | 12.9%).
| Income | Male | Female |
| $2,499 or less | 41 (4.5%) | 53 (5.9%) |
| $2,500 to $4,999 | 7 (0.8%) | 21 (2.3%) |
| $5,000 to $7,499 | 10 (1.1%) | 71 (7.9%) |
| $7,500 to $9,999 | 13 (1.4%) | 0 (0.0%) |
| $10,000 to $12,499 | 11 (1.2%) | 50 (5.5%) |
| $12,500 to $14,999 | 10 (1.1%) | 5 (0.5%) |
| $15,000 to $17,499 | 50 (5.5%) | 0 (0.0%) |
| $17,500 to $19,999 | 50 (5.5%) | 0 (0.0%) |
| $20,000 to $22,499 | 13 (1.4%) | 25 (2.8%) |
| $22,500 to $24,999 | 0 (0.0%) | 44 (4.9%) |
| $25,000 to $29,999 | 8 (0.9%) | 61 (6.8%) |
| $30,000 to $34,999 | 63 (7.0%) | 62 (6.9%) |
| $35,000 to $39,999 | 37 (4.1%) | 30 (3.3%) |
| $40,000 to $44,999 | 35 (3.9%) | 35 (3.9%) |
| $45,000 to $49,999 | 49 (5.4%) | 60 (6.7%) |
| $50,000 to $54,999 | 87 (9.6%) | 13 (1.4%) |
| $55,000 to $64,999 | 79 (8.7%) | 85 (9.4%) |
| $65,000 to $74,999 | 89 (9.8%) | 116 (12.9%) |
| $75,000 to $99,999 | 96 (10.6%) | 110 (12.2%) |
| $100,000+ | 159 (17.5%) | 61 (6.8%) |
| Total | 907 (100.0%) | 902 (100.0%) |
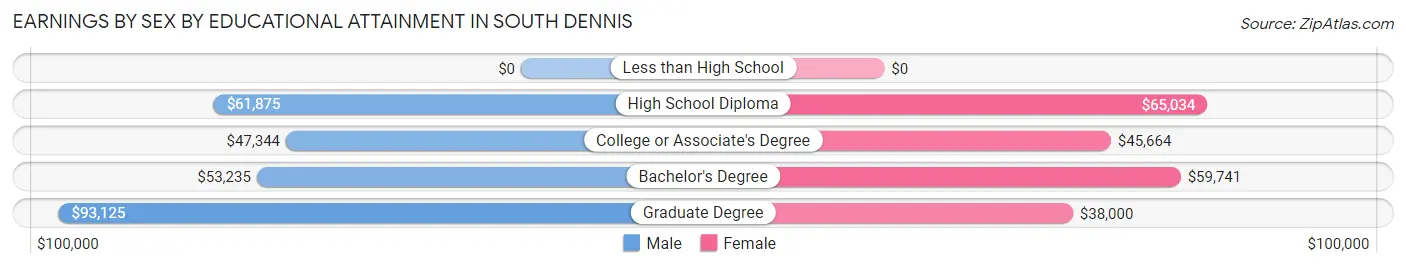
Earnings by Sex by Educational Attainment in South Dennis
Average earnings in South Dennis are $55,556 for men and $47,431 for women, a difference of 14.6%. Men with an educational attainment of graduate degree enjoy the highest average annual earnings of $93,125, while those with college or associate's degree education earn the least with $47,344. Women with an educational attainment of high school diploma earn the most with the average annual earnings of $65,034, while those with graduate degree education have the smallest earnings of $38,000.
| Educational Attainment | Male Income | Female Income |
| Less than High School | - | - |
| High School Diploma | $61,875 | $65,034 |
| College or Associate's Degree | $47,344 | $45,664 |
| Bachelor's Degree | $53,235 | $59,741 |
| Graduate Degree | $93,125 | $38,000 |
| Total | $55,556 | $47,431 |
Family Income in South Dennis
Family Income Brackets in South Dennis
According to the South Dennis family income data, there are 193 families falling into the $100,000 to $149,999 income range, which is the most common income bracket and makes up 23.9% of all families. Conversely, the $15,000 to $24,999 income bracket is the least frequent group with only 8 families (1.0%) belonging to this category.
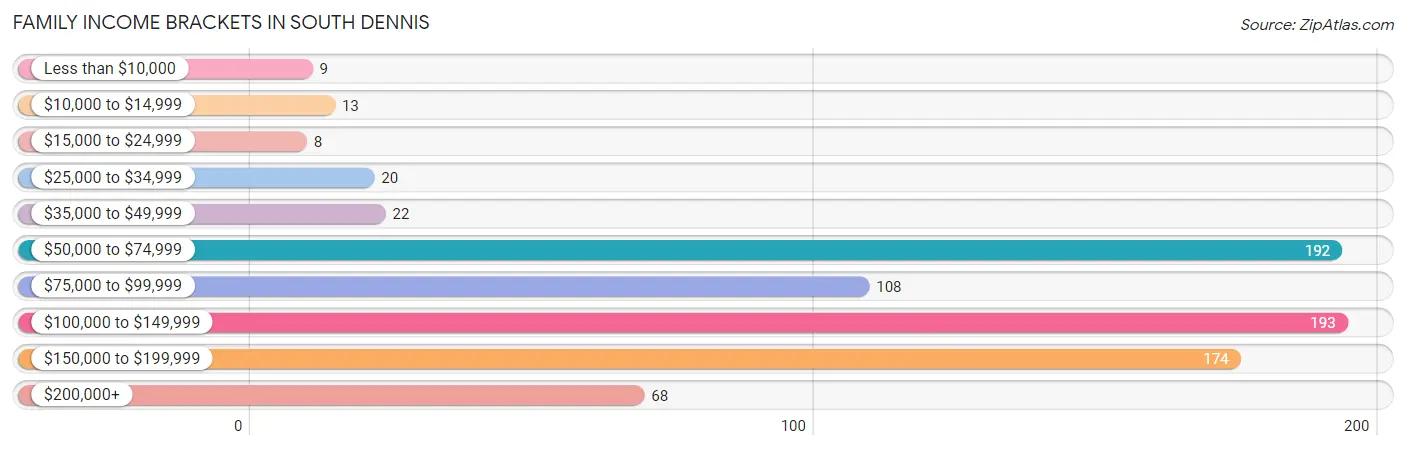
| Income Bracket | # Families | % Families |
| Less than $10,000 | 9 | 1.1% |
| $10,000 to $14,999 | 13 | 1.6% |
| $15,000 to $24,999 | 8 | 1.0% |
| $25,000 to $34,999 | 20 | 2.5% |
| $35,000 to $49,999 | 22 | 2.7% |
| $50,000 to $74,999 | 192 | 23.8% |
| $75,000 to $99,999 | 108 | 13.4% |
| $100,000 to $149,999 | 193 | 23.9% |
| $150,000 to $199,999 | 174 | 21.6% |
| $200,000+ | 68 | 8.4% |
Family Income by Famaliy Size in South Dennis
4-person families (119 | 14.7%) account for the highest median family income in South Dennis with $137,301 per family, while 2-person families (479 | 59.4%) have the highest median income of $43,774 per family member.
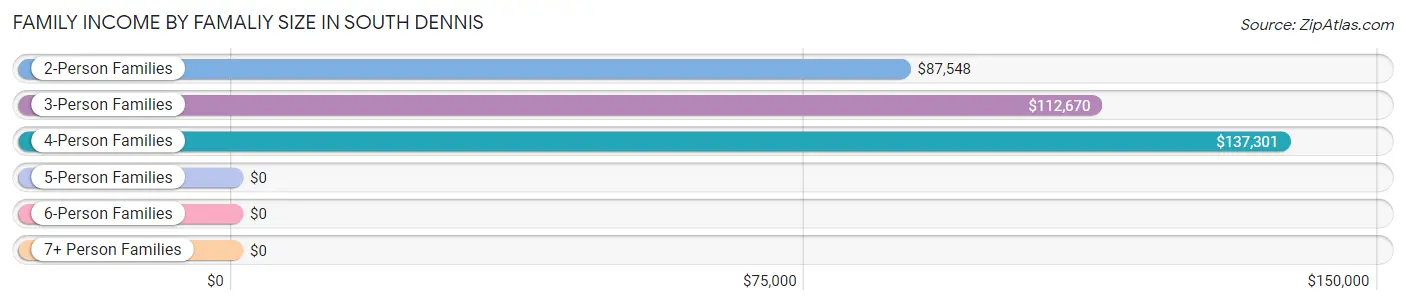
| Income Bracket | # Families | Median Income |
| 2-Person Families | 479 (59.4%) | $87,548 |
| 3-Person Families | 169 (20.9%) | $112,670 |
| 4-Person Families | 119 (14.7%) | $137,301 |
| 5-Person Families | 17 (2.1%) | $0 |
| 6-Person Families | 23 (2.9%) | $0 |
| 7+ Person Families | 0 (0.0%) | $0 |
| Total | 807 (100.0%) | $110,903 |
Family Income by Number of Earners in South Dennis
The median family income in South Dennis is $110,903, with families comprising 2 earners (379) having the highest median family income of $130,583, while families with no earners (126) have the lowest median family income of $60,714, accounting for 47.0% and 15.6% of families, respectively.
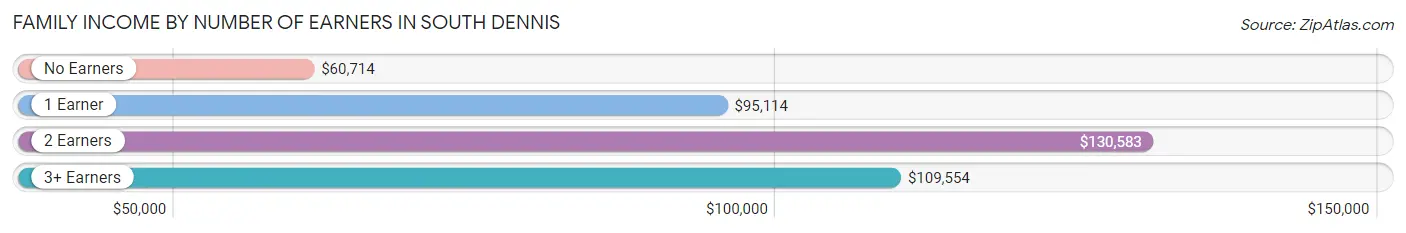
| Number of Earners | # Families | Median Income |
| No Earners | 126 (15.6%) | $60,714 |
| 1 Earner | 233 (28.9%) | $95,114 |
| 2 Earners | 379 (47.0%) | $130,583 |
| 3+ Earners | 69 (8.6%) | $109,554 |
| Total | 807 (100.0%) | $110,903 |
Household Income in South Dennis
Household Income Brackets in South Dennis
With 378 households falling in the category, the $50,000 to $74,999 income range is the most frequent in South Dennis, accounting for 26.6% of all households. In contrast, only 21 households (1.5%) fall into the $10,000 to $14,999 income bracket, making it the least populous group.
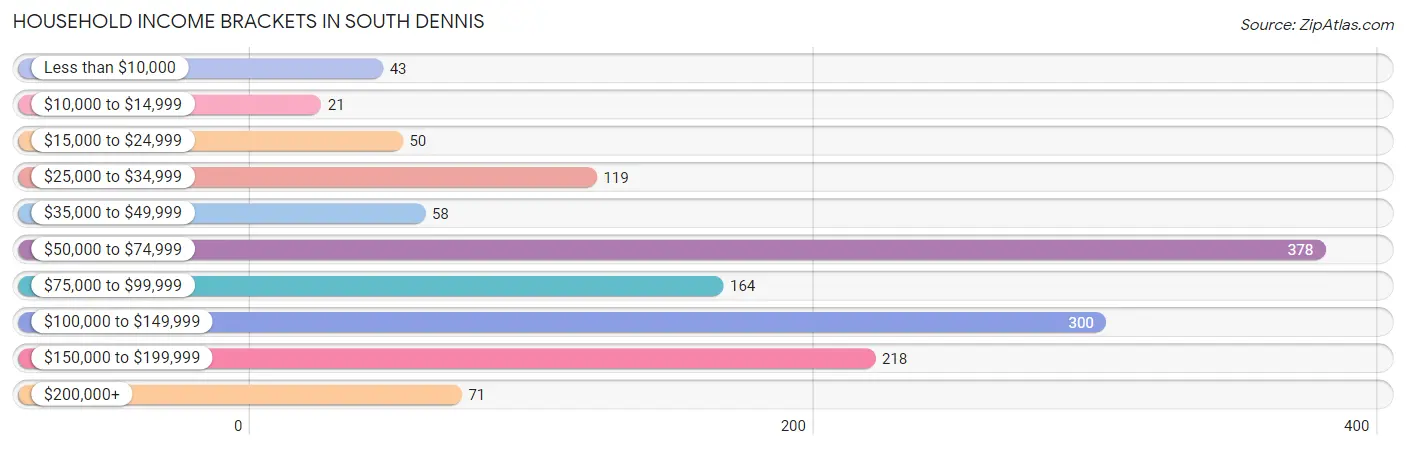
| Income Bracket | # Households | % Households |
| Less than $10,000 | 43 | 3.0% |
| $10,000 to $14,999 | 21 | 1.5% |
| $15,000 to $24,999 | 50 | 3.5% |
| $25,000 to $34,999 | 119 | 8.4% |
| $35,000 to $49,999 | 58 | 4.1% |
| $50,000 to $74,999 | 378 | 26.6% |
| $75,000 to $99,999 | 164 | 11.5% |
| $100,000 to $149,999 | 300 | 21.1% |
| $150,000 to $199,999 | 218 | 15.3% |
| $200,000+ | 71 | 5.0% |
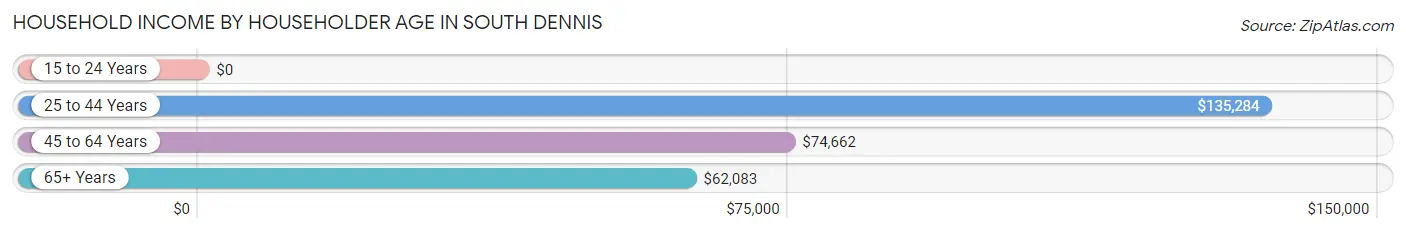
Household Income by Householder Age in South Dennis
The median household income in South Dennis is $81,607, with the highest median household income of $135,284 found in the 25 to 44 years age bracket for the primary householder. A total of 346 households (24.3%) fall into this category.
| Income Bracket | # Households | Median Income |
| 15 to 24 Years | 0 (0.0%) | $0 |
| 25 to 44 Years | 346 (24.3%) | $135,284 |
| 45 to 64 Years | 442 (31.1%) | $74,662 |
| 65+ Years | 634 (44.6%) | $62,083 |
| Total | 1,422 (100.0%) | $81,607 |
Poverty in South Dennis
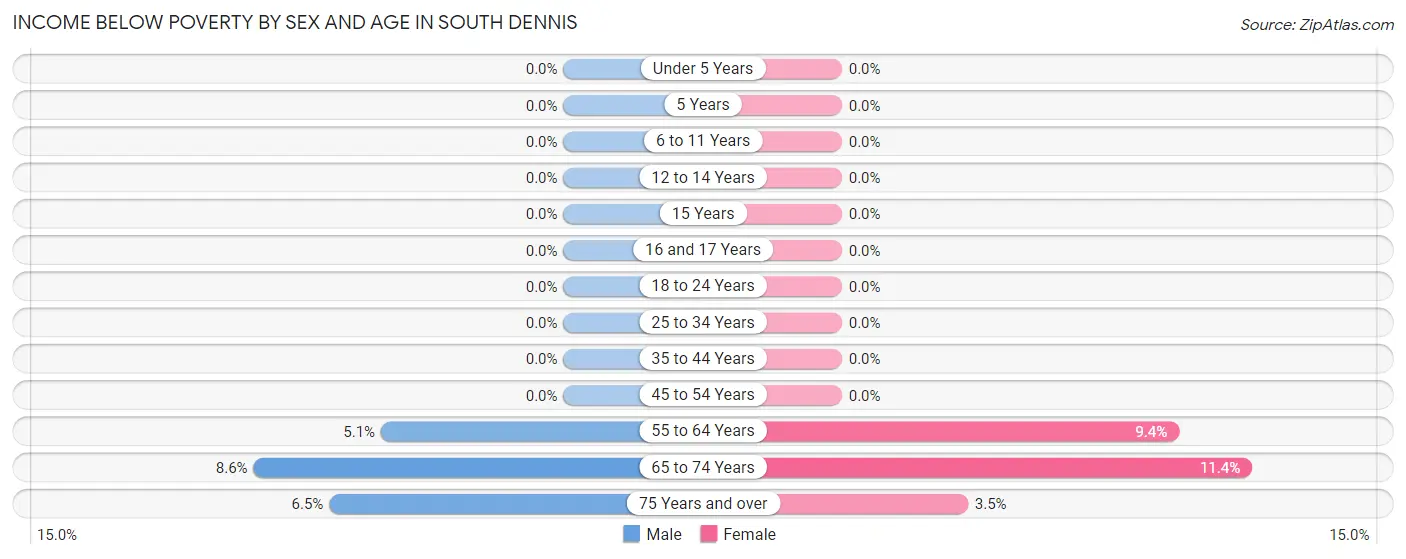
Income Below Poverty by Sex and Age in South Dennis
With 2.9% poverty level for males and 4.2% for females among the residents of South Dennis, 65 to 74 year old males and 65 to 74 year old females are the most vulnerable to poverty, with 22 males (8.6%) and 29 females (11.4%) in their respective age groups living below the poverty level.
| Age Bracket | Male | Female |
| Under 5 Years | 0 (0.0%) | 0 (0.0%) |
| 5 Years | 0 (0.0%) | 0 (0.0%) |
| 6 to 11 Years | 0 (0.0%) | 0 (0.0%) |
| 12 to 14 Years | 0 (0.0%) | 0 (0.0%) |
| 15 Years | 0 (0.0%) | 0 (0.0%) |
| 16 and 17 Years | 0 (0.0%) | 0 (0.0%) |
| 18 to 24 Years | 0 (0.0%) | 0 (0.0%) |
| 25 to 34 Years | 0 (0.0%) | 0 (0.0%) |
| 35 to 44 Years | 0 (0.0%) | 0 (0.0%) |
| 45 to 54 Years | 0 (0.0%) | 0 (0.0%) |
| 55 to 64 Years | 15 (5.1%) | 23 (9.4%) |
| 65 to 74 Years | 22 (8.6%) | 29 (11.4%) |
| 75 Years and over | 9 (6.5%) | 8 (3.5%) |
| Total | 46 (2.9%) | 60 (4.2%) |
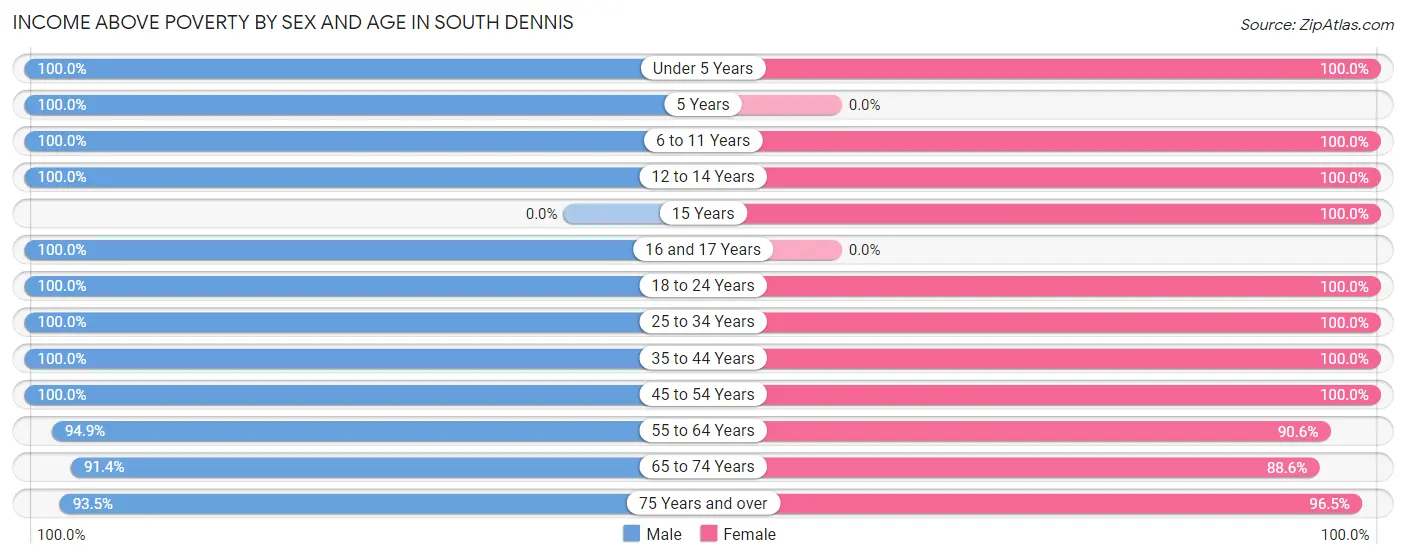
Income Above Poverty by Sex and Age in South Dennis
According to the poverty statistics in South Dennis, males aged under 5 years and females aged under 5 years are the age groups that are most secure financially, with 100.0% of males and 100.0% of females in these age groups living above the poverty line.
| Age Bracket | Male | Female |
| Under 5 Years | 36 (100.0%) | 27 (100.0%) |
| 5 Years | 16 (100.0%) | 0 (0.0%) |
| 6 to 11 Years | 86 (100.0%) | 52 (100.0%) |
| 12 to 14 Years | 95 (100.0%) | 28 (100.0%) |
| 15 Years | 0 (0.0%) | 10 (100.0%) |
| 16 and 17 Years | 10 (100.0%) | 0 (0.0%) |
| 18 to 24 Years | 84 (100.0%) | 117 (100.0%) |
| 25 to 34 Years | 71 (100.0%) | 105 (100.0%) |
| 35 to 44 Years | 336 (100.0%) | 141 (100.0%) |
| 45 to 54 Years | 151 (100.0%) | 230 (100.0%) |
| 55 to 64 Years | 280 (94.9%) | 222 (90.6%) |
| 65 to 74 Years | 233 (91.4%) | 225 (88.6%) |
| 75 Years and over | 129 (93.5%) | 220 (96.5%) |
| Total | 1,527 (97.1%) | 1,377 (95.8%) |
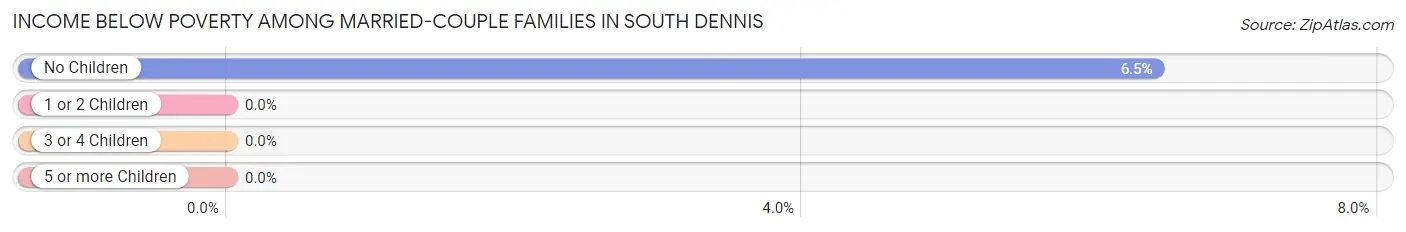
Income Below Poverty Among Married-Couple Families in South Dennis
The poverty statistics for married-couple families in South Dennis show that 4.7% or 30 of the total 638 families live below the poverty line. Families with no children have the highest poverty rate of 6.5%, comprising of 30 families. On the other hand, families with 1 or 2 children have the lowest poverty rate of 0.0%, which includes 0 families.
| Children | Above Poverty | Below Poverty |
| No Children | 435 (93.5%) | 30 (6.5%) |
| 1 or 2 Children | 173 (100.0%) | 0 (0.0%) |
| 3 or 4 Children | 0 (0.0%) | 0 (0.0%) |
| 5 or more Children | 0 (0.0%) | 0 (0.0%) |
| Total | 608 (95.3%) | 30 (4.7%) |
Income Below Poverty Among Single-Parent Households in South Dennis
| Children | Single Father | Single Mother |
| No Children | 0 (0.0%) | 0 (0.0%) |
| 1 or 2 Children | 0 (0.0%) | 0 (0.0%) |
| 3 or 4 Children | 0 (0.0%) | 0 (0.0%) |
| 5 or more Children | 0 (0.0%) | 0 (0.0%) |
| Total | 0 (0.0%) | 0 (0.0%) |
Income Below Poverty Among Married-Couple vs Single-Parent Households in South Dennis
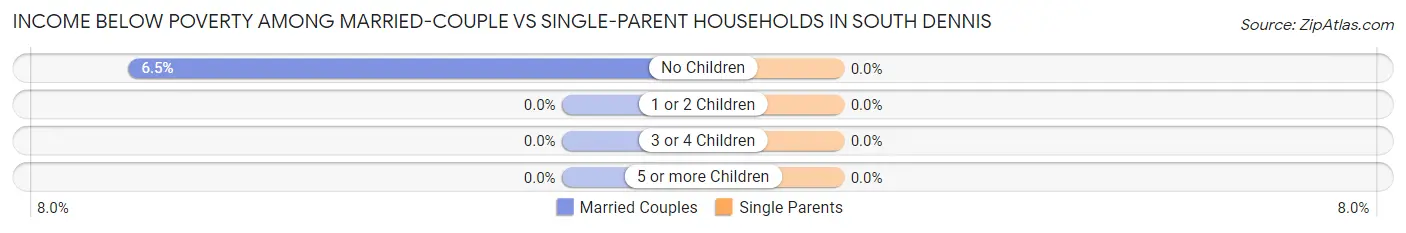
| Children | Married-Couple Families | Single-Parent Households |
| No Children | 30 (6.5%) | 0 (0.0%) |
| 1 or 2 Children | 0 (0.0%) | 0 (0.0%) |
| 3 or 4 Children | 0 (0.0%) | 0 (0.0%) |
| 5 or more Children | 0 (0.0%) | 0 (0.0%) |
| Total | 30 (4.7%) | 0 (0.0%) |
Race in South Dennis
The most populous races in South Dennis are White / Caucasian (2,886 | 93.1%), Black / African American (160 | 5.2%), and Two or more Races (46 | 1.5%).
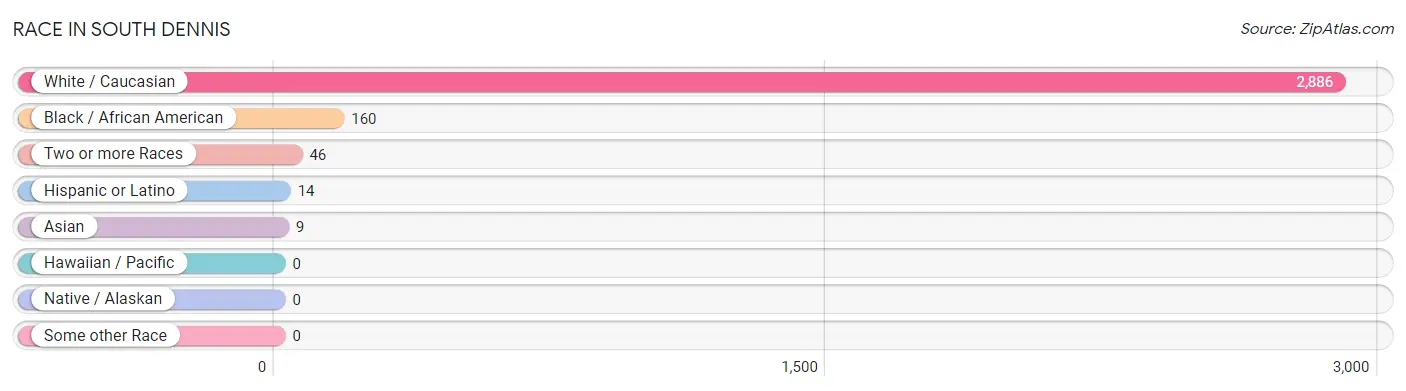
| Race | # Population | % Population |
| Asian | 9 | 0.3% |
| Black / African American | 160 | 5.2% |
| Hawaiian / Pacific | 0 | 0.0% |
| Hispanic or Latino | 14 | 0.4% |
| Native / Alaskan | 0 | 0.0% |
| White / Caucasian | 2,886 | 93.1% |
| Two or more Races | 46 | 1.5% |
| Some other Race | 0 | 0.0% |
| Total | 3,101 | 100.0% |
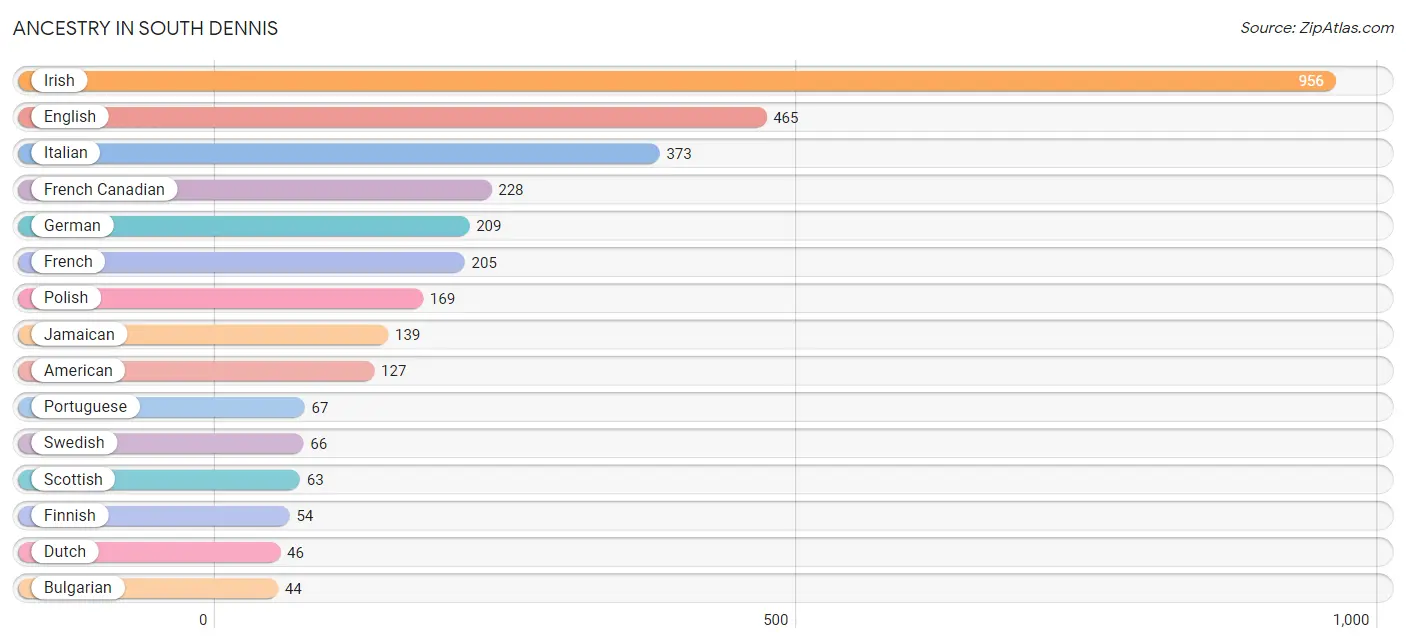
Ancestry in South Dennis
The most populous ancestries reported in South Dennis are Irish (956 | 30.8%), English (465 | 15.0%), Italian (373 | 12.0%), French Canadian (228 | 7.3%), and German (209 | 6.7%), together accounting for 72.0% of all South Dennis residents.
| Ancestry | # Population | % Population |
| American | 127 | 4.1% |
| Arab | 11 | 0.4% |
| Armenian | 30 | 1.0% |
| Bhutanese | 19 | 0.6% |
| Brazilian | 23 | 0.7% |
| British | 6 | 0.2% |
| Bulgarian | 44 | 1.4% |
| Canadian | 12 | 0.4% |
| Danish | 11 | 0.4% |
| Dutch | 46 | 1.5% |
| English | 465 | 15.0% |
| Finnish | 54 | 1.7% |
| French | 205 | 6.6% |
| French Canadian | 228 | 7.3% |
| German | 209 | 6.7% |
| Greek | 11 | 0.4% |
| Irish | 956 | 30.8% |
| Italian | 373 | 12.0% |
| Jamaican | 139 | 4.5% |
| Lithuanian | 30 | 1.0% |
| Mexican | 3 | 0.1% |
| Norwegian | 8 | 0.3% |
| Polish | 169 | 5.4% |
| Portuguese | 67 | 2.2% |
| Puerto Rican | 11 | 0.4% |
| Scotch-Irish | 10 | 0.3% |
| Scottish | 63 | 2.0% |
| Swedish | 66 | 2.1% |
| Syrian | 11 | 0.4% |
| Thai | 9 | 0.3% |
| Welsh | 11 | 0.4% | View All 31 Rows |
Immigrants in South Dennis
The most numerous immigrant groups reported in South Dennis came from Latin America (133 | 4.3%), Caribbean (115 | 3.7%), Jamaica (115 | 3.7%), Europe (90 | 2.9%), and Bulgaria (44 | 1.4%), together accounting for 16.0% of all South Dennis residents.
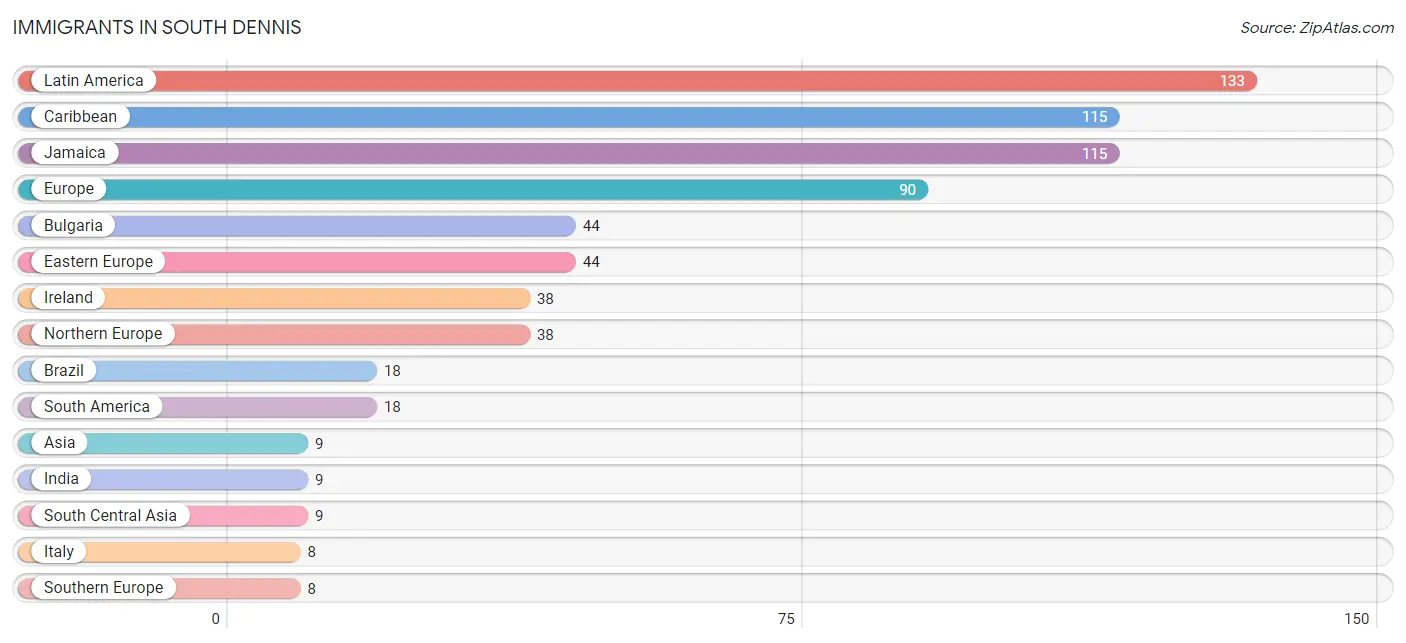
| Immigration Origin | # Population | % Population |
| Asia | 9 | 0.3% |
| Brazil | 18 | 0.6% |
| Bulgaria | 44 | 1.4% |
| Caribbean | 115 | 3.7% |
| Eastern Europe | 44 | 1.4% |
| Europe | 90 | 2.9% |
| India | 9 | 0.3% |
| Ireland | 38 | 1.2% |
| Italy | 8 | 0.3% |
| Jamaica | 115 | 3.7% |
| Latin America | 133 | 4.3% |
| Northern Europe | 38 | 1.2% |
| South America | 18 | 0.6% |
| South Central Asia | 9 | 0.3% |
| Southern Europe | 8 | 0.3% | View All 15 Rows |
Sex and Age in South Dennis
Sex and Age in South Dennis
The most populous age groups in South Dennis are 40 to 44 Years (192 | 12.1%) for men and 45 to 49 Years (166 | 11.0%) for women.
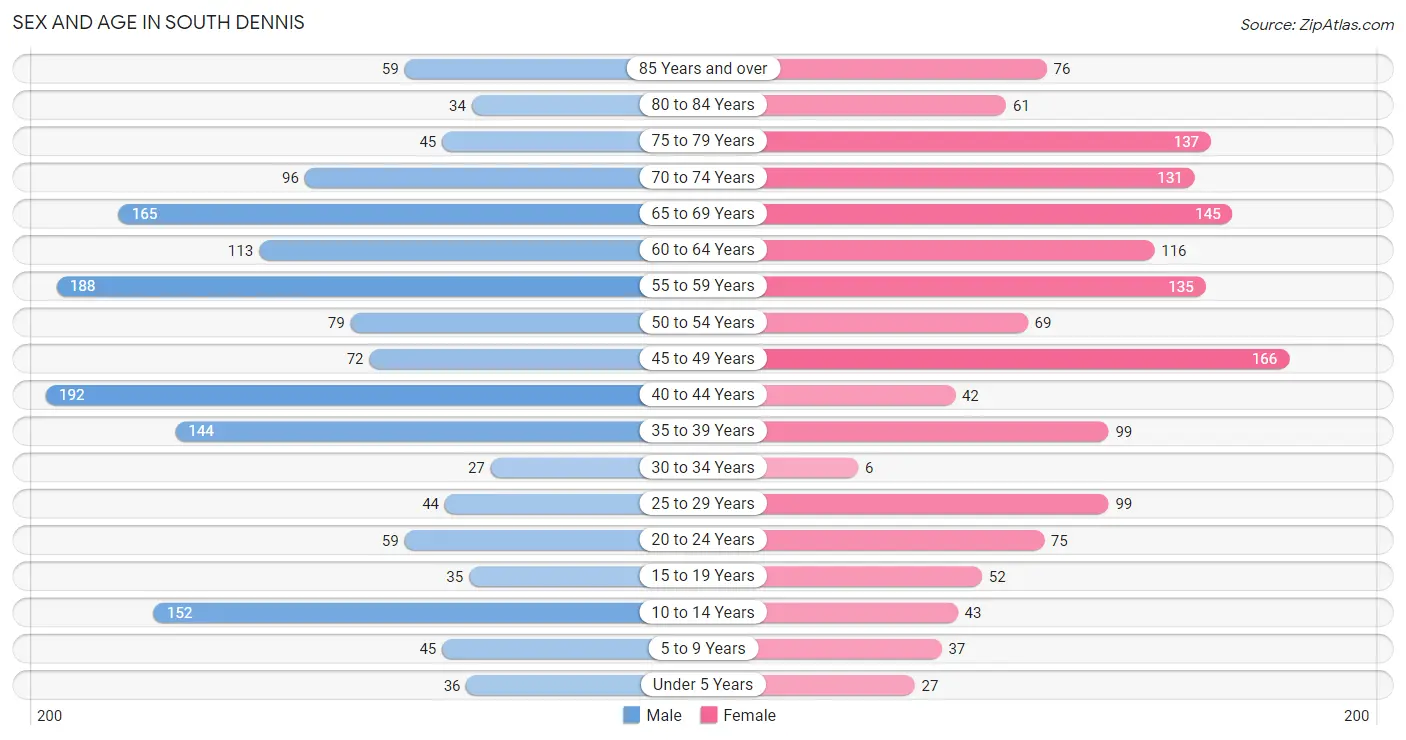
| Age Bracket | Male | Female |
| Under 5 Years | 36 (2.3%) | 27 (1.8%) |
| 5 to 9 Years | 45 (2.8%) | 37 (2.4%) |
| 10 to 14 Years | 152 (9.6%) | 43 (2.8%) |
| 15 to 19 Years | 35 (2.2%) | 52 (3.4%) |
| 20 to 24 Years | 59 (3.7%) | 75 (5.0%) |
| 25 to 29 Years | 44 (2.8%) | 99 (6.5%) |
| 30 to 34 Years | 27 (1.7%) | 6 (0.4%) |
| 35 to 39 Years | 144 (9.1%) | 99 (6.5%) |
| 40 to 44 Years | 192 (12.1%) | 42 (2.8%) |
| 45 to 49 Years | 72 (4.5%) | 166 (11.0%) |
| 50 to 54 Years | 79 (5.0%) | 69 (4.5%) |
| 55 to 59 Years | 188 (11.9%) | 135 (8.9%) |
| 60 to 64 Years | 113 (7.1%) | 116 (7.6%) |
| 65 to 69 Years | 165 (10.4%) | 145 (9.6%) |
| 70 to 74 Years | 96 (6.1%) | 131 (8.6%) |
| 75 to 79 Years | 45 (2.8%) | 137 (9.0%) |
| 80 to 84 Years | 34 (2.1%) | 61 (4.0%) |
| 85 Years and over | 59 (3.7%) | 76 (5.0%) |
| Total | 1,585 (100.0%) | 1,516 (100.0%) |
Families and Households in South Dennis
Median Family Size in South Dennis
The median family size in South Dennis is 2.75 persons per family, with single female/mother families (94 | 11.7%) accounting for the largest median family size of 2.93 persons per family. On the other hand, single male/father families (75 | 9.3%) represent the smallest median family size with 2.20 persons per family.
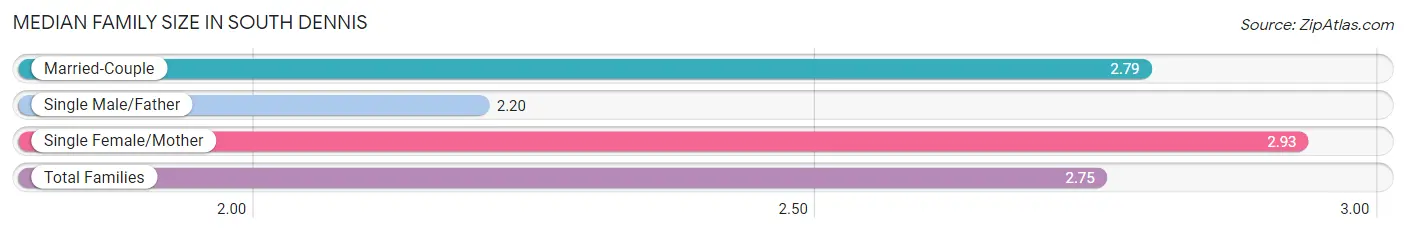
| Family Type | # Families | Family Size |
| Married-Couple | 638 (79.1%) | 2.79 |
| Single Male/Father | 75 (9.3%) | 2.20 |
| Single Female/Mother | 94 (11.7%) | 2.93 |
| Total Families | 807 (100.0%) | 2.75 |
Median Household Size in South Dennis
The median household size in South Dennis is 2.12 persons per household, with single female/mother households (94 | 6.6%) accounting for the largest median household size of 2.93 persons per household. non-family households (615 | 43.2%) represent the smallest median household size with 1.24 persons per household.
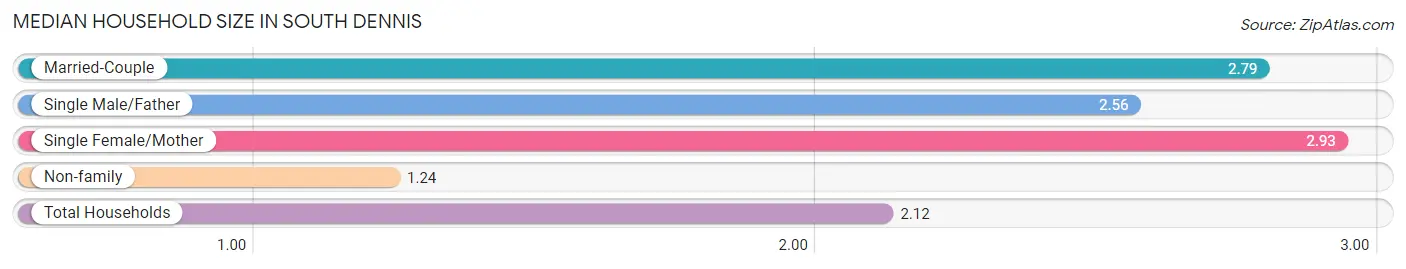
| Household Type | # Households | Household Size |
| Married-Couple | 638 (44.9%) | 2.79 |
| Single Male/Father | 75 (5.3%) | 2.56 |
| Single Female/Mother | 94 (6.6%) | 2.93 |
| Non-family | 615 (43.2%) | 1.24 |
| Total Households | 1,422 (100.0%) | 2.12 |
Household Size by Marriage Status in South Dennis
Out of a total of 1,422 households in South Dennis, 807 (56.8%) are family households, while 615 (43.2%) are nonfamily households. The most numerous type of family households are 2-person households, comprising 479, and the most common type of nonfamily households are 1-person households, comprising 477.
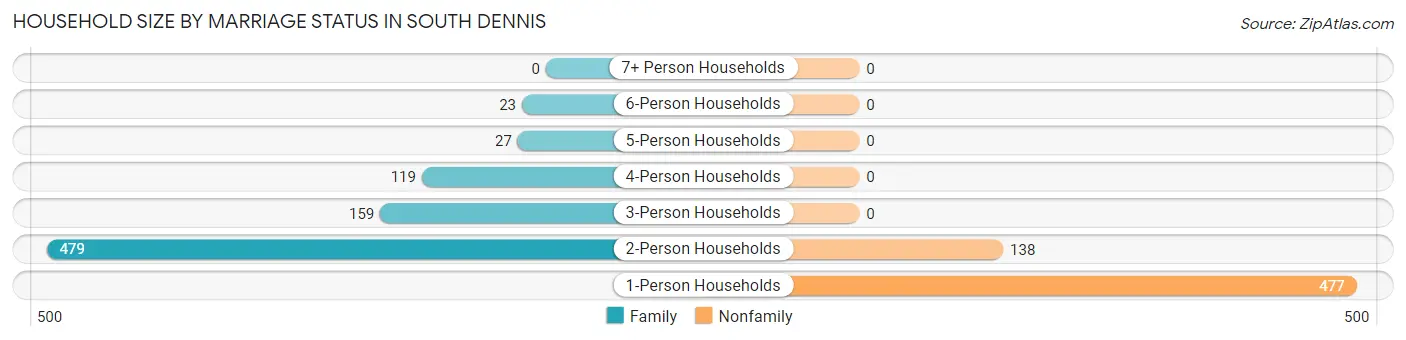
| Household Size | Family Households | Nonfamily Households |
| 1-Person Households | - | 477 (33.5%) |
| 2-Person Households | 479 (33.7%) | 138 (9.7%) |
| 3-Person Households | 159 (11.2%) | 0 (0.0%) |
| 4-Person Households | 119 (8.4%) | 0 (0.0%) |
| 5-Person Households | 27 (1.9%) | 0 (0.0%) |
| 6-Person Households | 23 (1.6%) | 0 (0.0%) |
| 7+ Person Households | 0 (0.0%) | 0 (0.0%) |
| Total | 807 (56.8%) | 615 (43.2%) |
Female Fertility in South Dennis
Fertility by Age in South Dennis
Average fertility rate in South Dennis is 85.0 births per 1,000 women. Women in the age bracket of 35 to 50 years have the highest fertility rate with 146.0 births per 1,000 women. Women in the age bracket of 35 to 50 years acount for 100.0% of all women with births.
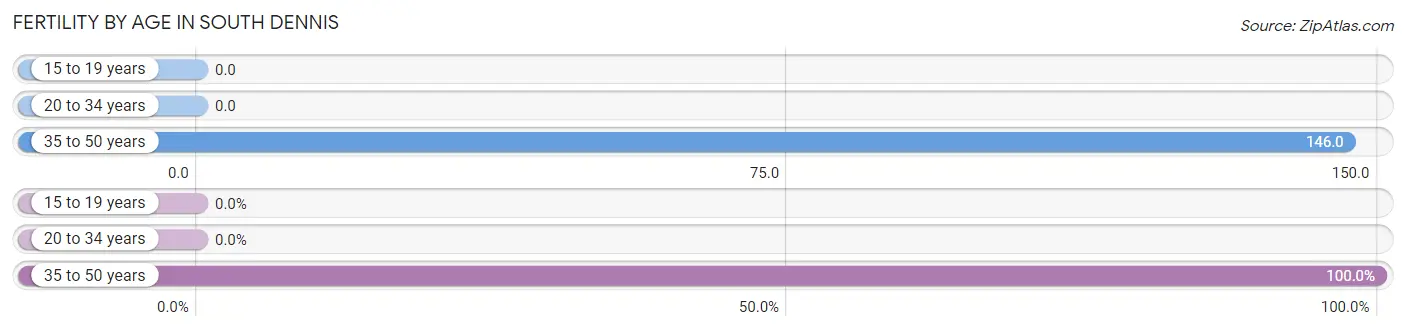
| Age Bracket | Women with Births | Births / 1,000 Women |
| 15 to 19 years | 0 (0.0%) | 0.0 |
| 20 to 34 years | 0 (0.0%) | 0.0 |
| 35 to 50 years | 47 (100.0%) | 146.0 |
| Total | 47 (100.0%) | 85.0 |
Fertility by Age by Marriage Status in South Dennis
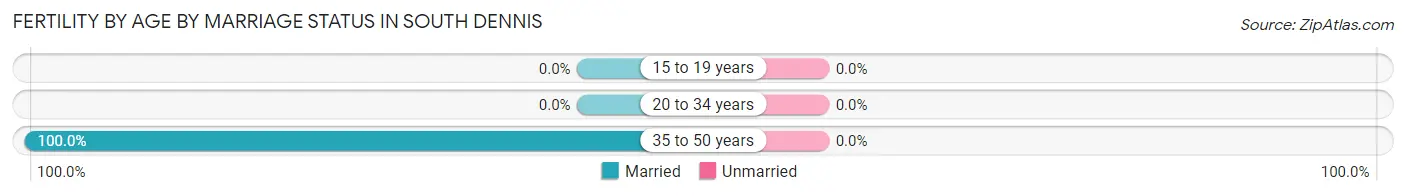
| Age Bracket | Married | Unmarried |
| 15 to 19 years | 0 (0.0%) | 0 (0.0%) |
| 20 to 34 years | 0 (0.0%) | 0 (0.0%) |
| 35 to 50 years | 47 (100.0%) | 0 (0.0%) |
| Total | 47 (100.0%) | 0 (0.0%) |
Fertility by Education in South Dennis
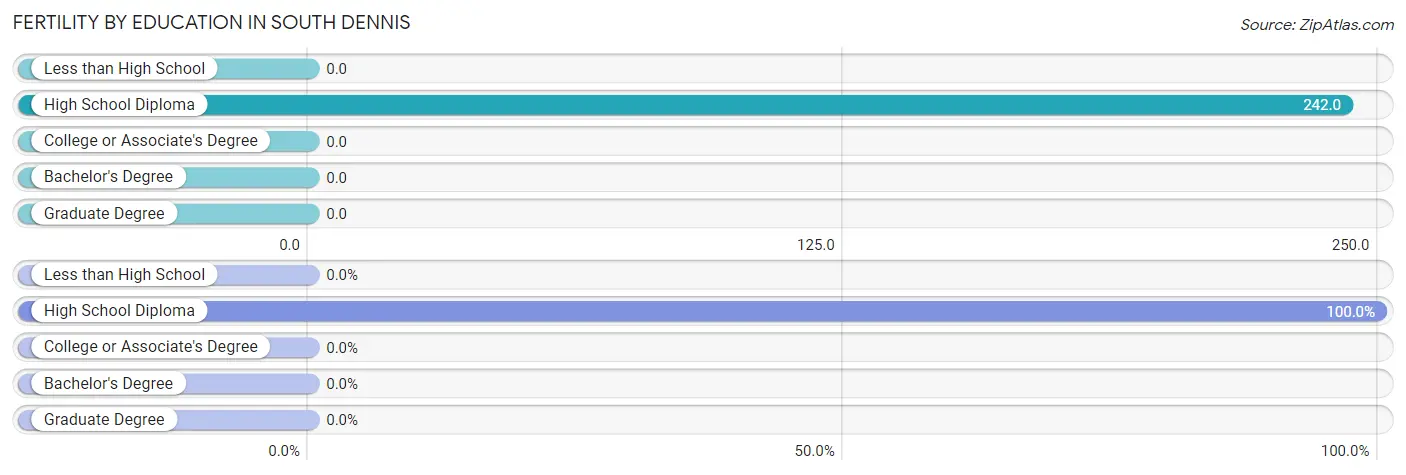
| Educational Attainment | Women with Births | Births / 1,000 Women |
| Less than High School | 0 (0.0%) | 0.0 |
| High School Diploma | 47 (100.0%) | 242.0 |
| College or Associate's Degree | 0 (0.0%) | 0.0 |
| Bachelor's Degree | 0 (0.0%) | 0.0 |
| Graduate Degree | 0 (0.0%) | 0.0 |
| Total | 47 (100.0%) | 85.0 |
Fertility by Education by Marriage Status in South Dennis
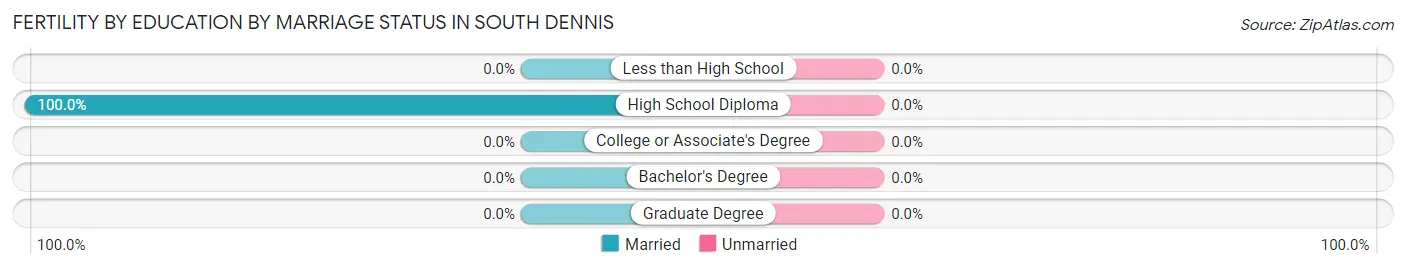
| Educational Attainment | Married | Unmarried |
| Less than High School | 0 (0.0%) | 0 (0.0%) |
| High School Diploma | 47 (100.0%) | 0 (0.0%) |
| College or Associate's Degree | 0 (0.0%) | 0 (0.0%) |
| Bachelor's Degree | 0 (0.0%) | 0 (0.0%) |
| Graduate Degree | 0 (0.0%) | 0 (0.0%) |
| Total | 47 (100.0%) | 0 (0.0%) |
Employment Characteristics in South Dennis
Employment by Class of Employer in South Dennis
Among the 1,601 employed individuals in South Dennis, private company employees (1,014 | 63.3%), local government employees (213 | 13.3%), and not-for-profit organizations (154 | 9.6%) make up the most common classes of employment.
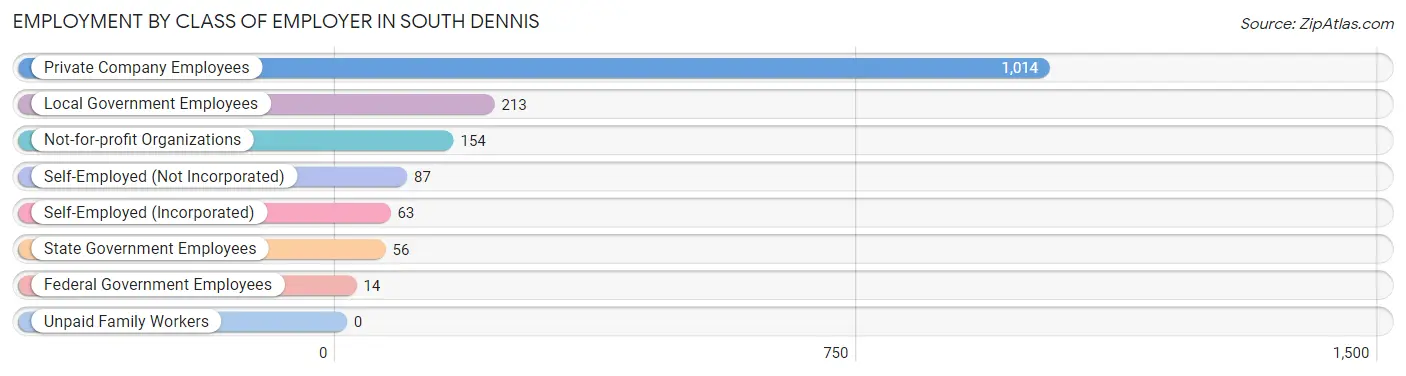
| Employer Class | # Employees | % Employees |
| Private Company Employees | 1,014 | 63.3% |
| Self-Employed (Incorporated) | 63 | 3.9% |
| Self-Employed (Not Incorporated) | 87 | 5.4% |
| Not-for-profit Organizations | 154 | 9.6% |
| Local Government Employees | 213 | 13.3% |
| State Government Employees | 56 | 3.5% |
| Federal Government Employees | 14 | 0.9% |
| Unpaid Family Workers | 0 | 0.0% |
| Total | 1,601 | 100.0% |
Employment Status by Age in South Dennis
According to the labor force statistics for South Dennis, out of the total population over 16 years of age (2,751), 61.0% or 1,678 individuals are in the labor force, with 3.0% or 50 of them unemployed. The age group with the highest labor force participation rate is 30 to 34 years, with 100.0% or 33 individuals in the labor force. Within the labor force, the 75 years and over age range has the highest percentage of unemployed individuals, with 56.9% or 29 of them being unemployed.
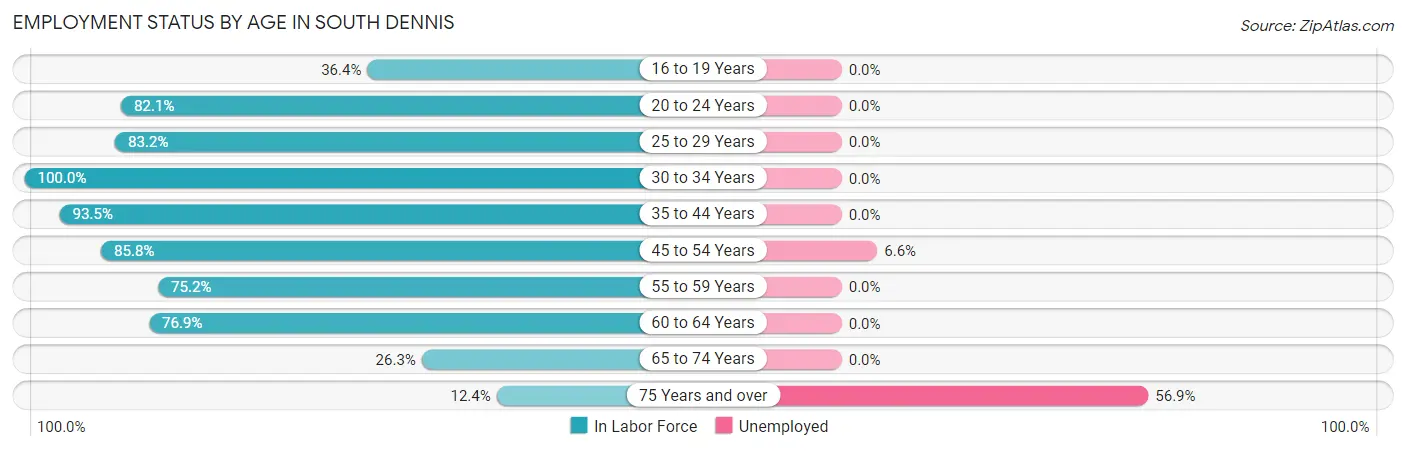
| Age Bracket | In Labor Force | Unemployed |
| 16 to 19 Years | 28 (36.4%) | 0 (0.0%) |
| 20 to 24 Years | 110 (82.1%) | 0 (0.0%) |
| 25 to 29 Years | 119 (83.2%) | 0 (0.0%) |
| 30 to 34 Years | 33 (100.0%) | 0 (0.0%) |
| 35 to 44 Years | 446 (93.5%) | 0 (0.0%) |
| 45 to 54 Years | 331 (85.8%) | 22 (6.6%) |
| 55 to 59 Years | 243 (75.2%) | 0 (0.0%) |
| 60 to 64 Years | 176 (76.9%) | 0 (0.0%) |
| 65 to 74 Years | 141 (26.3%) | 0 (0.0%) |
| 75 Years and over | 51 (12.4%) | 29 (56.9%) |
| Total | 1,678 (61.0%) | 50 (3.0%) |
Employment Status by Educational Attainment in South Dennis
According to labor force statistics for South Dennis, 84.7% of individuals (1,348) out of the total population between 25 and 64 years of age (1,591) are in the labor force, with 1.6% or 22 of them being unemployed. The group with the highest labor force participation rate are those with the educational attainment of less than high school, with 89.5% or 94 individuals in the labor force. Within the labor force, individuals with less than high school education have the highest percentage of unemployment, with 9.6% or 9 of them being unemployed.
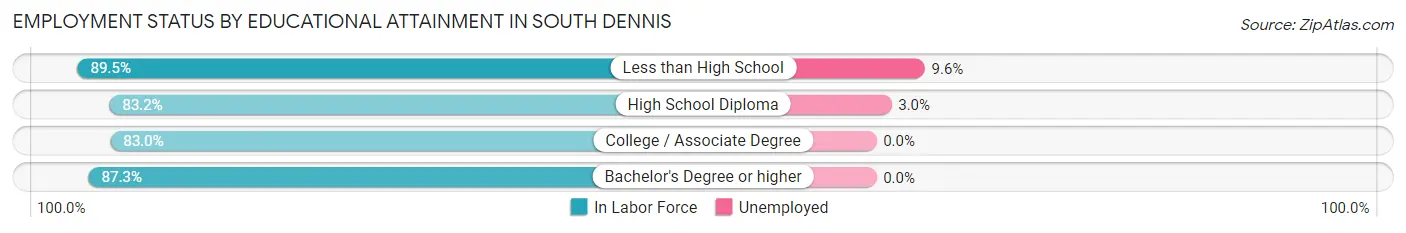
| Educational Attainment | In Labor Force | Unemployed |
| Less than High School | 94 (89.5%) | 10 (9.6%) |
| High School Diploma | 437 (83.2%) | 16 (3.0%) |
| College / Associate Degree | 424 (83.0%) | 0 (0.0%) |
| Bachelor's Degree or higher | 393 (87.3%) | 0 (0.0%) |
| Total | 1,348 (84.7%) | 25 (1.6%) |
Employment Occupations by Sex in South Dennis
Management, Business, Science and Arts Occupations
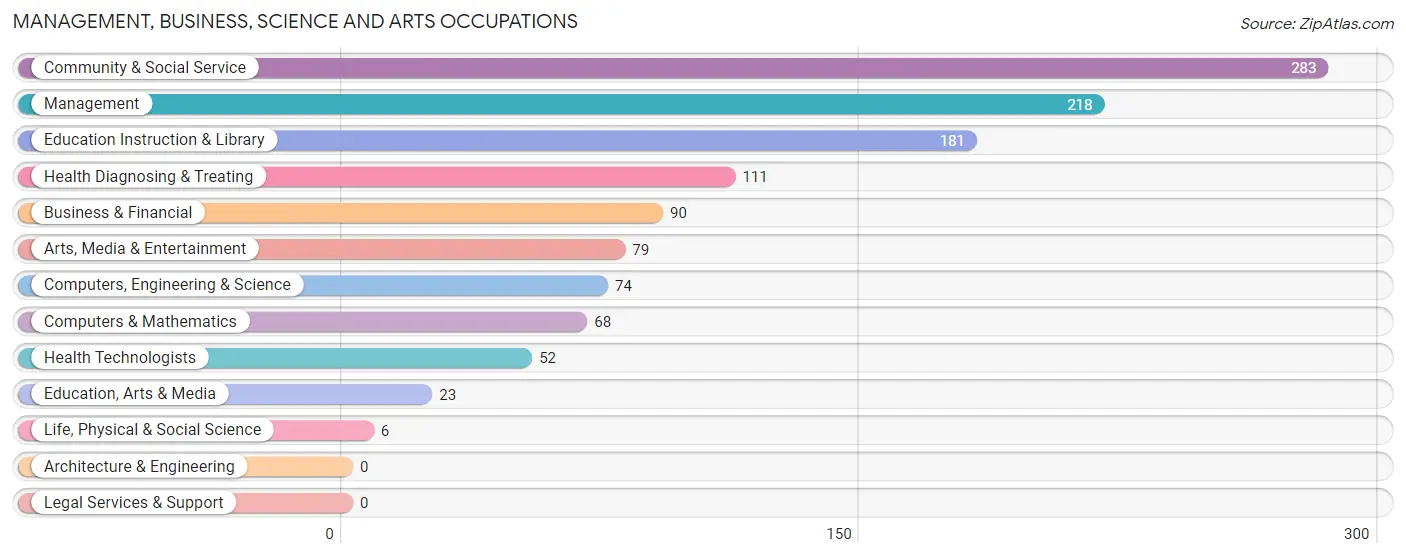
The most common Management, Business, Science and Arts occupations in South Dennis are Community & Social Service (283 | 17.4%), Management (218 | 13.4%), Education Instruction & Library (181 | 11.1%), Health Diagnosing & Treating (111 | 6.8%), and Business & Financial (90 | 5.5%).
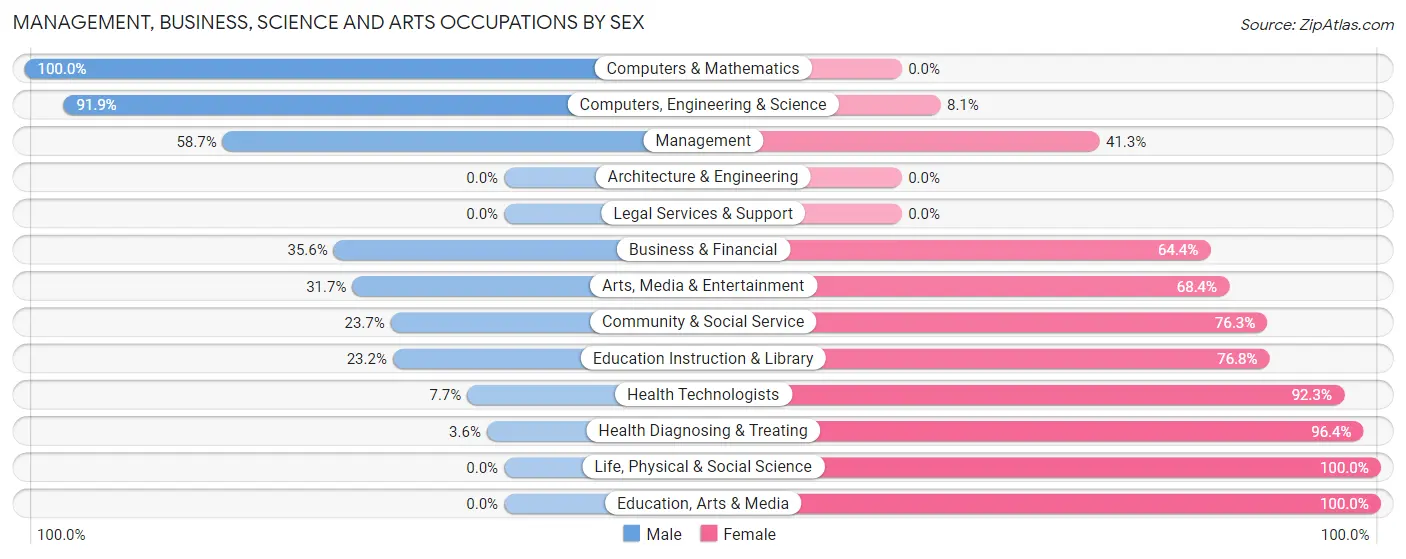
Management, Business, Science and Arts Occupations by Sex
Within the Management, Business, Science and Arts occupations in South Dennis, the most male-oriented occupations are Computers & Mathematics (100.0%), Computers, Engineering & Science (91.9%), and Management (58.7%), while the most female-oriented occupations are Life, Physical & Social Science (100.0%), Education, Arts & Media (100.0%), and Health Diagnosing & Treating (96.4%).
| Occupation | Male | Female |
| Management | 128 (58.7%) | 90 (41.3%) |
| Business & Financial | 32 (35.6%) | 58 (64.4%) |
| Computers, Engineering & Science | 68 (91.9%) | 6 (8.1%) |
| Computers & Mathematics | 68 (100.0%) | 0 (0.0%) |
| Architecture & Engineering | 0 (0.0%) | 0 (0.0%) |
| Life, Physical & Social Science | 0 (0.0%) | 6 (100.0%) |
| Community & Social Service | 67 (23.7%) | 216 (76.3%) |
| Education, Arts & Media | 0 (0.0%) | 23 (100.0%) |
| Legal Services & Support | 0 (0.0%) | 0 (0.0%) |
| Education Instruction & Library | 42 (23.2%) | 139 (76.8%) |
| Arts, Media & Entertainment | 25 (31.7%) | 54 (68.3%) |
| Health Diagnosing & Treating | 4 (3.6%) | 107 (96.4%) |
| Health Technologists | 4 (7.7%) | 48 (92.3%) |
| Total (Category) | 299 (38.5%) | 477 (61.5%) |
| Total (Overall) | 880 (54.1%) | 747 (45.9%) |
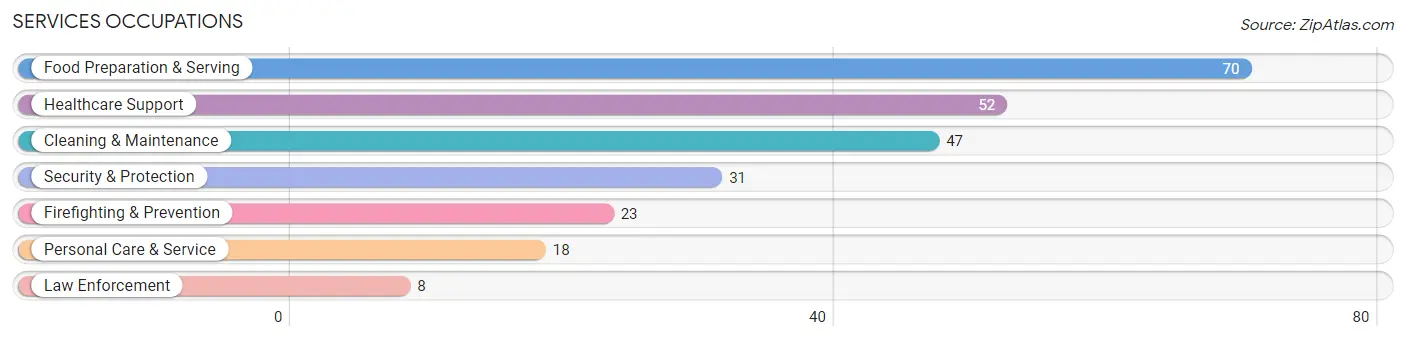
Services Occupations
The most common Services occupations in South Dennis are Food Preparation & Serving (70 | 4.3%), Healthcare Support (52 | 3.2%), Cleaning & Maintenance (47 | 2.9%), Security & Protection (31 | 1.9%), and Firefighting & Prevention (23 | 1.4%).
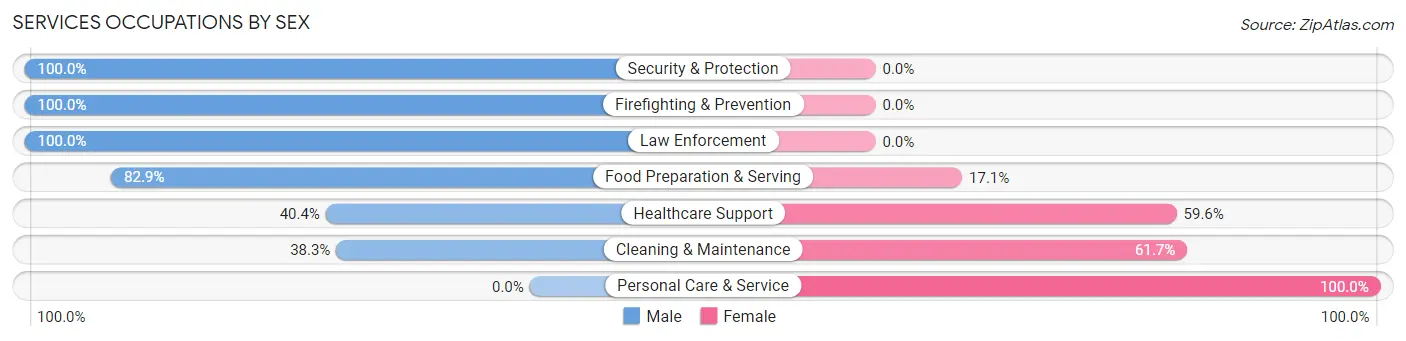
Services Occupations by Sex
Within the Services occupations in South Dennis, the most male-oriented occupations are Security & Protection (100.0%), Firefighting & Prevention (100.0%), and Law Enforcement (100.0%), while the most female-oriented occupations are Personal Care & Service (100.0%), Cleaning & Maintenance (61.7%), and Healthcare Support (59.6%).
| Occupation | Male | Female |
| Healthcare Support | 21 (40.4%) | 31 (59.6%) |
| Security & Protection | 31 (100.0%) | 0 (0.0%) |
| Firefighting & Prevention | 23 (100.0%) | 0 (0.0%) |
| Law Enforcement | 8 (100.0%) | 0 (0.0%) |
| Food Preparation & Serving | 58 (82.9%) | 12 (17.1%) |
| Cleaning & Maintenance | 18 (38.3%) | 29 (61.7%) |
| Personal Care & Service | 0 (0.0%) | 18 (100.0%) |
| Total (Category) | 128 (58.7%) | 90 (41.3%) |
| Total (Overall) | 880 (54.1%) | 747 (45.9%) |
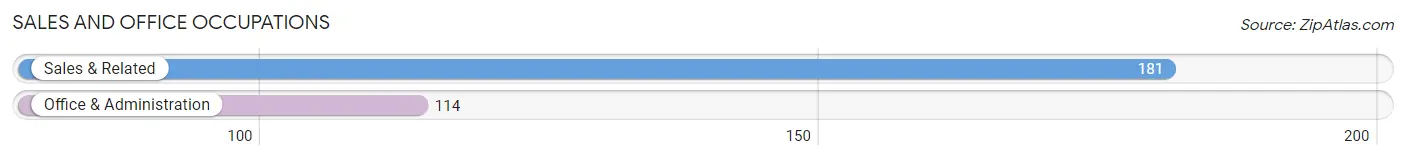
Sales and Office Occupations
The most common Sales and Office occupations in South Dennis are Sales & Related (181 | 11.1%), and Office & Administration (114 | 7.0%).
Sales and Office Occupations by Sex
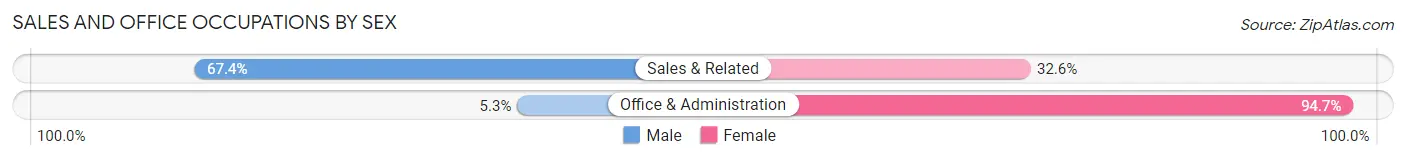
| Occupation | Male | Female |
| Sales & Related | 122 (67.4%) | 59 (32.6%) |
| Office & Administration | 6 (5.3%) | 108 (94.7%) |
| Total (Category) | 128 (43.4%) | 167 (56.6%) |
| Total (Overall) | 880 (54.1%) | 747 (45.9%) |
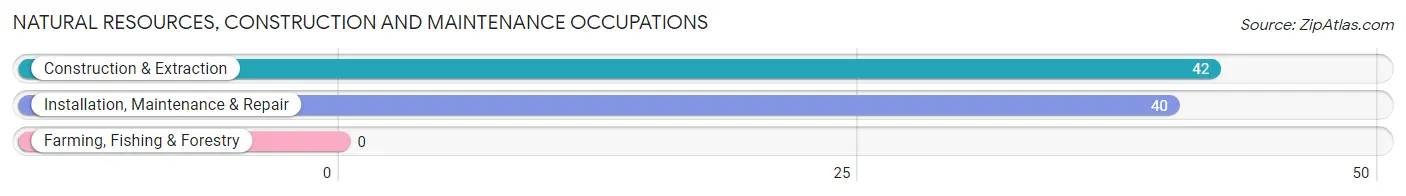
Natural Resources, Construction and Maintenance Occupations
The most common Natural Resources, Construction and Maintenance occupations in South Dennis are Construction & Extraction (42 | 2.6%), and Installation, Maintenance & Repair (40 | 2.5%).
Natural Resources, Construction and Maintenance Occupations by Sex
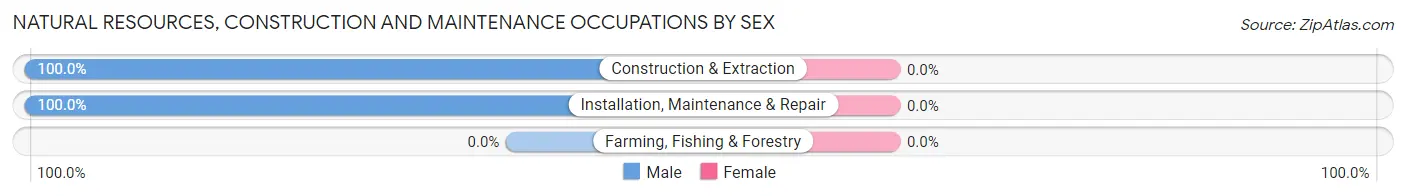
| Occupation | Male | Female |
| Farming, Fishing & Forestry | 0 (0.0%) | 0 (0.0%) |
| Construction & Extraction | 42 (100.0%) | 0 (0.0%) |
| Installation, Maintenance & Repair | 40 (100.0%) | 0 (0.0%) |
| Total (Category) | 82 (100.0%) | 0 (0.0%) |
| Total (Overall) | 880 (54.1%) | 747 (45.9%) |
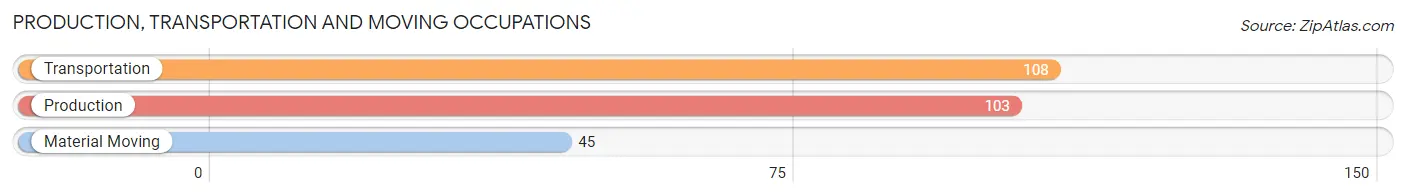
Production, Transportation and Moving Occupations
The most common Production, Transportation and Moving occupations in South Dennis are Transportation (108 | 6.6%), Production (103 | 6.3%), and Material Moving (45 | 2.8%).
Production, Transportation and Moving Occupations by Sex
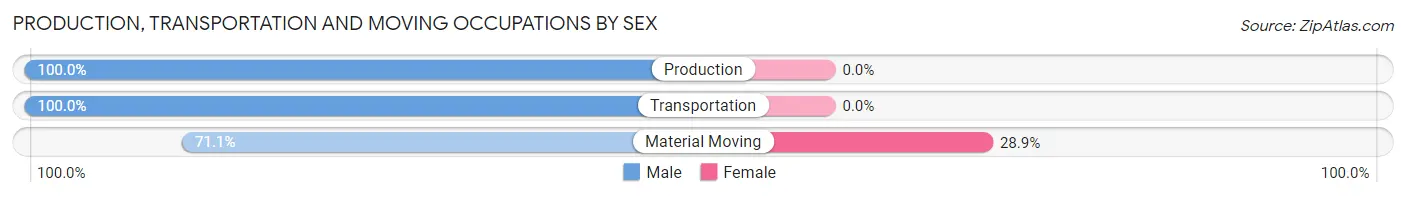
| Occupation | Male | Female |
| Production | 103 (100.0%) | 0 (0.0%) |
| Transportation | 108 (100.0%) | 0 (0.0%) |
| Material Moving | 32 (71.1%) | 13 (28.9%) |
| Total (Category) | 243 (94.9%) | 13 (5.1%) |
| Total (Overall) | 880 (54.1%) | 747 (45.9%) |
Employment Industries by Sex in South Dennis
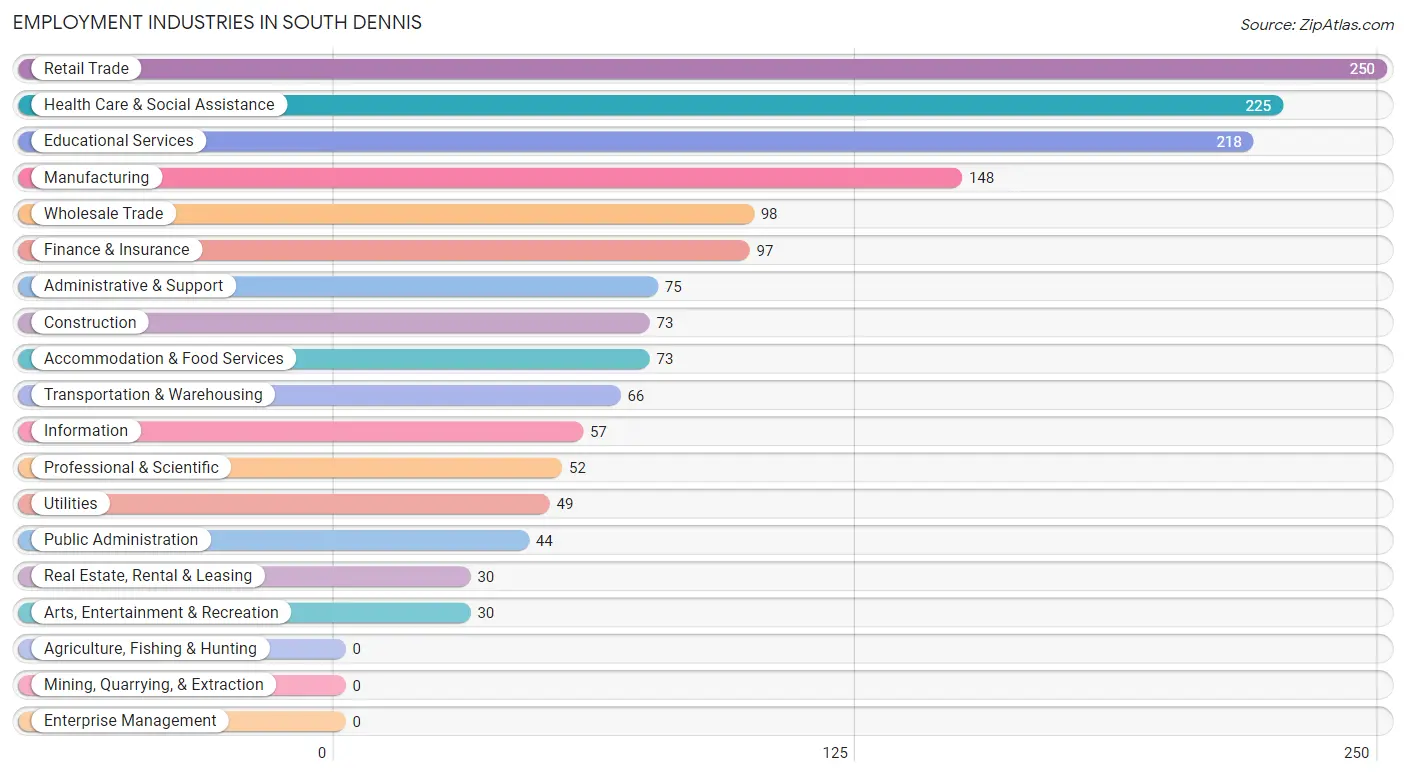
Employment Industries in South Dennis
The major employment industries in South Dennis include Retail Trade (250 | 15.4%), Health Care & Social Assistance (225 | 13.8%), Educational Services (218 | 13.4%), Manufacturing (148 | 9.1%), and Wholesale Trade (98 | 6.0%).
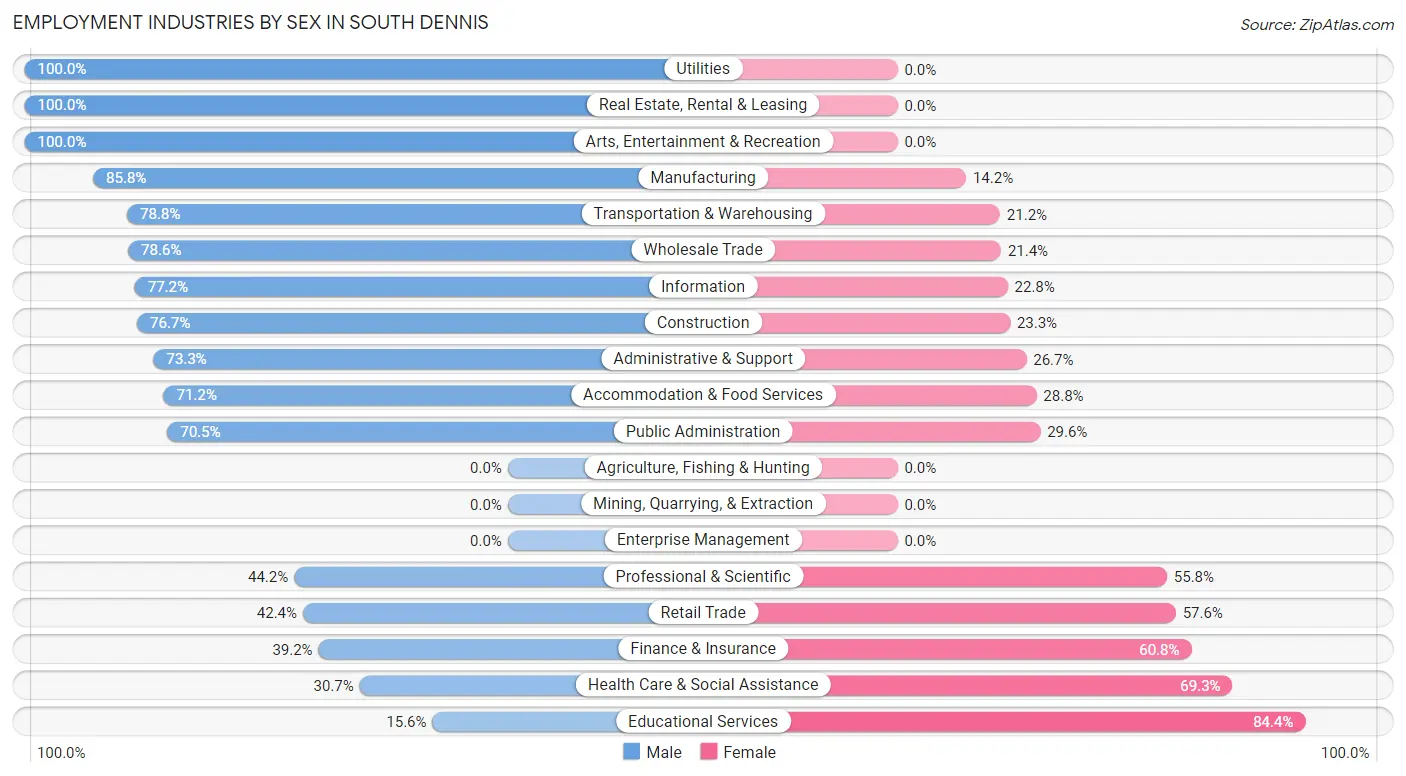
Employment Industries by Sex in South Dennis
The South Dennis industries that see more men than women are Utilities (100.0%), Real Estate, Rental & Leasing (100.0%), and Arts, Entertainment & Recreation (100.0%), whereas the industries that tend to have a higher number of women are Educational Services (84.4%), Health Care & Social Assistance (69.3%), and Finance & Insurance (60.8%).
| Industry | Male | Female |
| Agriculture, Fishing & Hunting | 0 (0.0%) | 0 (0.0%) |
| Mining, Quarrying, & Extraction | 0 (0.0%) | 0 (0.0%) |
| Construction | 56 (76.7%) | 17 (23.3%) |
| Manufacturing | 127 (85.8%) | 21 (14.2%) |
| Wholesale Trade | 77 (78.6%) | 21 (21.4%) |
| Retail Trade | 106 (42.4%) | 144 (57.6%) |
| Transportation & Warehousing | 52 (78.8%) | 14 (21.2%) |
| Utilities | 49 (100.0%) | 0 (0.0%) |
| Information | 44 (77.2%) | 13 (22.8%) |
| Finance & Insurance | 38 (39.2%) | 59 (60.8%) |
| Real Estate, Rental & Leasing | 30 (100.0%) | 0 (0.0%) |
| Professional & Scientific | 23 (44.2%) | 29 (55.8%) |
| Enterprise Management | 0 (0.0%) | 0 (0.0%) |
| Administrative & Support | 55 (73.3%) | 20 (26.7%) |
| Educational Services | 34 (15.6%) | 184 (84.4%) |
| Health Care & Social Assistance | 69 (30.7%) | 156 (69.3%) |
| Arts, Entertainment & Recreation | 30 (100.0%) | 0 (0.0%) |
| Accommodation & Food Services | 52 (71.2%) | 21 (28.8%) |
| Public Administration | 31 (70.5%) | 13 (29.5%) |
| Total | 880 (54.1%) | 747 (45.9%) |
Education in South Dennis
School Enrollment in South Dennis
The most common levels of schooling among the 416 students in South Dennis are middle school (195 | 46.9%), college / undergraduate (77 | 18.5%), and high school (44 | 10.6%).
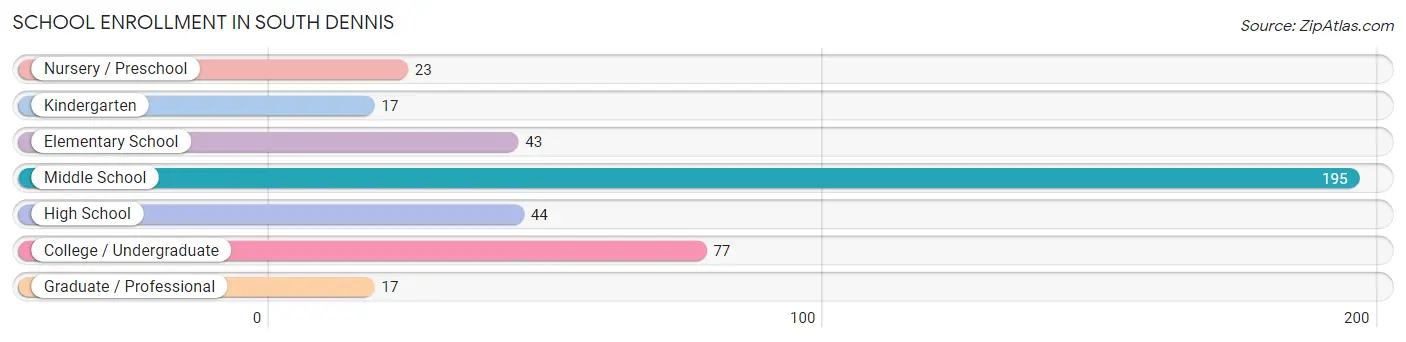
| School Level | # Students | % Students |
| Nursery / Preschool | 23 | 5.5% |
| Kindergarten | 17 | 4.1% |
| Elementary School | 43 | 10.3% |
| Middle School | 195 | 46.9% |
| High School | 44 | 10.6% |
| College / Undergraduate | 77 | 18.5% |
| Graduate / Professional | 17 | 4.1% |
| Total | 416 | 100.0% |
School Enrollment by Age by Funding Source in South Dennis
Out of a total of 416 students who are enrolled in schools in South Dennis, 78 (18.8%) attend a private institution, while the remaining 338 (81.2%) are enrolled in public schools. The age group of 3 to 4 year olds has the highest likelihood of being enrolled in private schools, with 7 (100.0% in the age bracket) enrolled. Conversely, the age group of 10 to 14 year olds has the lowest likelihood of being enrolled in a private school, with 195 (100.0% in the age bracket) attending a public institution.
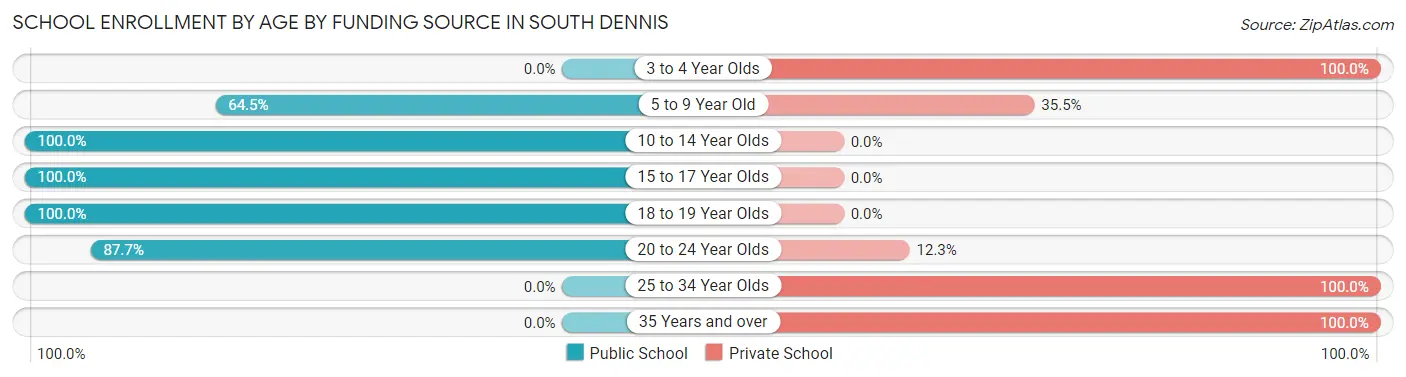
| Age Bracket | Public School | Private School |
| 3 to 4 Year Olds | 0 (0.0%) | 7 (100.0%) |
| 5 to 9 Year Old | 49 (64.5%) | 27 (35.5%) |
| 10 to 14 Year Olds | 195 (100.0%) | 0 (0.0%) |
| 15 to 17 Year Olds | 20 (100.0%) | 0 (0.0%) |
| 18 to 19 Year Olds | 24 (100.0%) | 0 (0.0%) |
| 20 to 24 Year Olds | 50 (87.7%) | 7 (12.3%) |
| 25 to 34 Year Olds | 0 (0.0%) | 17 (100.0%) |
| 35 Years and over | 0 (0.0%) | 20 (100.0%) |
| Total | 338 (81.3%) | 78 (18.8%) |
Educational Attainment by Field of Study in South Dennis
Business (247 | 26.2%), education (206 | 21.8%), science & technology (89 | 9.4%), visual & performing arts (71 | 7.5%), and engineering (55 | 5.8%) are the most common fields of study among 943 individuals in South Dennis who have obtained a bachelor's degree or higher.
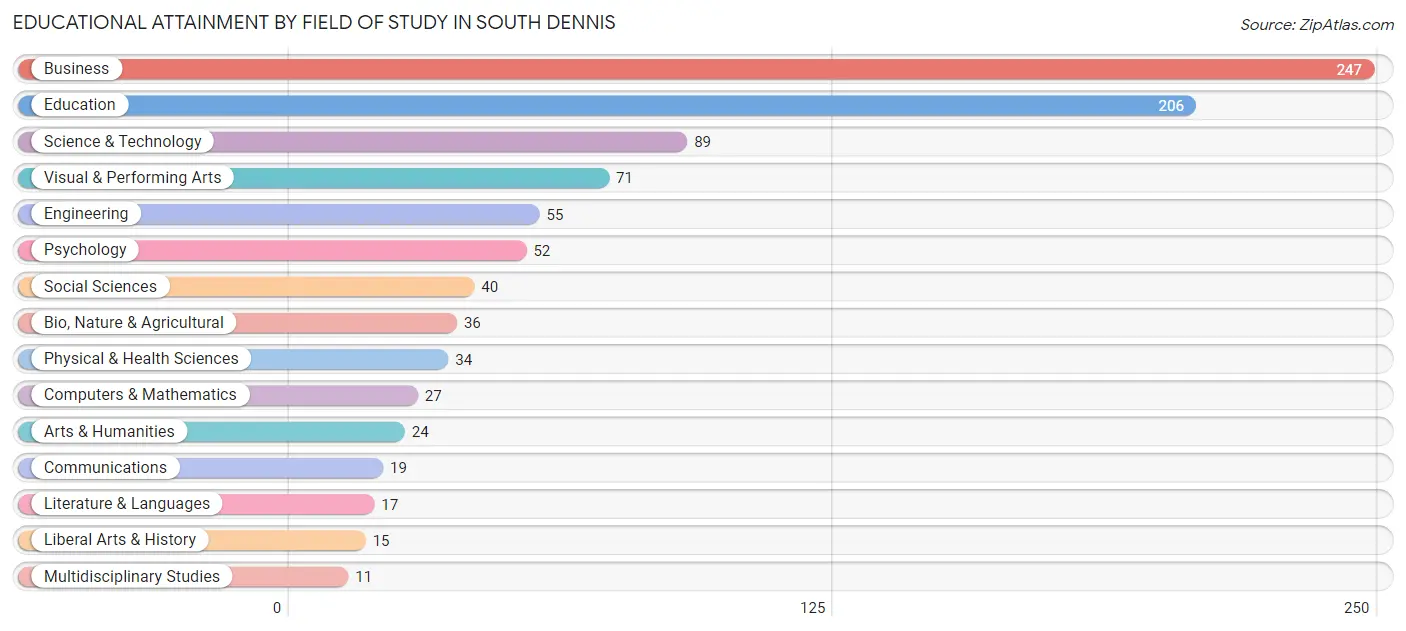
| Field of Study | # Graduates | % Graduates |
| Computers & Mathematics | 27 | 2.9% |
| Bio, Nature & Agricultural | 36 | 3.8% |
| Physical & Health Sciences | 34 | 3.6% |
| Psychology | 52 | 5.5% |
| Social Sciences | 40 | 4.2% |
| Engineering | 55 | 5.8% |
| Multidisciplinary Studies | 11 | 1.2% |
| Science & Technology | 89 | 9.4% |
| Business | 247 | 26.2% |
| Education | 206 | 21.8% |
| Literature & Languages | 17 | 1.8% |
| Liberal Arts & History | 15 | 1.6% |
| Visual & Performing Arts | 71 | 7.5% |
| Communications | 19 | 2.0% |
| Arts & Humanities | 24 | 2.5% |
| Total | 943 | 100.0% |
Transportation & Commute in South Dennis
Vehicle Availability by Sex in South Dennis
The most prevalent vehicle ownership categories in South Dennis are males with 2 vehicles (454, accounting for 53.2%) and females with 2 vehicles (352, making up 60.8%).
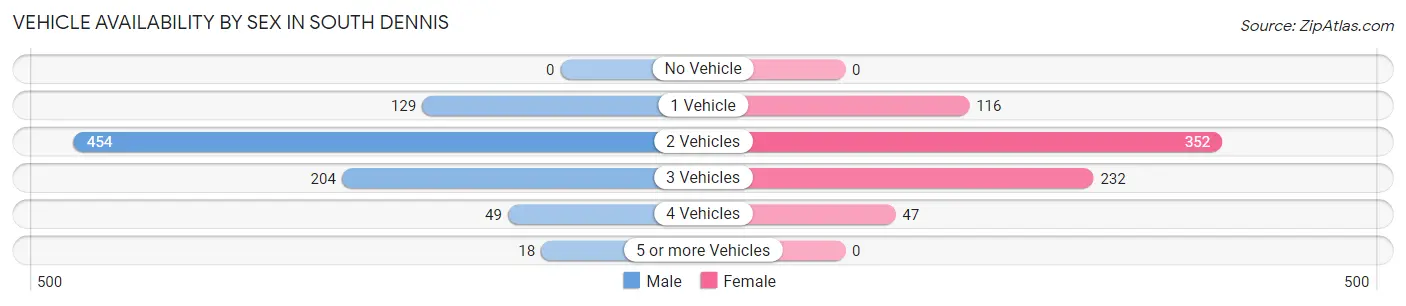
| Vehicles Available | Male | Female |
| No Vehicle | 0 (0.0%) | 0 (0.0%) |
| 1 Vehicle | 129 (15.1%) | 116 (15.5%) |
| 2 Vehicles | 454 (53.2%) | 352 (47.1%) |
| 3 Vehicles | 204 (23.9%) | 232 (31.1%) |
| 4 Vehicles | 49 (5.7%) | 47 (6.3%) |
| 5 or more Vehicles | 18 (2.1%) | 0 (0.0%) |
| Total | 854 (100.0%) | 747 (100.0%) |
Commute Time in South Dennis
The most frequently occuring commute durations in South Dennis are 10 to 14 minutes (329 commuters, 21.8%), 15 to 19 minutes (234 commuters, 15.5%), and 5 to 9 minutes (233 commuters, 15.5%).
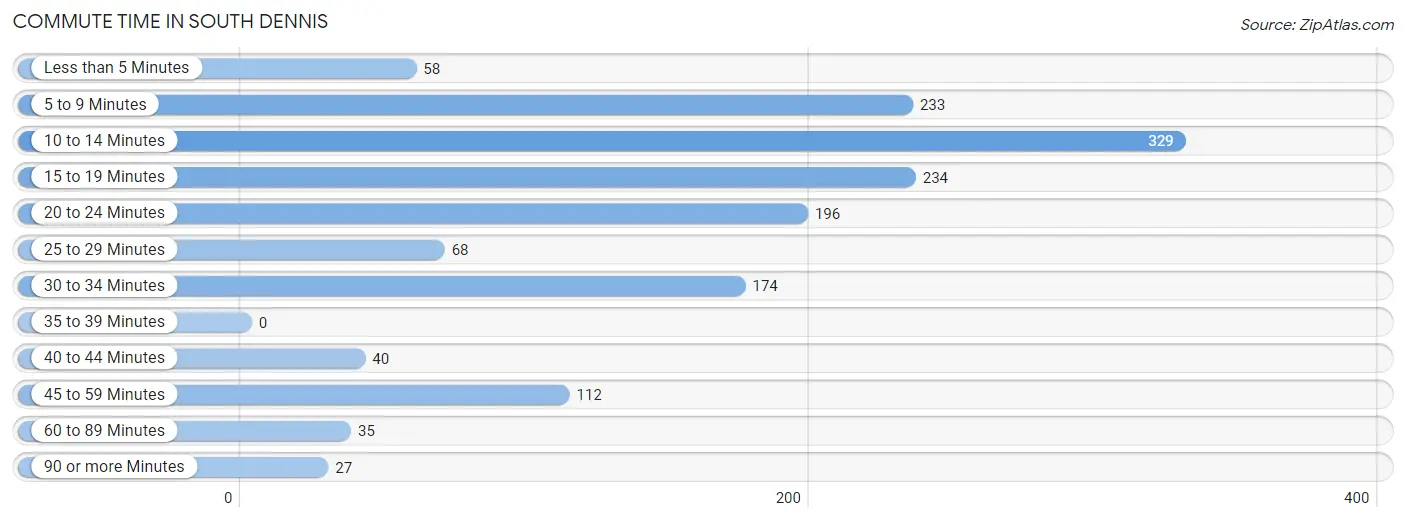
| Commute Time | # Commuters | % Commuters |
| Less than 5 Minutes | 58 | 3.8% |
| 5 to 9 Minutes | 233 | 15.5% |
| 10 to 14 Minutes | 329 | 21.8% |
| 15 to 19 Minutes | 234 | 15.5% |
| 20 to 24 Minutes | 196 | 13.0% |
| 25 to 29 Minutes | 68 | 4.5% |
| 30 to 34 Minutes | 174 | 11.6% |
| 35 to 39 Minutes | 0 | 0.0% |
| 40 to 44 Minutes | 40 | 2.7% |
| 45 to 59 Minutes | 112 | 7.4% |
| 60 to 89 Minutes | 35 | 2.3% |
| 90 or more Minutes | 27 | 1.8% |
Commute Time by Sex in South Dennis
The most common commute times in South Dennis are 5 to 9 minutes (176 commuters, 20.9%) for males and 10 to 14 minutes (190 commuters, 28.6%) for females.
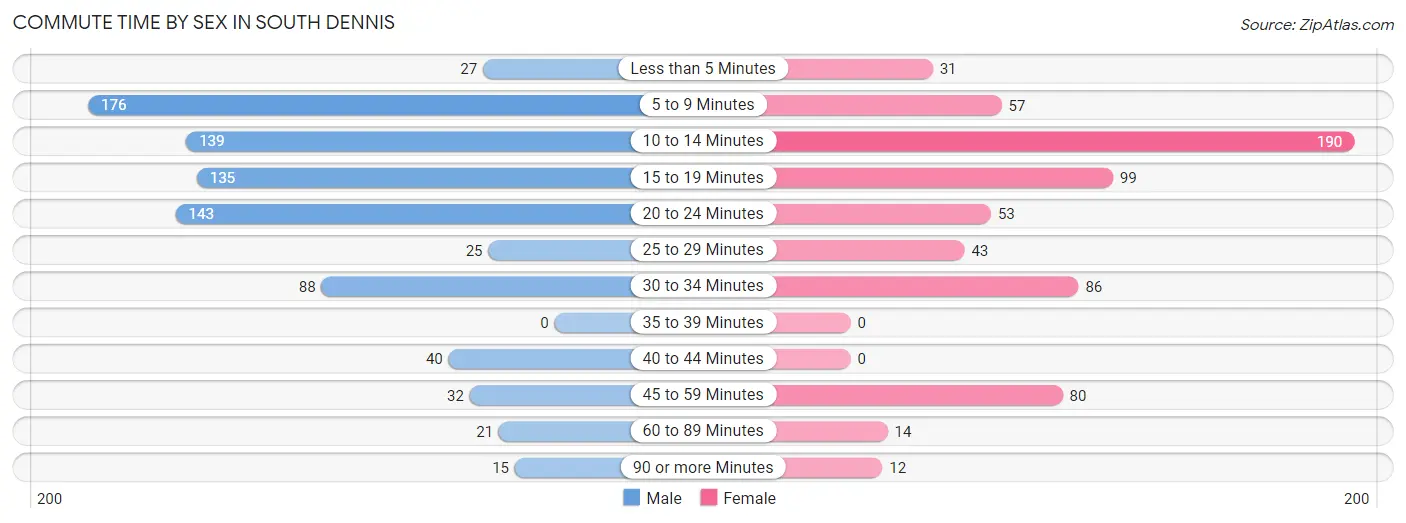
| Commute Time | Male | Female |
| Less than 5 Minutes | 27 (3.2%) | 31 (4.7%) |
| 5 to 9 Minutes | 176 (20.9%) | 57 (8.6%) |
| 10 to 14 Minutes | 139 (16.5%) | 190 (28.6%) |
| 15 to 19 Minutes | 135 (16.1%) | 99 (14.9%) |
| 20 to 24 Minutes | 143 (17.0%) | 53 (8.0%) |
| 25 to 29 Minutes | 25 (3.0%) | 43 (6.5%) |
| 30 to 34 Minutes | 88 (10.5%) | 86 (12.9%) |
| 35 to 39 Minutes | 0 (0.0%) | 0 (0.0%) |
| 40 to 44 Minutes | 40 (4.8%) | 0 (0.0%) |
| 45 to 59 Minutes | 32 (3.8%) | 80 (12.0%) |
| 60 to 89 Minutes | 21 (2.5%) | 14 (2.1%) |
| 90 or more Minutes | 15 (1.8%) | 12 (1.8%) |
Time of Departure to Work by Sex in South Dennis
The most frequent times of departure to work in South Dennis are 6:30 AM to 6:59 AM (181, 21.5%) for males and 8:30 AM to 8:59 AM (152, 22.9%) for females.
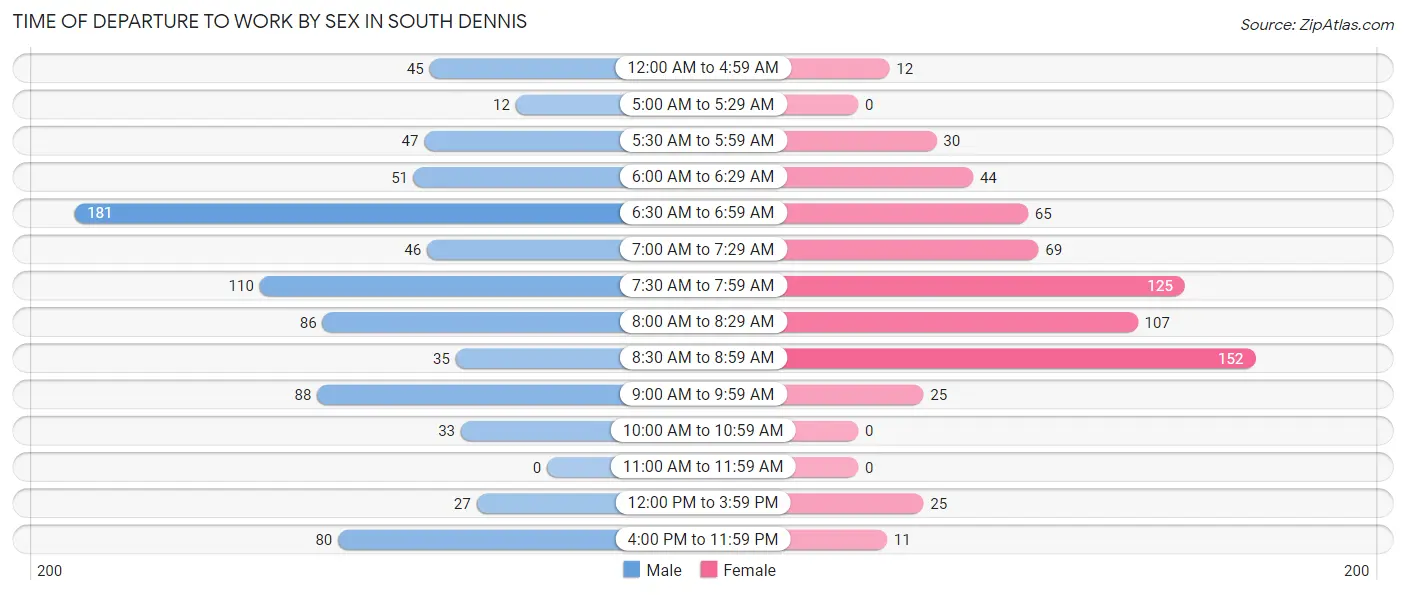
| Time of Departure | Male | Female |
| 12:00 AM to 4:59 AM | 45 (5.3%) | 12 (1.8%) |
| 5:00 AM to 5:29 AM | 12 (1.4%) | 0 (0.0%) |
| 5:30 AM to 5:59 AM | 47 (5.6%) | 30 (4.5%) |
| 6:00 AM to 6:29 AM | 51 (6.1%) | 44 (6.6%) |
| 6:30 AM to 6:59 AM | 181 (21.5%) | 65 (9.8%) |
| 7:00 AM to 7:29 AM | 46 (5.5%) | 69 (10.4%) |
| 7:30 AM to 7:59 AM | 110 (13.1%) | 125 (18.8%) |
| 8:00 AM to 8:29 AM | 86 (10.2%) | 107 (16.1%) |
| 8:30 AM to 8:59 AM | 35 (4.2%) | 152 (22.9%) |
| 9:00 AM to 9:59 AM | 88 (10.5%) | 25 (3.8%) |
| 10:00 AM to 10:59 AM | 33 (3.9%) | 0 (0.0%) |
| 11:00 AM to 11:59 AM | 0 (0.0%) | 0 (0.0%) |
| 12:00 PM to 3:59 PM | 27 (3.2%) | 25 (3.8%) |
| 4:00 PM to 11:59 PM | 80 (9.5%) | 11 (1.7%) |
| Total | 841 (100.0%) | 665 (100.0%) |
Housing Occupancy in South Dennis
Occupancy by Ownership in South Dennis
Of the total 1,422 dwellings in South Dennis, owner-occupied units account for 1,182 (83.1%), while renter-occupied units make up 240 (16.9%).
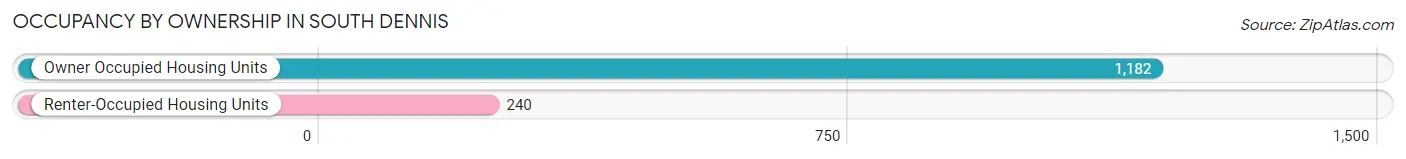
| Occupancy | # Housing Units | % Housing Units |
| Owner Occupied Housing Units | 1,182 | 83.1% |
| Renter-Occupied Housing Units | 240 | 16.9% |
| Total Occupied Housing Units | 1,422 | 100.0% |
Occupancy by Household Size in South Dennis
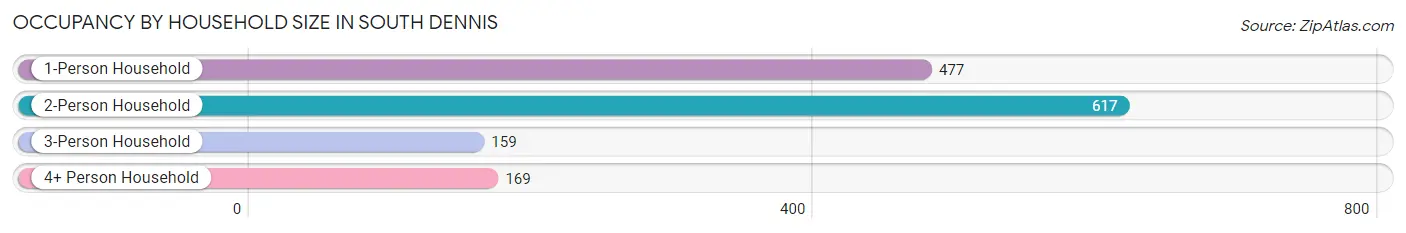
| Household Size | # Housing Units | % Housing Units |
| 1-Person Household | 477 | 33.5% |
| 2-Person Household | 617 | 43.4% |
| 3-Person Household | 159 | 11.2% |
| 4+ Person Household | 169 | 11.9% |
| Total Housing Units | 1,422 | 100.0% |
Occupancy by Ownership by Household Size in South Dennis
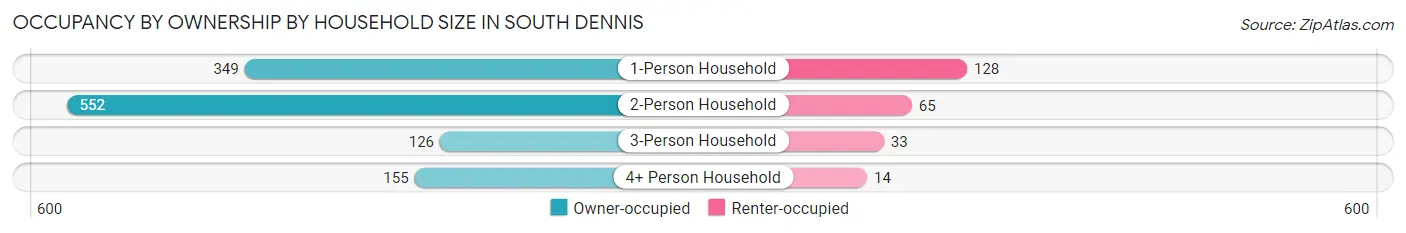
| Household Size | Owner-occupied | Renter-occupied |
| 1-Person Household | 349 (73.2%) | 128 (26.8%) |
| 2-Person Household | 552 (89.5%) | 65 (10.5%) |
| 3-Person Household | 126 (79.2%) | 33 (20.7%) |
| 4+ Person Household | 155 (91.7%) | 14 (8.3%) |
| Total Housing Units | 1,182 (83.1%) | 240 (16.9%) |
Occupancy by Educational Attainment in South Dennis
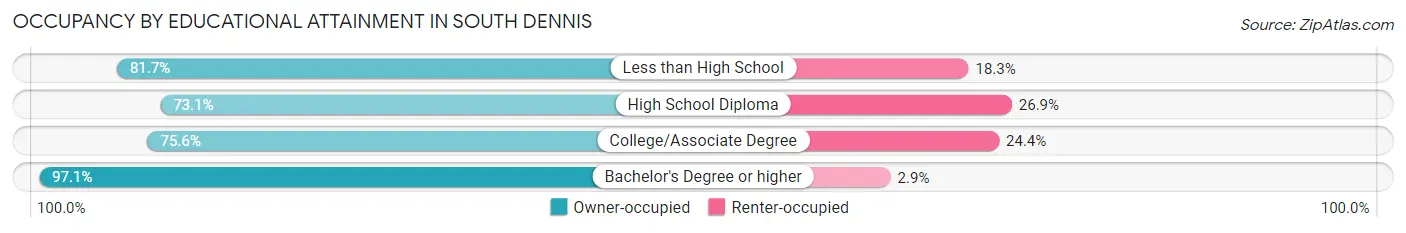
| Household Size | Owner-occupied | Renter-occupied |
| Less than High School | 58 (81.7%) | 13 (18.3%) |
| High School Diploma | 288 (73.1%) | 106 (26.9%) |
| College/Associate Degree | 329 (75.6%) | 106 (24.4%) |
| Bachelor's Degree or higher | 507 (97.1%) | 15 (2.9%) |
Occupancy by Age of Householder in South Dennis
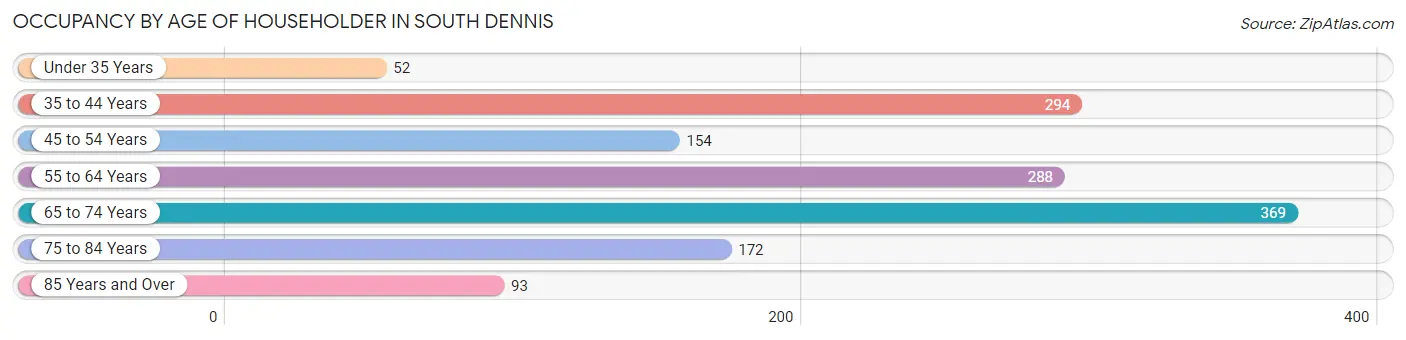
| Age Bracket | # Households | % Households |
| Under 35 Years | 52 | 3.7% |
| 35 to 44 Years | 294 | 20.7% |
| 45 to 54 Years | 154 | 10.8% |
| 55 to 64 Years | 288 | 20.3% |
| 65 to 74 Years | 369 | 26.0% |
| 75 to 84 Years | 172 | 12.1% |
| 85 Years and Over | 93 | 6.5% |
| Total | 1,422 | 100.0% |
Housing Finances in South Dennis
Median Income by Occupancy in South Dennis
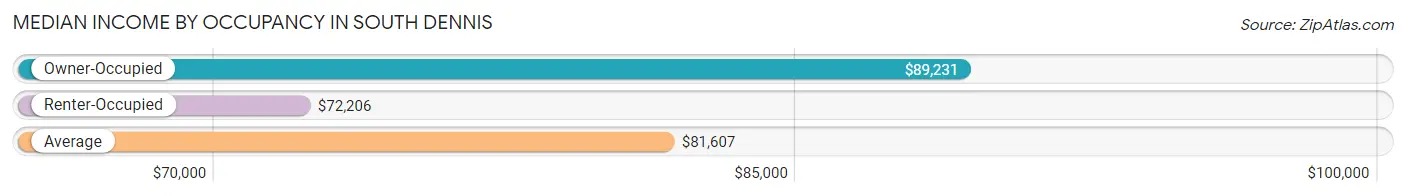
| Occupancy Type | # Households | Median Income |
| Owner-Occupied | 1,182 (83.1%) | $89,231 |
| Renter-Occupied | 240 (16.9%) | $72,206 |
| Average | 1,422 (100.0%) | $81,607 |
Occupancy by Householder Income Bracket in South Dennis
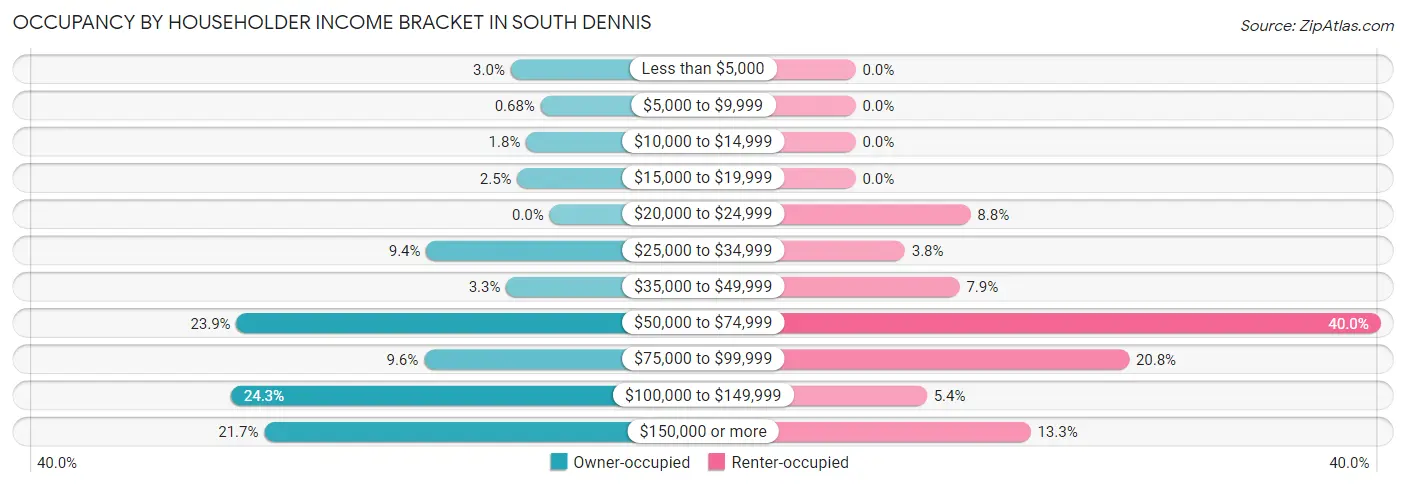
| Income Bracket | Owner-occupied | Renter-occupied |
| Less than $5,000 | 35 (3.0%) | 0 (0.0%) |
| $5,000 to $9,999 | 8 (0.7%) | 0 (0.0%) |
| $10,000 to $14,999 | 21 (1.8%) | 0 (0.0%) |
| $15,000 to $19,999 | 29 (2.5%) | 0 (0.0%) |
| $20,000 to $24,999 | 0 (0.0%) | 21 (8.7%) |
| $25,000 to $34,999 | 111 (9.4%) | 9 (3.7%) |
| $35,000 to $49,999 | 39 (3.3%) | 19 (7.9%) |
| $50,000 to $74,999 | 282 (23.9%) | 96 (40.0%) |
| $75,000 to $99,999 | 113 (9.6%) | 50 (20.8%) |
| $100,000 to $149,999 | 287 (24.3%) | 13 (5.4%) |
| $150,000 or more | 257 (21.7%) | 32 (13.3%) |
| Total | 1,182 (100.0%) | 240 (100.0%) |
Monthly Housing Cost Tiers in South Dennis
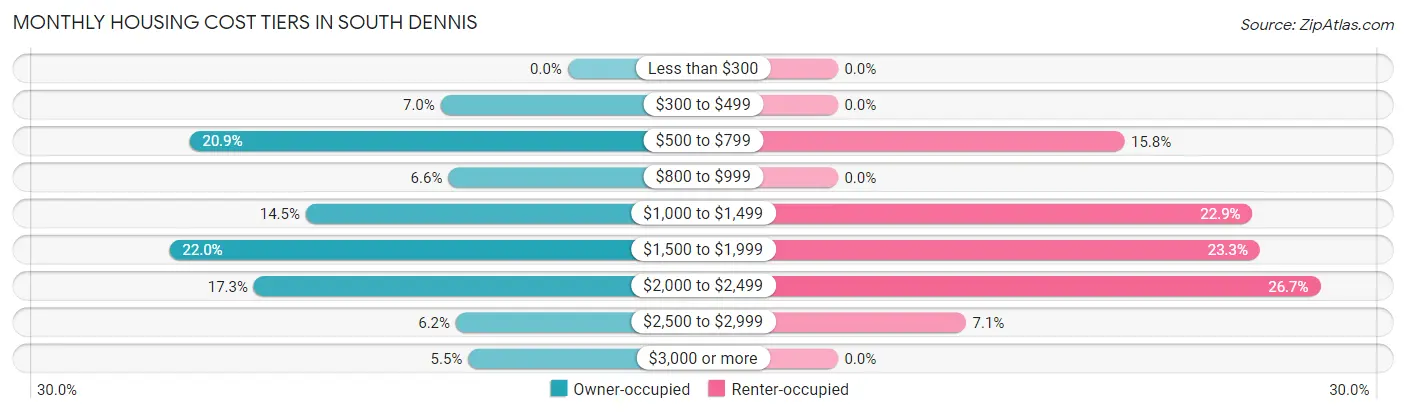
| Monthly Cost | Owner-occupied | Renter-occupied |
| Less than $300 | 0 (0.0%) | 0 (0.0%) |
| $300 to $499 | 83 (7.0%) | 0 (0.0%) |
| $500 to $799 | 247 (20.9%) | 38 (15.8%) |
| $800 to $999 | 78 (6.6%) | 0 (0.0%) |
| $1,000 to $1,499 | 171 (14.5%) | 55 (22.9%) |
| $1,500 to $1,999 | 260 (22.0%) | 56 (23.3%) |
| $2,000 to $2,499 | 205 (17.3%) | 64 (26.7%) |
| $2,500 to $2,999 | 73 (6.2%) | 17 (7.1%) |
| $3,000 or more | 65 (5.5%) | 0 (0.0%) |
| Total | 1,182 (100.0%) | 240 (100.0%) |
Physical Housing Characteristics in South Dennis
Housing Structures in South Dennis
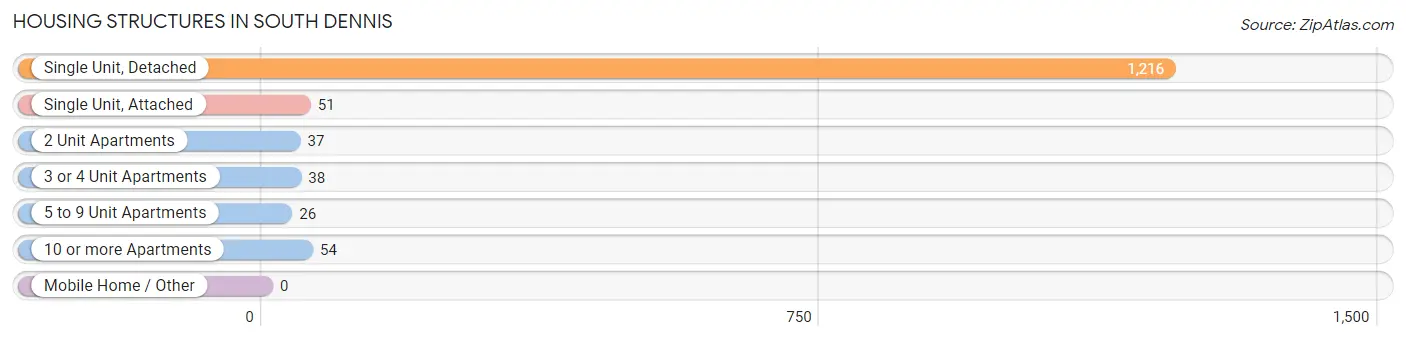
| Structure Type | # Housing Units | % Housing Units |
| Single Unit, Detached | 1,216 | 85.5% |
| Single Unit, Attached | 51 | 3.6% |
| 2 Unit Apartments | 37 | 2.6% |
| 3 or 4 Unit Apartments | 38 | 2.7% |
| 5 to 9 Unit Apartments | 26 | 1.8% |
| 10 or more Apartments | 54 | 3.8% |
| Mobile Home / Other | 0 | 0.0% |
| Total | 1,422 | 100.0% |
Housing Structures by Occupancy in South Dennis
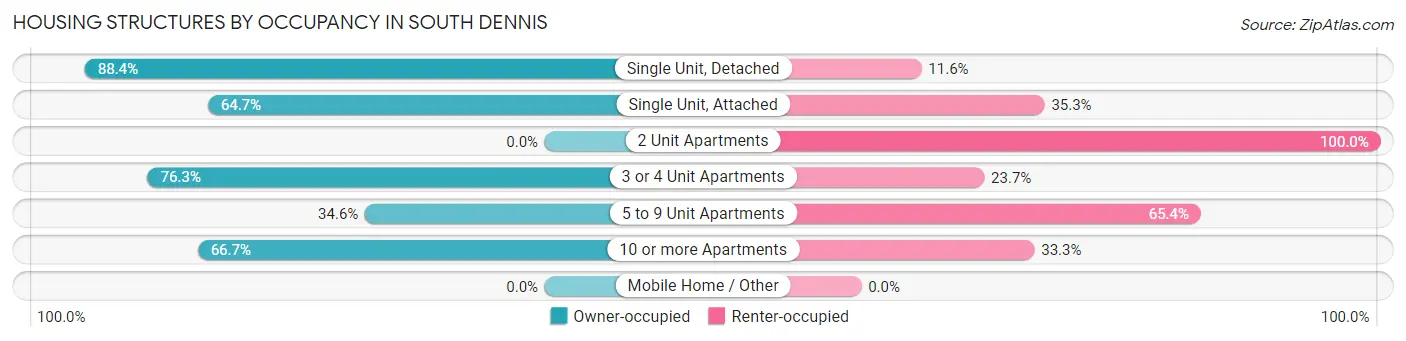
| Structure Type | Owner-occupied | Renter-occupied |
| Single Unit, Detached | 1,075 (88.4%) | 141 (11.6%) |
| Single Unit, Attached | 33 (64.7%) | 18 (35.3%) |
| 2 Unit Apartments | 0 (0.0%) | 37 (100.0%) |
| 3 or 4 Unit Apartments | 29 (76.3%) | 9 (23.7%) |
| 5 to 9 Unit Apartments | 9 (34.6%) | 17 (65.4%) |
| 10 or more Apartments | 36 (66.7%) | 18 (33.3%) |
| Mobile Home / Other | 0 (0.0%) | 0 (0.0%) |
| Total | 1,182 (83.1%) | 240 (16.9%) |
Housing Structures by Number of Rooms in South Dennis
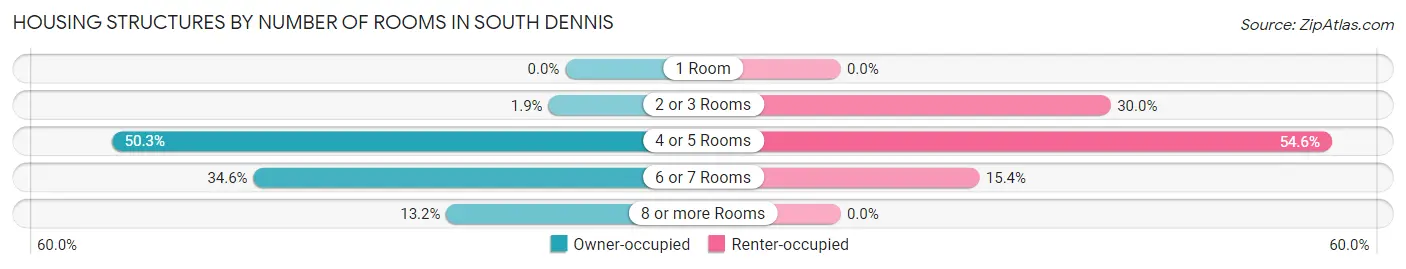
| Number of Rooms | Owner-occupied | Renter-occupied |
| 1 Room | 0 (0.0%) | 0 (0.0%) |
| 2 or 3 Rooms | 22 (1.9%) | 72 (30.0%) |
| 4 or 5 Rooms | 595 (50.3%) | 131 (54.6%) |
| 6 or 7 Rooms | 409 (34.6%) | 37 (15.4%) |
| 8 or more Rooms | 156 (13.2%) | 0 (0.0%) |
| Total | 1,182 (100.0%) | 240 (100.0%) |
Housing Structure by Heating Type in South Dennis
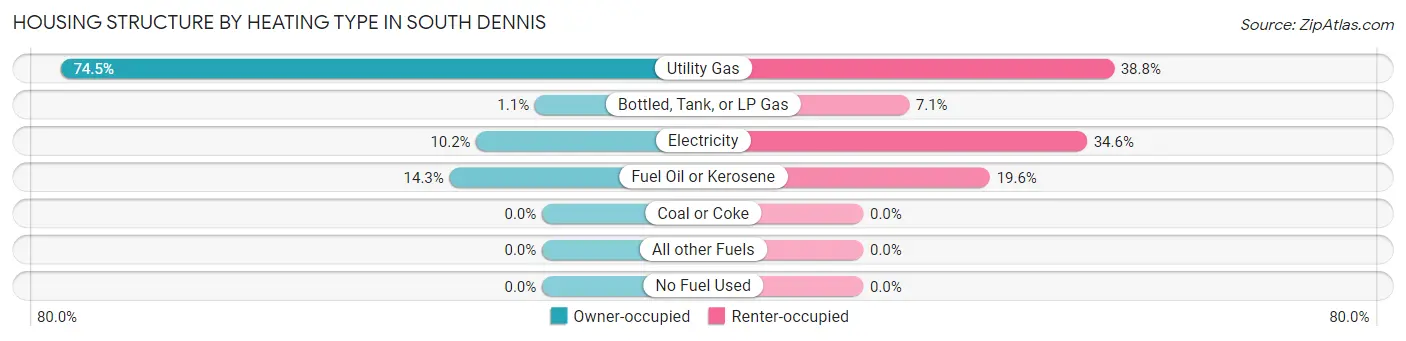
| Heating Type | Owner-occupied | Renter-occupied |
| Utility Gas | 880 (74.5%) | 93 (38.8%) |
| Bottled, Tank, or LP Gas | 13 (1.1%) | 17 (7.1%) |
| Electricity | 120 (10.2%) | 83 (34.6%) |
| Fuel Oil or Kerosene | 169 (14.3%) | 47 (19.6%) |
| Coal or Coke | 0 (0.0%) | 0 (0.0%) |
| All other Fuels | 0 (0.0%) | 0 (0.0%) |
| No Fuel Used | 0 (0.0%) | 0 (0.0%) |
| Total | 1,182 (100.0%) | 240 (100.0%) |
Household Vehicle Usage in South Dennis
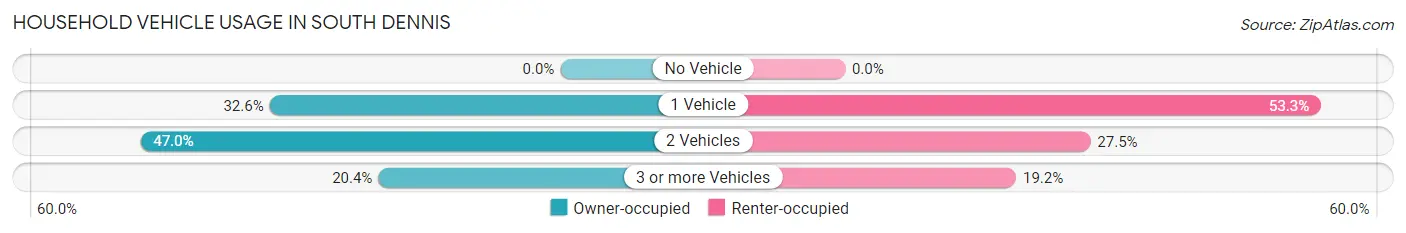
| Vehicles per Household | Owner-occupied | Renter-occupied |
| No Vehicle | 0 (0.0%) | 0 (0.0%) |
| 1 Vehicle | 385 (32.6%) | 128 (53.3%) |
| 2 Vehicles | 556 (47.0%) | 66 (27.5%) |
| 3 or more Vehicles | 241 (20.4%) | 46 (19.2%) |
| Total | 1,182 (100.0%) | 240 (100.0%) |
Real Estate & Mortgages in South Dennis
Real Estate and Mortgage Overview in South Dennis
| Characteristic | Without Mortgage | With Mortgage |
| Housing Units | 366 | 816 |
| Median Property Value | $385,000 | $424,400 |
| Median Household Income | $61,848 | $162 |
| Monthly Housing Costs | $632 | $65 |
| Real Estate Taxes | $2,119 | $0 |
Property Value by Mortgage Status in South Dennis
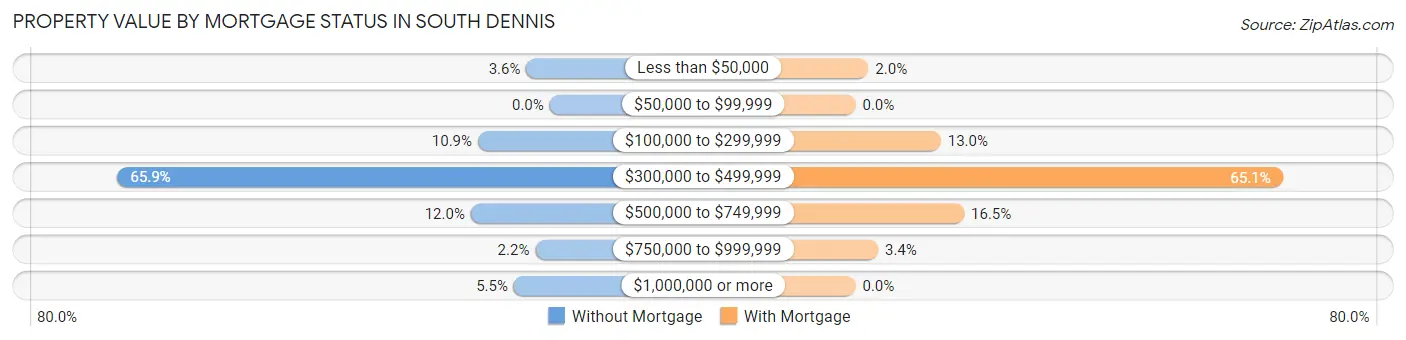
| Property Value | Without Mortgage | With Mortgage |
| Less than $50,000 | 13 (3.5%) | 16 (2.0%) |
| $50,000 to $99,999 | 0 (0.0%) | 0 (0.0%) |
| $100,000 to $299,999 | 40 (10.9%) | 106 (13.0%) |
| $300,000 to $499,999 | 241 (65.8%) | 531 (65.1%) |
| $500,000 to $749,999 | 44 (12.0%) | 135 (16.5%) |
| $750,000 to $999,999 | 8 (2.2%) | 28 (3.4%) |
| $1,000,000 or more | 20 (5.5%) | 0 (0.0%) |
| Total | 366 (100.0%) | 816 (100.0%) |
Household Income by Mortgage Status in South Dennis
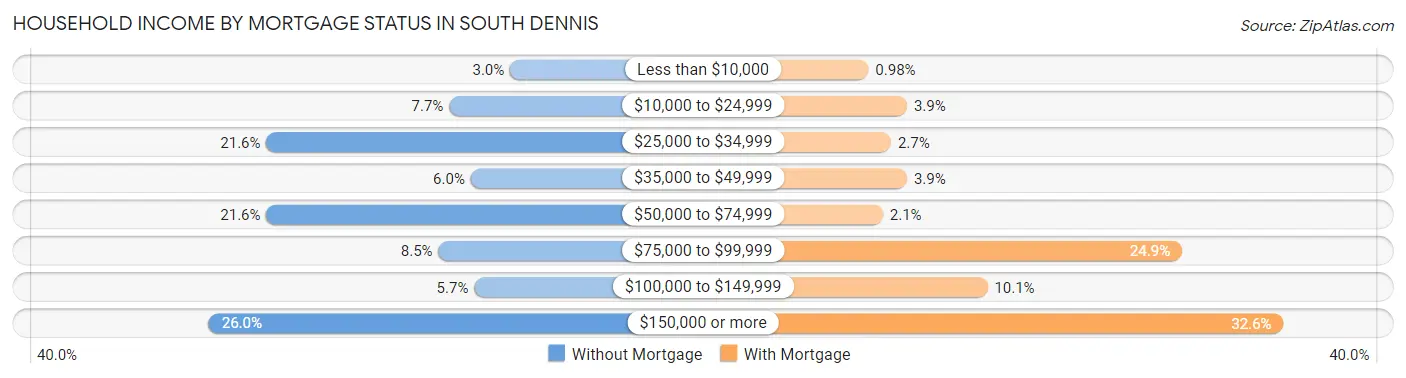
| Household Income | Without Mortgage | With Mortgage |
| Less than $10,000 | 11 (3.0%) | 8 (1.0%) |
| $10,000 to $24,999 | 28 (7.6%) | 32 (3.9%) |
| $25,000 to $34,999 | 79 (21.6%) | 22 (2.7%) |
| $35,000 to $49,999 | 22 (6.0%) | 32 (3.9%) |
| $50,000 to $74,999 | 79 (21.6%) | 17 (2.1%) |
| $75,000 to $99,999 | 31 (8.5%) | 203 (24.9%) |
| $100,000 to $149,999 | 21 (5.7%) | 82 (10.1%) |
| $150,000 or more | 95 (26.0%) | 266 (32.6%) |
| Total | 366 (100.0%) | 816 (100.0%) |
Property Value to Household Income Ratio in South Dennis
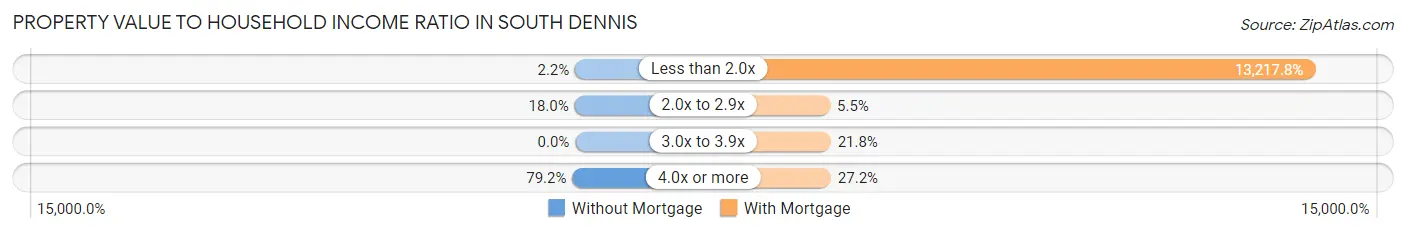
| Value-to-Income Ratio | Without Mortgage | With Mortgage |
| Less than 2.0x | 8 (2.2%) | 107,857 (13,217.8%) |
| 2.0x to 2.9x | 66 (18.0%) | 45 (5.5%) |
| 3.0x to 3.9x | 0 (0.0%) | 178 (21.8%) |
| 4.0x or more | 290 (79.2%) | 222 (27.2%) |
| Total | 366 (100.0%) | 816 (100.0%) |
Real Estate Taxes by Mortgage Status in South Dennis
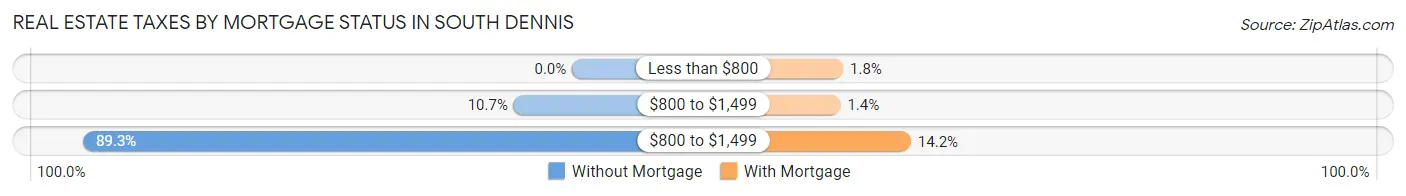
| Property Taxes | Without Mortgage | With Mortgage |
| Less than $800 | 0 (0.0%) | 15 (1.8%) |
| $800 to $1,499 | 39 (10.7%) | 11 (1.3%) |
| $800 to $1,499 | 327 (89.3%) | 116 (14.2%) |
| Total | 366 (100.0%) | 816 (100.0%) |
Health & Disability in South Dennis
Health Insurance Coverage by Age in South Dennis
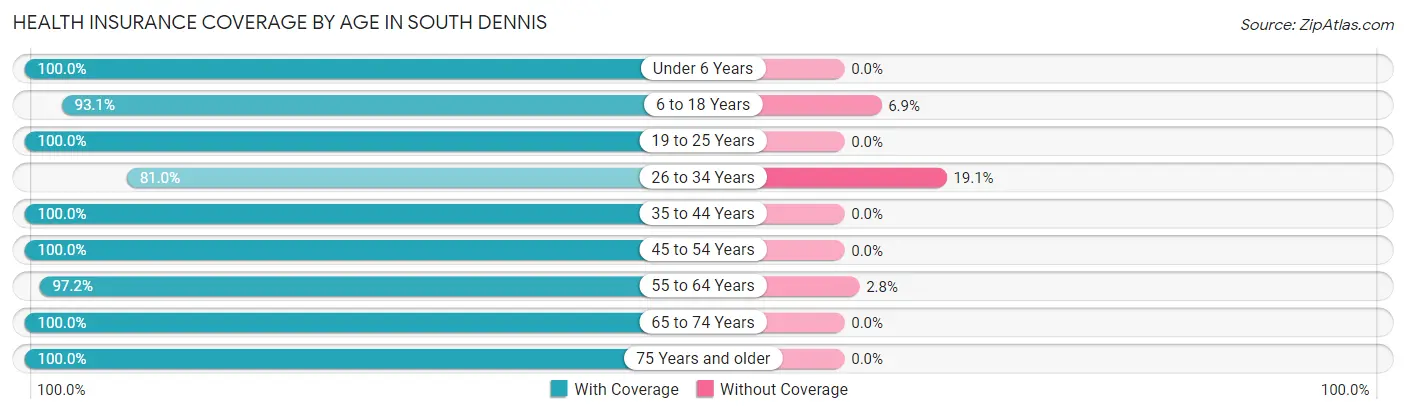
| Age Bracket | With Coverage | Without Coverage |
| Under 6 Years | 79 (100.0%) | 0 (0.0%) |
| 6 to 18 Years | 284 (93.1%) | 21 (6.9%) |
| 19 to 25 Years | 227 (100.0%) | 0 (0.0%) |
| 26 to 34 Years | 102 (80.9%) | 24 (19.1%) |
| 35 to 44 Years | 477 (100.0%) | 0 (0.0%) |
| 45 to 54 Years | 381 (100.0%) | 0 (0.0%) |
| 55 to 64 Years | 525 (97.2%) | 15 (2.8%) |
| 65 to 74 Years | 509 (100.0%) | 0 (0.0%) |
| 75 Years and older | 366 (100.0%) | 0 (0.0%) |
| Total | 2,950 (98.0%) | 60 (2.0%) |
Health Insurance Coverage by Citizenship Status in South Dennis
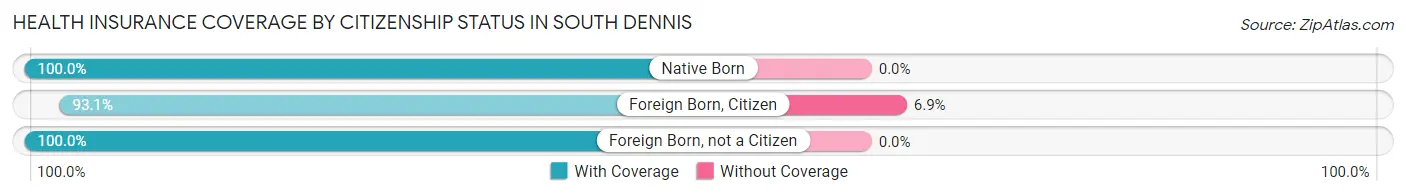
| Citizenship Status | With Coverage | Without Coverage |
| Native Born | 79 (100.0%) | 0 (0.0%) |
| Foreign Born, Citizen | 284 (93.1%) | 21 (6.9%) |
| Foreign Born, not a Citizen | 227 (100.0%) | 0 (0.0%) |
Health Insurance Coverage by Household Income in South Dennis
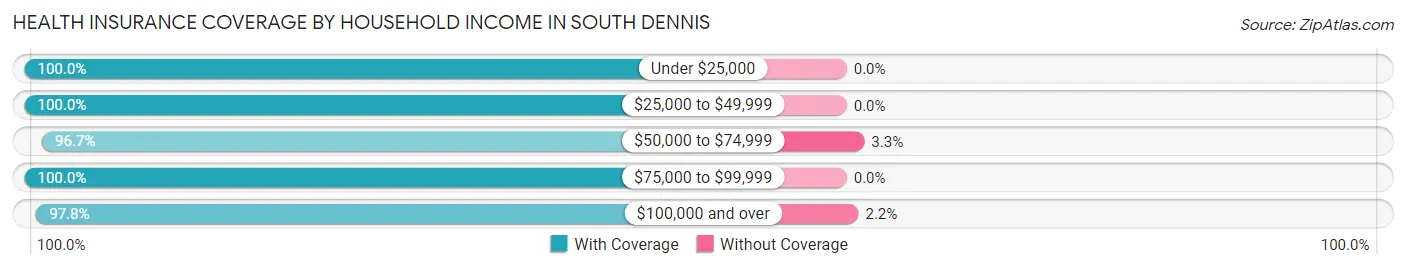
| Household Income | With Coverage | Without Coverage |
| Under $25,000 | 148 (100.0%) | 0 (0.0%) |
| $25,000 to $49,999 | 223 (100.0%) | 0 (0.0%) |
| $50,000 to $74,999 | 703 (96.7%) | 24 (3.3%) |
| $75,000 to $99,999 | 273 (100.0%) | 0 (0.0%) |
| $100,000 and over | 1,603 (97.8%) | 36 (2.2%) |
Public vs Private Health Insurance Coverage by Age in South Dennis
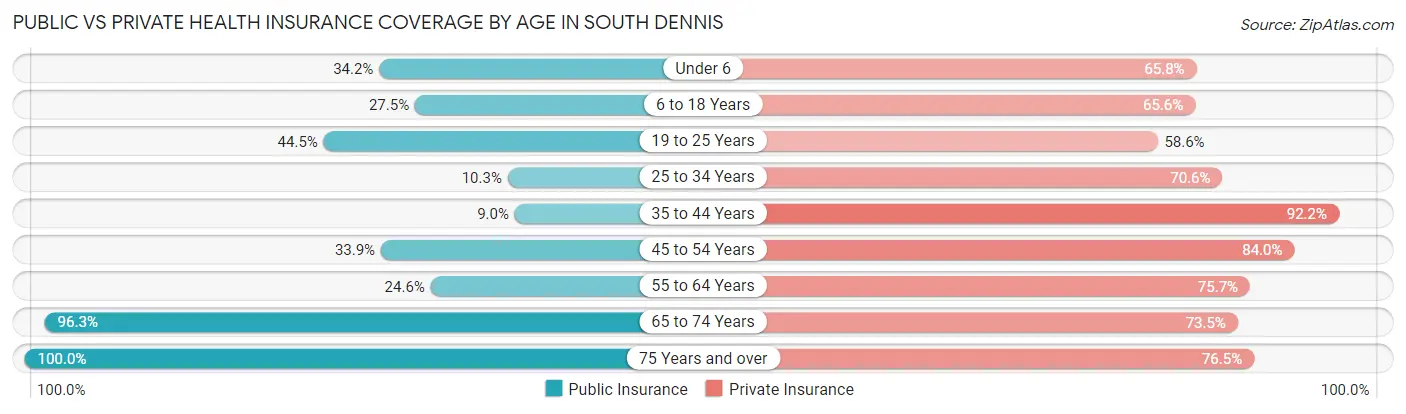
| Age Bracket | Public Insurance | Private Insurance |
| Under 6 | 27 (34.2%) | 52 (65.8%) |
| 6 to 18 Years | 84 (27.5%) | 200 (65.6%) |
| 19 to 25 Years | 101 (44.5%) | 133 (58.6%) |
| 25 to 34 Years | 13 (10.3%) | 89 (70.6%) |
| 35 to 44 Years | 43 (9.0%) | 440 (92.2%) |
| 45 to 54 Years | 129 (33.9%) | 320 (84.0%) |
| 55 to 64 Years | 133 (24.6%) | 409 (75.7%) |
| 65 to 74 Years | 490 (96.3%) | 374 (73.5%) |
| 75 Years and over | 366 (100.0%) | 280 (76.5%) |
| Total | 1,386 (46.1%) | 2,297 (76.3%) |
Disability Status by Sex by Age in South Dennis
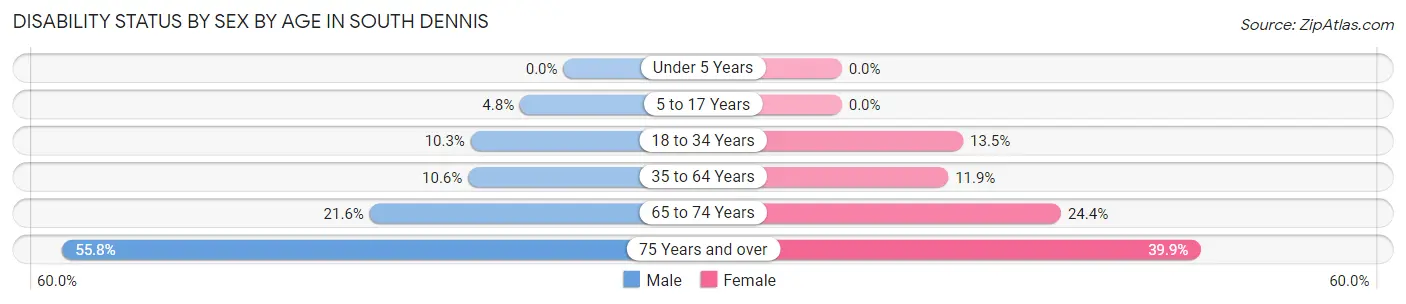
| Age Bracket | Male | Female |
| Under 5 Years | 0 (0.0%) | 0 (0.0%) |
| 5 to 17 Years | 10 (4.8%) | 0 (0.0%) |
| 18 to 34 Years | 16 (10.3%) | 30 (13.5%) |
| 35 to 64 Years | 83 (10.6%) | 73 (11.8%) |
| 65 to 74 Years | 55 (21.6%) | 62 (24.4%) |
| 75 Years and over | 77 (55.8%) | 91 (39.9%) |
Disability Class by Sex by Age in South Dennis
Disability Class: Hearing Difficulty
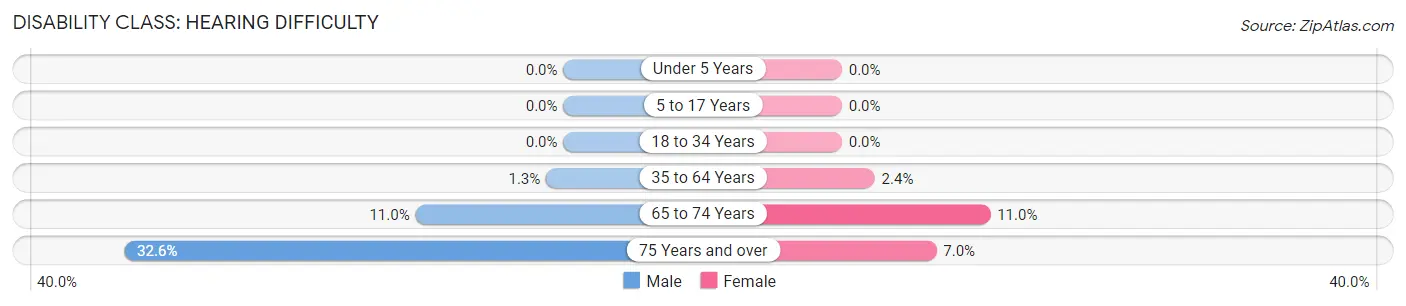
| Age Bracket | Male | Female |
| Under 5 Years | 0 (0.0%) | 0 (0.0%) |
| 5 to 17 Years | 0 (0.0%) | 0 (0.0%) |
| 18 to 34 Years | 0 (0.0%) | 0 (0.0%) |
| 35 to 64 Years | 10 (1.3%) | 15 (2.4%) |
| 65 to 74 Years | 28 (11.0%) | 28 (11.0%) |
| 75 Years and over | 45 (32.6%) | 16 (7.0%) |
Disability Class: Vision Difficulty
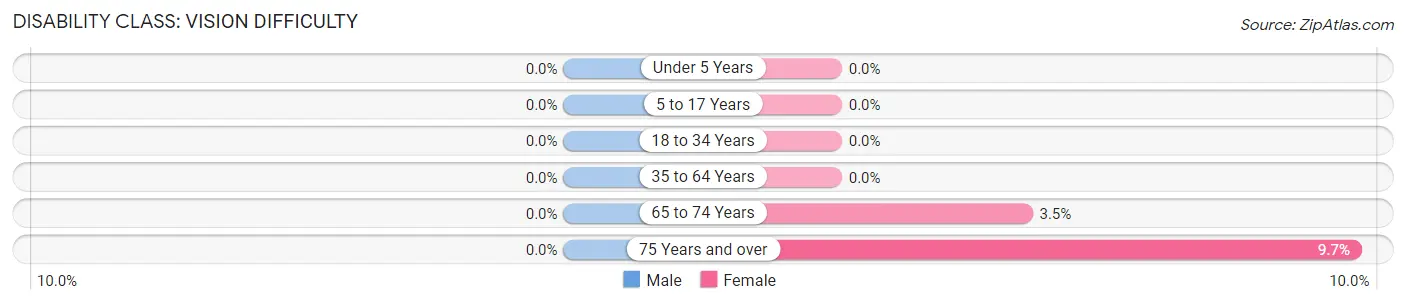
| Age Bracket | Male | Female |
| Under 5 Years | 0 (0.0%) | 0 (0.0%) |
| 5 to 17 Years | 0 (0.0%) | 0 (0.0%) |
| 18 to 34 Years | 0 (0.0%) | 0 (0.0%) |
| 35 to 64 Years | 0 (0.0%) | 0 (0.0%) |
| 65 to 74 Years | 0 (0.0%) | 9 (3.5%) |
| 75 Years and over | 0 (0.0%) | 22 (9.7%) |
Disability Class: Cognitive Difficulty
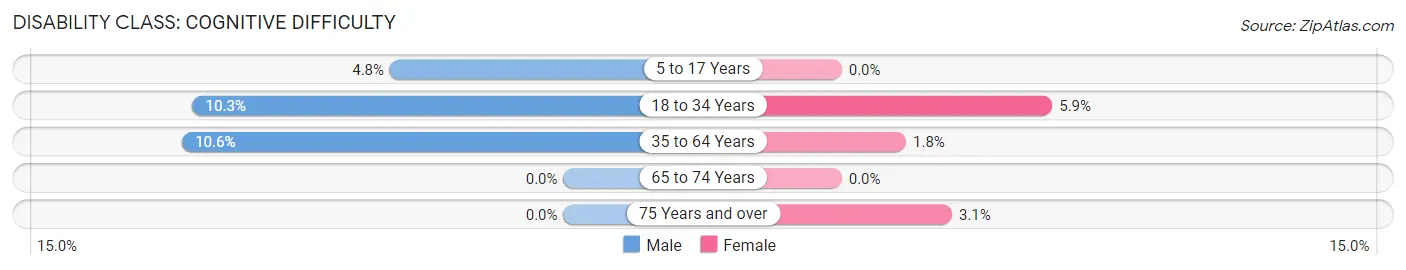
| Age Bracket | Male | Female |
| 5 to 17 Years | 10 (4.8%) | 0 (0.0%) |
| 18 to 34 Years | 16 (10.3%) | 13 (5.9%) |
| 35 to 64 Years | 83 (10.6%) | 11 (1.8%) |
| 65 to 74 Years | 0 (0.0%) | 0 (0.0%) |
| 75 Years and over | 0 (0.0%) | 7 (3.1%) |
Disability Class: Ambulatory Difficulty
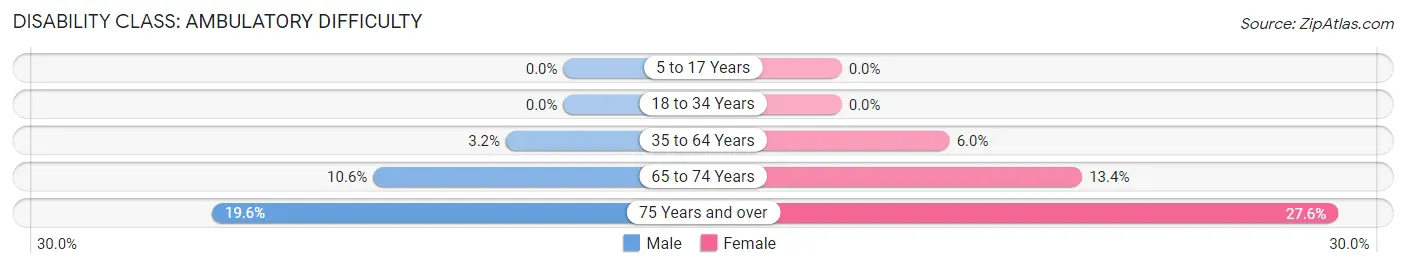
| Age Bracket | Male | Female |
| 5 to 17 Years | 0 (0.0%) | 0 (0.0%) |
| 18 to 34 Years | 0 (0.0%) | 0 (0.0%) |
| 35 to 64 Years | 25 (3.2%) | 37 (6.0%) |
| 65 to 74 Years | 27 (10.6%) | 34 (13.4%) |
| 75 Years and over | 27 (19.6%) | 63 (27.6%) |
Disability Class: Self-Care Difficulty
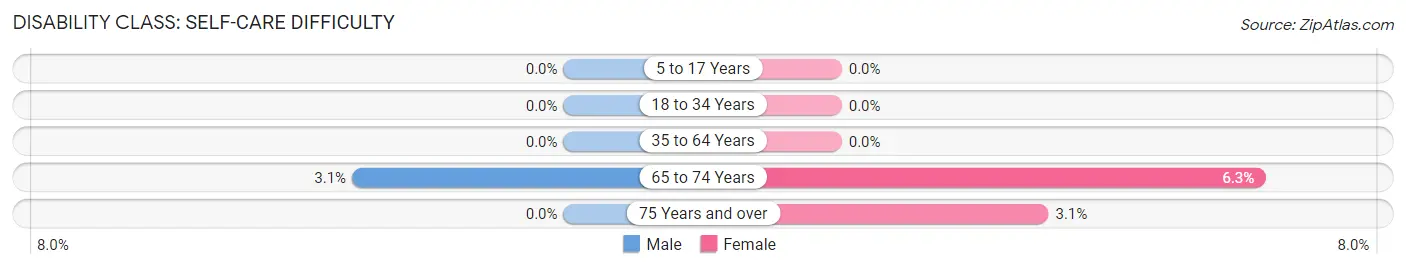
| Age Bracket | Male | Female |
| 5 to 17 Years | 0 (0.0%) | 0 (0.0%) |
| 18 to 34 Years | 0 (0.0%) | 0 (0.0%) |
| 35 to 64 Years | 0 (0.0%) | 0 (0.0%) |
| 65 to 74 Years | 8 (3.1%) | 16 (6.3%) |
| 75 Years and over | 0 (0.0%) | 7 (3.1%) |
Technology Access in South Dennis
Computing Device Access in South Dennis
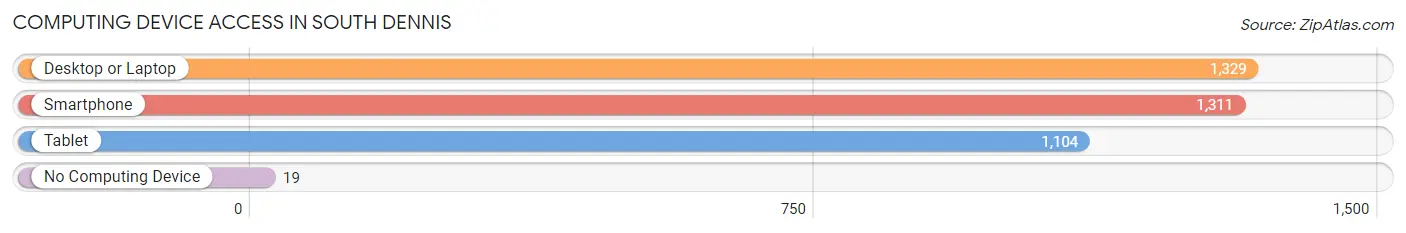
| Device Type | # Households | % Households |
| Desktop or Laptop | 1,329 | 93.5% |
| Smartphone | 1,311 | 92.2% |
| Tablet | 1,104 | 77.6% |
| No Computing Device | 19 | 1.3% |
| Total | 1,422 | 100.0% |
Internet Access in South Dennis
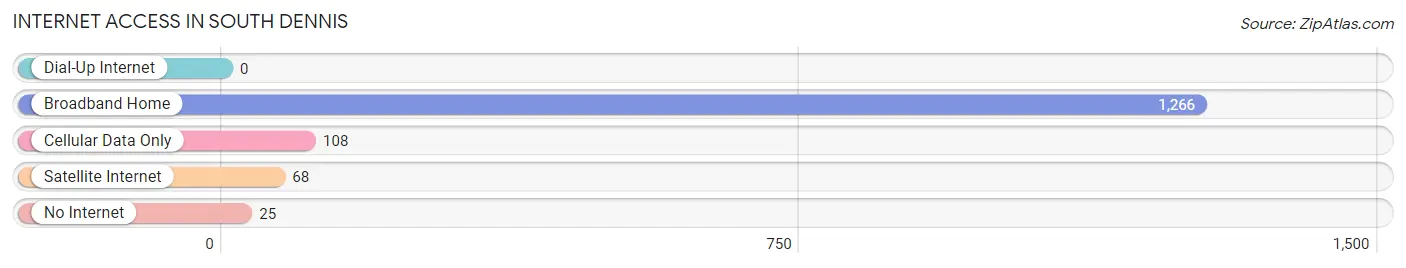
| Internet Type | # Households | % Households |
| Dial-Up Internet | 0 | 0.0% |
| Broadband Home | 1,266 | 89.0% |
| Cellular Data Only | 108 | 7.6% |
| Satellite Internet | 68 | 4.8% |
| No Internet | 25 | 1.8% |
| Total | 1,422 | 100.0% |
South Dennis Summary
Dennis is a town located in Barnstable County, Massachusetts, United States. It is part of the Cape Cod region and is bordered by the towns of Yarmouth to the north, Harwich to the east, Brewster to the south, and Barnstable to the west. The town is divided into two distinct sections, North Dennis and South Dennis. South Dennis is the larger of the two sections, with a population of 8,945 as of the 2010 census.
History
The area that is now South Dennis was originally inhabited by the Nauset tribe of Native Americans. The first European settlers arrived in the area in 1639, and the town of Dennis was officially incorporated in 1793. The town was named after the Reverend Josiah Dennis, who was the first minister of the town.
South Dennis was originally part of the town of Dennis, but it was separated from the town in 1836 and incorporated as its own town. The town was reincorporated in 1892, and it has remained a separate town ever since.
Geography
South Dennis is located in southeastern Massachusetts, about 40 miles south of Boston. It is bordered by the towns of Yarmouth to the north, Harwich to the east, Brewster to the south, and Barnstable to the west. The town covers an area of 8.7 square miles, and it is located on the south side of Cape Cod Bay.
The town is mostly flat, with some rolling hills in the northern part of town. The highest point in South Dennis is located at the intersection of Old Bass River Road and Old Main Street, and it is approximately 80 feet above sea level.
Economy
The economy of South Dennis is largely based on tourism. The town is home to several popular beaches, including Corporation Beach, Mayflower Beach, and Sea Street Beach. The town also has several popular restaurants, shops, and other attractions.
The town is also home to several businesses, including a number of small businesses and a few larger companies. The largest employer in South Dennis is the Cape Cod Regional Technical High School, which employs over 500 people.
Demographics
As of the 2010 census, there were 8,945 people, 3,845 households, and 2,541 families living in South Dennis. The population density was 1,037.3 people per square mile. The racial makeup of the town was 97.2% White, 0.7% African American, 0.3% Native American, 0.5% Asian, 0.1% Pacific Islander, 0.3% from other races, and 1.0% from two or more races. Hispanic or Latino of any race were 1.3% of the population.
The median income for a household in South Dennis was $60,938, and the median income for a family was $71,917. The per capita income for the town was $30,945. About 4.2% of families and 5.7% of the population were below the poverty line, including 6.3% of those under age 18 and 4.2% of those age 65 or over.
Common Questions
What is Per Capita Income in South Dennis?
Per Capita income in South Dennis is $46,966.
What is the Median Family Income in South Dennis?
Median Family Income in South Dennis is $110,903.
What is the Median Household income in South Dennis?
Median Household Income in South Dennis is $81,607.
What is Income or Wage Gap in South Dennis?
Income or Wage Gap in South Dennis is 16.1%.
Women in South Dennis earn 83.9 cents for every dollar earned by a man.
What is Family Income Deficit in South Dennis?
Family Income Deficit in South Dennis is $6,103.
Families that are below poverty line in South Dennis earn $6,103 less on average than the poverty threshold level.
What is Inequality or Gini Index in South Dennis?
Inequality or Gini Index in South Dennis is 0.37.
What is the Total Population of South Dennis?
Total Population of South Dennis is 3,101.
What is the Total Male Population of South Dennis?
Total Male Population of South Dennis is 1,585.
What is the Total Female Population of South Dennis?
Total Female Population of South Dennis is 1,516.
What is the Ratio of Males per 100 Females in South Dennis?
There are 104.55 Males per 100 Females in South Dennis.
What is the Ratio of Females per 100 Males in South Dennis?
There are 95.65 Females per 100 Males in South Dennis.
What is the Median Population Age in South Dennis?
Median Population Age in South Dennis is 53.3 Years.
What is the Average Family Size in South Dennis
Average Family Size in South Dennis is 2.8 People.
What is the Average Household Size in South Dennis
Average Household Size in South Dennis is 2.1 People.
How Large is the Labor Force in South Dennis?
There are 1,678 People in the Labor Forcein in South Dennis.
What is the Percentage of People in the Labor Force in South Dennis?
61.0% of People are in the Labor Force in South Dennis.
What is the Unemployment Rate in South Dennis?
Unemployment Rate in South Dennis is 3.0%.