Cities with the Highest Percentage of Immigrants from Jamaica in Virginia
RELATED REPORTS & OPTIONS
Jamaica
Virginia
Compare Cities
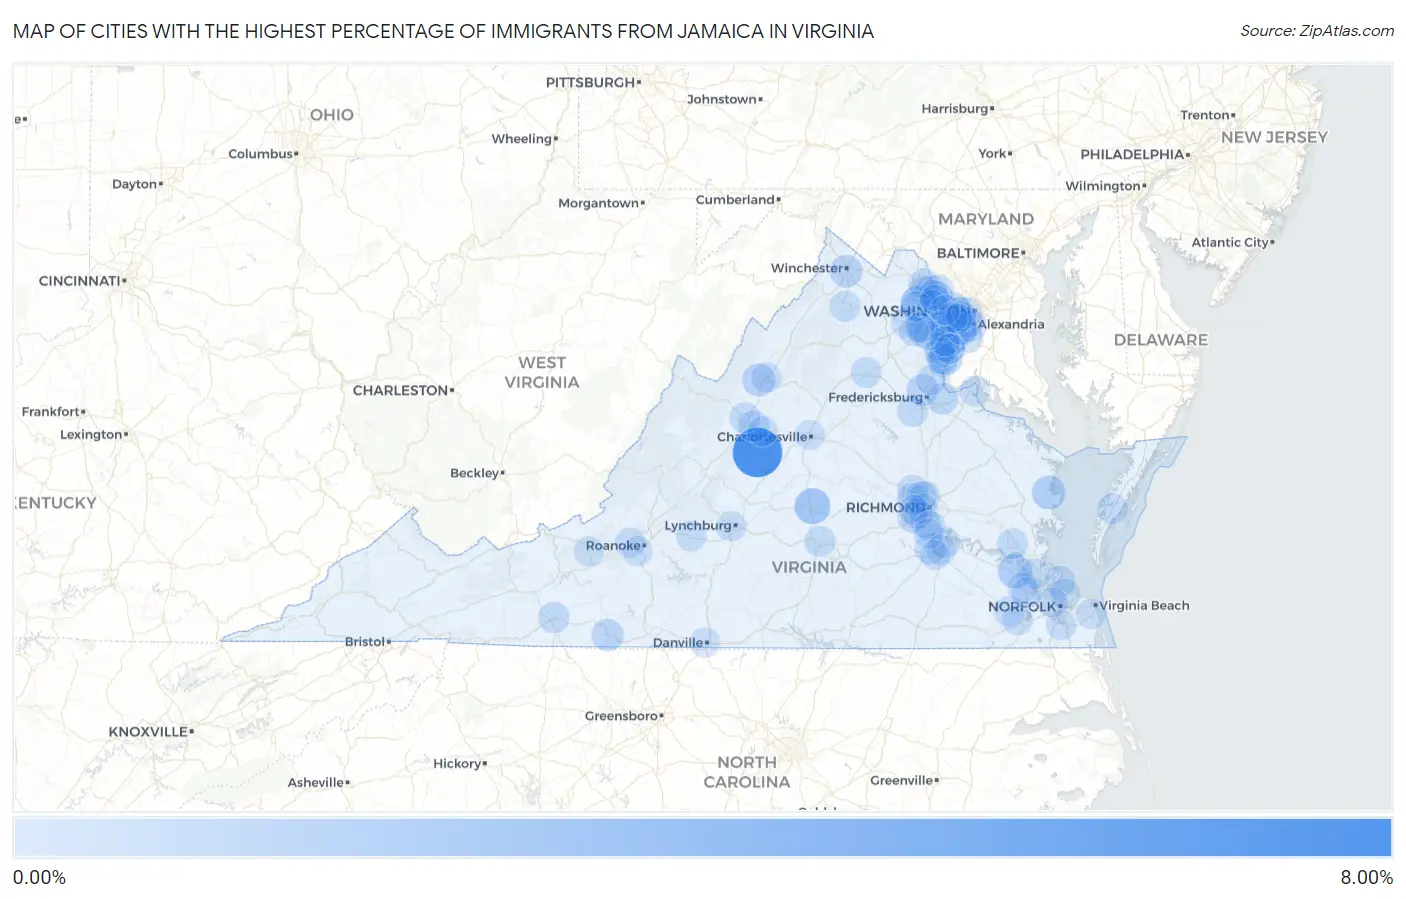
Map of Cities with the Highest Percentage of Immigrants from Jamaica in Virginia
0.00%
8.00%
Cities with the Highest Percentage of Immigrants from Jamaica in Virginia
| City | Jamaica | vs State | vs National | |
| 1. | Wintergreen | 7.02% | 0.12%(+6.90)#102 | 0.24%(+6.78)#3,787 |
| 2. | Arcola | 2.22% | 0.12%(+2.09)#103 | 0.24%(+1.98)#3,788 |
| 3. | Dillwyn | 2.07% | 0.12%(+1.94)#256 | 0.24%(+1.83)#8,787 |
| 4. | One Loudoun | 1.58% | 0.12%(+1.46)#257 | 0.24%(+1.35)#8,788 |
| 5. | Rushmere | 1.45% | 0.12%(+1.33)#286 | 0.24%(+1.21)#10,341 |
| 6. | White Stone | 1.29% | 0.12%(+1.16)#287 | 0.24%(+1.05)#10,342 |
| 7. | Dayton | 1.04% | 0.12%(+0.920)#288 | 0.24%(+0.807)#10,343 |
| 8. | Winchester | 0.94% | 0.12%(+0.815)#289 | 0.24%(+0.702)#10,344 |
| 9. | Cherry Hill | 0.91% | 0.12%(+0.786)#290 | 0.24%(+0.674)#10,345 |
| 10. | South Run | 0.91% | 0.12%(+0.783)#291 | 0.24%(+0.670)#10,346 |
| 11. | Stuart | 0.78% | 0.12%(+0.658)#292 | 0.24%(+0.545)#10,347 |
| 12. | Southern Gateway | 0.71% | 0.12%(+0.581)#293 | 0.24%(+0.468)#10,348 |
| 13. | Laurel Hill | 0.57% | 0.12%(+0.448)#294 | 0.24%(+0.335)#10,349 |
| 14. | Dulles Town Center | 0.56% | 0.12%(+0.436)#295 | 0.24%(+0.323)#10,350 |
| 15. | Passapatanzy | 0.55% | 0.12%(+0.421)#296 | 0.24%(+0.308)#10,351 |
| 16. | Hillsville | 0.53% | 0.12%(+0.401)#297 | 0.24%(+0.288)#10,352 |
| 17. | Fishersville | 0.49% | 0.12%(+0.364)#300 | 0.24%(+0.251)#11,143 |
| 18. | Sudley | 0.47% | 0.12%(+0.347)#301 | 0.24%(+0.234)#11,144 |
| 19. | Idylwood | 0.46% | 0.12%(+0.331)#302 | 0.24%(+0.218)#11,145 |
| 20. | Mount Vernon | 0.44% | 0.12%(+0.312)#303 | 0.24%(+0.199)#11,146 |
| 21. | Spotsylvania Courthouse | 0.42% | 0.12%(+0.299)#304 | 0.24%(+0.186)#11,147 |
| 22. | Franconia | 0.41% | 0.12%(+0.283)#305 | 0.24%(+0.170)#11,148 |
| 23. | Burke Centre | 0.40% | 0.12%(+0.277)#306 | 0.24%(+0.164)#11,149 |
| 24. | Triangle | 0.39% | 0.12%(+0.261)#307 | 0.24%(+0.148)#11,150 |
| 25. | Tuckahoe | 0.38% | 0.12%(+0.258)#308 | 0.24%(+0.146)#11,151 |
| 26. | Williamsburg | 0.38% | 0.12%(+0.257)#309 | 0.24%(+0.144)#11,152 |
| 27. | Staunton | 0.38% | 0.12%(+0.251)#310 | 0.24%(+0.138)#11,153 |
| 28. | Potomac Mills | 0.34% | 0.12%(+0.213)#311 | 0.24%(+0.101)#11,154 |
| 29. | Innsbrook | 0.33% | 0.12%(+0.209)#312 | 0.24%(+0.096)#11,155 |
| 30. | Lowes Island | 0.33% | 0.12%(+0.204)#313 | 0.24%(+0.091)#11,156 |
| 31. | Front Royal | 0.33% | 0.12%(+0.201)#314 | 0.24%(+0.088)#11,157 |
| 32. | Hampton | 0.32% | 0.12%(+0.200)#315 | 0.24%(+0.087)#11,158 |
| 33. | Culpeper | 0.32% | 0.12%(+0.199)#316 | 0.24%(+0.086)#11,159 |
| 34. | Tysons | 0.32% | 0.12%(+0.198)#317 | 0.24%(+0.085)#11,160 |
| 35. | Ettrick | 0.32% | 0.12%(+0.195)#318 | 0.24%(+0.082)#11,161 |
| 36. | Farmville | 0.31% | 0.12%(+0.189)#319 | 0.24%(+0.076)#11,162 |
| 37. | Ashburn | 0.31% | 0.12%(+0.186)#320 | 0.24%(+0.073)#11,163 |
| 38. | Dale City | 0.29% | 0.12%(+0.170)#321 | 0.24%(+0.057)#11,164 |
| 39. | Kings Park West | 0.29% | 0.12%(+0.162)#322 | 0.24%(+0.049)#11,165 |
| 40. | Exmore | 0.29% | 0.12%(+0.162)#323 | 0.24%(+0.049)#11,166 |
| 41. | Dumfries | 0.28% | 0.12%(+0.156)#324 | 0.24%(+0.043)#11,167 |
| 42. | Dahlgren Center | 0.28% | 0.12%(+0.152)#335 | 0.24%(+0.039)#13,220 |
| 43. | Montclair | 0.28% | 0.12%(+0.152)#336 | 0.24%(+0.039)#13,221 |
| 44. | Huntington | 0.27% | 0.12%(+0.149)#337 | 0.24%(+0.036)#13,222 |
| 45. | Dumbarton | 0.27% | 0.12%(+0.142)#338 | 0.24%(+0.029)#13,223 |
| 46. | Norfolk | 0.26% | 0.12%(+0.137)#339 | 0.24%(+0.024)#13,224 |
| 47. | Waynesboro | 0.26% | 0.12%(+0.131)#340 | 0.24%(+0.018)#13,225 |
| 48. | Haymarket | 0.25% | 0.12%(+0.130)#341 | 0.24%(+0.017)#13,226 |
| 49. | Buckhall | 0.25% | 0.12%(+0.129)#342 | 0.24%(+0.016)#13,227 |
| 50. | Windsor | 0.25% | 0.12%(+0.129)#343 | 0.24%(+0.016)#13,228 |
| 51. | Fairfax | 0.24% | 0.12%(+0.119)#344 | 0.24%(+0.006)#13,229 |
| 52. | Hopewell | 0.24% | 0.12%(+0.119)#345 | 0.24%(+0.006)#13,230 |
| 53. | Lansdowne | 0.24% | 0.12%(+0.117)#346 | 0.24%(+0.004)#13,231 |
| 54. | Lakeside | 0.24% | 0.12%(+0.115)#347 | 0.24%(+0.002)#13,232 |
| 55. | Suffolk | 0.24% | 0.12%(+0.111)#348 | 0.24%(-0.002)#13,233 |
| 56. | Chesapeake | 0.23% | 0.12%(+0.107)#349 | 0.24%(-0.006)#13,234 |
| 57. | Fairfax Station | 0.23% | 0.12%(+0.104)#350 | 0.24%(-0.009)#13,235 |
| 58. | Bedford | 0.22% | 0.12%(+0.100)#351 | 0.24%(-0.013)#13,236 |
| 59. | Manassas | 0.21% | 0.12%(+0.084)#352 | 0.24%(-0.029)#13,237 |
| 60. | Meadowbrook | 0.19% | 0.12%(+0.065)#353 | 0.24%(-0.048)#13,238 |
| 61. | Stafford Courthouse | 0.18% | 0.12%(+0.056)#354 | 0.24%(-0.057)#13,239 |
| 62. | Newport News | 0.18% | 0.12%(+0.052)#355 | 0.24%(-0.061)#13,240 |
| 63. | Manchester | 0.18% | 0.12%(+0.052)#356 | 0.24%(-0.061)#13,241 |
| 64. | Virginia Beach | 0.17% | 0.12%(+0.049)#357 | 0.24%(-0.064)#13,242 |
| 65. | Rockwood | 0.17% | 0.12%(+0.049)#358 | 0.24%(-0.064)#13,243 |
| 66. | Kingstowne | 0.16% | 0.12%(+0.040)#359 | 0.24%(-0.073)#13,244 |
| 67. | Richmond | 0.15% | 0.12%(+0.029)#360 | 0.24%(-0.084)#13,245 |
| 68. | Bon Air | 0.15% | 0.12%(+0.025)#361 | 0.24%(-0.088)#13,246 |
| 69. | Dranesville | 0.15% | 0.12%(+0.024)#362 | 0.24%(-0.089)#13,247 |
| 70. | Falls Church | 0.14% | 0.12%(+0.020)#363 | 0.24%(-0.093)#13,248 |
| 71. | Arlington | 0.14% | 0.12%(+0.018)#364 | 0.24%(-0.095)#13,249 |
| 72. | Portsmouth | 0.14% | 0.12%(+0.018)#365 | 0.24%(-0.095)#13,250 |
| 73. | Leesylvania | 0.14% | 0.12%(+0.016)#366 | 0.24%(-0.097)#13,251 |
| 74. | Woodbridge | 0.14% | 0.12%(+0.012)#367 | 0.24%(-0.101)#13,252 |
| 75. | Bellwood | 0.13% | 0.12%(+0.004)#368 | 0.24%(-0.109)#13,253 |
| 76. | Smithfield | 0.13% | 0.12%(+0.003)#369 | 0.24%(-0.110)#13,254 |
| 77. | Alexandria | 0.13% | 0.12%(+0.001)#370 | 0.24%(-0.112)#13,255 |
| 78. | Sterling | 0.12% | 0.12%(-0.005)#371 | 0.24%(-0.118)#13,256 |
| 79. | Fort Lee | 0.12% | 0.12%(-0.006)#372 | 0.24%(-0.119)#13,257 |
| 80. | Blacksburg | 0.11% | 0.12%(-0.014)#373 | 0.24%(-0.127)#14,103 |
| 81. | Harrisonburg | 0.11% | 0.12%(-0.016)#374 | 0.24%(-0.129)#14,104 |
| 82. | Floris | 0.094% | 0.12%(-0.030)#375 | 0.24%(-0.143)#14,105 |
| 83. | Stone Ridge | 0.093% | 0.12%(-0.031)#376 | 0.24%(-0.144)#14,106 |
| 84. | Chester | 0.091% | 0.12%(-0.033)#377 | 0.24%(-0.146)#14,107 |
| 85. | Herndon | 0.090% | 0.12%(-0.035)#378 | 0.24%(-0.147)#14,108 |
| 86. | Benns Church | 0.086% | 0.12%(-0.038)#379 | 0.24%(-0.151)#16,074 |
| 87. | Lake Barcroft | 0.085% | 0.12%(-0.039)#380 | 0.24%(-0.152)#16,075 |
| 88. | Danville | 0.085% | 0.12%(-0.040)#381 | 0.24%(-0.153)#16,076 |
| 89. | Bull Run | 0.084% | 0.12%(-0.040)#382 | 0.24%(-0.153)#16,077 |
| 90. | Lynchburg | 0.083% | 0.12%(-0.041)#383 | 0.24%(-0.154)#16,078 |
| 91. | Lake Ridge | 0.083% | 0.12%(-0.042)#384 | 0.24%(-0.155)#16,079 |
| 92. | Petersburg | 0.078% | 0.12%(-0.046)#385 | 0.24%(-0.159)#16,080 |
| 93. | Annandale | 0.078% | 0.12%(-0.047)#386 | 0.24%(-0.159)#16,081 |
| 94. | Salem | 0.075% | 0.12%(-0.050)#387 | 0.24%(-0.163)#16,082 |
| 95. | Charlottesville | 0.071% | 0.12%(-0.053)#388 | 0.24%(-0.166)#16,083 |
| 96. | Linton Hall | 0.070% | 0.12%(-0.054)#389 | 0.24%(-0.167)#16,084 |
| 97. | Cave Spring | 0.062% | 0.12%(-0.063)#390 | 0.24%(-0.176)#16,085 |
| 98. | Rose Hill Cdp Fairfax County | 0.061% | 0.12%(-0.063)#391 | 0.24%(-0.176)#16,086 |
| 99. | Woodburn | 0.060% | 0.12%(-0.064)#392 | 0.24%(-0.177)#16,087 |
| 100. | Oakton | 0.060% | 0.12%(-0.064)#393 | 0.24%(-0.177)#16,088 |
Common Questions
What are the Top 10 Cities with the Highest Percentage of Immigrants from Jamaica in Virginia?
Top 10 Cities with the Highest Percentage of Immigrants from Jamaica in Virginia are:
#1
7.02%
#2
2.22%
#3
2.07%
#4
1.45%
#5
1.29%
#6
1.04%
#7
0.94%
#8
0.91%
#9
0.91%
#10
0.78%
What city has the Highest Percentage of Immigrants from Jamaica in Virginia?
Wintergreen has the Highest Percentage of Immigrants from Jamaica in Virginia with 7.02%.
What is the Percentage of Immigrants from Jamaica in the State of Virginia?
Percentage of Immigrants from Jamaica in Virginia is 0.12%.
What is the Percentage of Immigrants from Jamaica in the United States?
Percentage of Immigrants from Jamaica in the United States is 0.24%.