Fairplay, MD Map & Demographics
Fairplay Map
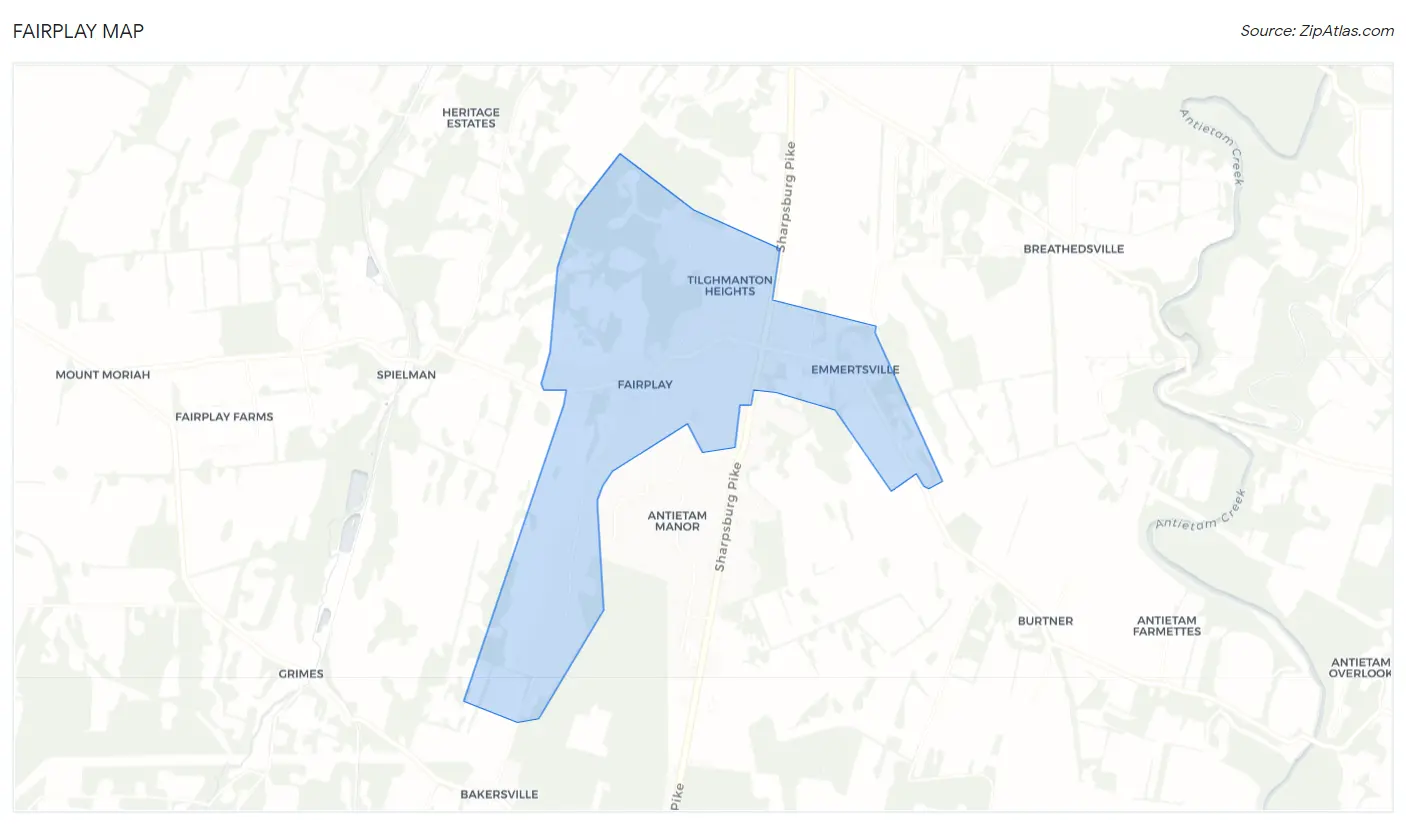
Fairplay Overview
$41,630
PER CAPITA INCOME
$96,983
AVG FAMILY INCOME
$113,462
AVG HOUSEHOLD INCOME
38.2%
WAGE / INCOME GAP [ % ]
61.8¢/ $1
WAGE / INCOME GAP [ $ ]
0.34
INEQUALITY / GINI INDEX
543
TOTAL POPULATION
287
MALE POPULATION
256
FEMALE POPULATION
112.11
MALES / 100 FEMALES
89.20
FEMALES / 100 MALES
41.5
MEDIAN AGE
3.6
AVG FAMILY SIZE
4.0
AVG HOUSEHOLD SIZE
341
LABOR FORCE [ PEOPLE ]
74.6%
PERCENT IN LABOR FORCE
Fairplay Zip Codes
Fairplay Area Codes
Income in Fairplay
Income Overview in Fairplay
Per Capita Income in Fairplay is $41,630, while median incomes of families and households are $96,983 and $113,462 respectively.
| Characteristic | Number | Measure |
| Per Capita Income | 543 | $41,630 |
| Median Family Income | 134 | $96,983 |
| Mean Family Income | 134 | $144,488 |
| Median Household Income | 134 | $113,462 |
| Mean Household Income | 134 | $150,324 |
| Income Deficit | 134 | $0 |
| Wage / Income Gap (%) | 543 | 38.25% |
| Wage / Income Gap ($) | 543 | 61.75¢ per $1 |
| Gini / Inequality Index | 543 | 0.34 |
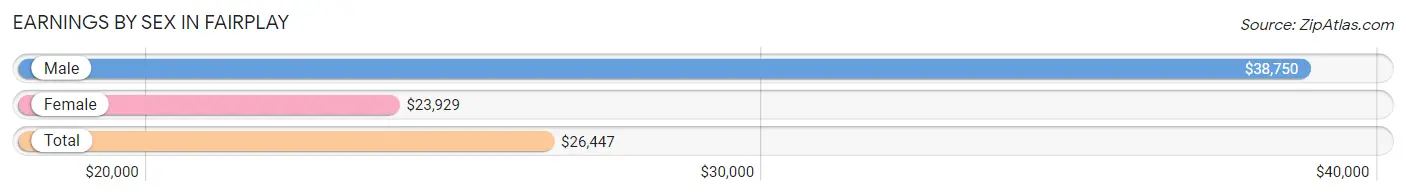
Earnings by Sex in Fairplay
Average Earnings in Fairplay are $26,447, $38,750 for men and $23,929 for women, a difference of 38.3%.
| Sex | Number | Average Earnings |
| Male | 178 (50.3%) | $38,750 |
| Female | 176 (49.7%) | $23,929 |
| Total | 354 (100.0%) | $26,447 |
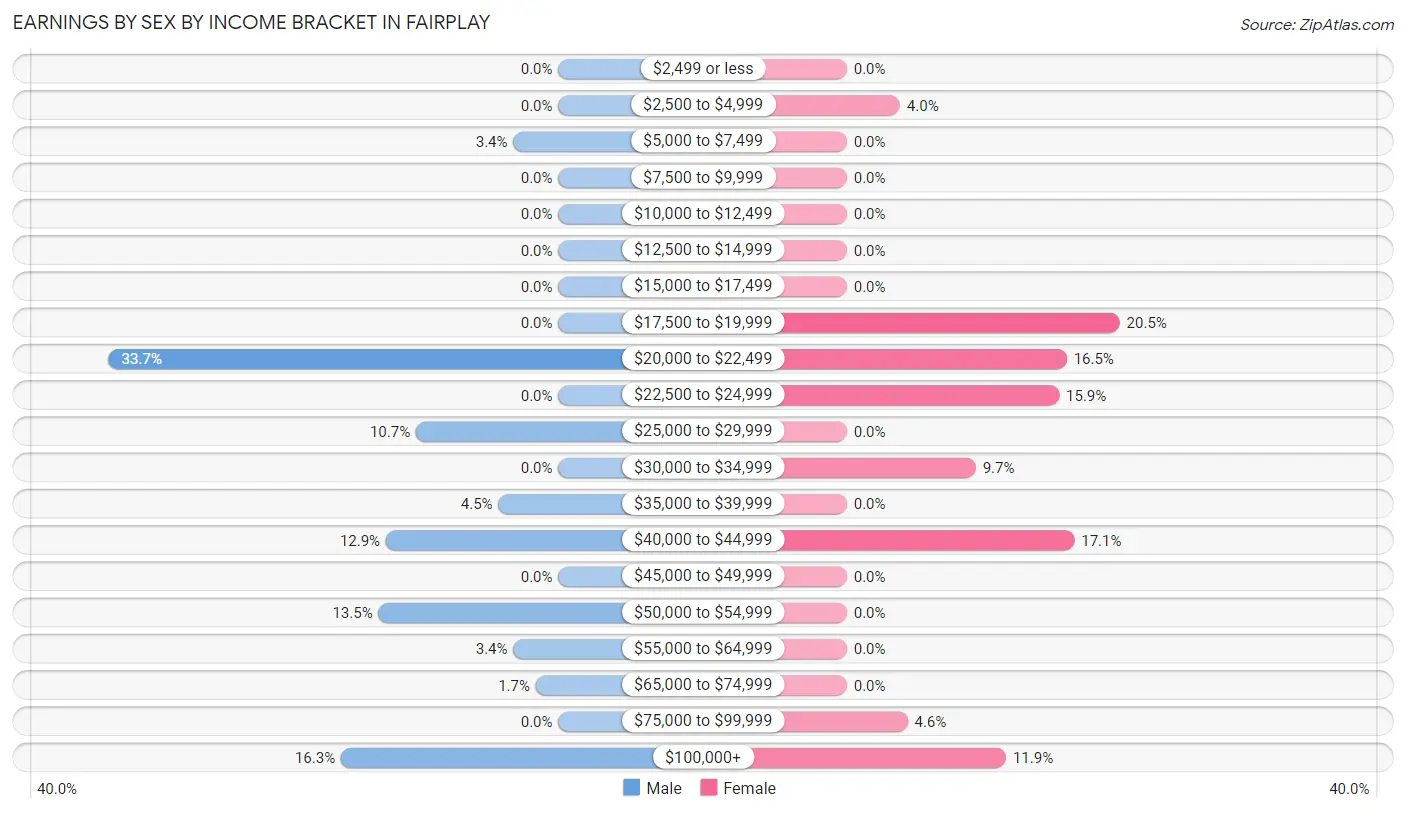
Earnings by Sex by Income Bracket in Fairplay
The most common earnings brackets in Fairplay are $20,000 to $22,499 for men (60 | 33.7%) and $17,500 to $19,999 for women (36 | 20.4%).
| Income | Male | Female |
| $2,499 or less | 0 (0.0%) | 0 (0.0%) |
| $2,500 to $4,999 | 0 (0.0%) | 7 (4.0%) |
| $5,000 to $7,499 | 6 (3.4%) | 0 (0.0%) |
| $7,500 to $9,999 | 0 (0.0%) | 0 (0.0%) |
| $10,000 to $12,499 | 0 (0.0%) | 0 (0.0%) |
| $12,500 to $14,999 | 0 (0.0%) | 0 (0.0%) |
| $15,000 to $17,499 | 0 (0.0%) | 0 (0.0%) |
| $17,500 to $19,999 | 0 (0.0%) | 36 (20.4%) |
| $20,000 to $22,499 | 60 (33.7%) | 29 (16.5%) |
| $22,500 to $24,999 | 0 (0.0%) | 28 (15.9%) |
| $25,000 to $29,999 | 19 (10.7%) | 0 (0.0%) |
| $30,000 to $34,999 | 0 (0.0%) | 17 (9.7%) |
| $35,000 to $39,999 | 8 (4.5%) | 0 (0.0%) |
| $40,000 to $44,999 | 23 (12.9%) | 30 (17.1%) |
| $45,000 to $49,999 | 0 (0.0%) | 0 (0.0%) |
| $50,000 to $54,999 | 24 (13.5%) | 0 (0.0%) |
| $55,000 to $64,999 | 6 (3.4%) | 0 (0.0%) |
| $65,000 to $74,999 | 3 (1.7%) | 0 (0.0%) |
| $75,000 to $99,999 | 0 (0.0%) | 8 (4.5%) |
| $100,000+ | 29 (16.3%) | 21 (11.9%) |
| Total | 178 (100.0%) | 176 (100.0%) |
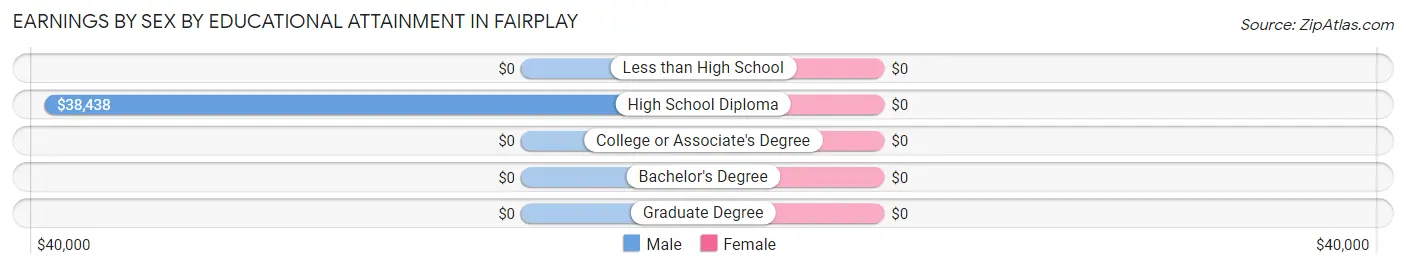
Earnings by Sex by Educational Attainment in Fairplay
| Educational Attainment | Male Income | Female Income |
| Less than High School | - | - |
| High School Diploma | $38,438 | $0 |
| College or Associate's Degree | - | - |
| Bachelor's Degree | - | - |
| Graduate Degree | - | - |
| Total | $52,813 | $0 |
Family Income in Fairplay
Family Income Brackets in Fairplay
According to the Fairplay family income data, there are 57 families falling into the $75,000 to $99,999 income range, which is the most common income bracket and makes up 42.5% of all families.
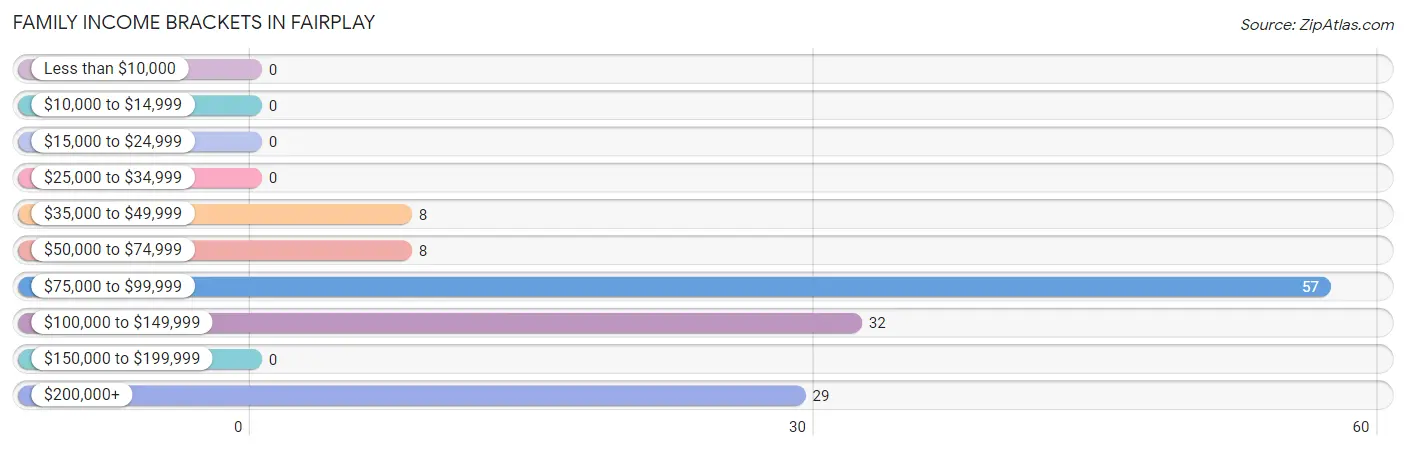
| Income Bracket | # Families | % Families |
| Less than $10,000 | 0 | 0.0% |
| $10,000 to $14,999 | 0 | 0.0% |
| $15,000 to $24,999 | 0 | 0.0% |
| $25,000 to $34,999 | 0 | 0.0% |
| $35,000 to $49,999 | 8 | 6.0% |
| $50,000 to $74,999 | 8 | 6.0% |
| $75,000 to $99,999 | 57 | 42.5% |
| $100,000 to $149,999 | 32 | 23.9% |
| $150,000 to $199,999 | 0 | 0.0% |
| $200,000+ | 29 | 21.6% |
Family Income by Famaliy Size in Fairplay
2-person families (54 | 40.3%) account for the highest median family income in Fairplay with $113,370 per family, while 2-person families (54 | 40.3%) have the highest median income of $56,685 per family member.
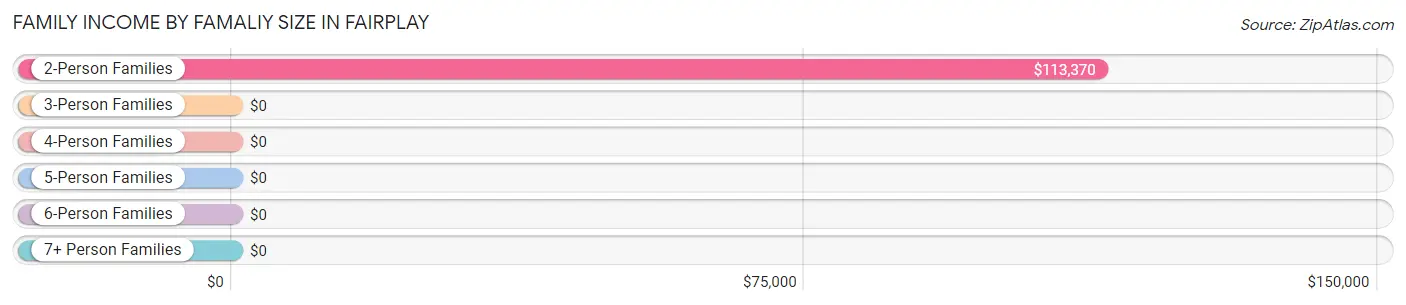
| Income Bracket | # Families | Median Income |
| 2-Person Families | 54 (40.3%) | $113,370 |
| 3-Person Families | 23 (17.2%) | $0 |
| 4-Person Families | 28 (20.9%) | $0 |
| 5-Person Families | 29 (21.6%) | $0 |
| 6-Person Families | 0 (0.0%) | $0 |
| 7+ Person Families | 0 (0.0%) | $0 |
| Total | 134 (100.0%) | $96,983 |
Family Income by Number of Earners in Fairplay
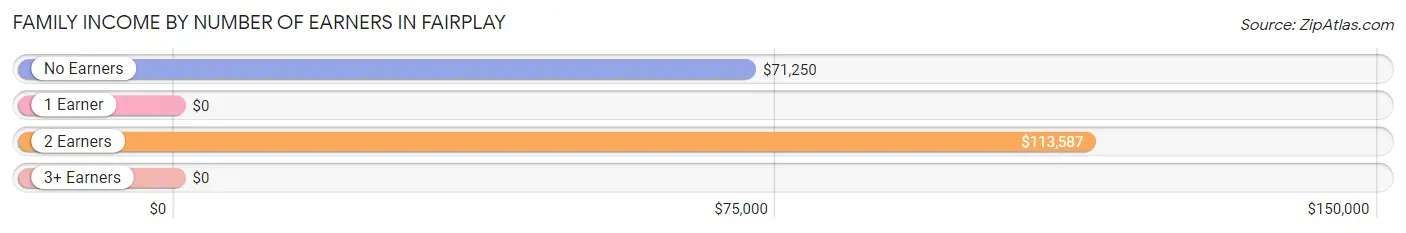
| Number of Earners | # Families | Median Income |
| No Earners | 32 (23.9%) | $71,250 |
| 1 Earner | 0 (0.0%) | $0 |
| 2 Earners | 50 (37.3%) | $113,587 |
| 3+ Earners | 52 (38.8%) | $0 |
| Total | 134 (100.0%) | $96,983 |
Household Income in Fairplay
Household Income Brackets in Fairplay
With 61 households falling in the category, the $100,000 to $149,999 income range is the most frequent in Fairplay, accounting for 45.5% of all households.
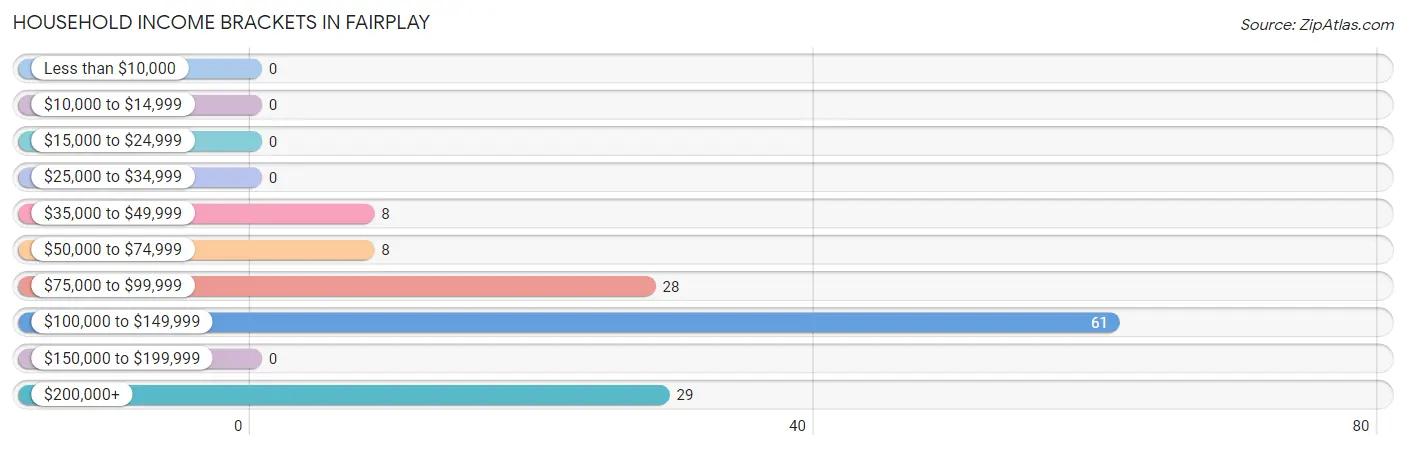
| Income Bracket | # Households | % Households |
| Less than $10,000 | 0 | 0.0% |
| $10,000 to $14,999 | 0 | 0.0% |
| $15,000 to $24,999 | 0 | 0.0% |
| $25,000 to $34,999 | 0 | 0.0% |
| $35,000 to $49,999 | 8 | 6.0% |
| $50,000 to $74,999 | 8 | 6.0% |
| $75,000 to $99,999 | 28 | 20.9% |
| $100,000 to $149,999 | 61 | 45.5% |
| $150,000 to $199,999 | 0 | 0.0% |
| $200,000+ | 29 | 21.6% |
Household Income by Householder Age in Fairplay
The median household income in Fairplay is $113,462, with the highest median household income of $113,448 found in the 25 to 44 years age bracket for the primary householder. A total of 52 households (38.8%) fall into this category.
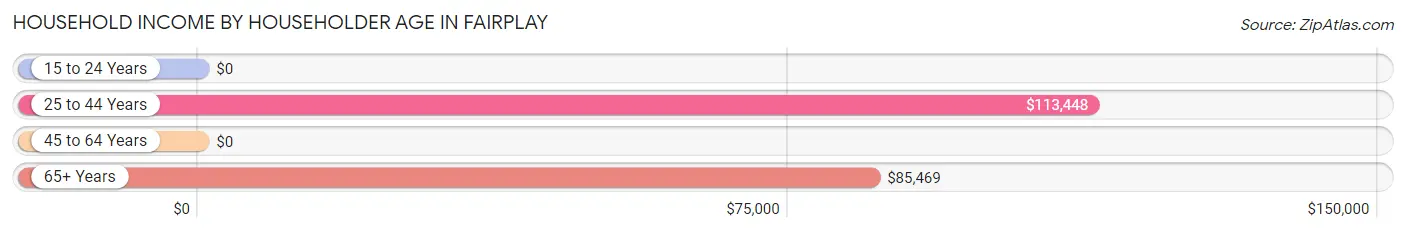
| Income Bracket | # Households | Median Income |
| 15 to 24 Years | 0 (0.0%) | $0 |
| 25 to 44 Years | 52 (38.8%) | $113,448 |
| 45 to 64 Years | 44 (32.8%) | $0 |
| 65+ Years | 38 (28.4%) | $85,469 |
| Total | 134 (100.0%) | $113,462 |
Poverty in Fairplay
Income Below Poverty by Sex and Age in Fairplay
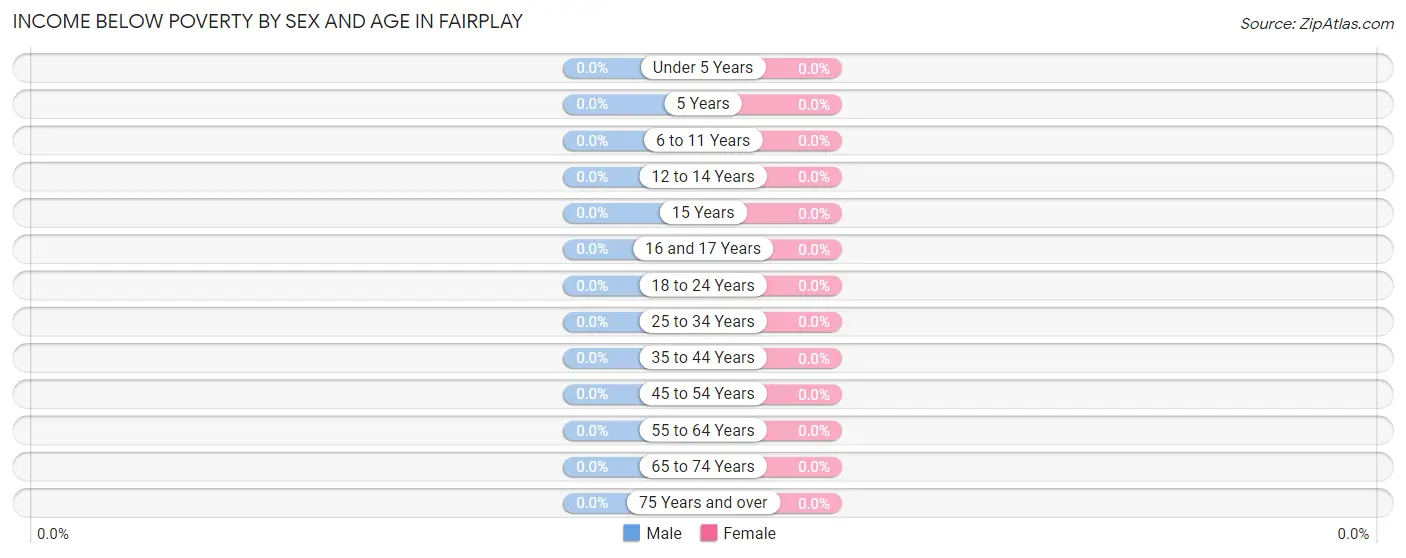
| Age Bracket | Male | Female |
| Under 5 Years | 0 (0.0%) | 0 (0.0%) |
| 5 Years | 0 (0.0%) | 0 (0.0%) |
| 6 to 11 Years | 0 (0.0%) | 0 (0.0%) |
| 12 to 14 Years | 0 (0.0%) | 0 (0.0%) |
| 15 Years | 0 (0.0%) | 0 (0.0%) |
| 16 and 17 Years | 0 (0.0%) | 0 (0.0%) |
| 18 to 24 Years | 0 (0.0%) | 0 (0.0%) |
| 25 to 34 Years | 0 (0.0%) | 0 (0.0%) |
| 35 to 44 Years | 0 (0.0%) | 0 (0.0%) |
| 45 to 54 Years | 0 (0.0%) | 0 (0.0%) |
| 55 to 64 Years | 0 (0.0%) | 0 (0.0%) |
| 65 to 74 Years | 0 (0.0%) | 0 (0.0%) |
| 75 Years and over | 0 (0.0%) | 0 (0.0%) |
| Total | 0 (0.0%) | 0 (0.0%) |
Income Above Poverty by Sex and Age in Fairplay
According to the poverty statistics in Fairplay, males aged under 5 years and females aged under 5 years are the age groups that are most secure financially, with 100.0% of males and 100.0% of females in these age groups living above the poverty line.
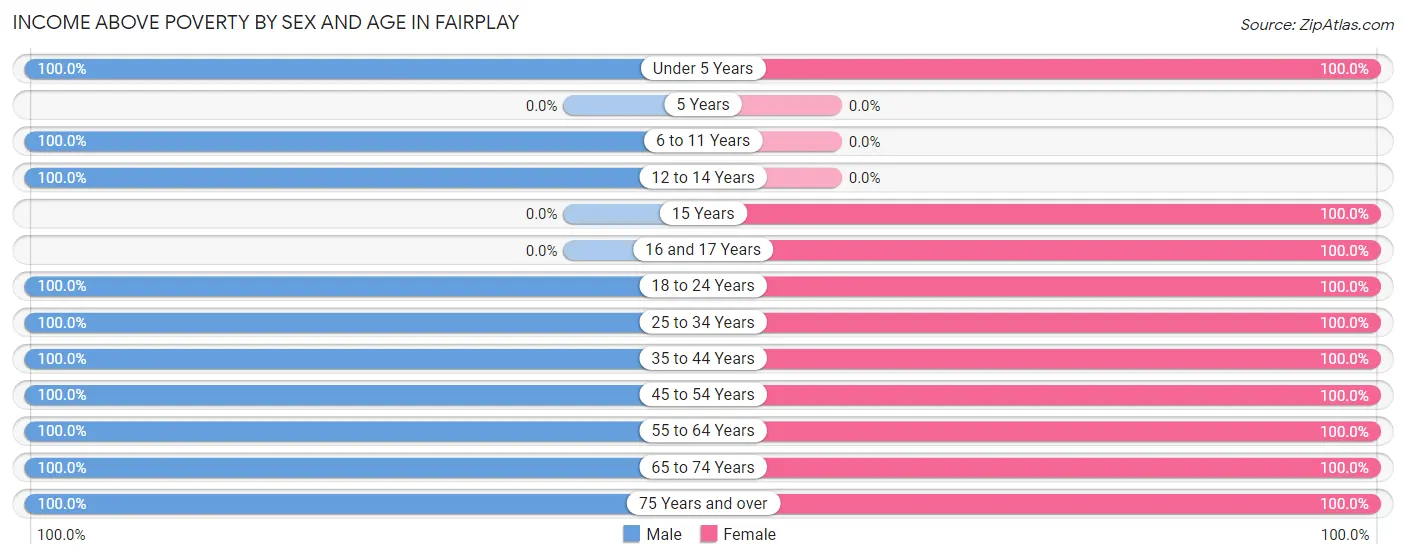
| Age Bracket | Male | Female |
| Under 5 Years | 15 (100.0%) | 6 (100.0%) |
| 5 Years | 0 (0.0%) | 0 (0.0%) |
| 6 to 11 Years | 49 (100.0%) | 0 (0.0%) |
| 12 to 14 Years | 9 (100.0%) | 0 (0.0%) |
| 15 Years | 0 (0.0%) | 7 (100.0%) |
| 16 and 17 Years | 0 (0.0%) | 7 (100.0%) |
| 18 to 24 Years | 60 (100.0%) | 48 (100.0%) |
| 25 to 34 Years | 27 (100.0%) | 3 (100.0%) |
| 35 to 44 Years | 46 (100.0%) | 41 (100.0%) |
| 45 to 54 Years | 12 (100.0%) | 43 (100.0%) |
| 55 to 64 Years | 32 (100.0%) | 61 (100.0%) |
| 65 to 74 Years | 6 (100.0%) | 15 (100.0%) |
| 75 Years and over | 31 (100.0%) | 25 (100.0%) |
| Total | 287 (100.0%) | 256 (100.0%) |
Income Below Poverty Among Married-Couple Families in Fairplay
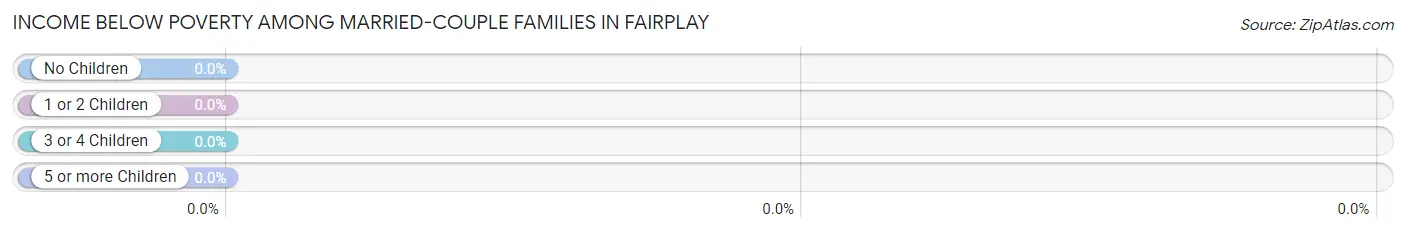
| Children | Above Poverty | Below Poverty |
| No Children | 69 (100.0%) | 0 (0.0%) |
| 1 or 2 Children | 65 (100.0%) | 0 (0.0%) |
| 3 or 4 Children | 0 (0.0%) | 0 (0.0%) |
| 5 or more Children | 0 (0.0%) | 0 (0.0%) |
| Total | 134 (100.0%) | 0 (0.0%) |
Income Below Poverty Among Single-Parent Households in Fairplay
| Children | Single Father | Single Mother |
| No Children | 0 (0.0%) | 0 (0.0%) |
| 1 or 2 Children | 0 (0.0%) | 0 (0.0%) |
| 3 or 4 Children | 0 (0.0%) | 0 (0.0%) |
| 5 or more Children | 0 (0.0%) | 0 (0.0%) |
| Total | 0 (0.0%) | 0 (0.0%) |
Income Below Poverty Among Married-Couple vs Single-Parent Households in Fairplay
| Children | Married-Couple Families | Single-Parent Households |
| No Children | 0 (0.0%) | 0 (0.0%) |
| 1 or 2 Children | 0 (0.0%) | 0 (0.0%) |
| 3 or 4 Children | 0 (0.0%) | 0 (0.0%) |
| 5 or more Children | 0 (0.0%) | 0 (0.0%) |
| Total | 0 (0.0%) | 0 (0.0%) |
Race in Fairplay
The most populous races in Fairplay are White / Caucasian (356 | 65.6%), Two or more Races (130 | 23.9%), and Black / African American (57 | 10.5%).
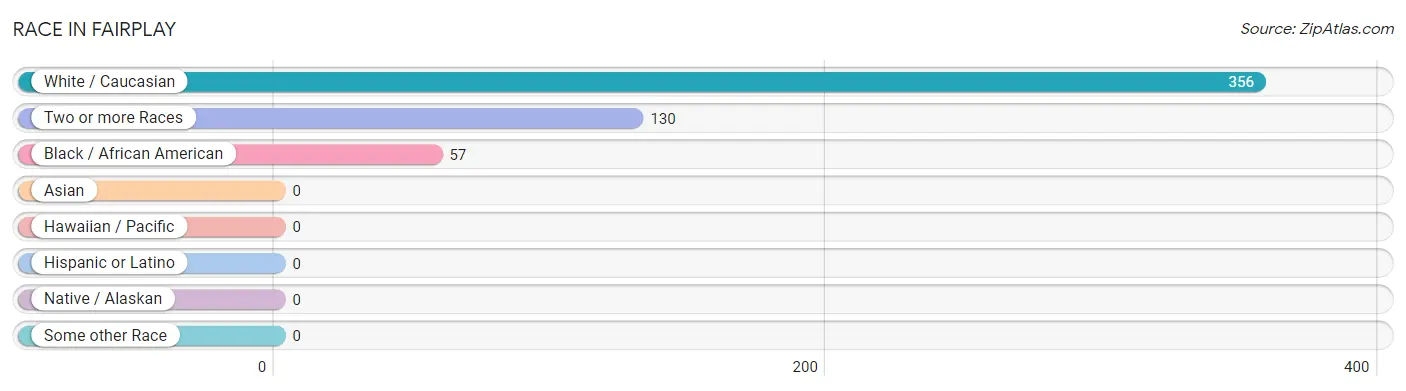
| Race | # Population | % Population |
| Asian | 0 | 0.0% |
| Black / African American | 57 | 10.5% |
| Hawaiian / Pacific | 0 | 0.0% |
| Hispanic or Latino | 0 | 0.0% |
| Native / Alaskan | 0 | 0.0% |
| White / Caucasian | 356 | 65.6% |
| Two or more Races | 130 | 23.9% |
| Some other Race | 0 | 0.0% |
| Total | 543 | 100.0% |
Ancestry in Fairplay
The most populous ancestries reported in Fairplay are German (216 | 39.8%), Jamaican (148 | 27.3%), English (77 | 14.2%), Portuguese (39 | 7.2%), and Dutch (30 | 5.5%), together accounting for 93.9% of all Fairplay residents.
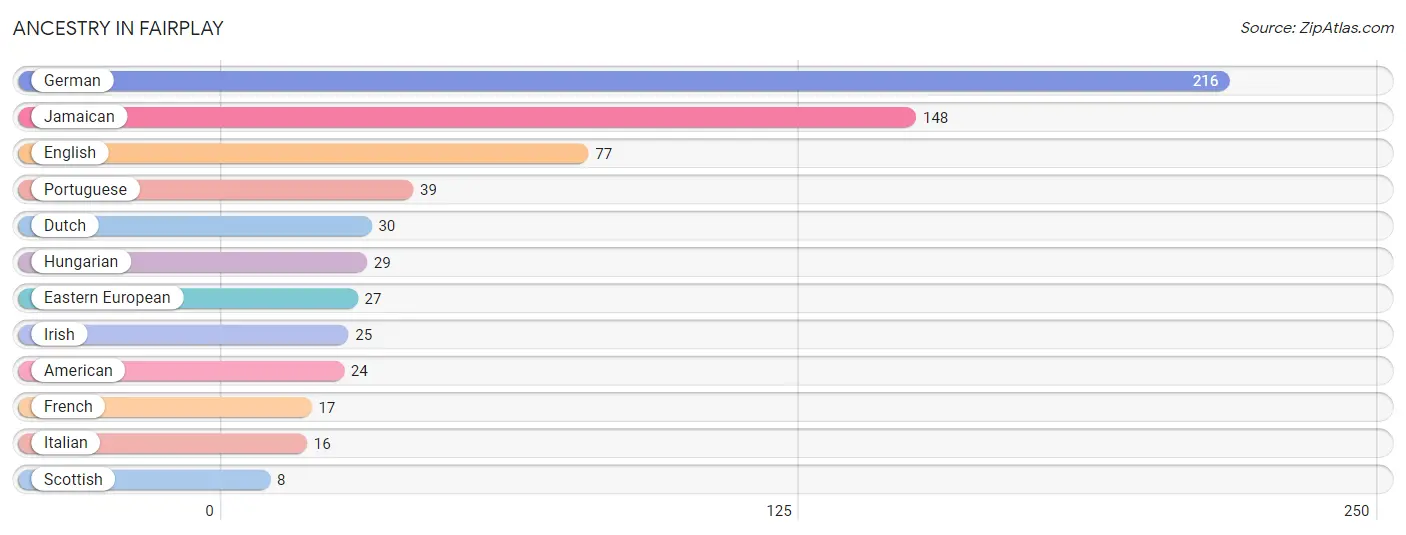
| Ancestry | # Population | % Population |
| American | 24 | 4.4% |
| Dutch | 30 | 5.5% |
| Eastern European | 27 | 5.0% |
| English | 77 | 14.2% |
| French | 17 | 3.1% |
| German | 216 | 39.8% |
| Hungarian | 29 | 5.3% |
| Irish | 25 | 4.6% |
| Italian | 16 | 2.9% |
| Jamaican | 148 | 27.3% |
| Portuguese | 39 | 7.2% |
| Scottish | 8 | 1.5% | View All 12 Rows |
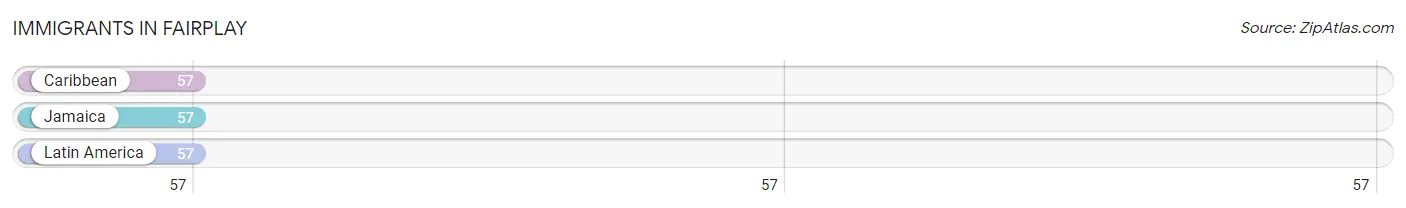
Immigrants in Fairplay
The most numerous immigrant groups reported in Fairplay came from Caribbean (57 | 10.5%), Jamaica (57 | 10.5%), and Latin America (57 | 10.5%), together accounting for 31.5% of all Fairplay residents.
| Immigration Origin | # Population | % Population |
| Caribbean | 57 | 10.5% |
| Jamaica | 57 | 10.5% |
| Latin America | 57 | 10.5% | View All 3 Rows |
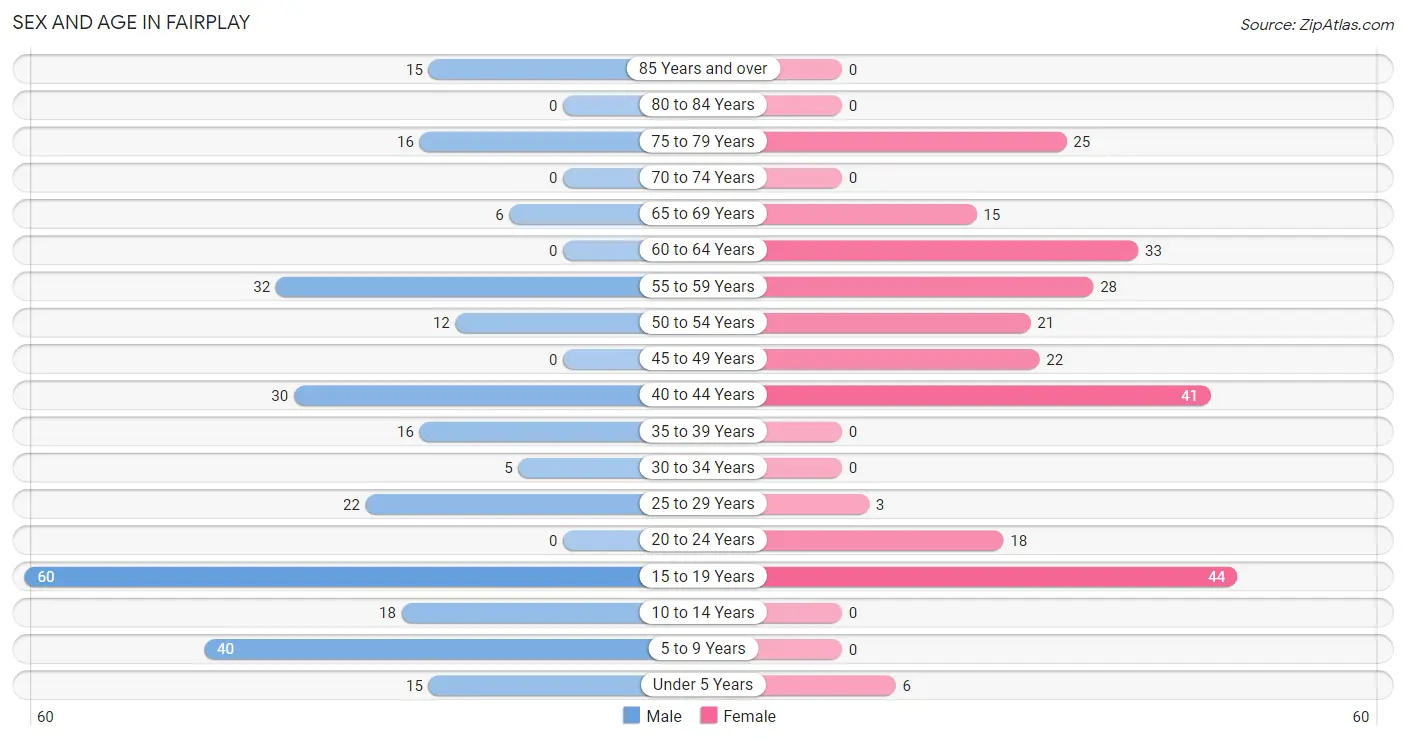
Sex and Age in Fairplay
Sex and Age in Fairplay
The most populous age groups in Fairplay are 15 to 19 Years (60 | 20.9%) for men and 15 to 19 Years (44 | 17.2%) for women.
| Age Bracket | Male | Female |
| Under 5 Years | 15 (5.2%) | 6 (2.3%) |
| 5 to 9 Years | 40 (13.9%) | 0 (0.0%) |
| 10 to 14 Years | 18 (6.3%) | 0 (0.0%) |
| 15 to 19 Years | 60 (20.9%) | 44 (17.2%) |
| 20 to 24 Years | 0 (0.0%) | 18 (7.0%) |
| 25 to 29 Years | 22 (7.7%) | 3 (1.2%) |
| 30 to 34 Years | 5 (1.7%) | 0 (0.0%) |
| 35 to 39 Years | 16 (5.6%) | 0 (0.0%) |
| 40 to 44 Years | 30 (10.4%) | 41 (16.0%) |
| 45 to 49 Years | 0 (0.0%) | 22 (8.6%) |
| 50 to 54 Years | 12 (4.2%) | 21 (8.2%) |
| 55 to 59 Years | 32 (11.2%) | 28 (10.9%) |
| 60 to 64 Years | 0 (0.0%) | 33 (12.9%) |
| 65 to 69 Years | 6 (2.1%) | 15 (5.9%) |
| 70 to 74 Years | 0 (0.0%) | 0 (0.0%) |
| 75 to 79 Years | 16 (5.6%) | 25 (9.8%) |
| 80 to 84 Years | 0 (0.0%) | 0 (0.0%) |
| 85 Years and over | 15 (5.2%) | 0 (0.0%) |
| Total | 287 (100.0%) | 256 (100.0%) |
Families and Households in Fairplay
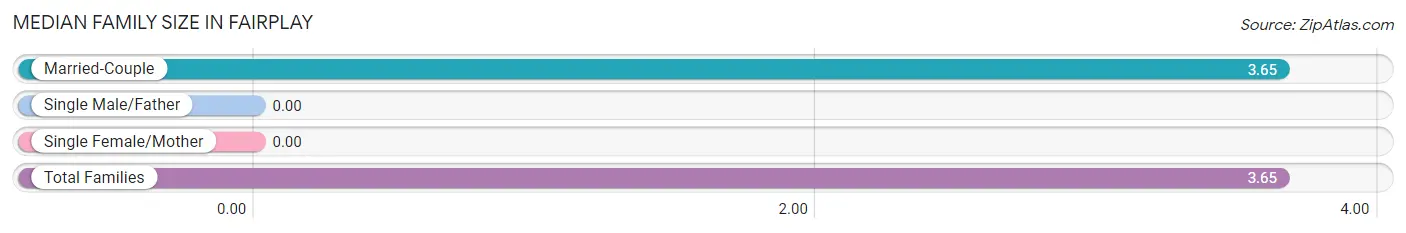
Median Family Size in Fairplay
| Family Type | # Families | Family Size |
| Married-Couple | 134 (100.0%) | 3.65 |
| Single Male/Father | 0 (0.0%) | - |
| Single Female/Mother | 0 (0.0%) | - |
| Total Families | 134 (100.0%) | 3.65 |
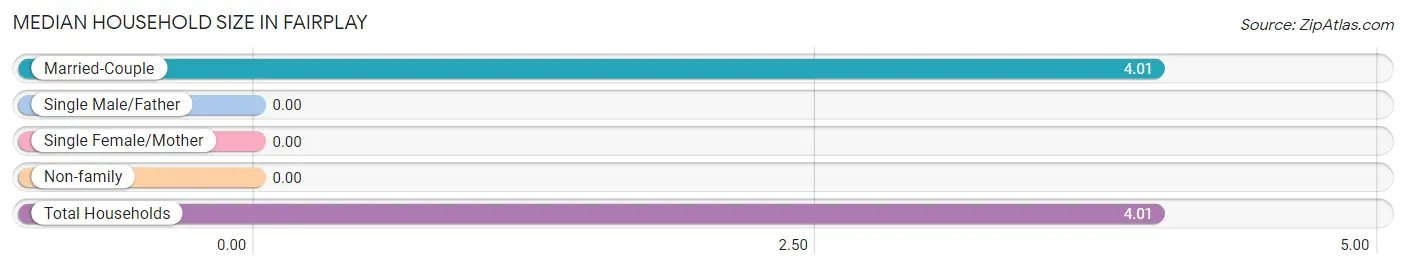
Median Household Size in Fairplay
| Household Type | # Households | Household Size |
| Married-Couple | 134 (100.0%) | 4.01 |
| Single Male/Father | 0 (0.0%) | - |
| Single Female/Mother | 0 (0.0%) | - |
| Non-family | 0 (0.0%) | - |
| Total Households | 134 (100.0%) | 4.01 |
Household Size by Marriage Status in Fairplay
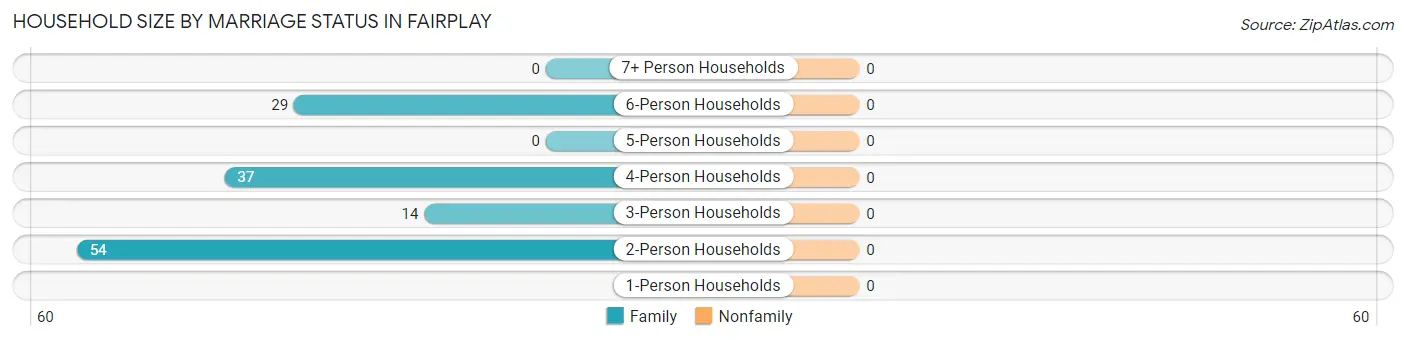
| Household Size | Family Households | Nonfamily Households |
| 1-Person Households | - | 0 (0.0%) |
| 2-Person Households | 54 (40.3%) | 0 (0.0%) |
| 3-Person Households | 14 (10.4%) | 0 (0.0%) |
| 4-Person Households | 37 (27.6%) | 0 (0.0%) |
| 5-Person Households | 0 (0.0%) | 0 (0.0%) |
| 6-Person Households | 29 (21.6%) | 0 (0.0%) |
| 7+ Person Households | 0 (0.0%) | 0 (0.0%) |
| Total | 134 (100.0%) | 0 (0.0%) |
Female Fertility in Fairplay
Fertility by Age in Fairplay
Average fertility rate in Fairplay is 94.0 births per 1,000 women. Women in the age bracket of 35 to 50 years have the highest fertility rate with 190.0 births per 1,000 women. Women in the age bracket of 35 to 50 years acount for 100.0% of all women with births.
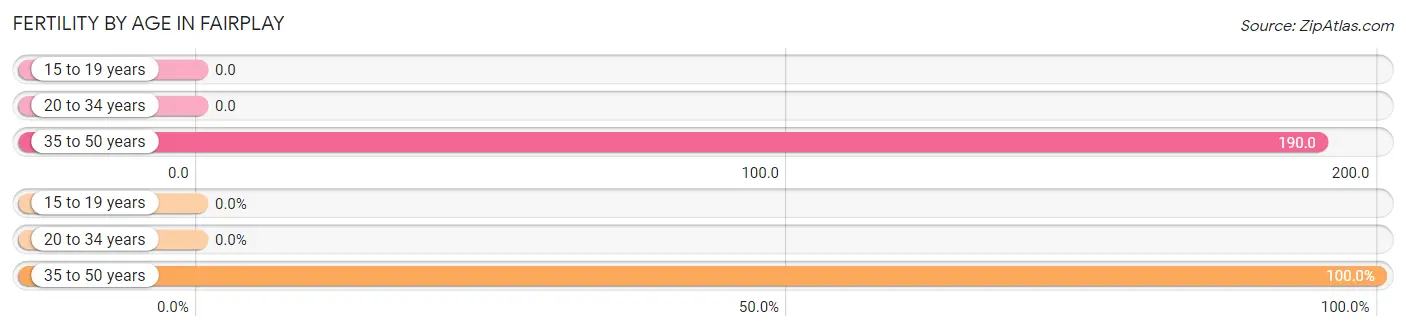
| Age Bracket | Women with Births | Births / 1,000 Women |
| 15 to 19 years | 0 (0.0%) | 0.0 |
| 20 to 34 years | 0 (0.0%) | 0.0 |
| 35 to 50 years | 12 (100.0%) | 190.0 |
| Total | 12 (100.0%) | 94.0 |
Fertility by Age by Marriage Status in Fairplay
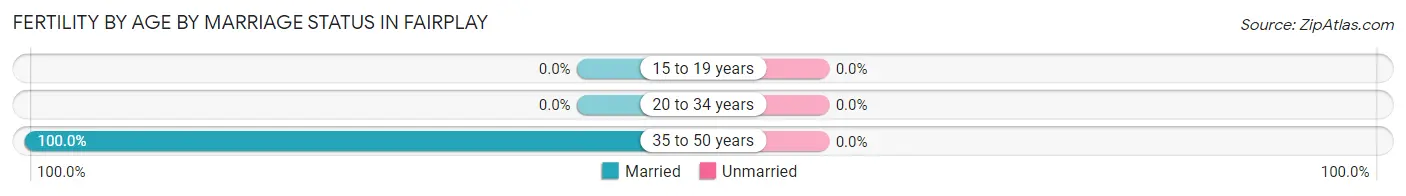
| Age Bracket | Married | Unmarried |
| 15 to 19 years | 0 (0.0%) | 0 (0.0%) |
| 20 to 34 years | 0 (0.0%) | 0 (0.0%) |
| 35 to 50 years | 12 (100.0%) | 0 (0.0%) |
| Total | 12 (100.0%) | 0 (0.0%) |
Fertility by Education in Fairplay
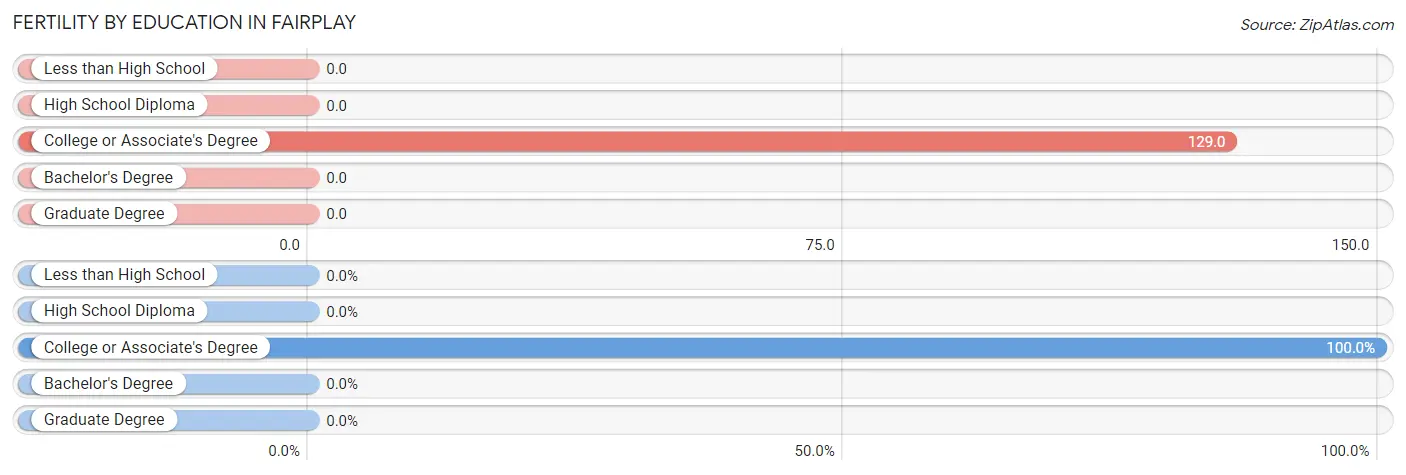
| Educational Attainment | Women with Births | Births / 1,000 Women |
| Less than High School | 0 (0.0%) | 0.0 |
| High School Diploma | 0 (0.0%) | 0.0 |
| College or Associate's Degree | 12 (100.0%) | 129.0 |
| Bachelor's Degree | 0 (0.0%) | 0.0 |
| Graduate Degree | 0 (0.0%) | 0.0 |
| Total | 12 (100.0%) | 94.0 |
Fertility by Education by Marriage Status in Fairplay
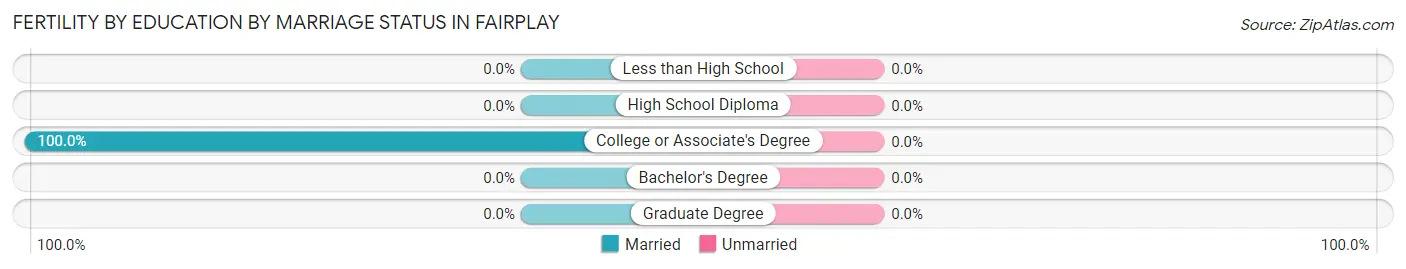
| Educational Attainment | Married | Unmarried |
| Less than High School | 0 (0.0%) | 0 (0.0%) |
| High School Diploma | 0 (0.0%) | 0 (0.0%) |
| College or Associate's Degree | 12 (100.0%) | 0 (0.0%) |
| Bachelor's Degree | 0 (0.0%) | 0 (0.0%) |
| Graduate Degree | 0 (0.0%) | 0 (0.0%) |
| Total | 12 (100.0%) | 0 (0.0%) |
Employment Characteristics in Fairplay
Employment by Class of Employer in Fairplay
Among the 341 employed individuals in Fairplay, private company employees (248 | 72.7%), not-for-profit organizations (47 | 13.8%), and local government employees (27 | 7.9%) make up the most common classes of employment.
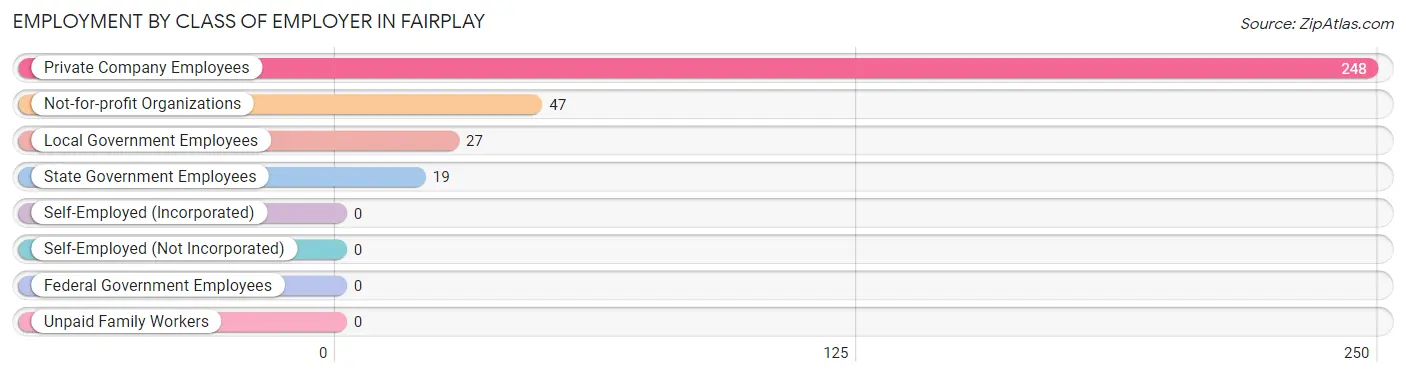
| Employer Class | # Employees | % Employees |
| Private Company Employees | 248 | 72.7% |
| Self-Employed (Incorporated) | 0 | 0.0% |
| Self-Employed (Not Incorporated) | 0 | 0.0% |
| Not-for-profit Organizations | 47 | 13.8% |
| Local Government Employees | 27 | 7.9% |
| State Government Employees | 19 | 5.6% |
| Federal Government Employees | 0 | 0.0% |
| Unpaid Family Workers | 0 | 0.0% |
| Total | 341 | 100.0% |
Employment Status by Age in Fairplay
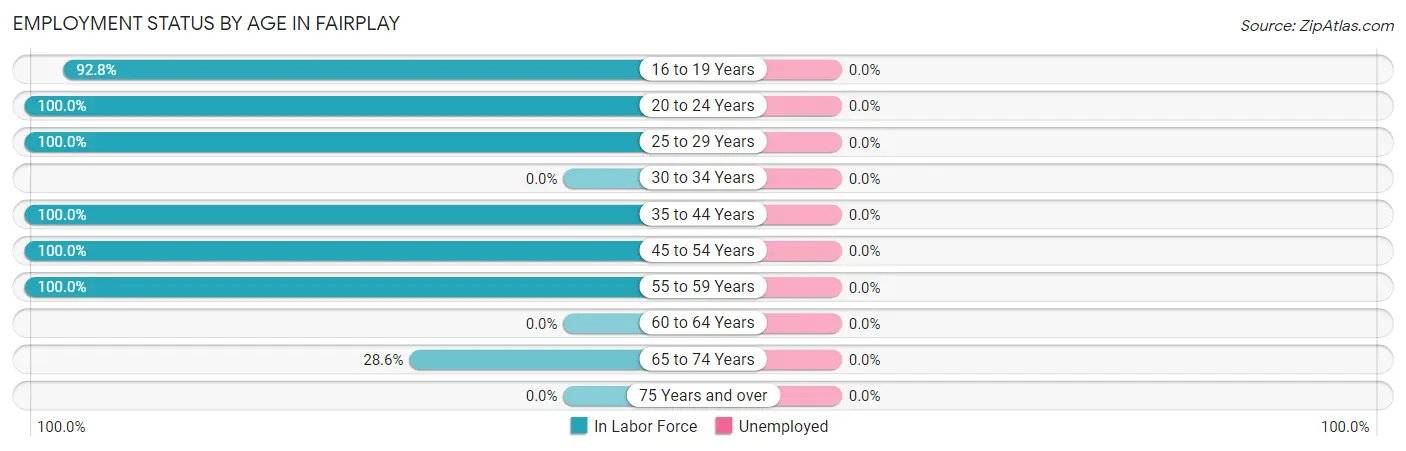
| Age Bracket | In Labor Force | Unemployed |
| 16 to 19 Years | 90 (92.8%) | 0 (0.0%) |
| 20 to 24 Years | 18 (100.0%) | 0 (0.0%) |
| 25 to 29 Years | 25 (100.0%) | 0 (0.0%) |
| 30 to 34 Years | 0 (0.0%) | 0 (0.0%) |
| 35 to 44 Years | 87 (100.0%) | 0 (0.0%) |
| 45 to 54 Years | 55 (100.0%) | 0 (0.0%) |
| 55 to 59 Years | 60 (100.0%) | 0 (0.0%) |
| 60 to 64 Years | 0 (0.0%) | 0 (0.0%) |
| 65 to 74 Years | 6 (28.6%) | 0 (0.0%) |
| 75 Years and over | 0 (0.0%) | 0 (0.0%) |
| Total | 341 (74.6%) | 0 (0.0%) |
Employment Status by Educational Attainment in Fairplay
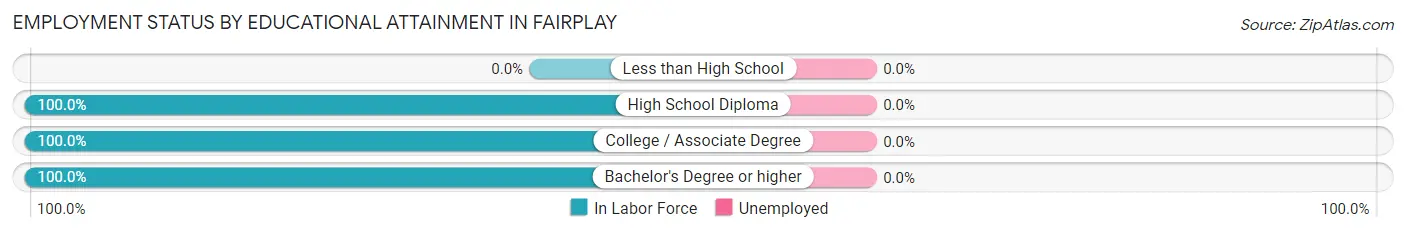
| Educational Attainment | In Labor Force | Unemployed |
| Less than High School | 0 (0.0%) | 0 (0.0%) |
| High School Diploma | 78 (100.0%) | 0 (0.0%) |
| College / Associate Degree | 107 (100.0%) | 0 (0.0%) |
| Bachelor's Degree or higher | 42 (100.0%) | 0 (0.0%) |
| Total | 227 (85.7%) | 0 (0.0%) |
Employment Occupations by Sex in Fairplay
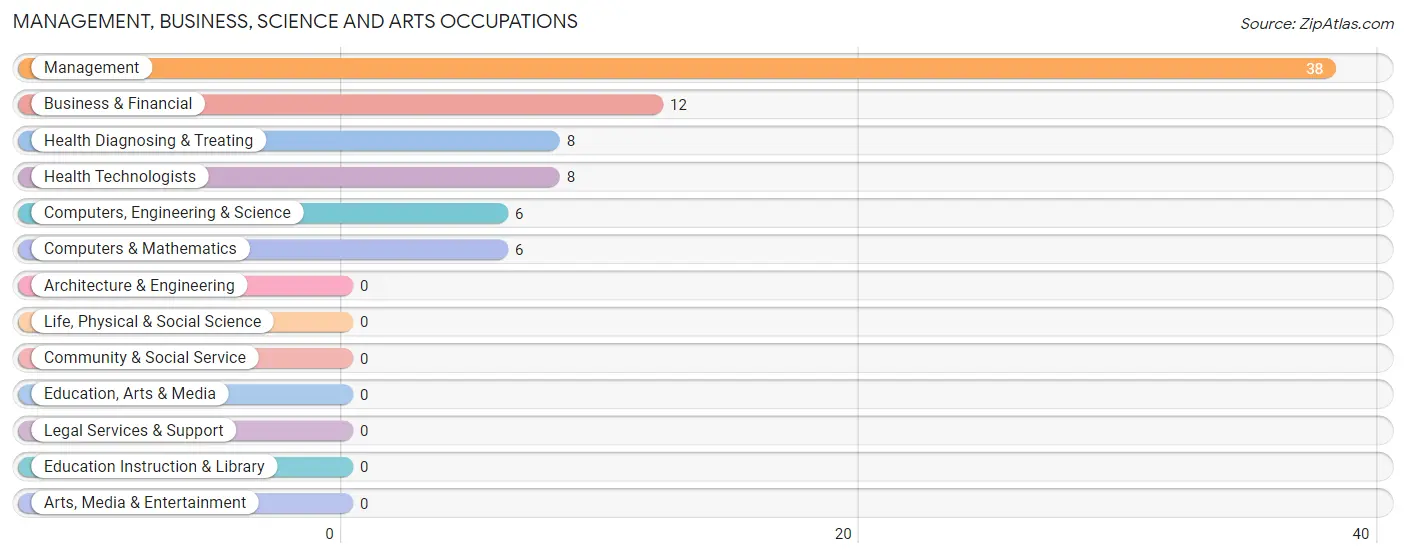
Management, Business, Science and Arts Occupations
The most common Management, Business, Science and Arts occupations in Fairplay are Management (38 | 11.1%), Business & Financial (12 | 3.5%), Health Diagnosing & Treating (8 | 2.4%), Health Technologists (8 | 2.4%), and Computers, Engineering & Science (6 | 1.8%).
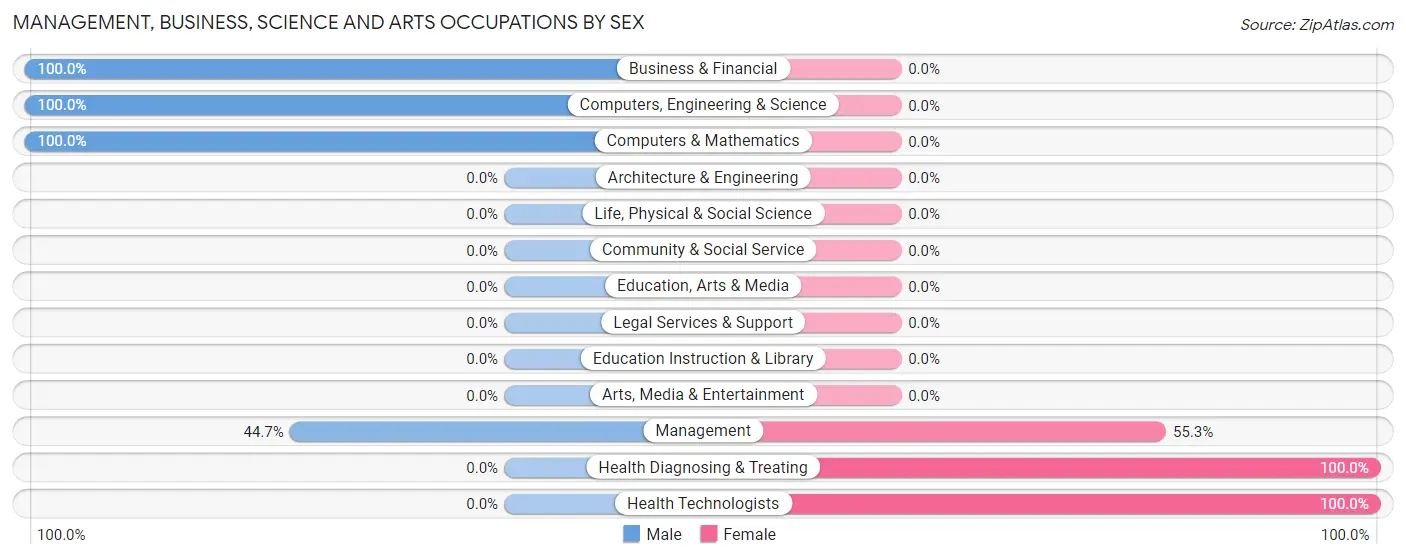
Management, Business, Science and Arts Occupations by Sex
Within the Management, Business, Science and Arts occupations in Fairplay, the most male-oriented occupations are Business & Financial (100.0%), Computers, Engineering & Science (100.0%), and Computers & Mathematics (100.0%), while the most female-oriented occupations are Health Diagnosing & Treating (100.0%), Health Technologists (100.0%), and Management (55.3%).
| Occupation | Male | Female |
| Management | 17 (44.7%) | 21 (55.3%) |
| Business & Financial | 12 (100.0%) | 0 (0.0%) |
| Computers, Engineering & Science | 6 (100.0%) | 0 (0.0%) |
| Computers & Mathematics | 6 (100.0%) | 0 (0.0%) |
| Architecture & Engineering | 0 (0.0%) | 0 (0.0%) |
| Life, Physical & Social Science | 0 (0.0%) | 0 (0.0%) |
| Community & Social Service | 0 (0.0%) | 0 (0.0%) |
| Education, Arts & Media | 0 (0.0%) | 0 (0.0%) |
| Legal Services & Support | 0 (0.0%) | 0 (0.0%) |
| Education Instruction & Library | 0 (0.0%) | 0 (0.0%) |
| Arts, Media & Entertainment | 0 (0.0%) | 0 (0.0%) |
| Health Diagnosing & Treating | 0 (0.0%) | 8 (100.0%) |
| Health Technologists | 0 (0.0%) | 8 (100.0%) |
| Total (Category) | 35 (54.7%) | 29 (45.3%) |
| Total (Overall) | 178 (52.2%) | 163 (47.8%) |
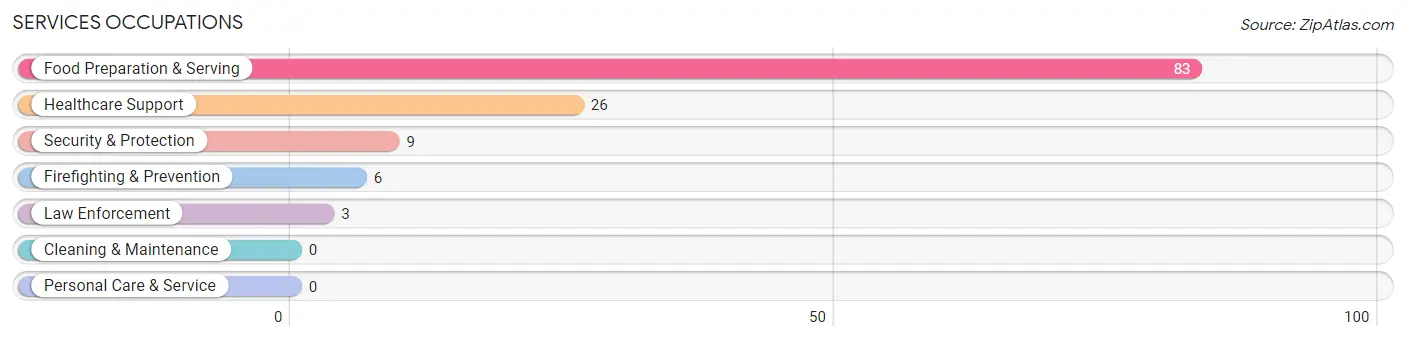
Services Occupations
The most common Services occupations in Fairplay are Food Preparation & Serving (83 | 24.3%), Healthcare Support (26 | 7.6%), Security & Protection (9 | 2.6%), Firefighting & Prevention (6 | 1.8%), and Law Enforcement (3 | 0.9%).
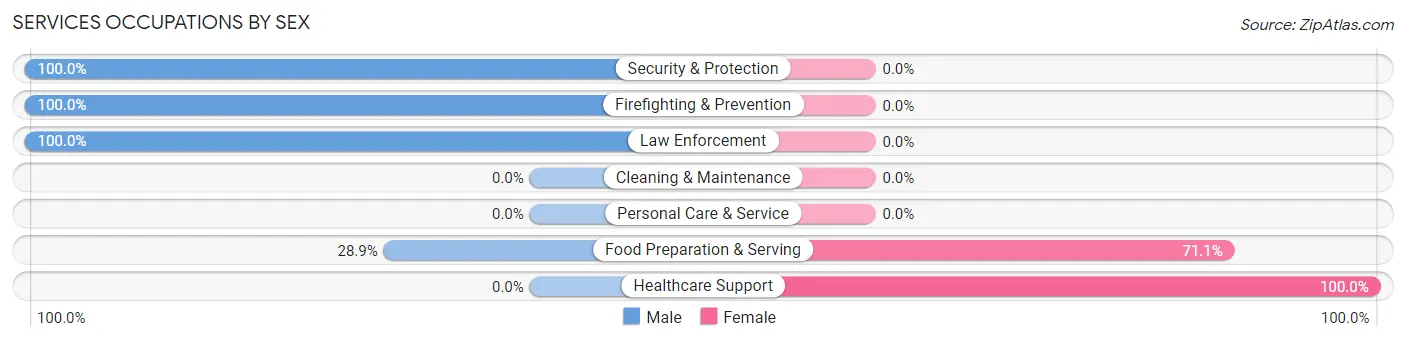
Services Occupations by Sex
Within the Services occupations in Fairplay, the most male-oriented occupations are Security & Protection (100.0%), Firefighting & Prevention (100.0%), and Law Enforcement (100.0%), while the most female-oriented occupations are Healthcare Support (100.0%), and Food Preparation & Serving (71.1%).
| Occupation | Male | Female |
| Healthcare Support | 0 (0.0%) | 26 (100.0%) |
| Security & Protection | 9 (100.0%) | 0 (0.0%) |
| Firefighting & Prevention | 6 (100.0%) | 0 (0.0%) |
| Law Enforcement | 3 (100.0%) | 0 (0.0%) |
| Food Preparation & Serving | 24 (28.9%) | 59 (71.1%) |
| Cleaning & Maintenance | 0 (0.0%) | 0 (0.0%) |
| Personal Care & Service | 0 (0.0%) | 0 (0.0%) |
| Total (Category) | 33 (28.0%) | 85 (72.0%) |
| Total (Overall) | 178 (52.2%) | 163 (47.8%) |
Sales and Office Occupations
The most common Sales and Office occupations in Fairplay are Office & Administration (82 | 24.0%), and Sales & Related (18 | 5.3%).
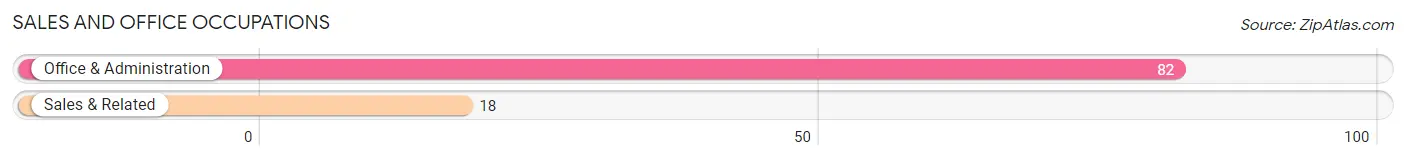
Sales and Office Occupations by Sex
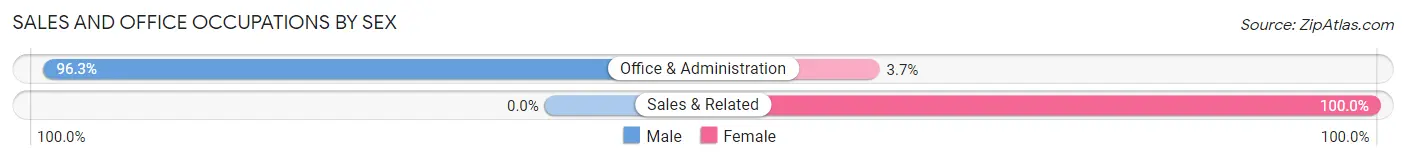
| Occupation | Male | Female |
| Sales & Related | 0 (0.0%) | 18 (100.0%) |
| Office & Administration | 79 (96.3%) | 3 (3.7%) |
| Total (Category) | 79 (79.0%) | 21 (21.0%) |
| Total (Overall) | 178 (52.2%) | 163 (47.8%) |
Natural Resources, Construction and Maintenance Occupations
The most common Natural Resources, Construction and Maintenance occupations in Fairplay are , and Construction & Extraction (8 | 2.4%).
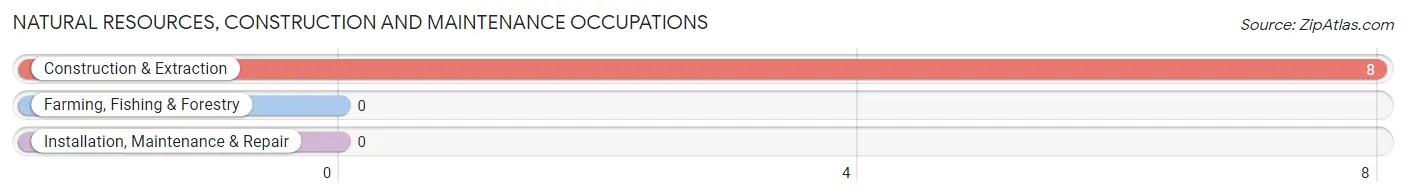
Natural Resources, Construction and Maintenance Occupations by Sex
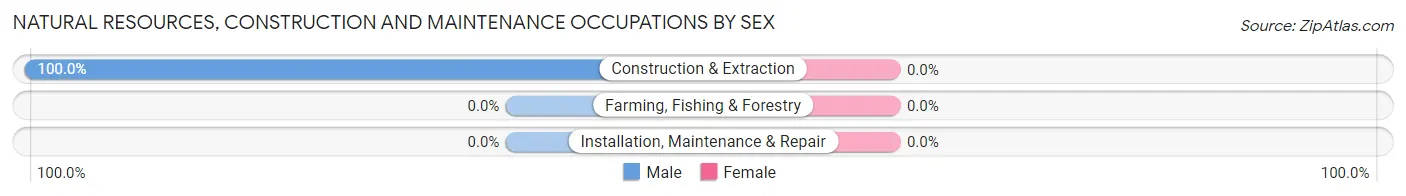
| Occupation | Male | Female |
| Farming, Fishing & Forestry | 0 (0.0%) | 0 (0.0%) |
| Construction & Extraction | 8 (100.0%) | 0 (0.0%) |
| Installation, Maintenance & Repair | 0 (0.0%) | 0 (0.0%) |
| Total (Category) | 8 (100.0%) | 0 (0.0%) |
| Total (Overall) | 178 (52.2%) | 163 (47.8%) |
Production, Transportation and Moving Occupations
The most common Production, Transportation and Moving occupations in Fairplay are , and Transportation (51 | 15.0%).
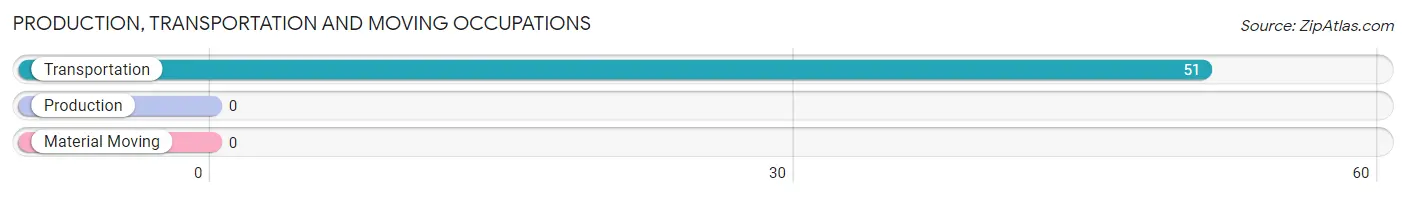
Production, Transportation and Moving Occupations by Sex
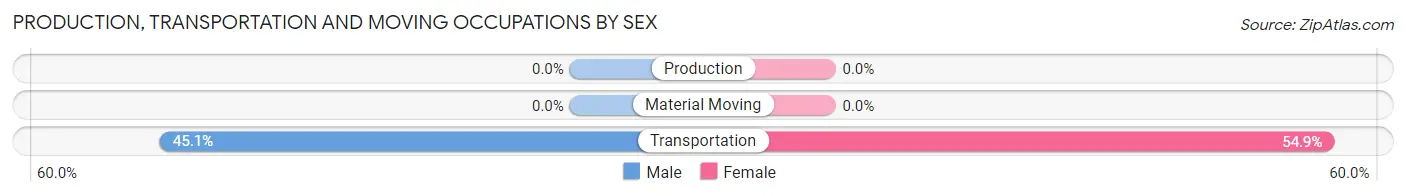
| Occupation | Male | Female |
| Production | 0 (0.0%) | 0 (0.0%) |
| Transportation | 23 (45.1%) | 28 (54.9%) |
| Material Moving | 0 (0.0%) | 0 (0.0%) |
| Total (Category) | 23 (45.1%) | 28 (54.9%) |
| Total (Overall) | 178 (52.2%) | 163 (47.8%) |
Employment Industries by Sex in Fairplay
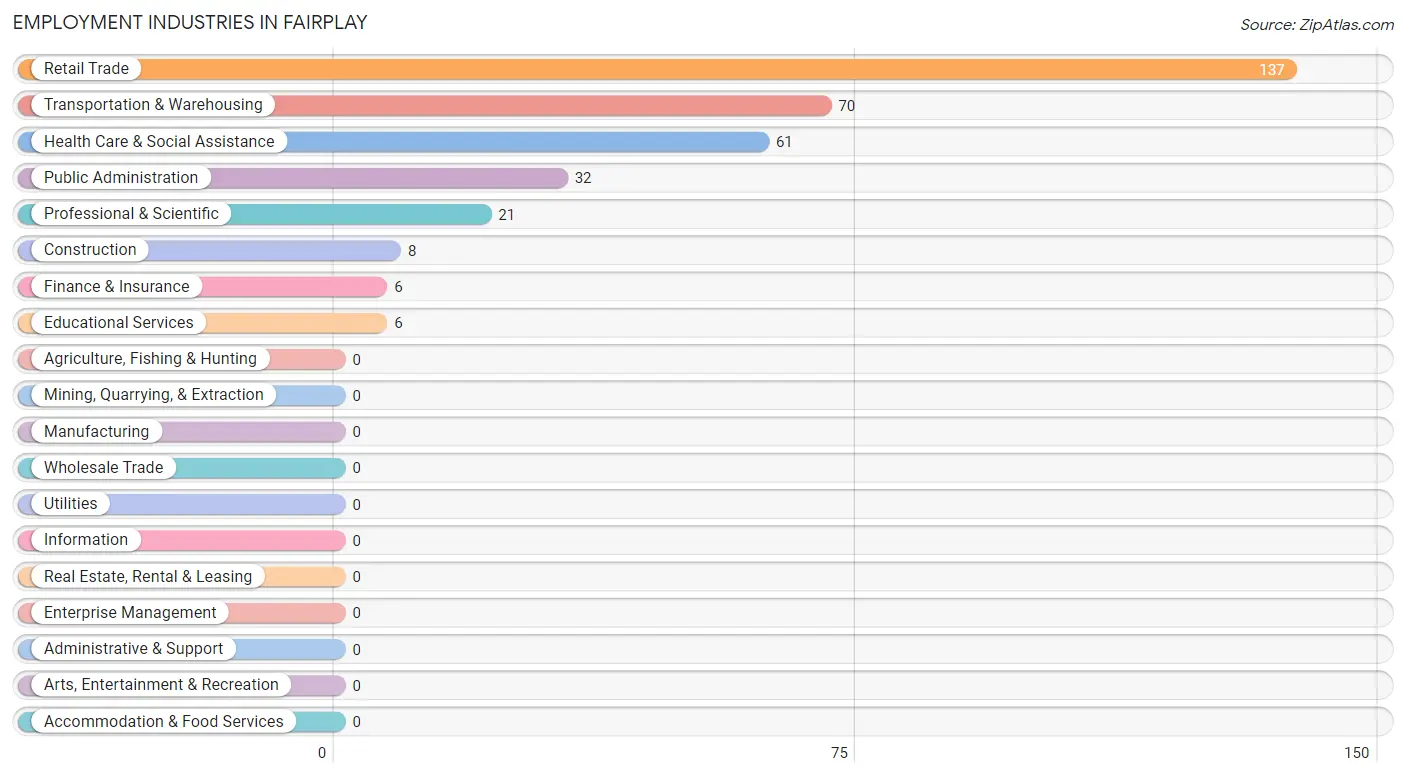
Employment Industries in Fairplay
The major employment industries in Fairplay include Retail Trade (137 | 40.2%), Transportation & Warehousing (70 | 20.5%), Health Care & Social Assistance (61 | 17.9%), Public Administration (32 | 9.4%), and Professional & Scientific (21 | 6.2%).
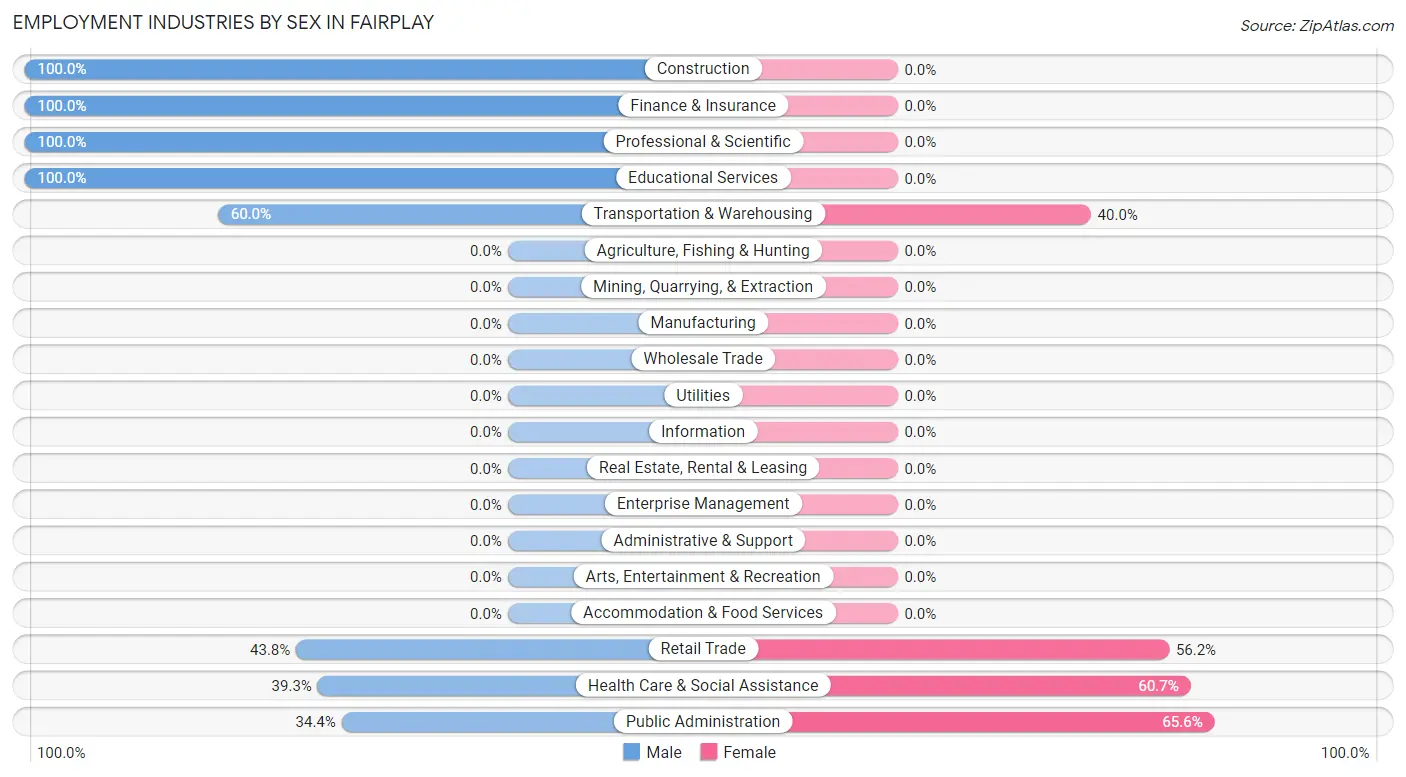
Employment Industries by Sex in Fairplay
The Fairplay industries that see more men than women are Construction (100.0%), Finance & Insurance (100.0%), and Professional & Scientific (100.0%), whereas the industries that tend to have a higher number of women are Public Administration (65.6%), Health Care & Social Assistance (60.7%), and Retail Trade (56.2%).
| Industry | Male | Female |
| Agriculture, Fishing & Hunting | 0 (0.0%) | 0 (0.0%) |
| Mining, Quarrying, & Extraction | 0 (0.0%) | 0 (0.0%) |
| Construction | 8 (100.0%) | 0 (0.0%) |
| Manufacturing | 0 (0.0%) | 0 (0.0%) |
| Wholesale Trade | 0 (0.0%) | 0 (0.0%) |
| Retail Trade | 60 (43.8%) | 77 (56.2%) |
| Transportation & Warehousing | 42 (60.0%) | 28 (40.0%) |
| Utilities | 0 (0.0%) | 0 (0.0%) |
| Information | 0 (0.0%) | 0 (0.0%) |
| Finance & Insurance | 6 (100.0%) | 0 (0.0%) |
| Real Estate, Rental & Leasing | 0 (0.0%) | 0 (0.0%) |
| Professional & Scientific | 21 (100.0%) | 0 (0.0%) |
| Enterprise Management | 0 (0.0%) | 0 (0.0%) |
| Administrative & Support | 0 (0.0%) | 0 (0.0%) |
| Educational Services | 6 (100.0%) | 0 (0.0%) |
| Health Care & Social Assistance | 24 (39.3%) | 37 (60.7%) |
| Arts, Entertainment & Recreation | 0 (0.0%) | 0 (0.0%) |
| Accommodation & Food Services | 0 (0.0%) | 0 (0.0%) |
| Public Administration | 11 (34.4%) | 21 (65.6%) |
| Total | 178 (52.2%) | 163 (47.8%) |
Education in Fairplay
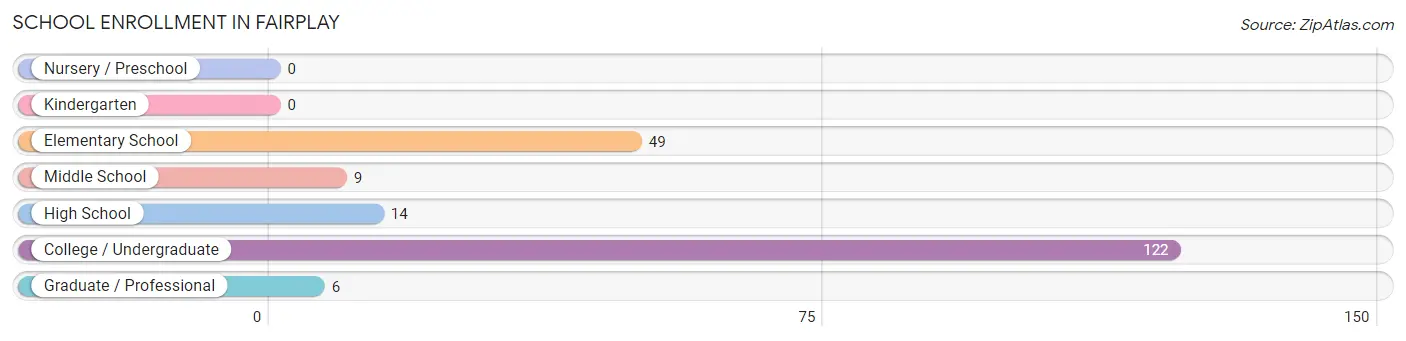
School Enrollment in Fairplay
The most common levels of schooling among the 200 students in Fairplay are college / undergraduate (122 | 61.0%), elementary school (49 | 24.5%), and high school (14 | 7.0%).
| School Level | # Students | % Students |
| Nursery / Preschool | 0 | 0.0% |
| Kindergarten | 0 | 0.0% |
| Elementary School | 49 | 24.5% |
| Middle School | 9 | 4.5% |
| High School | 14 | 7.0% |
| College / Undergraduate | 122 | 61.0% |
| Graduate / Professional | 6 | 3.0% |
| Total | 200 | 100.0% |
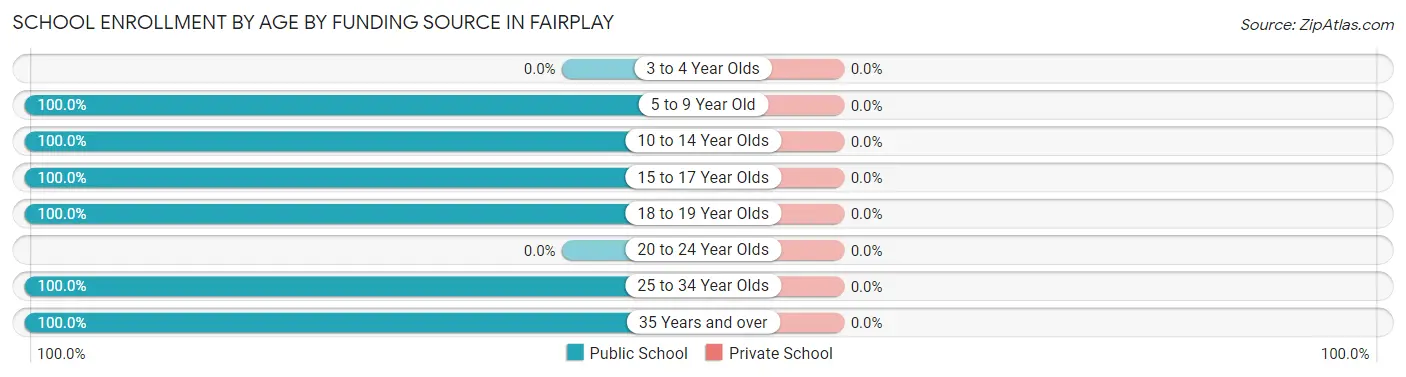
School Enrollment by Age by Funding Source in Fairplay
| Age Bracket | Public School | Private School |
| 3 to 4 Year Olds | 0 (0.0%) | 0 (0.0%) |
| 5 to 9 Year Old | 40 (100.0%) | 0 (0.0%) |
| 10 to 14 Year Olds | 18 (100.0%) | 0 (0.0%) |
| 15 to 17 Year Olds | 14 (100.0%) | 0 (0.0%) |
| 18 to 19 Year Olds | 90 (100.0%) | 0 (0.0%) |
| 20 to 24 Year Olds | 0 (0.0%) | 0 (0.0%) |
| 25 to 34 Year Olds | 3 (100.0%) | 0 (0.0%) |
| 35 Years and over | 35 (100.0%) | 0 (0.0%) |
| Total | 200 (100.0%) | 0 (0.0%) |
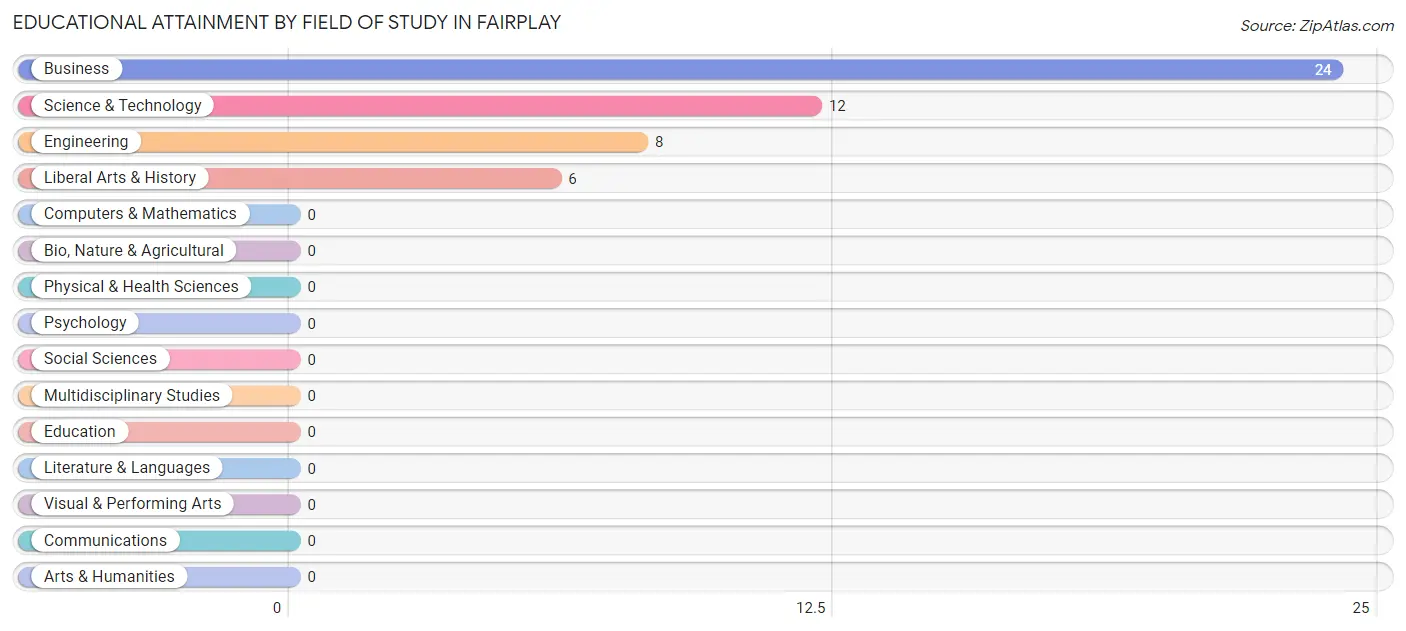
Educational Attainment by Field of Study in Fairplay
Business (24 | 48.0%), science & technology (12 | 24.0%), engineering (8 | 16.0%), and liberal arts & history (6 | 12.0%) are the most common fields of study among 50 individuals in Fairplay who have obtained a bachelor's degree or higher.
| Field of Study | # Graduates | % Graduates |
| Computers & Mathematics | 0 | 0.0% |
| Bio, Nature & Agricultural | 0 | 0.0% |
| Physical & Health Sciences | 0 | 0.0% |
| Psychology | 0 | 0.0% |
| Social Sciences | 0 | 0.0% |
| Engineering | 8 | 16.0% |
| Multidisciplinary Studies | 0 | 0.0% |
| Science & Technology | 12 | 24.0% |
| Business | 24 | 48.0% |
| Education | 0 | 0.0% |
| Literature & Languages | 0 | 0.0% |
| Liberal Arts & History | 6 | 12.0% |
| Visual & Performing Arts | 0 | 0.0% |
| Communications | 0 | 0.0% |
| Arts & Humanities | 0 | 0.0% |
| Total | 50 | 100.0% |
Transportation & Commute in Fairplay
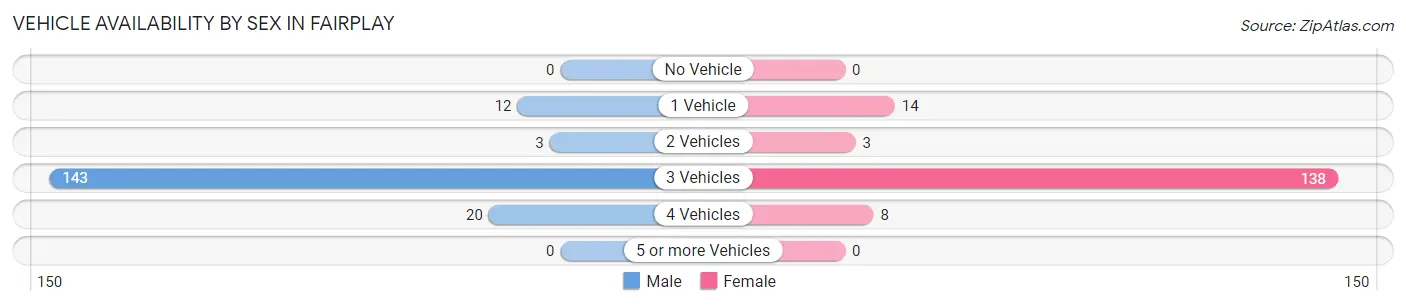
Vehicle Availability by Sex in Fairplay
The most prevalent vehicle ownership categories in Fairplay are males with 3 vehicles (143, accounting for 80.3%) and females with 3 vehicles (138, making up 87.7%).
| Vehicles Available | Male | Female |
| No Vehicle | 0 (0.0%) | 0 (0.0%) |
| 1 Vehicle | 12 (6.7%) | 14 (8.6%) |
| 2 Vehicles | 3 (1.7%) | 3 (1.8%) |
| 3 Vehicles | 143 (80.3%) | 138 (84.7%) |
| 4 Vehicles | 20 (11.2%) | 8 (4.9%) |
| 5 or more Vehicles | 0 (0.0%) | 0 (0.0%) |
| Total | 178 (100.0%) | 163 (100.0%) |
Commute Time in Fairplay
The most frequently occuring commute durations in Fairplay are 10 to 14 minutes (60 commuters, 28.2%), 15 to 19 minutes (48 commuters, 22.5%), and 90 or more minutes (32 commuters, 15.0%).
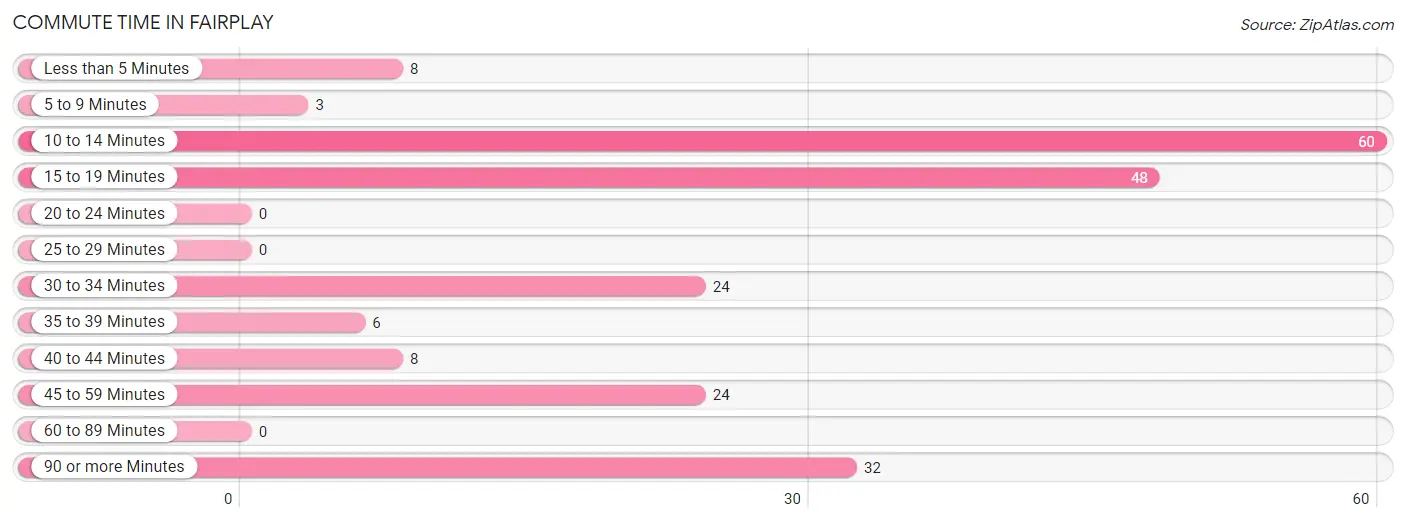
| Commute Time | # Commuters | % Commuters |
| Less than 5 Minutes | 8 | 3.8% |
| 5 to 9 Minutes | 3 | 1.4% |
| 10 to 14 Minutes | 60 | 28.2% |
| 15 to 19 Minutes | 48 | 22.5% |
| 20 to 24 Minutes | 0 | 0.0% |
| 25 to 29 Minutes | 0 | 0.0% |
| 30 to 34 Minutes | 24 | 11.3% |
| 35 to 39 Minutes | 6 | 2.8% |
| 40 to 44 Minutes | 8 | 3.8% |
| 45 to 59 Minutes | 24 | 11.3% |
| 60 to 89 Minutes | 0 | 0.0% |
| 90 or more Minutes | 32 | 15.0% |
Commute Time by Sex in Fairplay
The most common commute times in Fairplay are 10 to 14 minutes (42 commuters, 38.5%) for males and 15 to 19 minutes (42 commuters, 40.4%) for females.
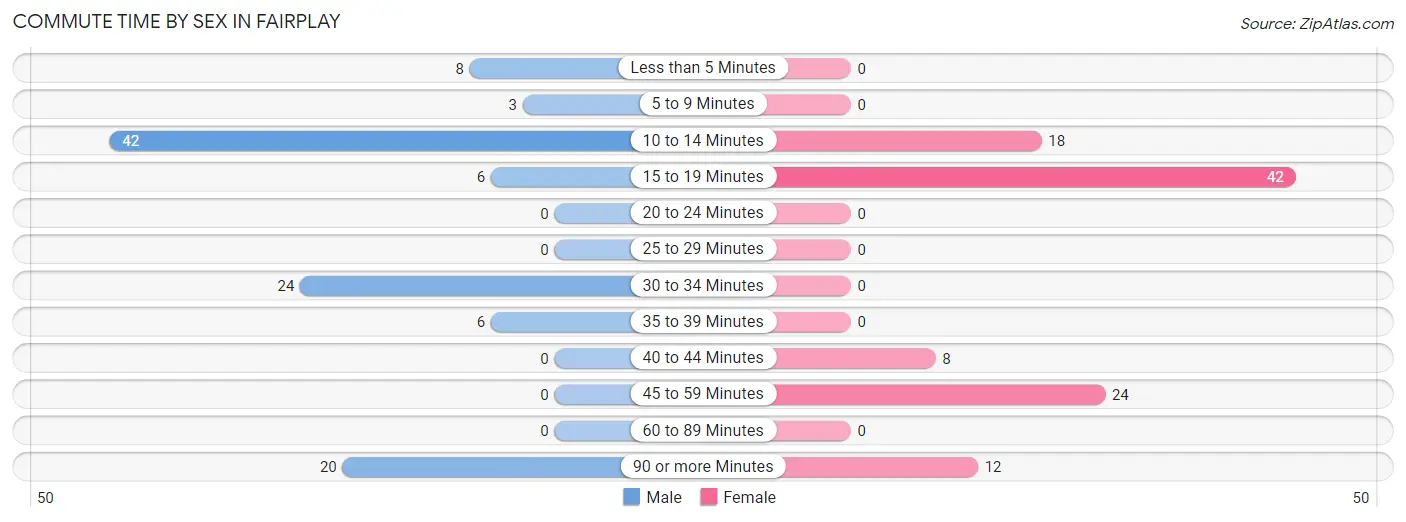
| Commute Time | Male | Female |
| Less than 5 Minutes | 8 (7.3%) | 0 (0.0%) |
| 5 to 9 Minutes | 3 (2.8%) | 0 (0.0%) |
| 10 to 14 Minutes | 42 (38.5%) | 18 (17.3%) |
| 15 to 19 Minutes | 6 (5.5%) | 42 (40.4%) |
| 20 to 24 Minutes | 0 (0.0%) | 0 (0.0%) |
| 25 to 29 Minutes | 0 (0.0%) | 0 (0.0%) |
| 30 to 34 Minutes | 24 (22.0%) | 0 (0.0%) |
| 35 to 39 Minutes | 6 (5.5%) | 0 (0.0%) |
| 40 to 44 Minutes | 0 (0.0%) | 8 (7.7%) |
| 45 to 59 Minutes | 0 (0.0%) | 24 (23.1%) |
| 60 to 89 Minutes | 0 (0.0%) | 0 (0.0%) |
| 90 or more Minutes | 20 (18.3%) | 12 (11.5%) |
Time of Departure to Work by Sex in Fairplay
The most frequent times of departure to work in Fairplay are 8:00 AM to 8:29 AM (32, 29.4%) for males and 7:30 AM to 7:59 AM (35, 33.7%) for females.
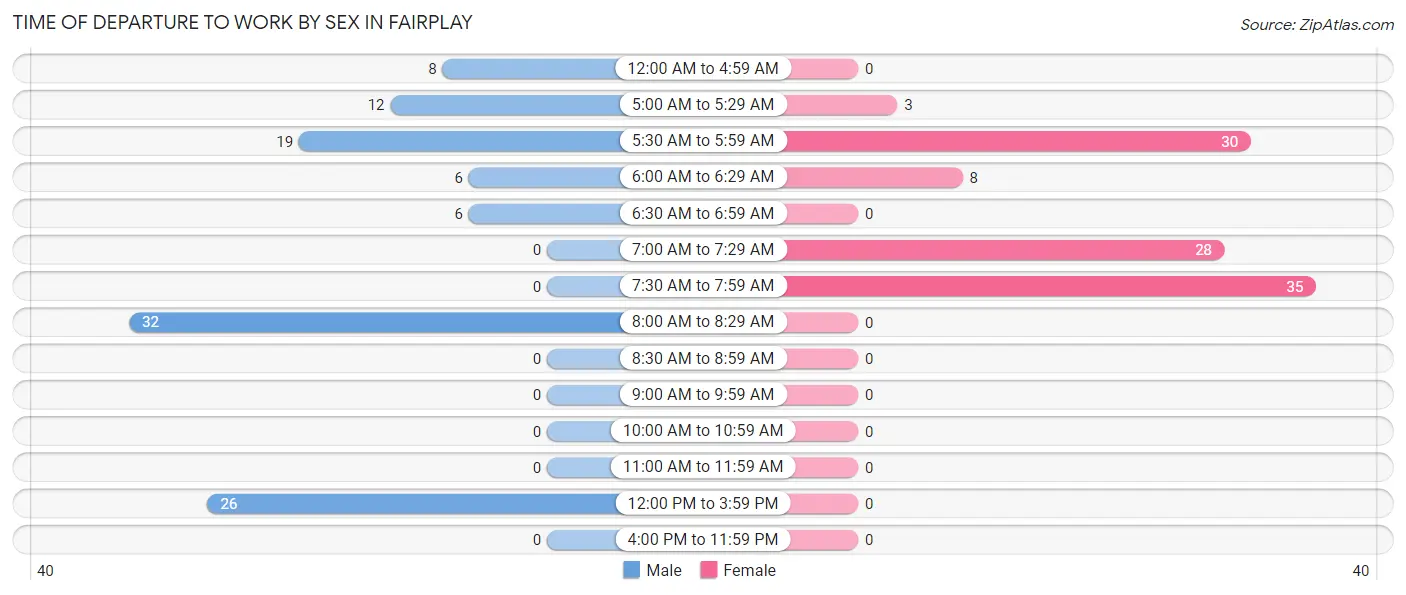
| Time of Departure | Male | Female |
| 12:00 AM to 4:59 AM | 8 (7.3%) | 0 (0.0%) |
| 5:00 AM to 5:29 AM | 12 (11.0%) | 3 (2.9%) |
| 5:30 AM to 5:59 AM | 19 (17.4%) | 30 (28.8%) |
| 6:00 AM to 6:29 AM | 6 (5.5%) | 8 (7.7%) |
| 6:30 AM to 6:59 AM | 6 (5.5%) | 0 (0.0%) |
| 7:00 AM to 7:29 AM | 0 (0.0%) | 28 (26.9%) |
| 7:30 AM to 7:59 AM | 0 (0.0%) | 35 (33.7%) |
| 8:00 AM to 8:29 AM | 32 (29.4%) | 0 (0.0%) |
| 8:30 AM to 8:59 AM | 0 (0.0%) | 0 (0.0%) |
| 9:00 AM to 9:59 AM | 0 (0.0%) | 0 (0.0%) |
| 10:00 AM to 10:59 AM | 0 (0.0%) | 0 (0.0%) |
| 11:00 AM to 11:59 AM | 0 (0.0%) | 0 (0.0%) |
| 12:00 PM to 3:59 PM | 26 (23.8%) | 0 (0.0%) |
| 4:00 PM to 11:59 PM | 0 (0.0%) | 0 (0.0%) |
| Total | 109 (100.0%) | 104 (100.0%) |
Housing Occupancy in Fairplay
Occupancy by Ownership in Fairplay
Of the total 134 dwellings in Fairplay, owner-occupied units account for 126 (94.0%), while renter-occupied units make up 8 (6.0%).
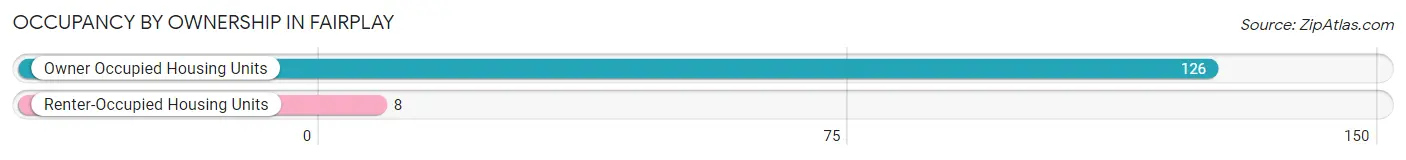
| Occupancy | # Housing Units | % Housing Units |
| Owner Occupied Housing Units | 126 | 94.0% |
| Renter-Occupied Housing Units | 8 | 6.0% |
| Total Occupied Housing Units | 134 | 100.0% |
Occupancy by Household Size in Fairplay
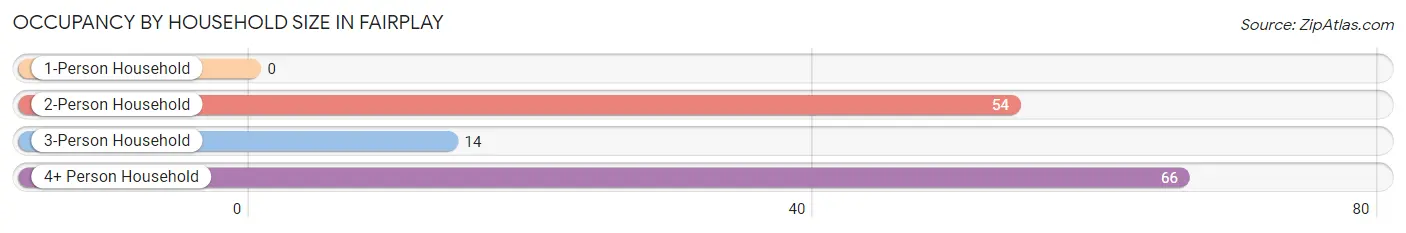
| Household Size | # Housing Units | % Housing Units |
| 1-Person Household | 0 | 0.0% |
| 2-Person Household | 54 | 40.3% |
| 3-Person Household | 14 | 10.4% |
| 4+ Person Household | 66 | 49.2% |
| Total Housing Units | 134 | 100.0% |
Occupancy by Ownership by Household Size in Fairplay
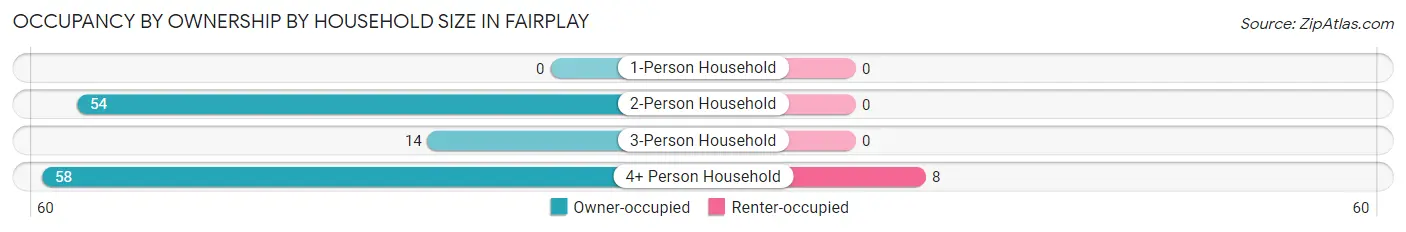
| Household Size | Owner-occupied | Renter-occupied |
| 1-Person Household | 0 (0.0%) | 0 (0.0%) |
| 2-Person Household | 54 (100.0%) | 0 (0.0%) |
| 3-Person Household | 14 (100.0%) | 0 (0.0%) |
| 4+ Person Household | 58 (87.9%) | 8 (12.1%) |
| Total Housing Units | 126 (94.0%) | 8 (6.0%) |
Occupancy by Educational Attainment in Fairplay
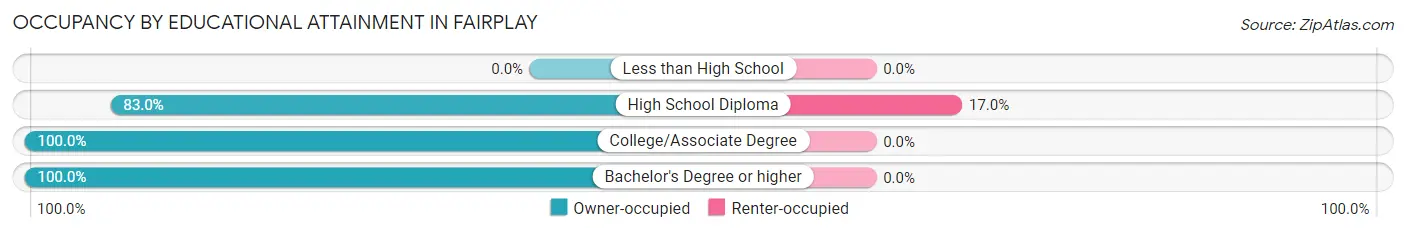
| Household Size | Owner-occupied | Renter-occupied |
| Less than High School | 0 (0.0%) | 0 (0.0%) |
| High School Diploma | 39 (83.0%) | 8 (17.0%) |
| College/Associate Degree | 64 (100.0%) | 0 (0.0%) |
| Bachelor's Degree or higher | 23 (100.0%) | 0 (0.0%) |
Occupancy by Age of Householder in Fairplay
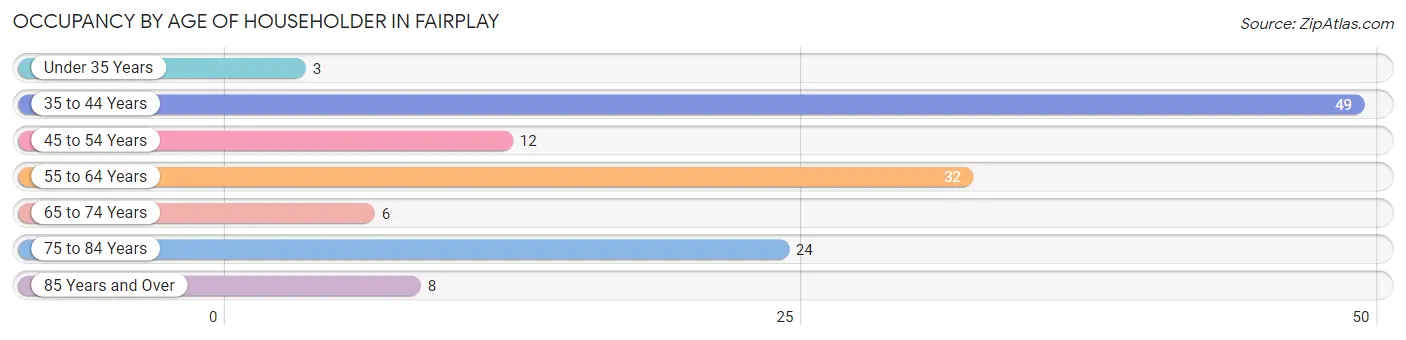
| Age Bracket | # Households | % Households |
| Under 35 Years | 3 | 2.2% |
| 35 to 44 Years | 49 | 36.6% |
| 45 to 54 Years | 12 | 9.0% |
| 55 to 64 Years | 32 | 23.9% |
| 65 to 74 Years | 6 | 4.5% |
| 75 to 84 Years | 24 | 17.9% |
| 85 Years and Over | 8 | 6.0% |
| Total | 134 | 100.0% |
Housing Finances in Fairplay
Median Income by Occupancy in Fairplay
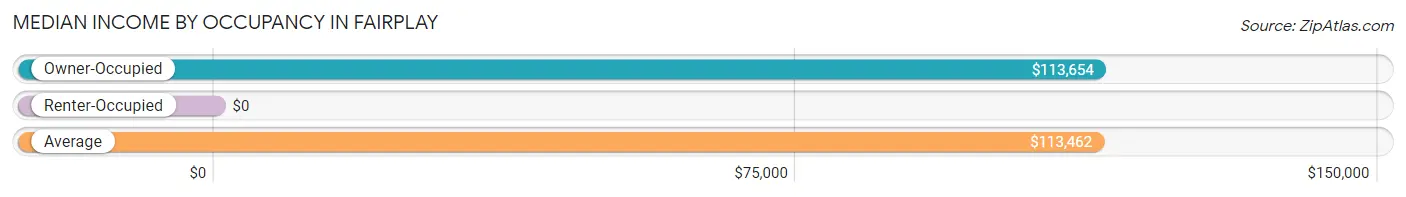
| Occupancy Type | # Households | Median Income |
| Owner-Occupied | 126 (94.0%) | $113,654 |
| Renter-Occupied | 8 (6.0%) | $0 |
| Average | 134 (100.0%) | $113,462 |
Occupancy by Householder Income Bracket in Fairplay
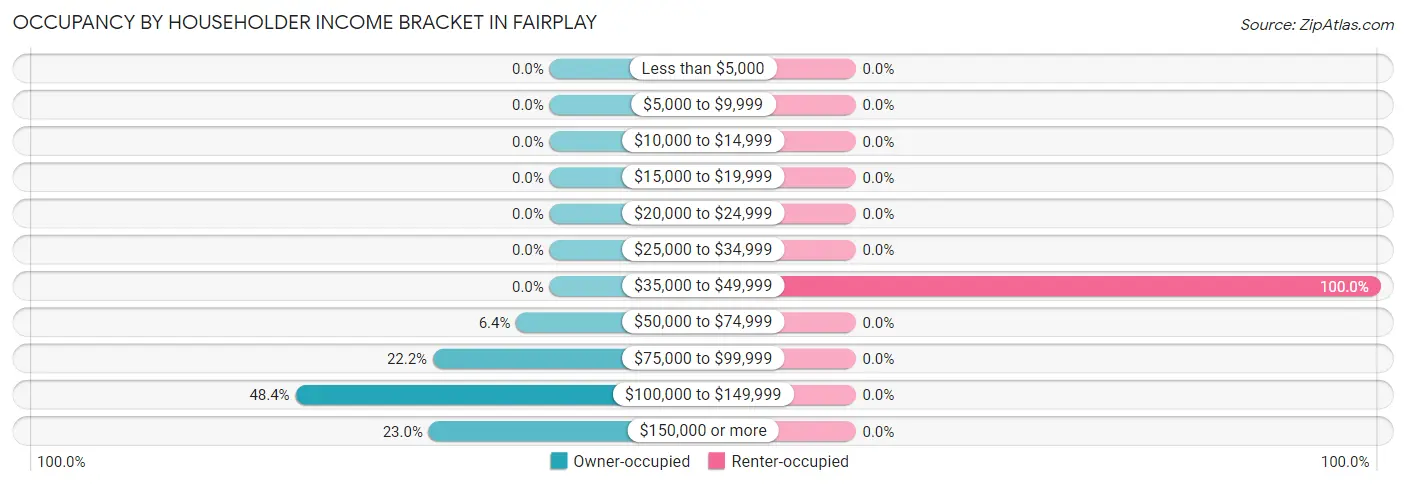
| Income Bracket | Owner-occupied | Renter-occupied |
| Less than $5,000 | 0 (0.0%) | 0 (0.0%) |
| $5,000 to $9,999 | 0 (0.0%) | 0 (0.0%) |
| $10,000 to $14,999 | 0 (0.0%) | 0 (0.0%) |
| $15,000 to $19,999 | 0 (0.0%) | 0 (0.0%) |
| $20,000 to $24,999 | 0 (0.0%) | 0 (0.0%) |
| $25,000 to $34,999 | 0 (0.0%) | 0 (0.0%) |
| $35,000 to $49,999 | 0 (0.0%) | 8 (100.0%) |
| $50,000 to $74,999 | 8 (6.4%) | 0 (0.0%) |
| $75,000 to $99,999 | 28 (22.2%) | 0 (0.0%) |
| $100,000 to $149,999 | 61 (48.4%) | 0 (0.0%) |
| $150,000 or more | 29 (23.0%) | 0 (0.0%) |
| Total | 126 (100.0%) | 8 (100.0%) |
Monthly Housing Cost Tiers in Fairplay
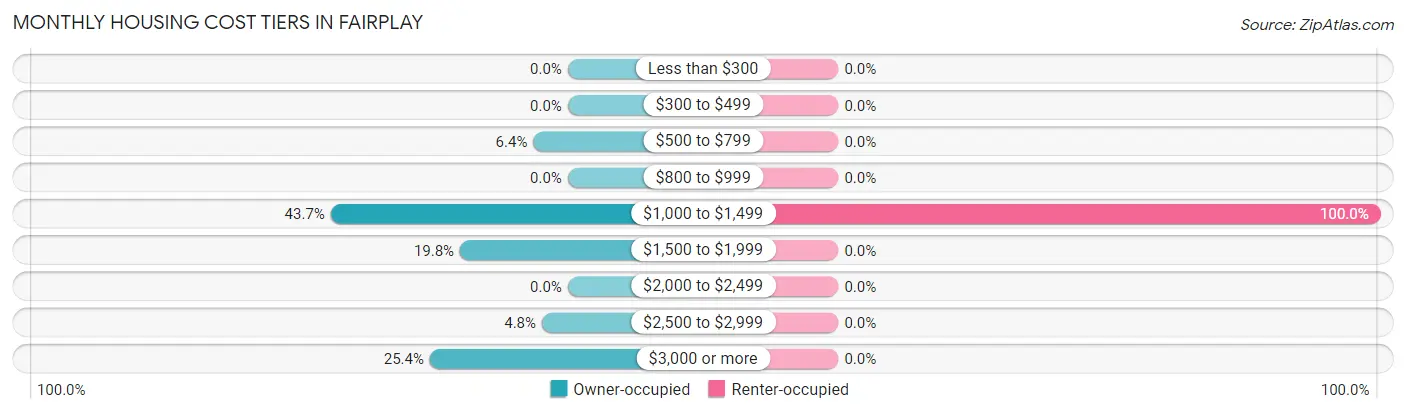
| Monthly Cost | Owner-occupied | Renter-occupied |
| Less than $300 | 0 (0.0%) | 0 (0.0%) |
| $300 to $499 | 0 (0.0%) | 0 (0.0%) |
| $500 to $799 | 8 (6.4%) | 0 (0.0%) |
| $800 to $999 | 0 (0.0%) | 0 (0.0%) |
| $1,000 to $1,499 | 55 (43.6%) | 8 (100.0%) |
| $1,500 to $1,999 | 25 (19.8%) | 0 (0.0%) |
| $2,000 to $2,499 | 0 (0.0%) | 0 (0.0%) |
| $2,500 to $2,999 | 6 (4.8%) | 0 (0.0%) |
| $3,000 or more | 32 (25.4%) | 0 (0.0%) |
| Total | 126 (100.0%) | 8 (100.0%) |
Physical Housing Characteristics in Fairplay
Housing Structures in Fairplay
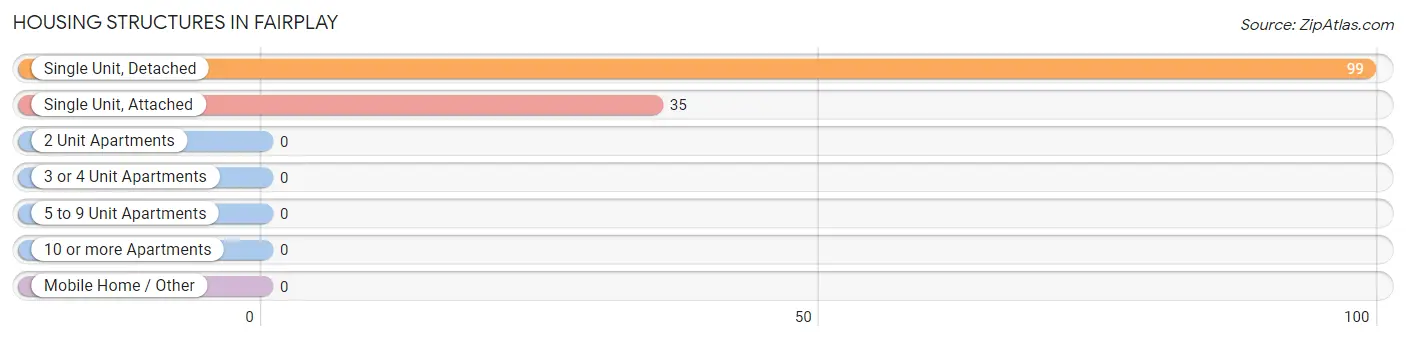
| Structure Type | # Housing Units | % Housing Units |
| Single Unit, Detached | 99 | 73.9% |
| Single Unit, Attached | 35 | 26.1% |
| 2 Unit Apartments | 0 | 0.0% |
| 3 or 4 Unit Apartments | 0 | 0.0% |
| 5 to 9 Unit Apartments | 0 | 0.0% |
| 10 or more Apartments | 0 | 0.0% |
| Mobile Home / Other | 0 | 0.0% |
| Total | 134 | 100.0% |
Housing Structures by Occupancy in Fairplay
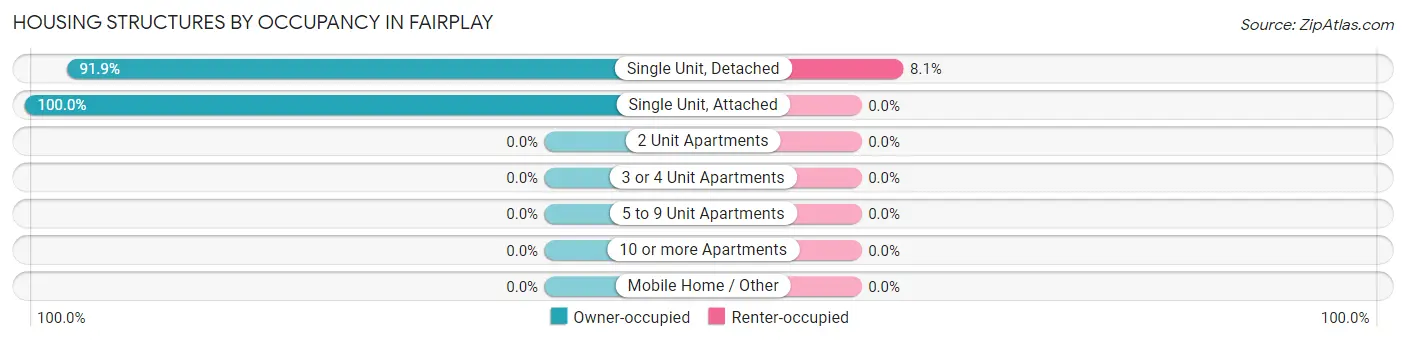
| Structure Type | Owner-occupied | Renter-occupied |
| Single Unit, Detached | 91 (91.9%) | 8 (8.1%) |
| Single Unit, Attached | 35 (100.0%) | 0 (0.0%) |
| 2 Unit Apartments | 0 (0.0%) | 0 (0.0%) |
| 3 or 4 Unit Apartments | 0 (0.0%) | 0 (0.0%) |
| 5 to 9 Unit Apartments | 0 (0.0%) | 0 (0.0%) |
| 10 or more Apartments | 0 (0.0%) | 0 (0.0%) |
| Mobile Home / Other | 0 (0.0%) | 0 (0.0%) |
| Total | 126 (94.0%) | 8 (6.0%) |
Housing Structures by Number of Rooms in Fairplay
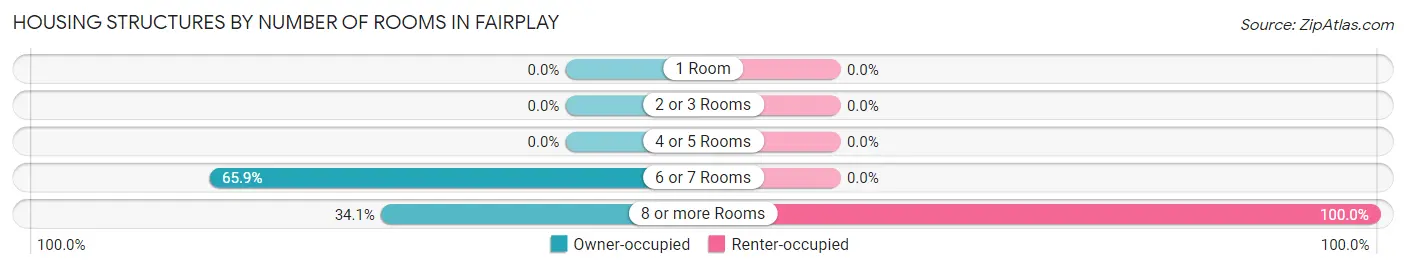
| Number of Rooms | Owner-occupied | Renter-occupied |
| 1 Room | 0 (0.0%) | 0 (0.0%) |
| 2 or 3 Rooms | 0 (0.0%) | 0 (0.0%) |
| 4 or 5 Rooms | 0 (0.0%) | 0 (0.0%) |
| 6 or 7 Rooms | 83 (65.9%) | 0 (0.0%) |
| 8 or more Rooms | 43 (34.1%) | 8 (100.0%) |
| Total | 126 (100.0%) | 8 (100.0%) |
Housing Structure by Heating Type in Fairplay
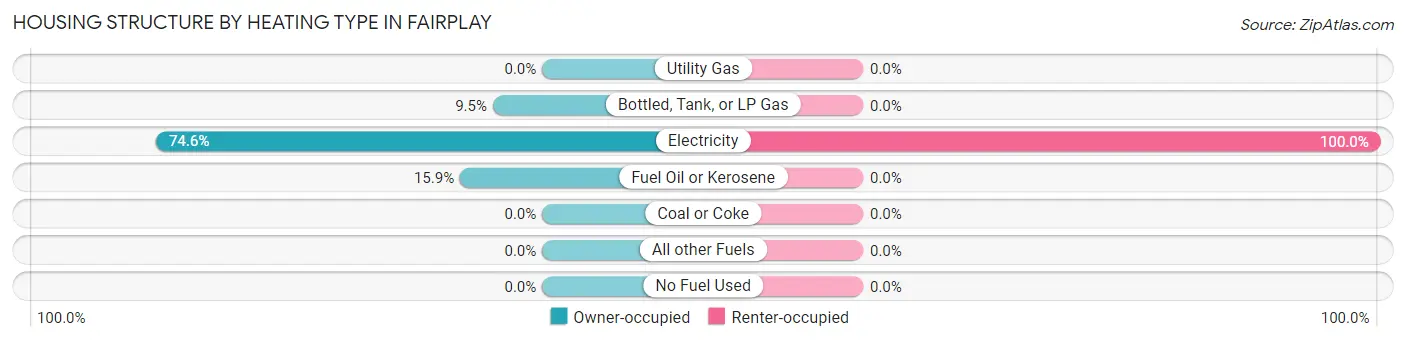
| Heating Type | Owner-occupied | Renter-occupied |
| Utility Gas | 0 (0.0%) | 0 (0.0%) |
| Bottled, Tank, or LP Gas | 12 (9.5%) | 0 (0.0%) |
| Electricity | 94 (74.6%) | 8 (100.0%) |
| Fuel Oil or Kerosene | 20 (15.9%) | 0 (0.0%) |
| Coal or Coke | 0 (0.0%) | 0 (0.0%) |
| All other Fuels | 0 (0.0%) | 0 (0.0%) |
| No Fuel Used | 0 (0.0%) | 0 (0.0%) |
| Total | 126 (100.0%) | 8 (100.0%) |
Household Vehicle Usage in Fairplay
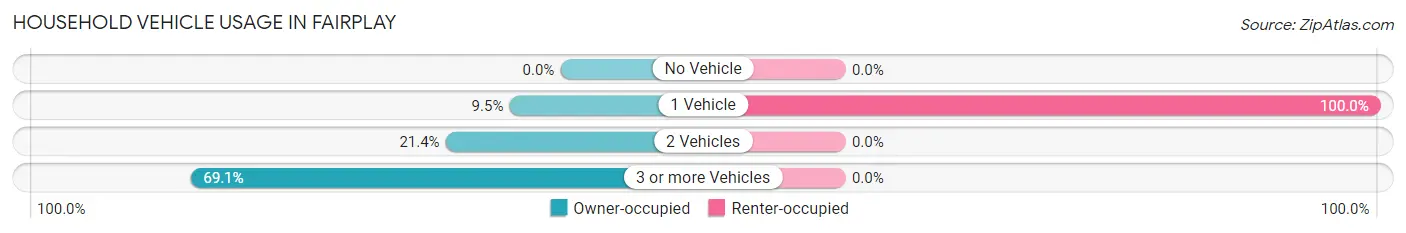
| Vehicles per Household | Owner-occupied | Renter-occupied |
| No Vehicle | 0 (0.0%) | 0 (0.0%) |
| 1 Vehicle | 12 (9.5%) | 8 (100.0%) |
| 2 Vehicles | 27 (21.4%) | 0 (0.0%) |
| 3 or more Vehicles | 87 (69.1%) | 0 (0.0%) |
| Total | 126 (100.0%) | 8 (100.0%) |
Real Estate & Mortgages in Fairplay
Real Estate and Mortgage Overview in Fairplay
| Characteristic | Without Mortgage | With Mortgage |
| Housing Units | 8 | 118 |
| Median Property Value | - | - |
| Median Household Income | - | - |
| Monthly Housing Costs | - | - |
| Real Estate Taxes | - | - |
Property Value by Mortgage Status in Fairplay
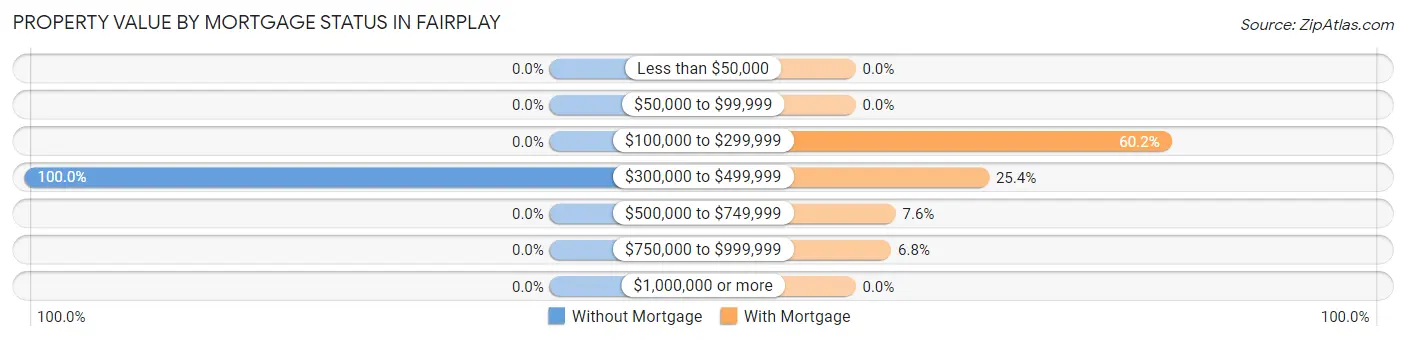
| Property Value | Without Mortgage | With Mortgage |
| Less than $50,000 | 0 (0.0%) | 0 (0.0%) |
| $50,000 to $99,999 | 0 (0.0%) | 0 (0.0%) |
| $100,000 to $299,999 | 0 (0.0%) | 71 (60.2%) |
| $300,000 to $499,999 | 8 (100.0%) | 30 (25.4%) |
| $500,000 to $749,999 | 0 (0.0%) | 9 (7.6%) |
| $750,000 to $999,999 | 0 (0.0%) | 8 (6.8%) |
| $1,000,000 or more | 0 (0.0%) | 0 (0.0%) |
| Total | 8 (100.0%) | 118 (100.0%) |
Household Income by Mortgage Status in Fairplay
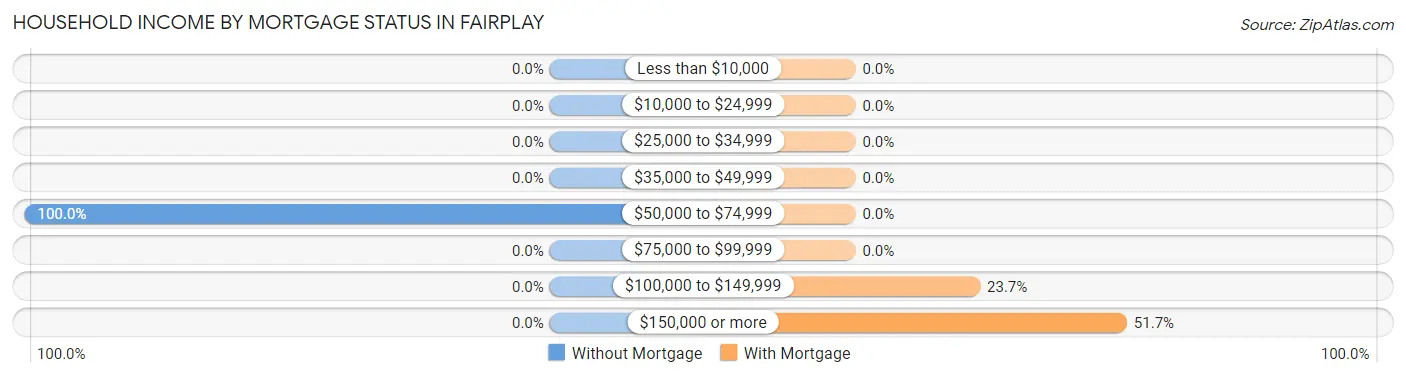
| Household Income | Without Mortgage | With Mortgage |
| Less than $10,000 | 0 (0.0%) | 0 (0.0%) |
| $10,000 to $24,999 | 0 (0.0%) | 0 (0.0%) |
| $25,000 to $34,999 | 0 (0.0%) | 0 (0.0%) |
| $35,000 to $49,999 | 0 (0.0%) | 0 (0.0%) |
| $50,000 to $74,999 | 8 (100.0%) | 0 (0.0%) |
| $75,000 to $99,999 | 0 (0.0%) | 0 (0.0%) |
| $100,000 to $149,999 | 0 (0.0%) | 28 (23.7%) |
| $150,000 or more | 0 (0.0%) | 61 (51.7%) |
| Total | 8 (100.0%) | 118 (100.0%) |
Property Value to Household Income Ratio in Fairplay
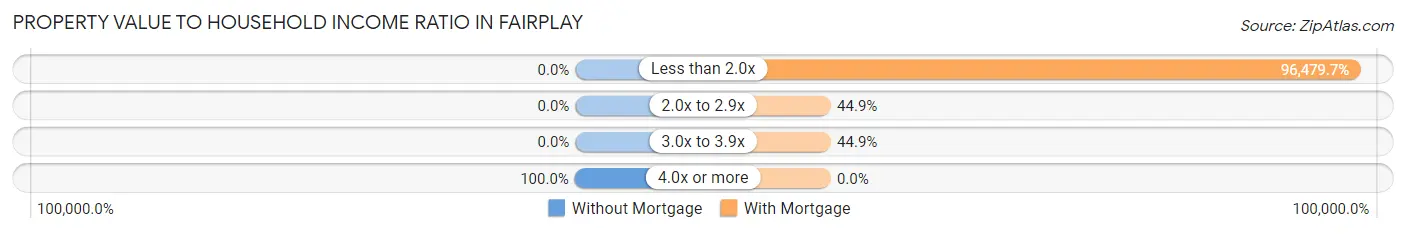
| Value-to-Income Ratio | Without Mortgage | With Mortgage |
| Less than 2.0x | 0 (0.0%) | 113,846 (96,479.7%) |
| 2.0x to 2.9x | 0 (0.0%) | 53 (44.9%) |
| 3.0x to 3.9x | 0 (0.0%) | 53 (44.9%) |
| 4.0x or more | 8 (100.0%) | 0 (0.0%) |
| Total | 8 (100.0%) | 118 (100.0%) |
Real Estate Taxes by Mortgage Status in Fairplay
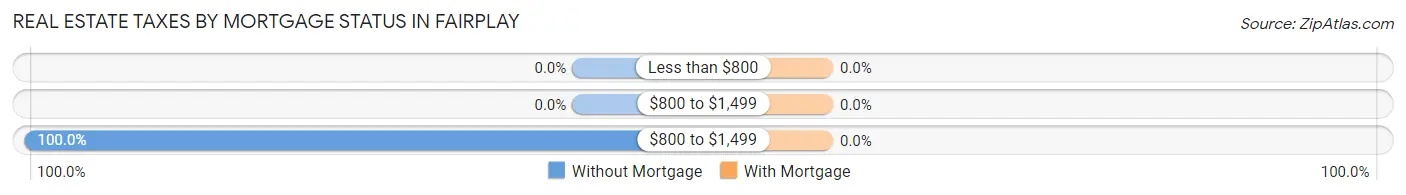
| Property Taxes | Without Mortgage | With Mortgage |
| Less than $800 | 0 (0.0%) | 0 (0.0%) |
| $800 to $1,499 | 0 (0.0%) | 0 (0.0%) |
| $800 to $1,499 | 8 (100.0%) | 0 (0.0%) |
| Total | 8 (100.0%) | 118 (100.0%) |
Health & Disability in Fairplay
Health Insurance Coverage by Age in Fairplay
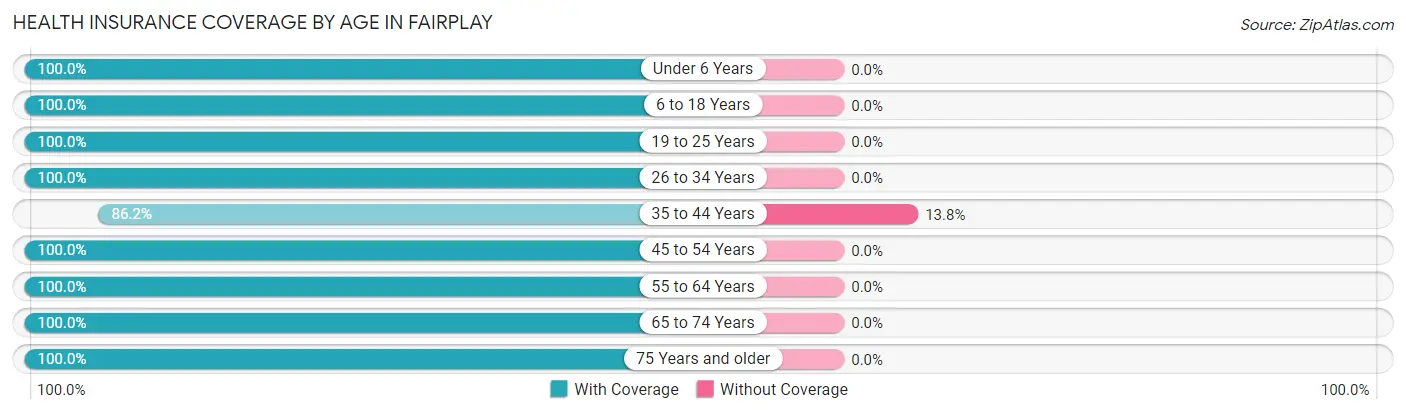
| Age Bracket | With Coverage | Without Coverage |
| Under 6 Years | 21 (100.0%) | 0 (0.0%) |
| 6 to 18 Years | 72 (100.0%) | 0 (0.0%) |
| 19 to 25 Years | 127 (100.0%) | 0 (0.0%) |
| 26 to 34 Years | 11 (100.0%) | 0 (0.0%) |
| 35 to 44 Years | 75 (86.2%) | 12 (13.8%) |
| 45 to 54 Years | 55 (100.0%) | 0 (0.0%) |
| 55 to 64 Years | 93 (100.0%) | 0 (0.0%) |
| 65 to 74 Years | 21 (100.0%) | 0 (0.0%) |
| 75 Years and older | 56 (100.0%) | 0 (0.0%) |
| Total | 531 (97.8%) | 12 (2.2%) |
Health Insurance Coverage by Citizenship Status in Fairplay
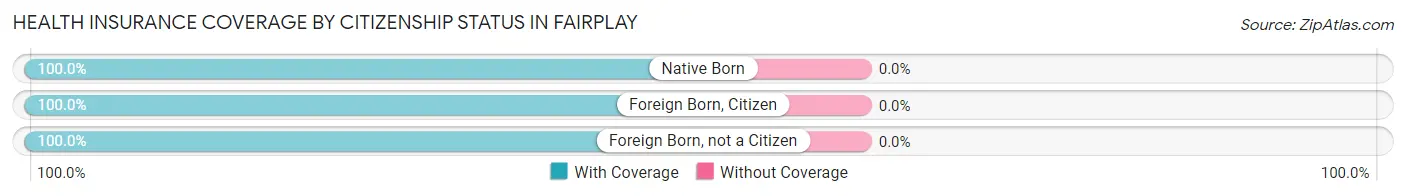
| Citizenship Status | With Coverage | Without Coverage |
| Native Born | 21 (100.0%) | 0 (0.0%) |
| Foreign Born, Citizen | 72 (100.0%) | 0 (0.0%) |
| Foreign Born, not a Citizen | 127 (100.0%) | 0 (0.0%) |
Health Insurance Coverage by Household Income in Fairplay
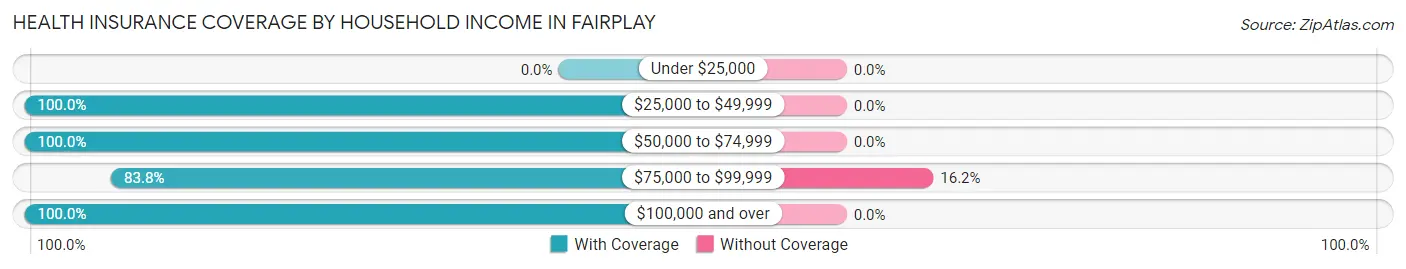
| Household Income | With Coverage | Without Coverage |
| Under $25,000 | 0 (0.0%) | 0 (0.0%) |
| $25,000 to $49,999 | 33 (100.0%) | 0 (0.0%) |
| $50,000 to $74,999 | 26 (100.0%) | 0 (0.0%) |
| $75,000 to $99,999 | 62 (83.8%) | 12 (16.2%) |
| $100,000 and over | 405 (100.0%) | 0 (0.0%) |
Public vs Private Health Insurance Coverage by Age in Fairplay
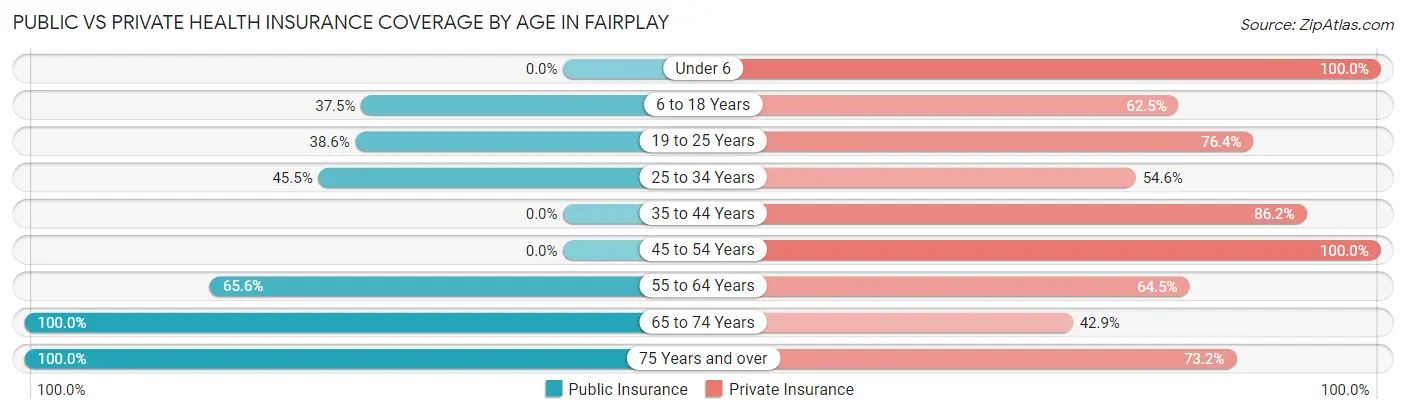
| Age Bracket | Public Insurance | Private Insurance |
| Under 6 | 0 (0.0%) | 21 (100.0%) |
| 6 to 18 Years | 27 (37.5%) | 45 (62.5%) |
| 19 to 25 Years | 49 (38.6%) | 97 (76.4%) |
| 25 to 34 Years | 5 (45.5%) | 6 (54.5%) |
| 35 to 44 Years | 0 (0.0%) | 75 (86.2%) |
| 45 to 54 Years | 0 (0.0%) | 55 (100.0%) |
| 55 to 64 Years | 61 (65.6%) | 60 (64.5%) |
| 65 to 74 Years | 21 (100.0%) | 9 (42.9%) |
| 75 Years and over | 56 (100.0%) | 41 (73.2%) |
| Total | 219 (40.3%) | 409 (75.3%) |
Disability Status by Sex by Age in Fairplay
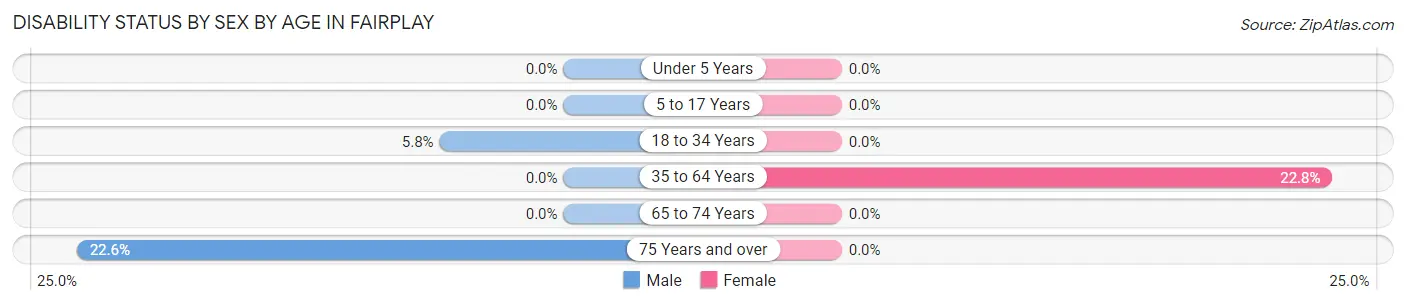
| Age Bracket | Male | Female |
| Under 5 Years | 0 (0.0%) | 0 (0.0%) |
| 5 to 17 Years | 0 (0.0%) | 0 (0.0%) |
| 18 to 34 Years | 5 (5.8%) | 0 (0.0%) |
| 35 to 64 Years | 0 (0.0%) | 33 (22.8%) |
| 65 to 74 Years | 0 (0.0%) | 0 (0.0%) |
| 75 Years and over | 7 (22.6%) | 0 (0.0%) |
Disability Class by Sex by Age in Fairplay
Disability Class: Hearing Difficulty
| Age Bracket | Male | Female |
| Under 5 Years | 0 (0.0%) | 0 (0.0%) |
| 5 to 17 Years | 0 (0.0%) | 0 (0.0%) |
| 18 to 34 Years | 0 (0.0%) | 0 (0.0%) |
| 35 to 64 Years | 0 (0.0%) | 0 (0.0%) |
| 65 to 74 Years | 0 (0.0%) | 0 (0.0%) |
| 75 Years and over | 0 (0.0%) | 0 (0.0%) |
Disability Class: Vision Difficulty
| Age Bracket | Male | Female |
| Under 5 Years | 0 (0.0%) | 0 (0.0%) |
| 5 to 17 Years | 0 (0.0%) | 0 (0.0%) |
| 18 to 34 Years | 0 (0.0%) | 0 (0.0%) |
| 35 to 64 Years | 0 (0.0%) | 0 (0.0%) |
| 65 to 74 Years | 0 (0.0%) | 0 (0.0%) |
| 75 Years and over | 0 (0.0%) | 0 (0.0%) |
Disability Class: Cognitive Difficulty
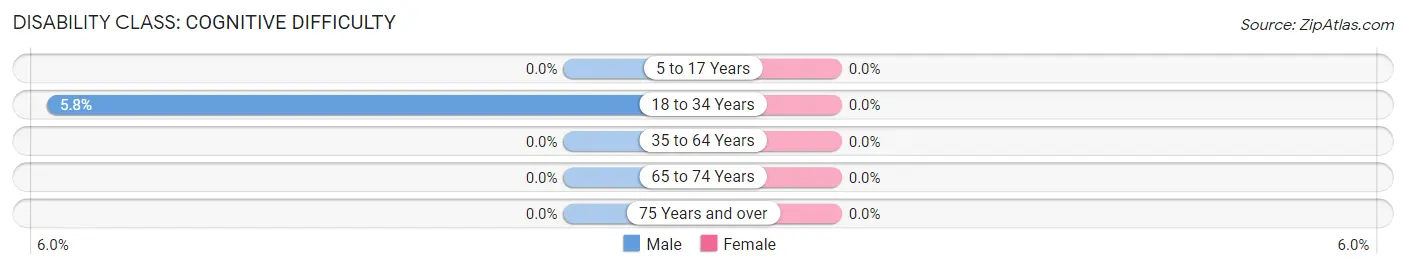
| Age Bracket | Male | Female |
| 5 to 17 Years | 0 (0.0%) | 0 (0.0%) |
| 18 to 34 Years | 5 (5.8%) | 0 (0.0%) |
| 35 to 64 Years | 0 (0.0%) | 0 (0.0%) |
| 65 to 74 Years | 0 (0.0%) | 0 (0.0%) |
| 75 Years and over | 0 (0.0%) | 0 (0.0%) |
Disability Class: Ambulatory Difficulty
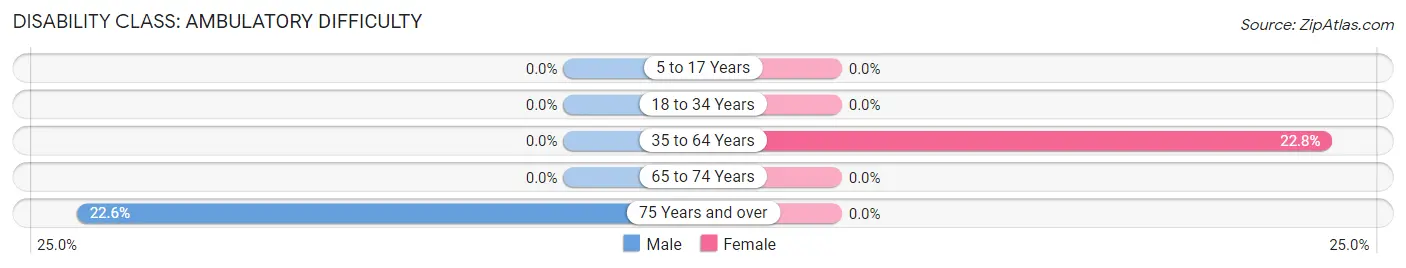
| Age Bracket | Male | Female |
| 5 to 17 Years | 0 (0.0%) | 0 (0.0%) |
| 18 to 34 Years | 0 (0.0%) | 0 (0.0%) |
| 35 to 64 Years | 0 (0.0%) | 33 (22.8%) |
| 65 to 74 Years | 0 (0.0%) | 0 (0.0%) |
| 75 Years and over | 7 (22.6%) | 0 (0.0%) |
Disability Class: Self-Care Difficulty
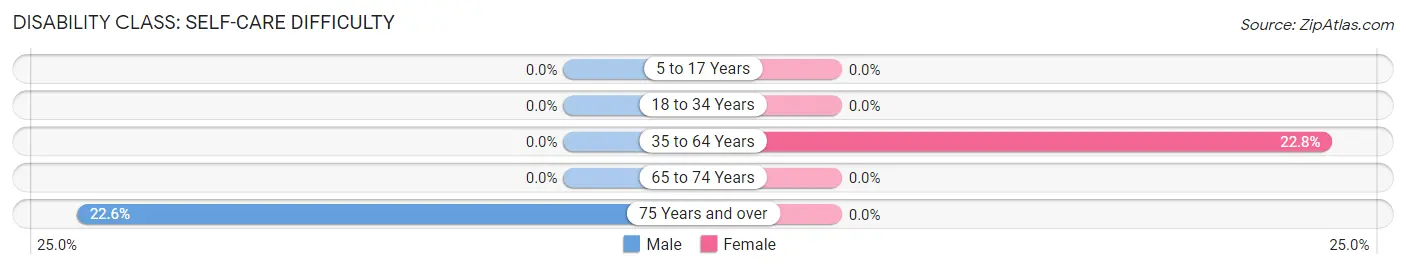
| Age Bracket | Male | Female |
| 5 to 17 Years | 0 (0.0%) | 0 (0.0%) |
| 18 to 34 Years | 0 (0.0%) | 0 (0.0%) |
| 35 to 64 Years | 0 (0.0%) | 33 (22.8%) |
| 65 to 74 Years | 0 (0.0%) | 0 (0.0%) |
| 75 Years and over | 7 (22.6%) | 0 (0.0%) |
Technology Access in Fairplay
Computing Device Access in Fairplay
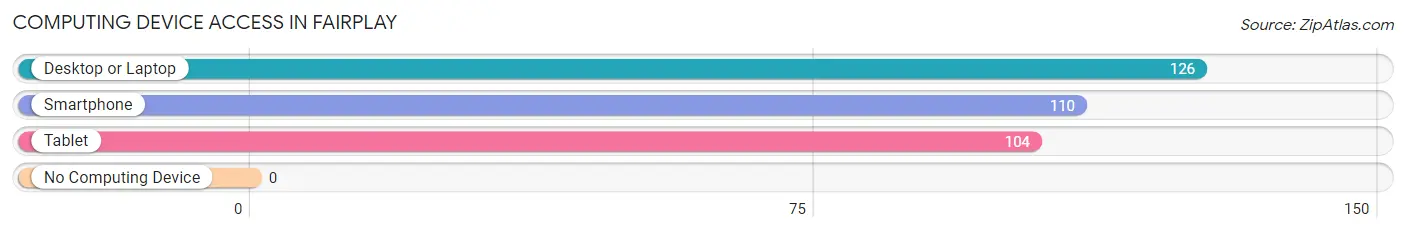
| Device Type | # Households | % Households |
| Desktop or Laptop | 126 | 94.0% |
| Smartphone | 110 | 82.1% |
| Tablet | 104 | 77.6% |
| No Computing Device | 0 | 0.0% |
| Total | 134 | 100.0% |
Internet Access in Fairplay
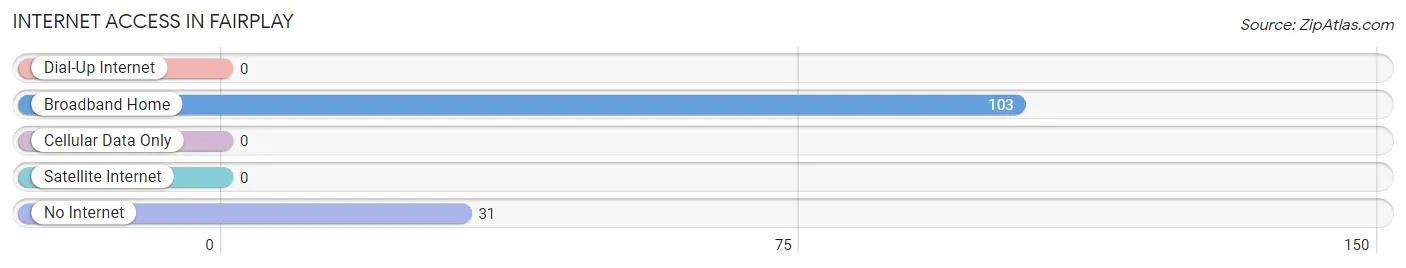
| Internet Type | # Households | % Households |
| Dial-Up Internet | 0 | 0.0% |
| Broadband Home | 103 | 76.9% |
| Cellular Data Only | 0 | 0.0% |
| Satellite Internet | 0 | 0.0% |
| No Internet | 31 | 23.1% |
| Total | 134 | 100.0% |
Fairplay Summary
Playfair, Maryland is a small town located in the northern part of the state, in Frederick County. It is situated on the banks of the Monocacy River, and is surrounded by rolling hills and farmland. The town was founded in 1790, and has a population of just over 1,000 people.
History
The town of Playfair was founded in 1790 by a group of German immigrants who had settled in the area. The town was named after the German word for “fair play”, and was intended to be a place where people could live in harmony and peace. The town was originally a farming community, and the main crops grown were wheat, corn, and tobacco.
In the early 19th century, the town began to grow and develop. The first school was built in 1820, and the first post office was established in 1825. The town also had a blacksmith, a general store, and a few other businesses.
In the late 19th century, the town began to decline. The railroad bypassed the town, and the population began to dwindle. By the early 20th century, the town was nearly abandoned.
In the late 20th century, the town began to experience a revival. The population began to grow again, and new businesses began to open. Today, Playfair is a small but vibrant community.
Geography
Playfair is located in the northern part of Maryland, in Frederick County. It is situated on the banks of the Monocacy River, and is surrounded by rolling hills and farmland. The town is located about 25 miles north of Washington, D.C., and about 50 miles west of Baltimore.
The town has a total area of 0.7 square miles, all of which is land. The town is located at an elevation of about 500 feet above sea level.
Economy
The economy of Playfair is largely based on agriculture. The town is home to several farms, which produce a variety of crops, including wheat, corn, and tobacco. The town also has a few small businesses, including a general store, a restaurant, and a few other shops.
Demographics
As of the 2010 census, the population of Playfair was 1,072. The racial makeup of the town was 94.3% White, 2.2% African American, 0.3% Native American, 0.7% Asian, 0.1% Pacific Islander, and 2.4% from other races. Hispanic or Latino of any race were 2.7% of the population.
The median household income in Playfair was $50,000, and the median family income was $54,000. The per capita income was $21,000. About 8.3% of the population was below the poverty line.
Playfair is a small but vibrant community. It is a great place to live, work, and raise a family. The town has a rich history, and is surrounded by beautiful scenery. It is a great place to call home.
Common Questions
What is Per Capita Income in Fairplay?
Per Capita income in Fairplay is $41,630.
What is the Median Family Income in Fairplay?
Median Family Income in Fairplay is $96,983.
What is the Median Household income in Fairplay?
Median Household Income in Fairplay is $113,462.
What is Income or Wage Gap in Fairplay?
Income or Wage Gap in Fairplay is 38.2%.
Women in Fairplay earn 61.8 cents for every dollar earned by a man.
What is Inequality or Gini Index in Fairplay?
Inequality or Gini Index in Fairplay is 0.34.
What is the Total Population of Fairplay?
Total Population of Fairplay is 543.
What is the Total Male Population of Fairplay?
Total Male Population of Fairplay is 287.
What is the Total Female Population of Fairplay?
Total Female Population of Fairplay is 256.
What is the Ratio of Males per 100 Females in Fairplay?
There are 112.11 Males per 100 Females in Fairplay.
What is the Ratio of Females per 100 Males in Fairplay?
There are 89.20 Females per 100 Males in Fairplay.
What is the Median Population Age in Fairplay?
Median Population Age in Fairplay is 41.5 Years.
What is the Average Family Size in Fairplay
Average Family Size in Fairplay is 3.6 People.
What is the Average Household Size in Fairplay
Average Household Size in Fairplay is 4.0 People.
How Large is the Labor Force in Fairplay?
There are 341 People in the Labor Forcein in Fairplay.
What is the Percentage of People in the Labor Force in Fairplay?
74.6% of People are in the Labor Force in Fairplay.