Captiva, FL Map & Demographics
Captiva Map
Captiva Overview
$31,614
PER CAPITA INCOME
0.26
INEQUALITY / GINI INDEX
151
TOTAL POPULATION
64
MALE POPULATION
87
FEMALE POPULATION
73.56
MALES / 100 FEMALES
135.94
FEMALES / 100 MALES
37.1
MEDIAN AGE
1.8
AVG FAMILY SIZE
1.8
AVG HOUSEHOLD SIZE
56
LABOR FORCE [ PEOPLE ]
37.1%
PERCENT IN LABOR FORCE
Captiva Zip Codes
Captiva Area Codes
Income in Captiva
Income Overview in Captiva
| Characteristic | Number | Measure |
| Per Capita Income | 151 | $31,614 |
| Median Family Income | 30 | $0 |
| Mean Family Income | 30 | $139,593 |
| Median Household Income | 30 | $0 |
| Mean Household Income | 30 | $139,593 |
| Income Deficit | 30 | $0 |
| Wage / Income Gap (%) | 151 | 0.00% |
| Wage / Income Gap ($) | 151 | 100.00¢ per $1 |
| Gini / Inequality Index | 151 | 0.26 |
Earnings by Sex in Captiva
| Sex | Number | Average Earnings |
| Male | 29 (40.8%) | $0 |
| Female | 42 (59.2%) | $0 |
| Total | 71 (100.0%) | $0 |
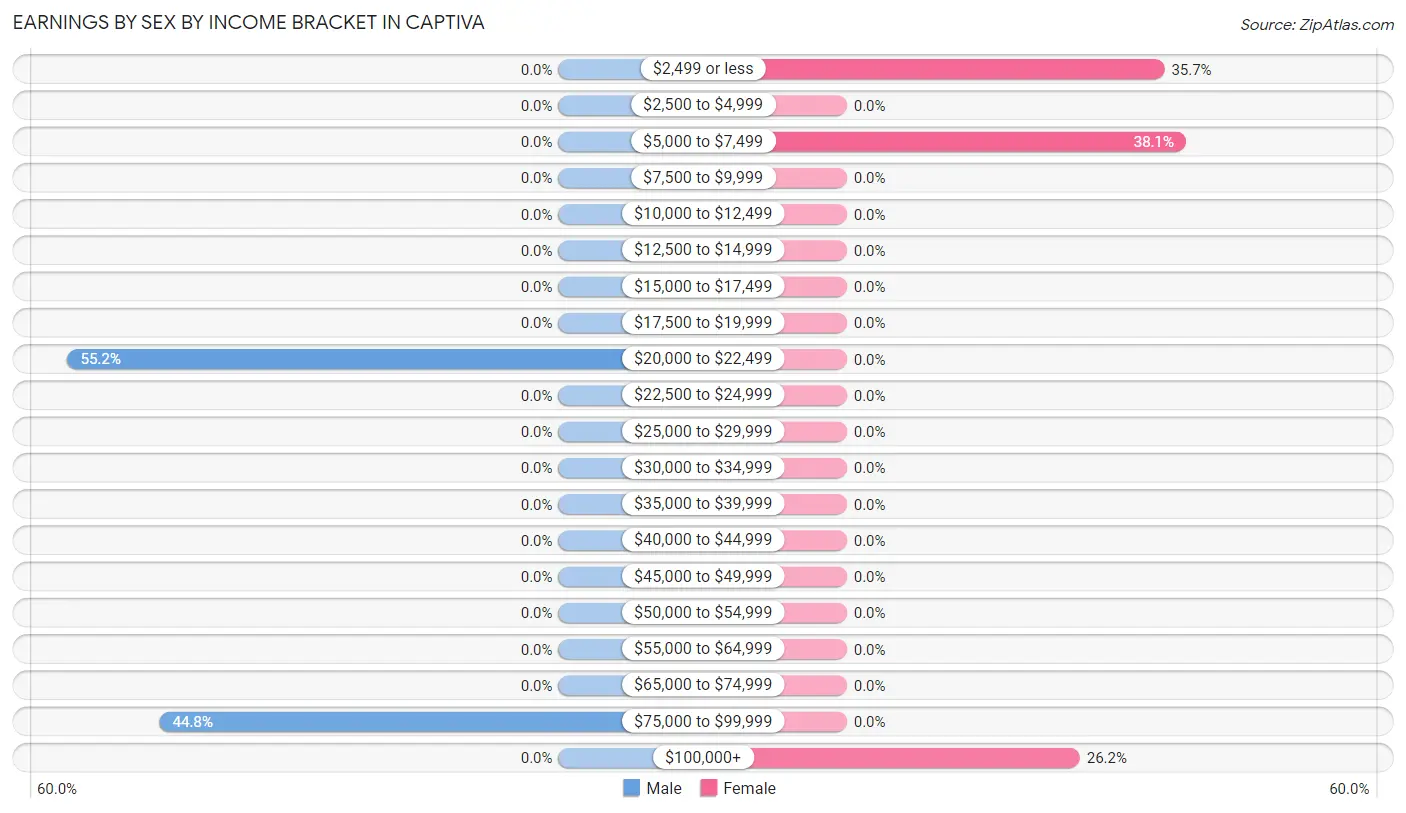
Earnings by Sex by Income Bracket in Captiva
The most common earnings brackets in Captiva are $20,000 to $22,499 for men (16 | 55.2%) and $5,000 to $7,499 for women (16 | 38.1%).
| Income | Male | Female |
| $2,499 or less | 0 (0.0%) | 15 (35.7%) |
| $2,500 to $4,999 | 0 (0.0%) | 0 (0.0%) |
| $5,000 to $7,499 | 0 (0.0%) | 16 (38.1%) |
| $7,500 to $9,999 | 0 (0.0%) | 0 (0.0%) |
| $10,000 to $12,499 | 0 (0.0%) | 0 (0.0%) |
| $12,500 to $14,999 | 0 (0.0%) | 0 (0.0%) |
| $15,000 to $17,499 | 0 (0.0%) | 0 (0.0%) |
| $17,500 to $19,999 | 0 (0.0%) | 0 (0.0%) |
| $20,000 to $22,499 | 16 (55.2%) | 0 (0.0%) |
| $22,500 to $24,999 | 0 (0.0%) | 0 (0.0%) |
| $25,000 to $29,999 | 0 (0.0%) | 0 (0.0%) |
| $30,000 to $34,999 | 0 (0.0%) | 0 (0.0%) |
| $35,000 to $39,999 | 0 (0.0%) | 0 (0.0%) |
| $40,000 to $44,999 | 0 (0.0%) | 0 (0.0%) |
| $45,000 to $49,999 | 0 (0.0%) | 0 (0.0%) |
| $50,000 to $54,999 | 0 (0.0%) | 0 (0.0%) |
| $55,000 to $64,999 | 0 (0.0%) | 0 (0.0%) |
| $65,000 to $74,999 | 0 (0.0%) | 0 (0.0%) |
| $75,000 to $99,999 | 13 (44.8%) | 0 (0.0%) |
| $100,000+ | 0 (0.0%) | 11 (26.2%) |
| Total | 29 (100.0%) | 42 (100.0%) |
Earnings by Sex by Educational Attainment in Captiva
| Educational Attainment | Male Income | Female Income |
| Less than High School | - | - |
| High School Diploma | - | - |
| College or Associate's Degree | - | - |
| Bachelor's Degree | - | - |
| Graduate Degree | - | - |
| Total | - | - |
Family Income in Captiva
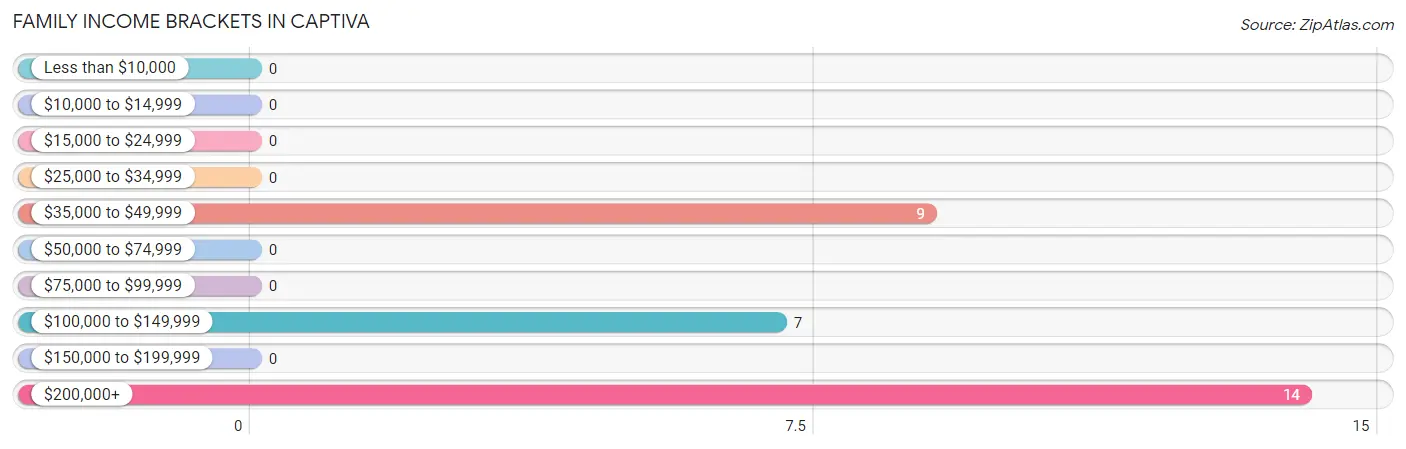
Family Income Brackets in Captiva
According to the Captiva family income data, there are 14 families falling into the $200,000+ income range, which is the most common income bracket and makes up 46.7% of all families.
| Income Bracket | # Families | % Families |
| Less than $10,000 | 0 | 0.0% |
| $10,000 to $14,999 | 0 | 0.0% |
| $15,000 to $24,999 | 0 | 0.0% |
| $25,000 to $34,999 | 0 | 0.0% |
| $35,000 to $49,999 | 9 | 30.0% |
| $50,000 to $74,999 | 0 | 0.0% |
| $75,000 to $99,999 | 0 | 0.0% |
| $100,000 to $149,999 | 7 | 23.3% |
| $150,000 to $199,999 | 0 | 0.0% |
| $200,000+ | 14 | 46.7% |
Family Income by Famaliy Size in Captiva
| Income Bracket | # Families | Median Income |
| 2-Person Families | 30 (100.0%) | $0 |
| 3-Person Families | 0 (0.0%) | $0 |
| 4-Person Families | 0 (0.0%) | $0 |
| 5-Person Families | 0 (0.0%) | $0 |
| 6-Person Families | 0 (0.0%) | $0 |
| 7+ Person Families | 0 (0.0%) | $0 |
| Total | 30 (100.0%) | $0 |
Family Income by Number of Earners in Captiva
| Number of Earners | # Families | Median Income |
| No Earners | 17 (56.7%) | $0 |
| 1 Earner | 0 (0.0%) | $0 |
| 2 Earners | 13 (43.3%) | $0 |
| 3+ Earners | 0 (0.0%) | $0 |
| Total | 30 (100.0%) | $0 |
Household Income in Captiva
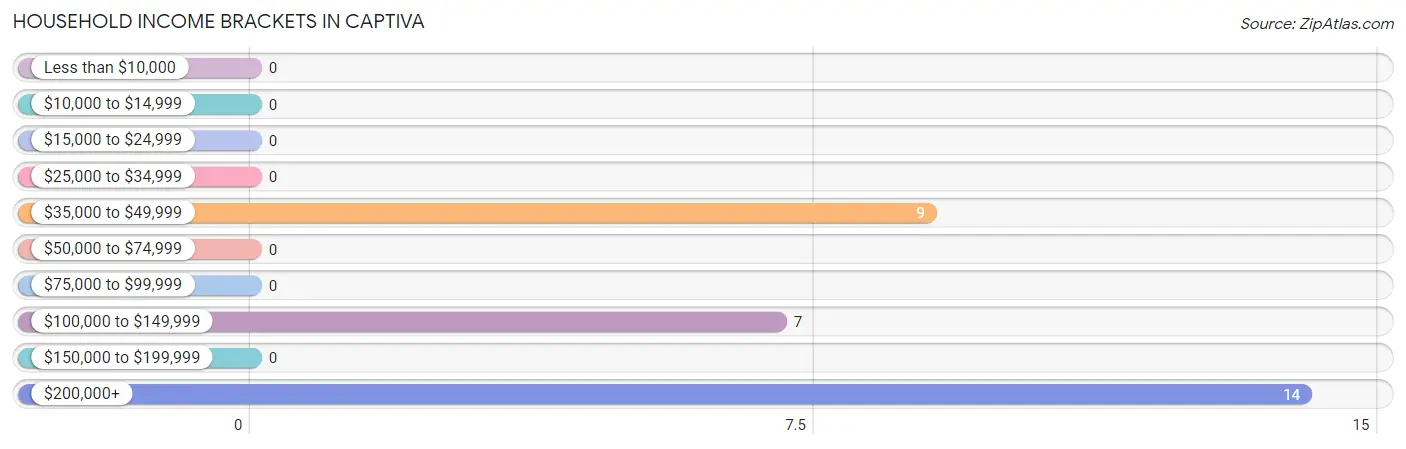
Household Income Brackets in Captiva
With 14 households falling in the category, the $200,000+ income range is the most frequent in Captiva, accounting for 46.7% of all households.
| Income Bracket | # Households | % Households |
| Less than $10,000 | 0 | 0.0% |
| $10,000 to $14,999 | 0 | 0.0% |
| $15,000 to $24,999 | 0 | 0.0% |
| $25,000 to $34,999 | 0 | 0.0% |
| $35,000 to $49,999 | 9 | 30.0% |
| $50,000 to $74,999 | 0 | 0.0% |
| $75,000 to $99,999 | 0 | 0.0% |
| $100,000 to $149,999 | 7 | 23.3% |
| $150,000 to $199,999 | 0 | 0.0% |
| $200,000+ | 14 | 46.7% |
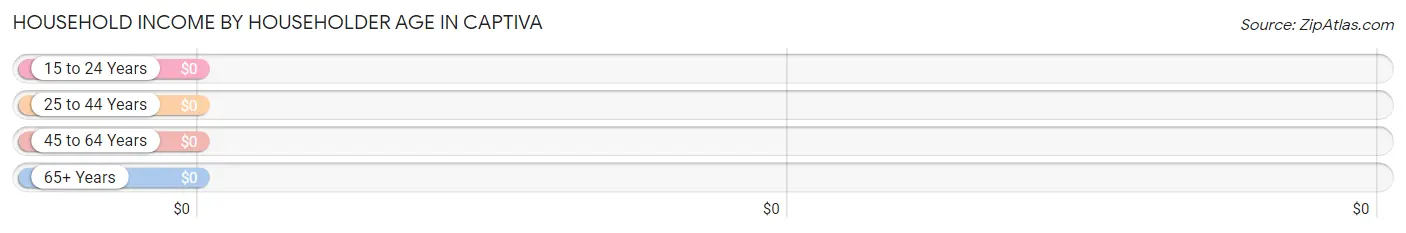
Household Income by Householder Age in Captiva
| Income Bracket | # Households | Median Income |
| 15 to 24 Years | 0 (0.0%) | $0 |
| 25 to 44 Years | 13 (43.3%) | $0 |
| 45 to 64 Years | 0 (0.0%) | $0 |
| 65+ Years | 17 (56.7%) | $0 |
| Total | 30 (100.0%) | $0 |
Poverty in Captiva
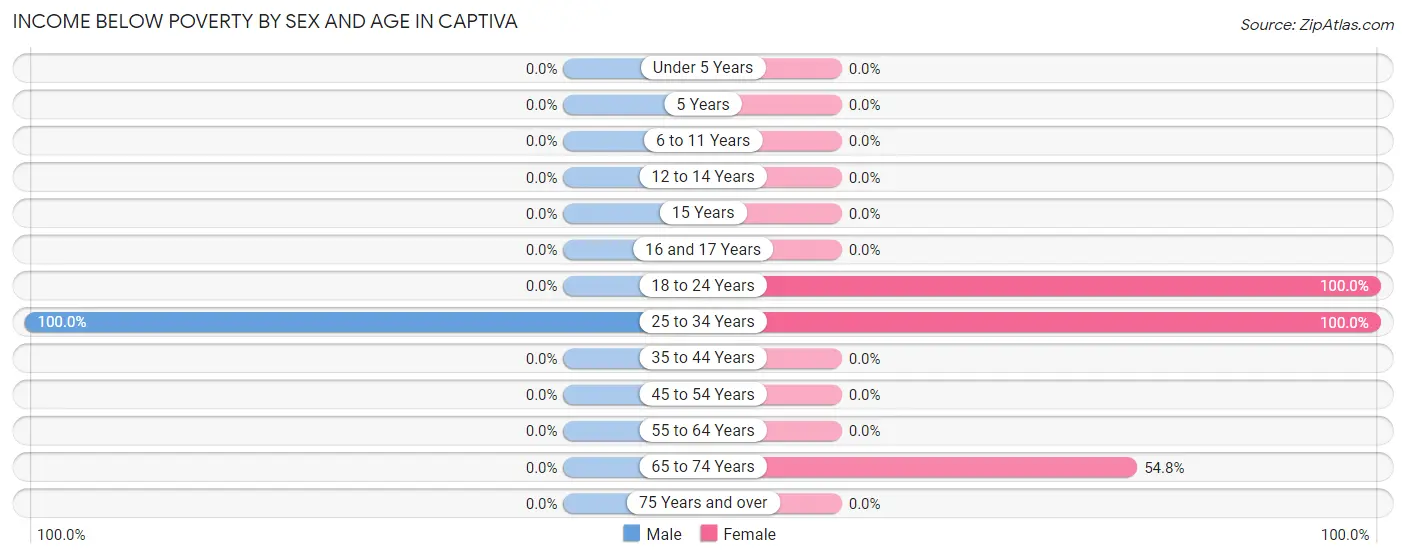
Income Below Poverty by Sex and Age in Captiva
With 28.1% poverty level for males and 71.3% for females among the residents of Captiva, 25 to 34 year old males and 18 to 24 year old females are the most vulnerable to poverty, with 18 males (100.0%) and 30 females (100.0%) in their respective age groups living below the poverty level.
| Age Bracket | Male | Female |
| Under 5 Years | 0 (0.0%) | 0 (0.0%) |
| 5 Years | 0 (0.0%) | 0 (0.0%) |
| 6 to 11 Years | 0 (0.0%) | 0 (0.0%) |
| 12 to 14 Years | 0 (0.0%) | 0 (0.0%) |
| 15 Years | 0 (0.0%) | 0 (0.0%) |
| 16 and 17 Years | 0 (0.0%) | 0 (0.0%) |
| 18 to 24 Years | 0 (0.0%) | 30 (100.0%) |
| 25 to 34 Years | 18 (100.0%) | 15 (100.0%) |
| 35 to 44 Years | 0 (0.0%) | 0 (0.0%) |
| 45 to 54 Years | 0 (0.0%) | 0 (0.0%) |
| 55 to 64 Years | 0 (0.0%) | 0 (0.0%) |
| 65 to 74 Years | 0 (0.0%) | 17 (54.8%) |
| 75 Years and over | 0 (0.0%) | 0 (0.0%) |
| Total | 18 (28.1%) | 62 (71.3%) |
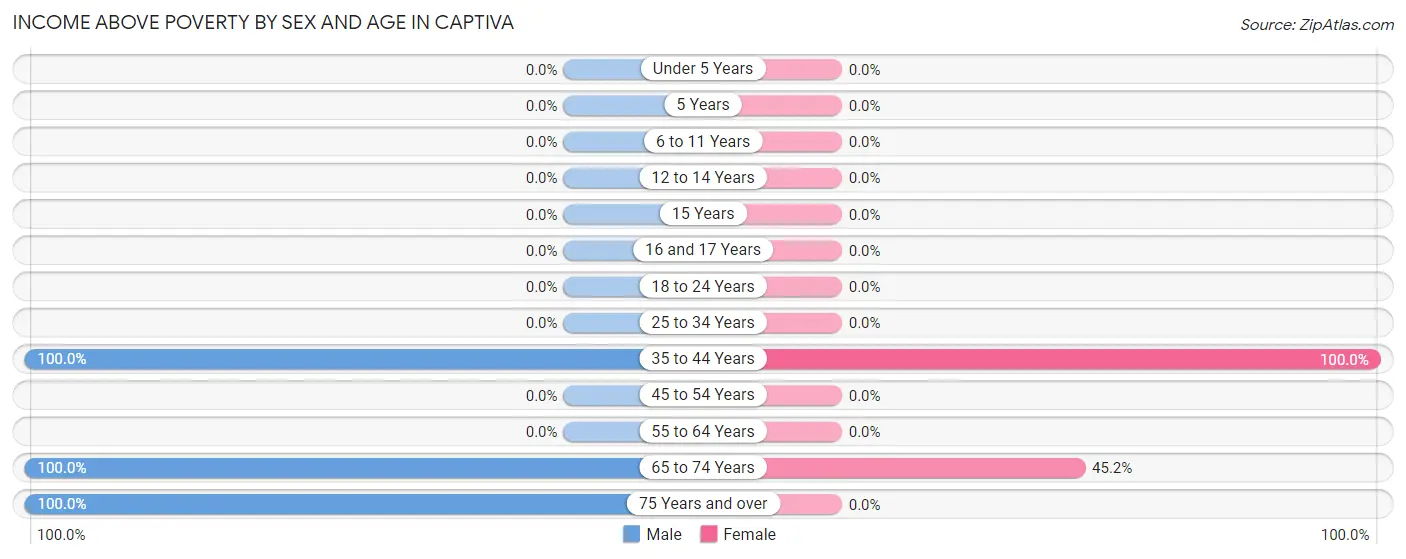
Income Above Poverty by Sex and Age in Captiva
According to the poverty statistics in Captiva, males aged 35 to 44 years and females aged 35 to 44 years are the age groups that are most secure financially, with 100.0% of males and 100.0% of females in these age groups living above the poverty line.
| Age Bracket | Male | Female |
| Under 5 Years | 0 (0.0%) | 0 (0.0%) |
| 5 Years | 0 (0.0%) | 0 (0.0%) |
| 6 to 11 Years | 0 (0.0%) | 0 (0.0%) |
| 12 to 14 Years | 0 (0.0%) | 0 (0.0%) |
| 15 Years | 0 (0.0%) | 0 (0.0%) |
| 16 and 17 Years | 0 (0.0%) | 0 (0.0%) |
| 18 to 24 Years | 0 (0.0%) | 0 (0.0%) |
| 25 to 34 Years | 0 (0.0%) | 0 (0.0%) |
| 35 to 44 Years | 29 (100.0%) | 11 (100.0%) |
| 45 to 54 Years | 0 (0.0%) | 0 (0.0%) |
| 55 to 64 Years | 0 (0.0%) | 0 (0.0%) |
| 65 to 74 Years | 8 (100.0%) | 14 (45.2%) |
| 75 Years and over | 9 (100.0%) | 0 (0.0%) |
| Total | 46 (71.9%) | 25 (28.7%) |
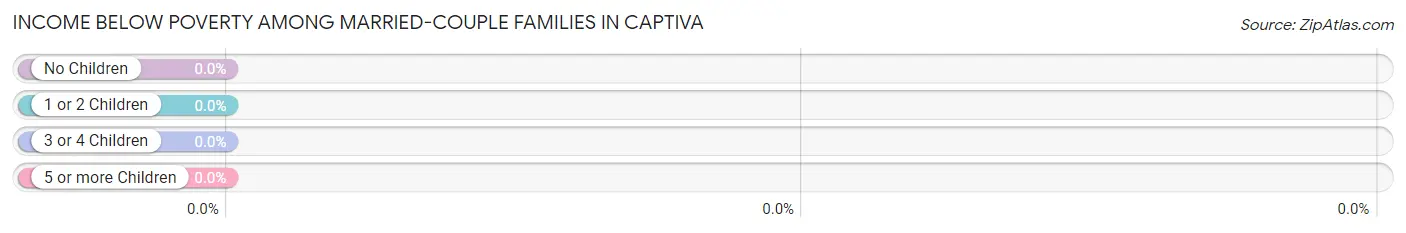
Income Below Poverty Among Married-Couple Families in Captiva
| Children | Above Poverty | Below Poverty |
| No Children | 30 (100.0%) | 0 (0.0%) |
| 1 or 2 Children | 0 (0.0%) | 0 (0.0%) |
| 3 or 4 Children | 0 (0.0%) | 0 (0.0%) |
| 5 or more Children | 0 (0.0%) | 0 (0.0%) |
| Total | 30 (100.0%) | 0 (0.0%) |
Income Below Poverty Among Single-Parent Households in Captiva
| Children | Single Father | Single Mother |
| No Children | 0 (0.0%) | 0 (0.0%) |
| 1 or 2 Children | 0 (0.0%) | 0 (0.0%) |
| 3 or 4 Children | 0 (0.0%) | 0 (0.0%) |
| 5 or more Children | 0 (0.0%) | 0 (0.0%) |
| Total | 0 (0.0%) | 0 (0.0%) |
Income Below Poverty Among Married-Couple vs Single-Parent Households in Captiva
| Children | Married-Couple Families | Single-Parent Households |
| No Children | 0 (0.0%) | 0 (0.0%) |
| 1 or 2 Children | 0 (0.0%) | 0 (0.0%) |
| 3 or 4 Children | 0 (0.0%) | 0 (0.0%) |
| 5 or more Children | 0 (0.0%) | 0 (0.0%) |
| Total | 0 (0.0%) | 0 (0.0%) |
Race in Captiva
The most populous races in Captiva are White / Caucasian (70 | 46.4%), Black / African American (49 | 32.5%), and Hispanic or Latino (14 | 9.3%).
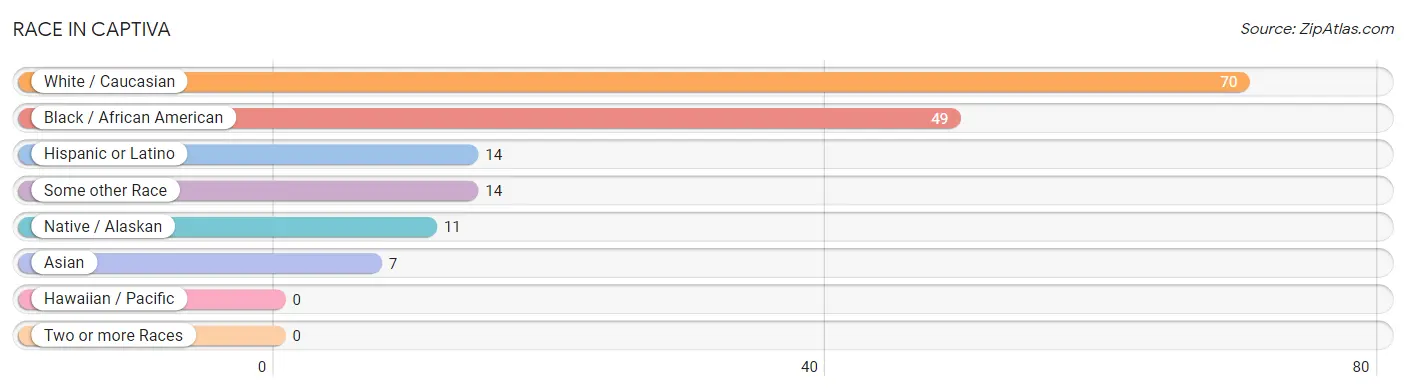
| Race | # Population | % Population |
| Asian | 7 | 4.6% |
| Black / African American | 49 | 32.5% |
| Hawaiian / Pacific | 0 | 0.0% |
| Hispanic or Latino | 14 | 9.3% |
| Native / Alaskan | 11 | 7.3% |
| White / Caucasian | 70 | 46.4% |
| Two or more Races | 0 | 0.0% |
| Some other Race | 14 | 9.3% |
| Total | 151 | 100.0% |
Ancestry in Captiva
The most populous ancestries reported in Captiva are American (29 | 19.2%), German (24 | 15.9%), Scottish (17 | 11.3%), Jamaican (16 | 10.6%), and Central American (14 | 9.3%), together accounting for 66.2% of all Captiva residents.
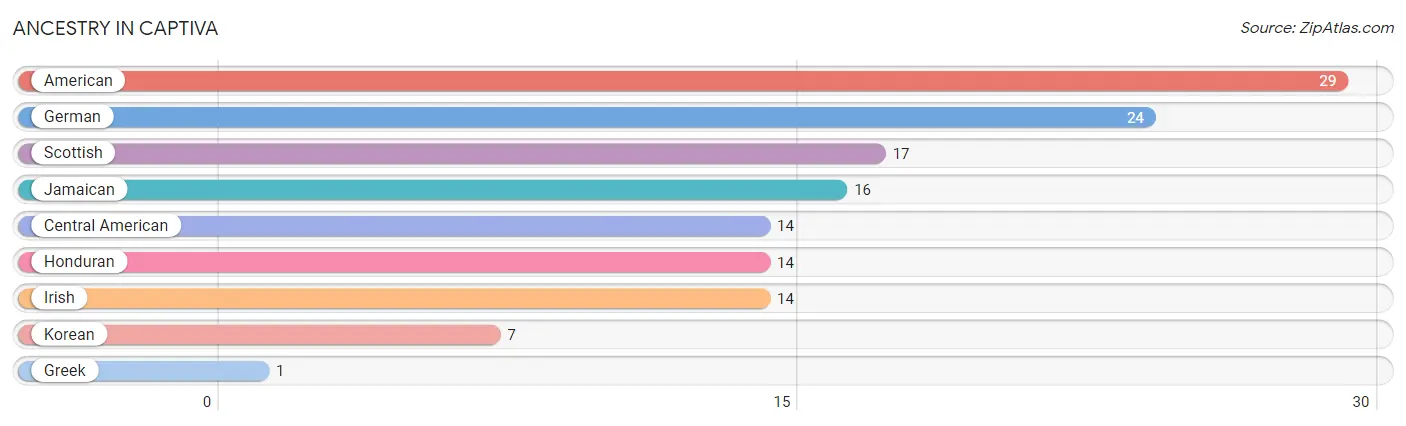
| Ancestry | # Population | % Population |
| American | 29 | 19.2% |
| Central American | 14 | 9.3% |
| German | 24 | 15.9% |
| Greek | 1 | 0.7% |
| Honduran | 14 | 9.3% |
| Irish | 14 | 9.3% |
| Jamaican | 16 | 10.6% |
| Korean | 7 | 4.6% |
| Scottish | 17 | 11.3% | View All 9 Rows |
Immigrants in Captiva
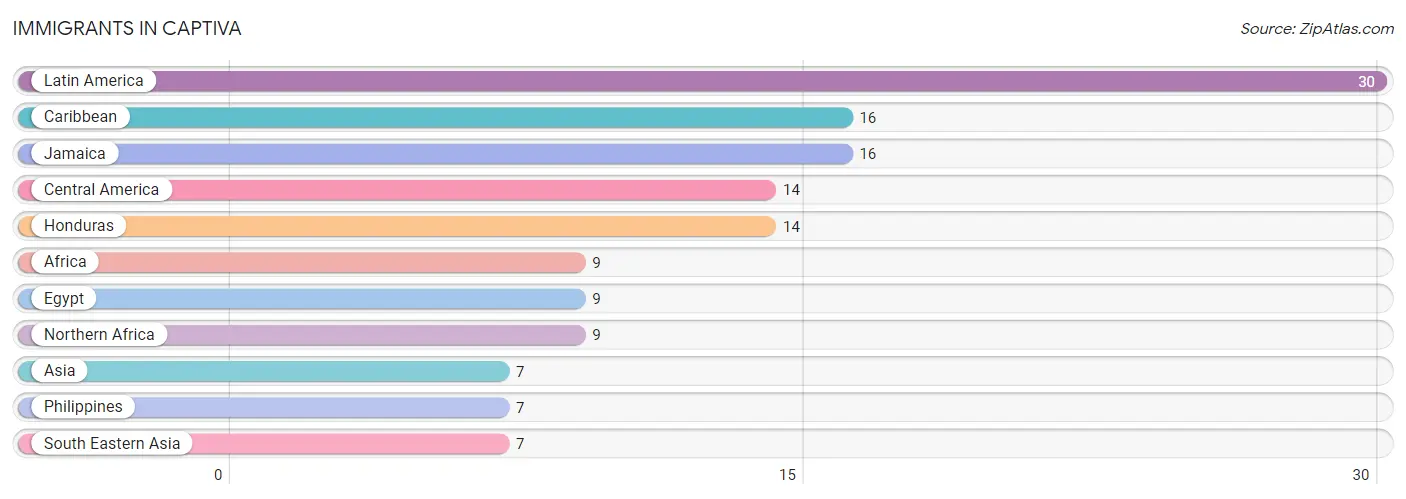
The most numerous immigrant groups reported in Captiva came from Latin America (30 | 19.9%), Caribbean (16 | 10.6%), Jamaica (16 | 10.6%), Central America (14 | 9.3%), and Honduras (14 | 9.3%), together accounting for 59.6% of all Captiva residents.
| Immigration Origin | # Population | % Population |
| Africa | 9 | 6.0% |
| Asia | 7 | 4.6% |
| Caribbean | 16 | 10.6% |
| Central America | 14 | 9.3% |
| Egypt | 9 | 6.0% |
| Honduras | 14 | 9.3% |
| Jamaica | 16 | 10.6% |
| Latin America | 30 | 19.9% |
| Northern Africa | 9 | 6.0% |
| Philippines | 7 | 4.6% |
| South Eastern Asia | 7 | 4.6% | View All 11 Rows |
Sex and Age in Captiva
Sex and Age in Captiva
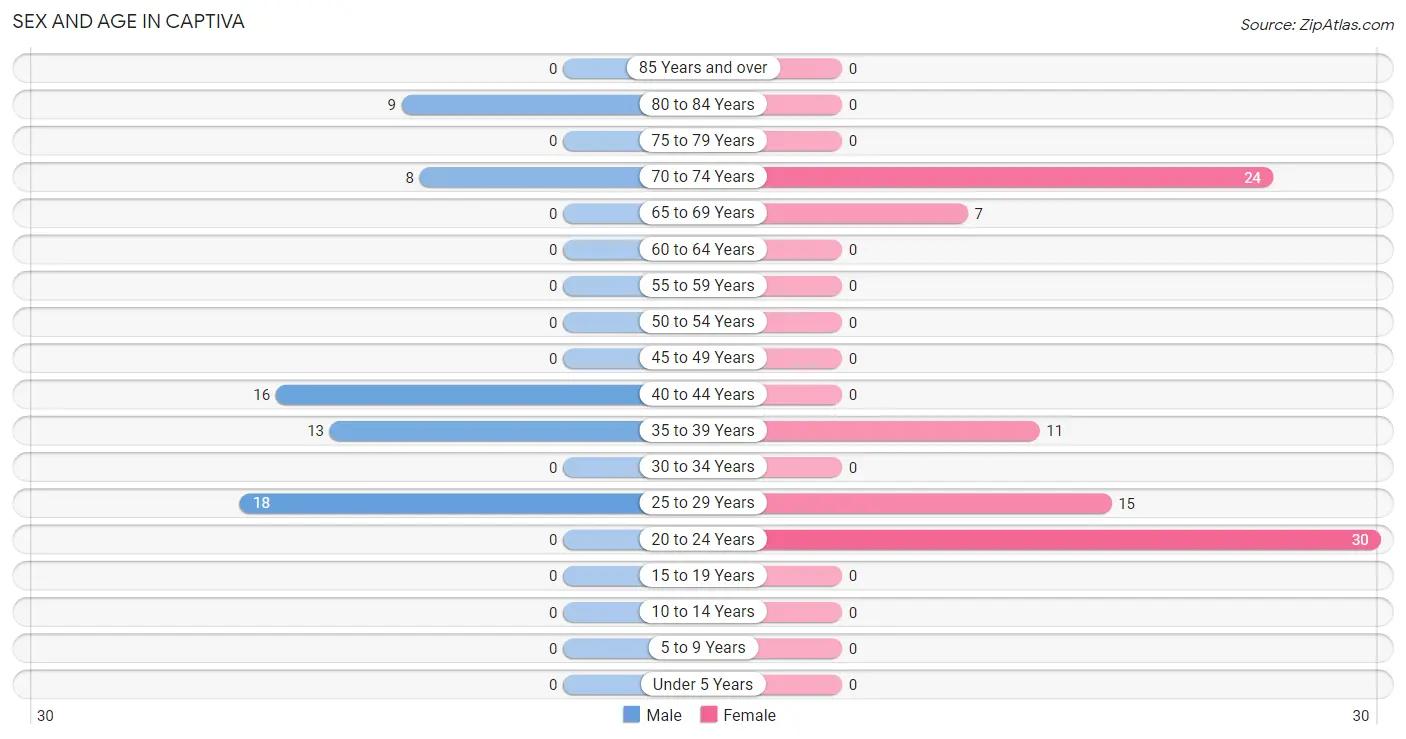
The most populous age groups in Captiva are 25 to 29 Years (18 | 28.1%) for men and 20 to 24 Years (30 | 34.5%) for women.
| Age Bracket | Male | Female |
| Under 5 Years | 0 (0.0%) | 0 (0.0%) |
| 5 to 9 Years | 0 (0.0%) | 0 (0.0%) |
| 10 to 14 Years | 0 (0.0%) | 0 (0.0%) |
| 15 to 19 Years | 0 (0.0%) | 0 (0.0%) |
| 20 to 24 Years | 0 (0.0%) | 30 (34.5%) |
| 25 to 29 Years | 18 (28.1%) | 15 (17.2%) |
| 30 to 34 Years | 0 (0.0%) | 0 (0.0%) |
| 35 to 39 Years | 13 (20.3%) | 11 (12.6%) |
| 40 to 44 Years | 16 (25.0%) | 0 (0.0%) |
| 45 to 49 Years | 0 (0.0%) | 0 (0.0%) |
| 50 to 54 Years | 0 (0.0%) | 0 (0.0%) |
| 55 to 59 Years | 0 (0.0%) | 0 (0.0%) |
| 60 to 64 Years | 0 (0.0%) | 0 (0.0%) |
| 65 to 69 Years | 0 (0.0%) | 7 (8.1%) |
| 70 to 74 Years | 8 (12.5%) | 24 (27.6%) |
| 75 to 79 Years | 0 (0.0%) | 0 (0.0%) |
| 80 to 84 Years | 9 (14.1%) | 0 (0.0%) |
| 85 Years and over | 0 (0.0%) | 0 (0.0%) |
| Total | 64 (100.0%) | 87 (100.0%) |
Families and Households in Captiva
Median Family Size in Captiva
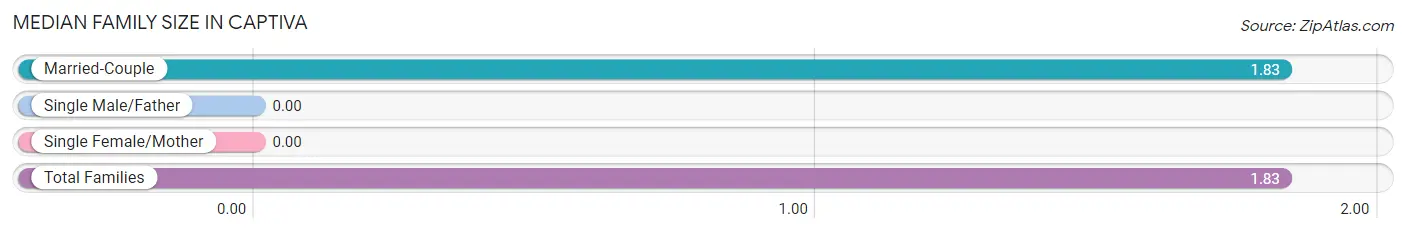
| Family Type | # Families | Family Size |
| Married-Couple | 30 (100.0%) | 1.83 |
| Single Male/Father | 0 (0.0%) | - |
| Single Female/Mother | 0 (0.0%) | - |
| Total Families | 30 (100.0%) | 1.83 |
Median Household Size in Captiva
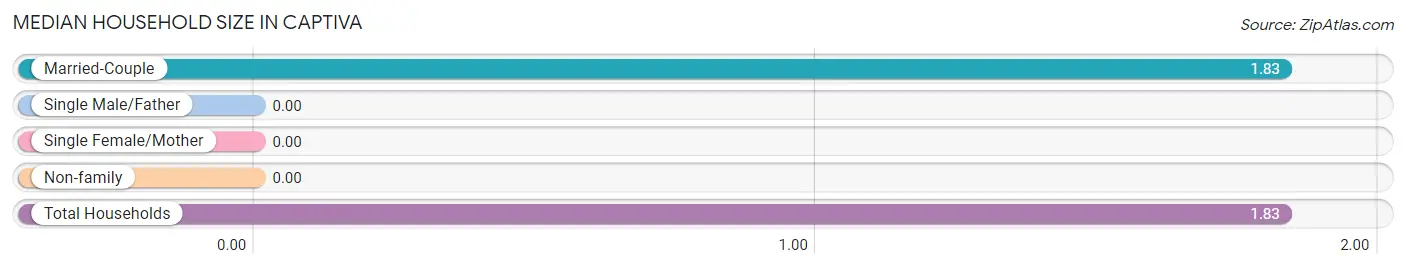
| Household Type | # Households | Household Size |
| Married-Couple | 30 (100.0%) | 1.83 |
| Single Male/Father | 0 (0.0%) | - |
| Single Female/Mother | 0 (0.0%) | - |
| Non-family | 0 (0.0%) | - |
| Total Households | 30 (100.0%) | 1.83 |
Household Size by Marriage Status in Captiva
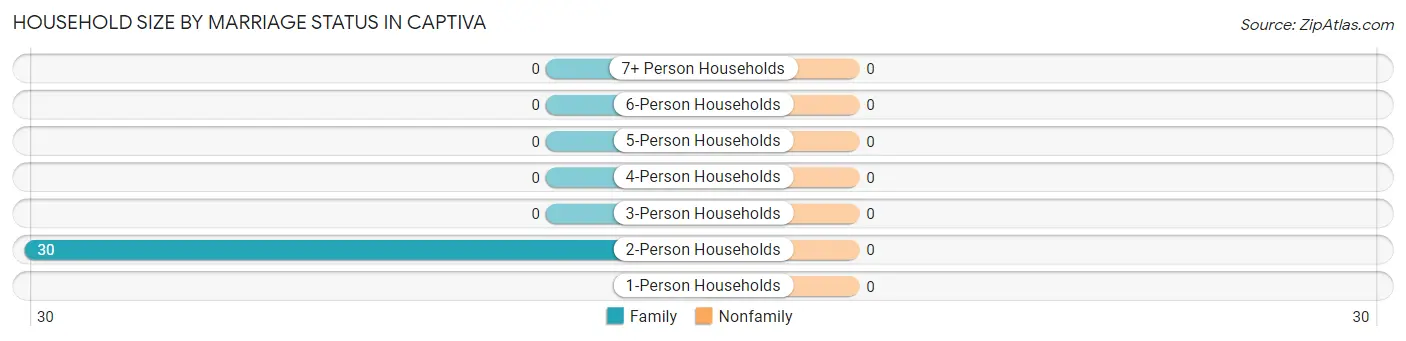
| Household Size | Family Households | Nonfamily Households |
| 1-Person Households | - | 0 (0.0%) |
| 2-Person Households | 30 (100.0%) | 0 (0.0%) |
| 3-Person Households | 0 (0.0%) | 0 (0.0%) |
| 4-Person Households | 0 (0.0%) | 0 (0.0%) |
| 5-Person Households | 0 (0.0%) | 0 (0.0%) |
| 6-Person Households | 0 (0.0%) | 0 (0.0%) |
| 7+ Person Households | 0 (0.0%) | 0 (0.0%) |
| Total | 30 (100.0%) | 0 (0.0%) |
Female Fertility in Captiva
Fertility by Age in Captiva
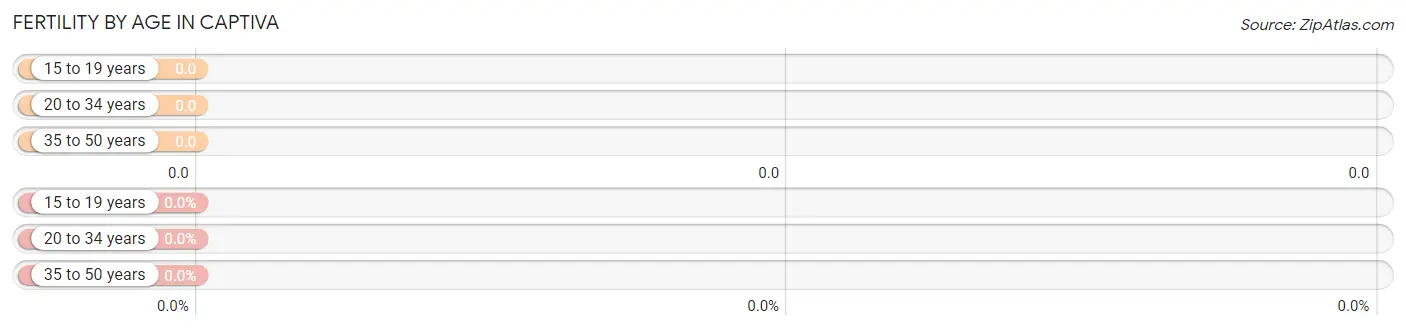
| Age Bracket | Women with Births | Births / 1,000 Women |
| 15 to 19 years | 0 (0.0%) | 0.0 |
| 20 to 34 years | 0 (0.0%) | 0.0 |
| 35 to 50 years | 0 (0.0%) | 0.0 |
| Total | 0 (0.0%) | 0.0 |
Fertility by Age by Marriage Status in Captiva
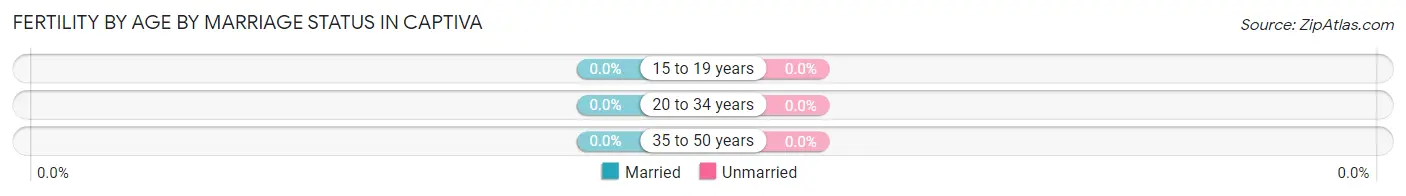
| Age Bracket | Married | Unmarried |
| 15 to 19 years | 0 (0.0%) | 0 (0.0%) |
| 20 to 34 years | 0 (0.0%) | 0 (0.0%) |
| 35 to 50 years | 0 (0.0%) | 0 (0.0%) |
| Total | 0 (0.0%) | 0 (0.0%) |
Fertility by Education in Captiva
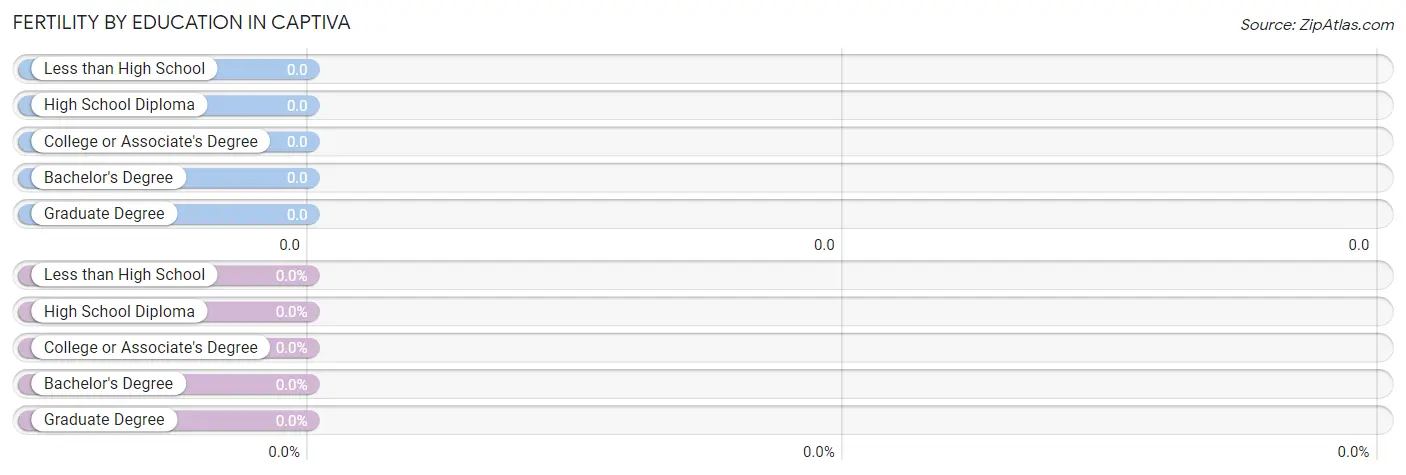
| Educational Attainment | Women with Births | Births / 1,000 Women |
| Less than High School | 0 (0.0%) | 0.0 |
| High School Diploma | 0 (0.0%) | 0.0 |
| College or Associate's Degree | 0 (0.0%) | 0.0 |
| Bachelor's Degree | 0 (0.0%) | 0.0 |
| Graduate Degree | 0 (0.0%) | 0.0 |
| Total | 0 (0.0%) | 0.0 |
Fertility by Education by Marriage Status in Captiva
| Educational Attainment | Married | Unmarried |
| Less than High School | 0 (0.0%) | 0 (0.0%) |
| High School Diploma | 0 (0.0%) | 0 (0.0%) |
| College or Associate's Degree | 0 (0.0%) | 0 (0.0%) |
| Bachelor's Degree | 0 (0.0%) | 0 (0.0%) |
| Graduate Degree | 0 (0.0%) | 0 (0.0%) |
| Total | 0 (0.0%) | 0 (0.0%) |
Employment Characteristics in Captiva
Employment by Class of Employer in Captiva
Among the 56 employed individuals in Captiva, not-for-profit organizations (32 | 57.1%), and private company employees (24 | 42.9%) make up the most common classes of employment.
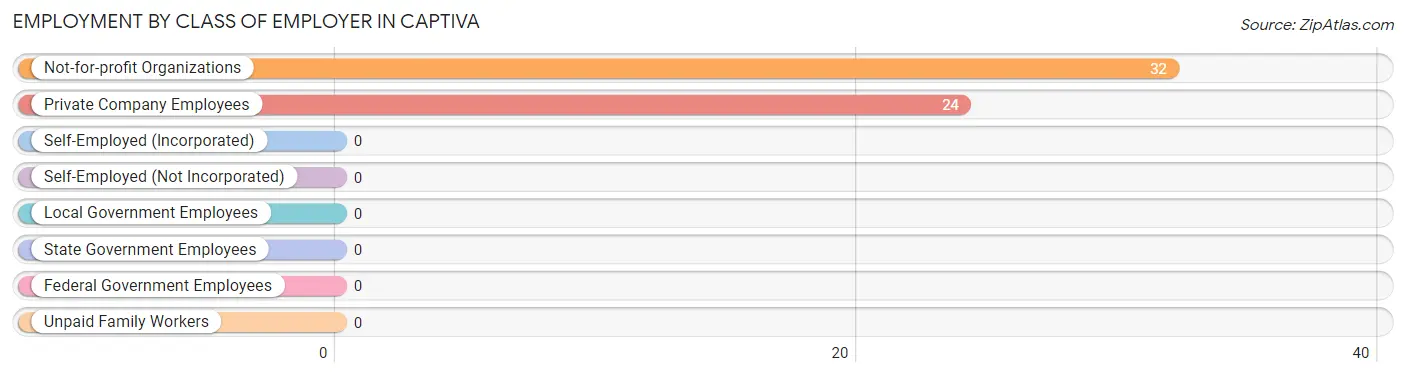
| Employer Class | # Employees | % Employees |
| Private Company Employees | 24 | 42.9% |
| Self-Employed (Incorporated) | 0 | 0.0% |
| Self-Employed (Not Incorporated) | 0 | 0.0% |
| Not-for-profit Organizations | 32 | 57.1% |
| Local Government Employees | 0 | 0.0% |
| State Government Employees | 0 | 0.0% |
| Federal Government Employees | 0 | 0.0% |
| Unpaid Family Workers | 0 | 0.0% |
| Total | 56 | 100.0% |
Employment Status by Age in Captiva
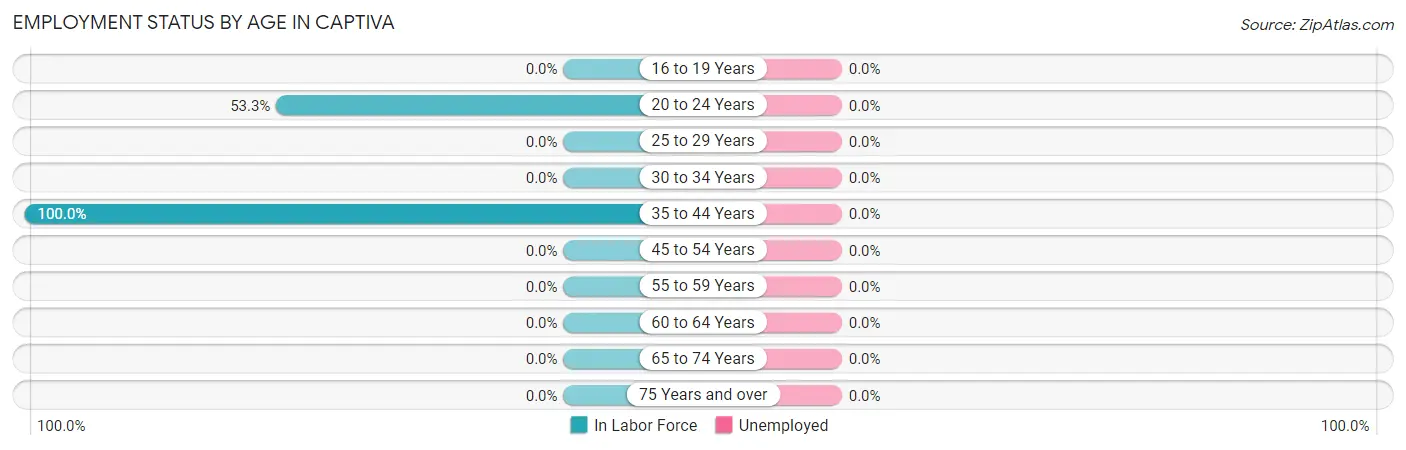
| Age Bracket | In Labor Force | Unemployed |
| 16 to 19 Years | 0 (0.0%) | 0 (0.0%) |
| 20 to 24 Years | 16 (53.3%) | 0 (0.0%) |
| 25 to 29 Years | 0 (0.0%) | 0 (0.0%) |
| 30 to 34 Years | 0 (0.0%) | 0 (0.0%) |
| 35 to 44 Years | 40 (100.0%) | 0 (0.0%) |
| 45 to 54 Years | 0 (0.0%) | 0 (0.0%) |
| 55 to 59 Years | 0 (0.0%) | 0 (0.0%) |
| 60 to 64 Years | 0 (0.0%) | 0 (0.0%) |
| 65 to 74 Years | 0 (0.0%) | 0 (0.0%) |
| 75 Years and over | 0 (0.0%) | 0 (0.0%) |
| Total | 56 (37.1%) | 0 (0.0%) |
Employment Status by Educational Attainment in Captiva
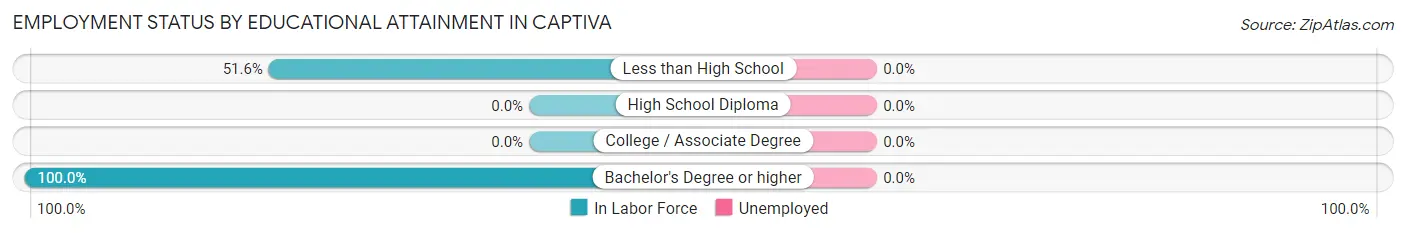
| Educational Attainment | In Labor Force | Unemployed |
| Less than High School | 16 (51.6%) | 0 (0.0%) |
| High School Diploma | 0 (0.0%) | 0 (0.0%) |
| College / Associate Degree | 0 (0.0%) | 0 (0.0%) |
| Bachelor's Degree or higher | 24 (100.0%) | 0 (0.0%) |
| Total | 40 (54.8%) | 0 (0.0%) |
Employment Occupations by Sex in Captiva
Management, Business, Science and Arts Occupations
The most common Management, Business, Science and Arts occupations in Captiva are Business & Financial (24 | 42.9%), Community & Social Service (16 | 28.6%), and Education Instruction & Library (16 | 28.6%).
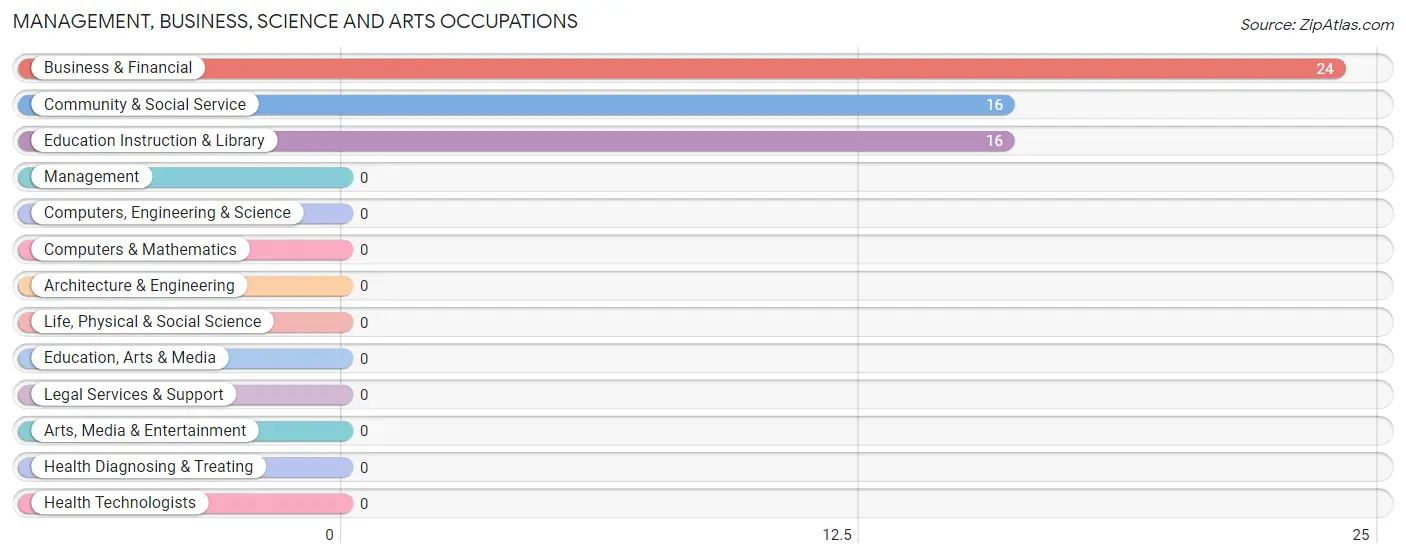
Management, Business, Science and Arts Occupations by Sex
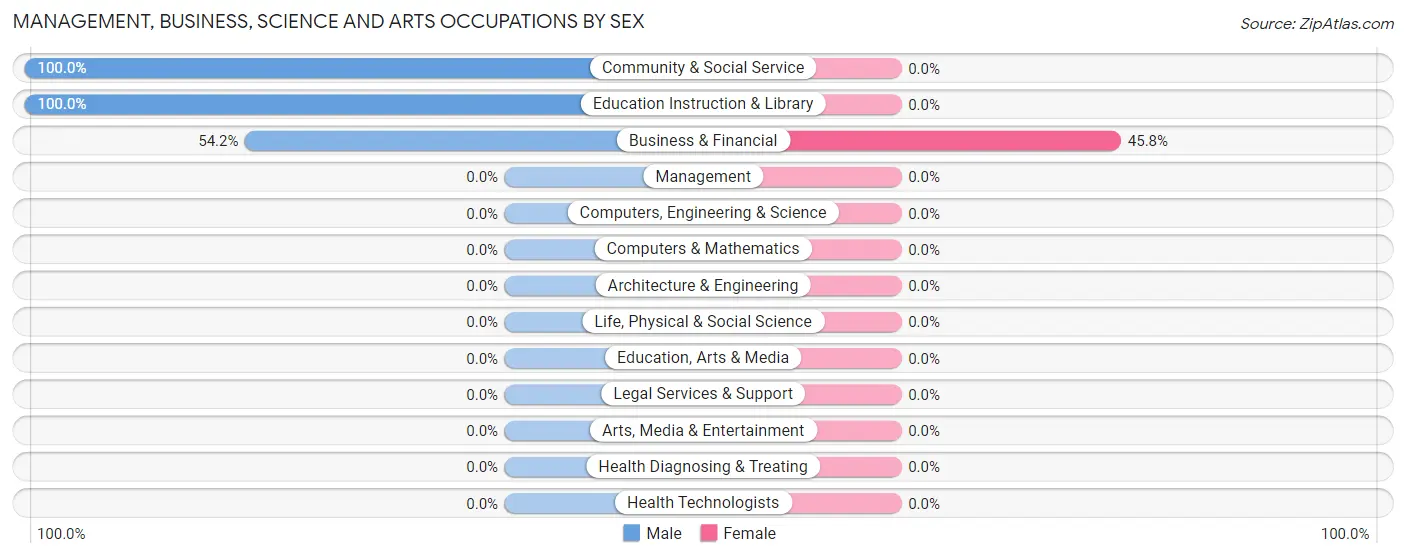
| Occupation | Male | Female |
| Management | 0 (0.0%) | 0 (0.0%) |
| Business & Financial | 13 (54.2%) | 11 (45.8%) |
| Computers, Engineering & Science | 0 (0.0%) | 0 (0.0%) |
| Computers & Mathematics | 0 (0.0%) | 0 (0.0%) |
| Architecture & Engineering | 0 (0.0%) | 0 (0.0%) |
| Life, Physical & Social Science | 0 (0.0%) | 0 (0.0%) |
| Community & Social Service | 16 (100.0%) | 0 (0.0%) |
| Education, Arts & Media | 0 (0.0%) | 0 (0.0%) |
| Legal Services & Support | 0 (0.0%) | 0 (0.0%) |
| Education Instruction & Library | 16 (100.0%) | 0 (0.0%) |
| Arts, Media & Entertainment | 0 (0.0%) | 0 (0.0%) |
| Health Diagnosing & Treating | 0 (0.0%) | 0 (0.0%) |
| Health Technologists | 0 (0.0%) | 0 (0.0%) |
| Total (Category) | 29 (72.5%) | 11 (27.5%) |
| Total (Overall) | 29 (51.8%) | 27 (48.2%) |
Services Occupations
The most common Services occupations in Captiva are , and Healthcare Support (16 | 28.6%).
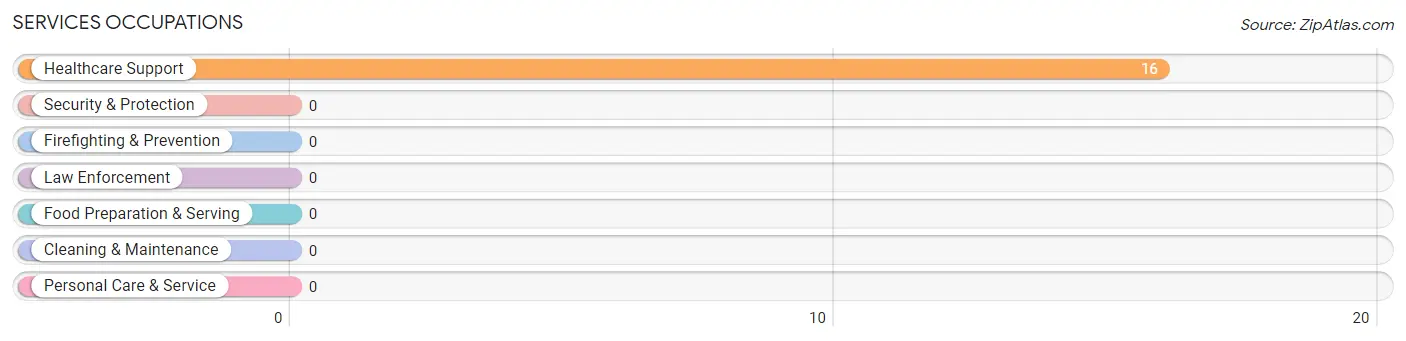
Services Occupations by Sex
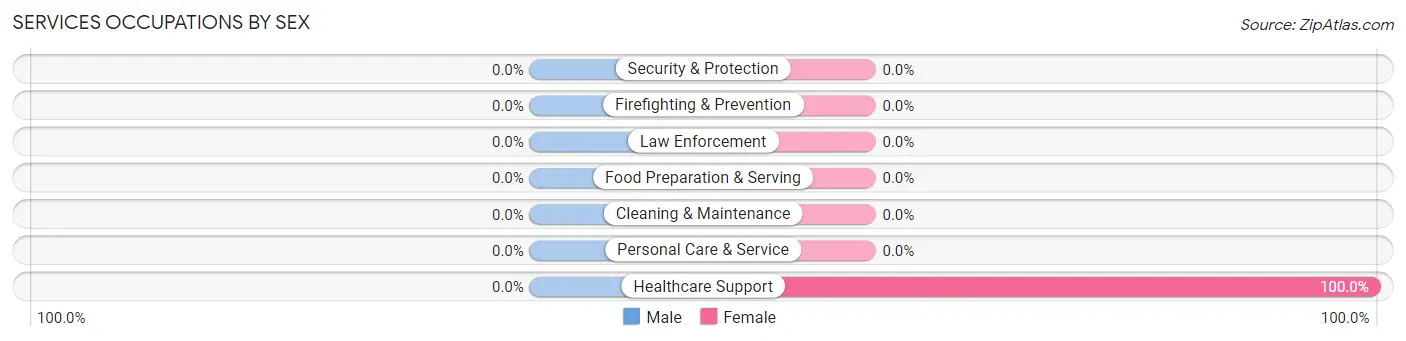
| Occupation | Male | Female |
| Healthcare Support | 0 (0.0%) | 16 (100.0%) |
| Security & Protection | 0 (0.0%) | 0 (0.0%) |
| Firefighting & Prevention | 0 (0.0%) | 0 (0.0%) |
| Law Enforcement | 0 (0.0%) | 0 (0.0%) |
| Food Preparation & Serving | 0 (0.0%) | 0 (0.0%) |
| Cleaning & Maintenance | 0 (0.0%) | 0 (0.0%) |
| Personal Care & Service | 0 (0.0%) | 0 (0.0%) |
| Total (Category) | 0 (0.0%) | 16 (100.0%) |
| Total (Overall) | 29 (51.8%) | 27 (48.2%) |
Sales and Office Occupations
Sales and Office Occupations by Sex
| Occupation | Male | Female |
| Sales & Related | 0 (0.0%) | 0 (0.0%) |
| Office & Administration | 0 (0.0%) | 0 (0.0%) |
| Total (Category) | 0 (0.0%) | 0 (0.0%) |
| Total (Overall) | 29 (51.8%) | 27 (48.2%) |
Natural Resources, Construction and Maintenance Occupations
Natural Resources, Construction and Maintenance Occupations by Sex
| Occupation | Male | Female |
| Farming, Fishing & Forestry | 0 (0.0%) | 0 (0.0%) |
| Construction & Extraction | 0 (0.0%) | 0 (0.0%) |
| Installation, Maintenance & Repair | 0 (0.0%) | 0 (0.0%) |
| Total (Category) | 0 (0.0%) | 0 (0.0%) |
| Total (Overall) | 29 (51.8%) | 27 (48.2%) |
Production, Transportation and Moving Occupations
Production, Transportation and Moving Occupations by Sex
| Occupation | Male | Female |
| Production | 0 (0.0%) | 0 (0.0%) |
| Transportation | 0 (0.0%) | 0 (0.0%) |
| Material Moving | 0 (0.0%) | 0 (0.0%) |
| Total (Category) | 0 (0.0%) | 0 (0.0%) |
| Total (Overall) | 29 (51.8%) | 27 (48.2%) |
Employment Industries by Sex in Captiva
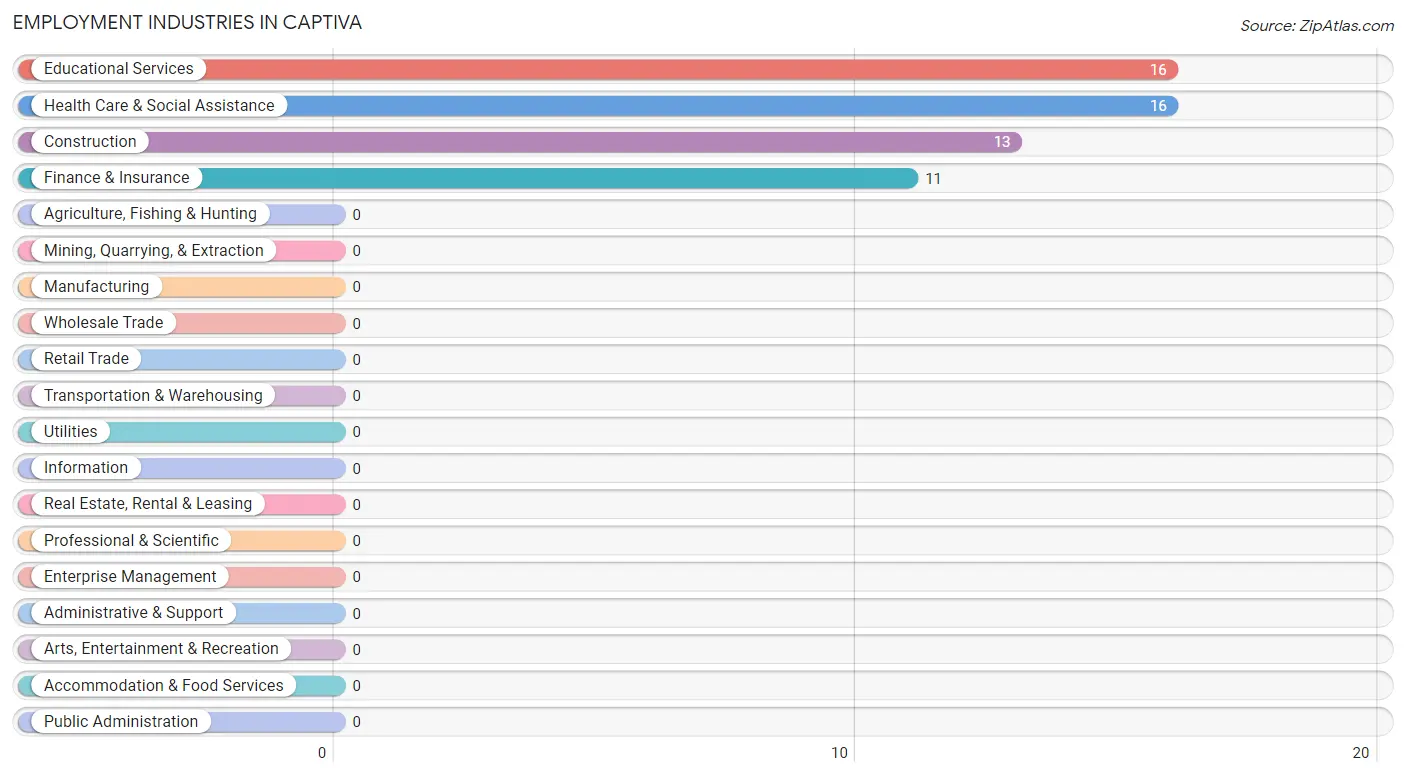
Employment Industries in Captiva
The major employment industries in Captiva include Educational Services (16 | 28.6%), Health Care & Social Assistance (16 | 28.6%), Construction (13 | 23.2%), and Finance & Insurance (11 | 19.6%).
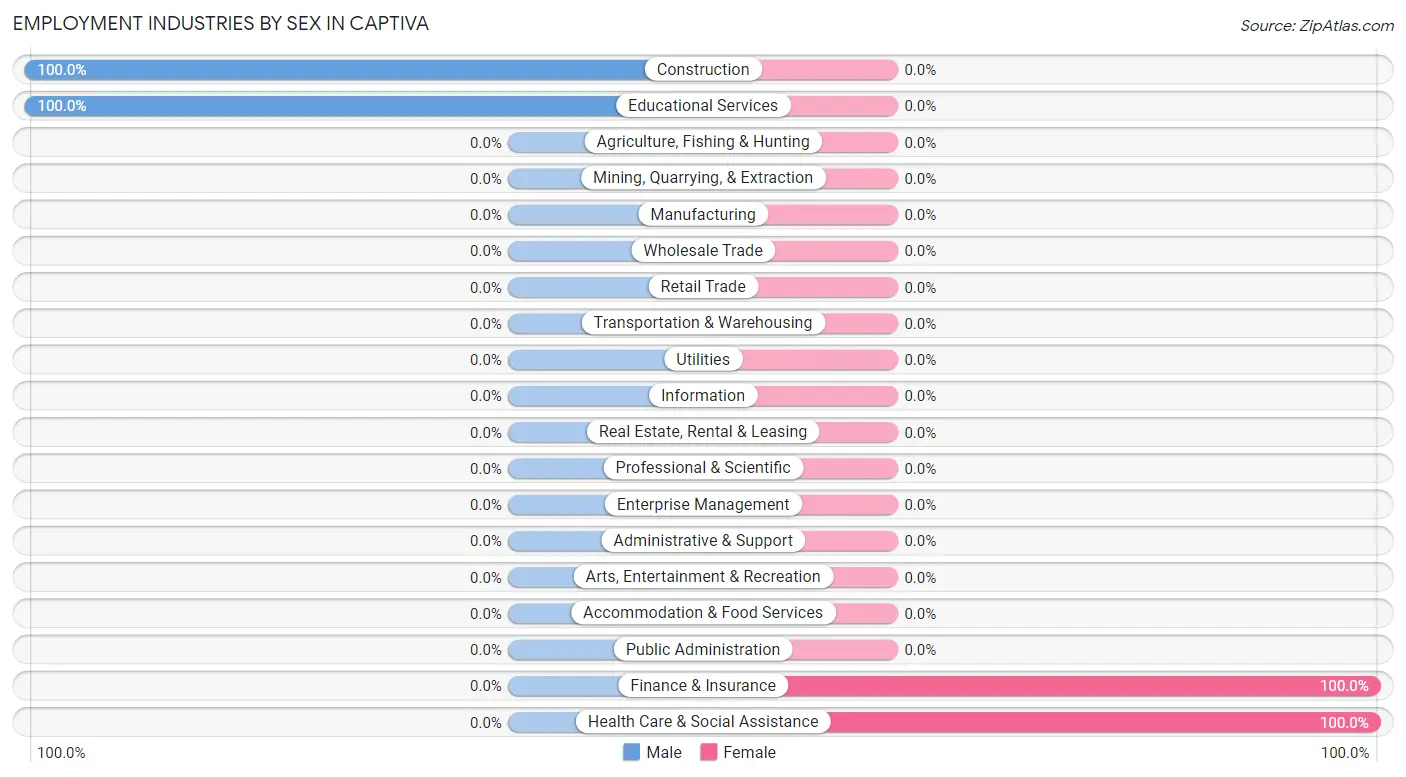
Employment Industries by Sex in Captiva
The Captiva industries that see more men than women are Construction (100.0%), and Educational Services (100.0%), whereas the industries that tend to have a higher number of women are Finance & Insurance (100.0%), and Health Care & Social Assistance (100.0%).
| Industry | Male | Female |
| Agriculture, Fishing & Hunting | 0 (0.0%) | 0 (0.0%) |
| Mining, Quarrying, & Extraction | 0 (0.0%) | 0 (0.0%) |
| Construction | 13 (100.0%) | 0 (0.0%) |
| Manufacturing | 0 (0.0%) | 0 (0.0%) |
| Wholesale Trade | 0 (0.0%) | 0 (0.0%) |
| Retail Trade | 0 (0.0%) | 0 (0.0%) |
| Transportation & Warehousing | 0 (0.0%) | 0 (0.0%) |
| Utilities | 0 (0.0%) | 0 (0.0%) |
| Information | 0 (0.0%) | 0 (0.0%) |
| Finance & Insurance | 0 (0.0%) | 11 (100.0%) |
| Real Estate, Rental & Leasing | 0 (0.0%) | 0 (0.0%) |
| Professional & Scientific | 0 (0.0%) | 0 (0.0%) |
| Enterprise Management | 0 (0.0%) | 0 (0.0%) |
| Administrative & Support | 0 (0.0%) | 0 (0.0%) |
| Educational Services | 16 (100.0%) | 0 (0.0%) |
| Health Care & Social Assistance | 0 (0.0%) | 16 (100.0%) |
| Arts, Entertainment & Recreation | 0 (0.0%) | 0 (0.0%) |
| Accommodation & Food Services | 0 (0.0%) | 0 (0.0%) |
| Public Administration | 0 (0.0%) | 0 (0.0%) |
| Total | 29 (51.8%) | 27 (48.2%) |
Education in Captiva
School Enrollment in Captiva
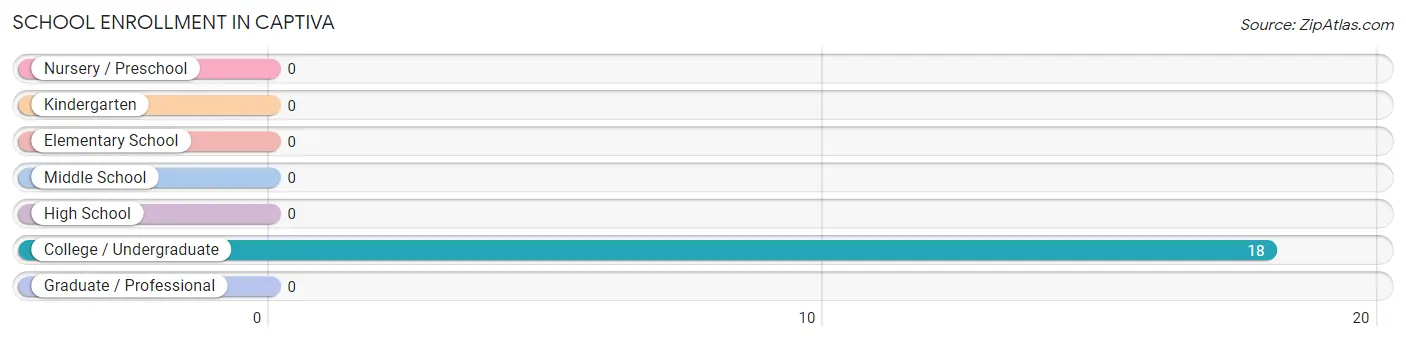
| School Level | # Students | % Students |
| Nursery / Preschool | 0 | 0.0% |
| Kindergarten | 0 | 0.0% |
| Elementary School | 0 | 0.0% |
| Middle School | 0 | 0.0% |
| High School | 0 | 0.0% |
| College / Undergraduate | 18 | 100.0% |
| Graduate / Professional | 0 | 0.0% |
| Total | 18 | 100.0% |
School Enrollment by Age by Funding Source in Captiva
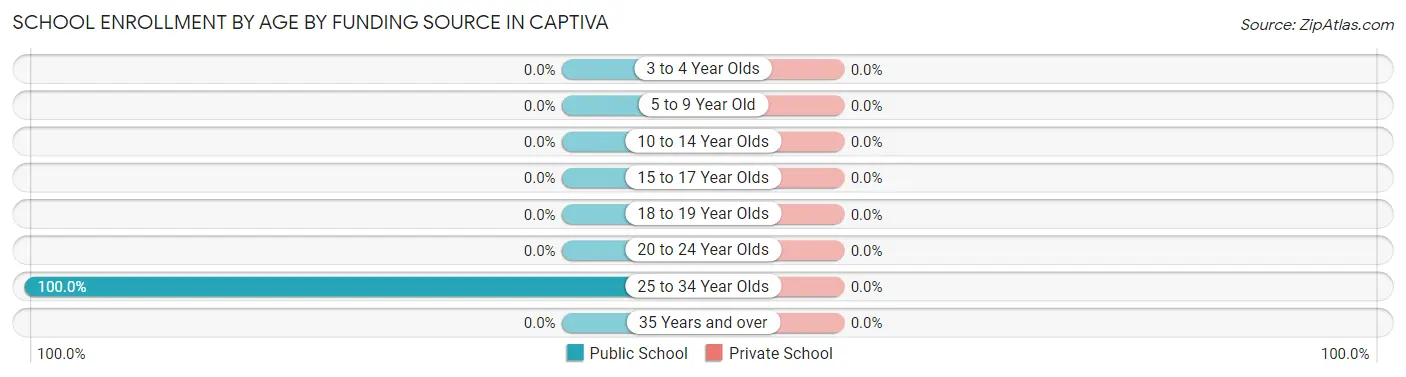
| Age Bracket | Public School | Private School |
| 3 to 4 Year Olds | 0 (0.0%) | 0 (0.0%) |
| 5 to 9 Year Old | 0 (0.0%) | 0 (0.0%) |
| 10 to 14 Year Olds | 0 (0.0%) | 0 (0.0%) |
| 15 to 17 Year Olds | 0 (0.0%) | 0 (0.0%) |
| 18 to 19 Year Olds | 0 (0.0%) | 0 (0.0%) |
| 20 to 24 Year Olds | 0 (0.0%) | 0 (0.0%) |
| 25 to 34 Year Olds | 18 (100.0%) | 0 (0.0%) |
| 35 Years and over | 0 (0.0%) | 0 (0.0%) |
| Total | 18 (100.0%) | 0 (0.0%) |
Educational Attainment by Field of Study in Captiva
Business (25 | 41.0%), engineering (9 | 14.7%), computers & mathematics (7 | 11.5%), literature & languages (7 | 11.5%), and liberal arts & history (7 | 11.5%) are the most common fields of study among 61 individuals in Captiva who have obtained a bachelor's degree or higher.
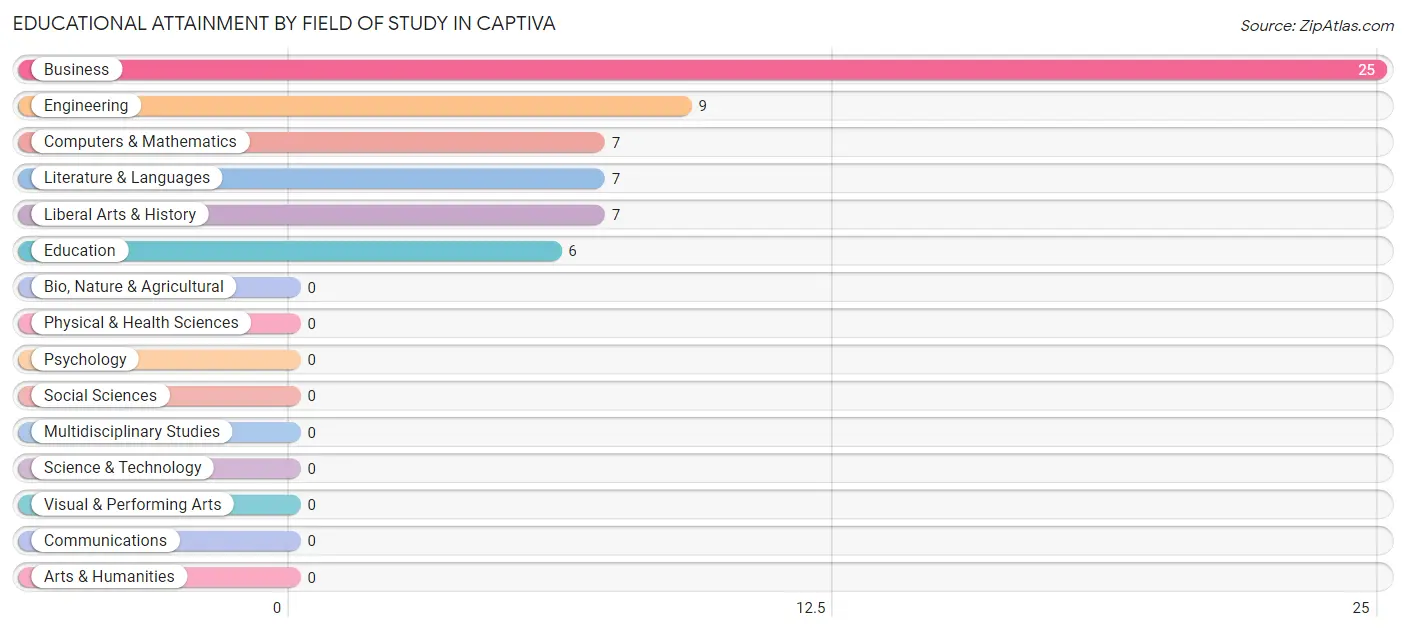
| Field of Study | # Graduates | % Graduates |
| Computers & Mathematics | 7 | 11.5% |
| Bio, Nature & Agricultural | 0 | 0.0% |
| Physical & Health Sciences | 0 | 0.0% |
| Psychology | 0 | 0.0% |
| Social Sciences | 0 | 0.0% |
| Engineering | 9 | 14.7% |
| Multidisciplinary Studies | 0 | 0.0% |
| Science & Technology | 0 | 0.0% |
| Business | 25 | 41.0% |
| Education | 6 | 9.8% |
| Literature & Languages | 7 | 11.5% |
| Liberal Arts & History | 7 | 11.5% |
| Visual & Performing Arts | 0 | 0.0% |
| Communications | 0 | 0.0% |
| Arts & Humanities | 0 | 0.0% |
| Total | 61 | 100.0% |
Transportation & Commute in Captiva
Vehicle Availability by Sex in Captiva
The most prevalent vehicle ownership categories in Captiva are males with 2 vehicles (13, accounting for 100.0%) and females with 2 vehicles (11, making up 118.2%).
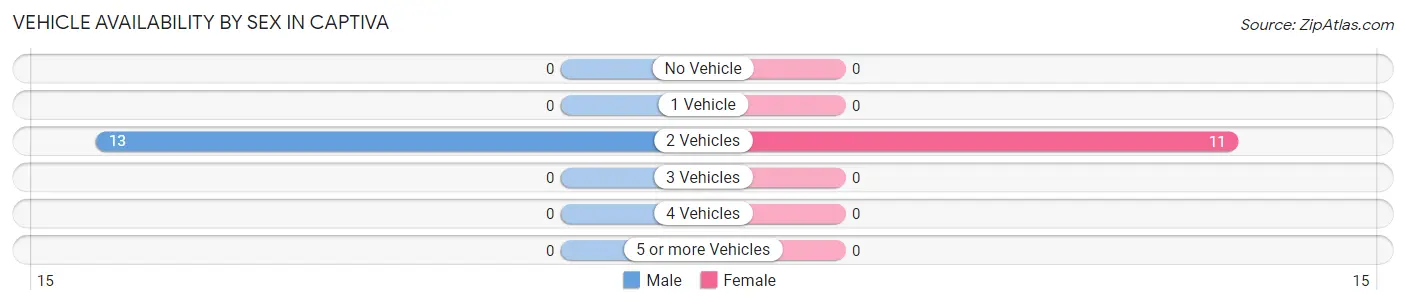
| Vehicles Available | Male | Female |
| No Vehicle | 0 (0.0%) | 0 (0.0%) |
| 1 Vehicle | 0 (0.0%) | 0 (0.0%) |
| 2 Vehicles | 13 (100.0%) | 11 (100.0%) |
| 3 Vehicles | 0 (0.0%) | 0 (0.0%) |
| 4 Vehicles | 0 (0.0%) | 0 (0.0%) |
| 5 or more Vehicles | 0 (0.0%) | 0 (0.0%) |
| Total | 13 (100.0%) | 11 (100.0%) |
Commute Time in Captiva
The most frequently occuring commute durations in Captiva are 90 or more minutes (16 commuters, 59.3%), 45 to 59 minutes (11 commuters, 40.7%), and less than 5 minutes (0 commuters, 0.0%).
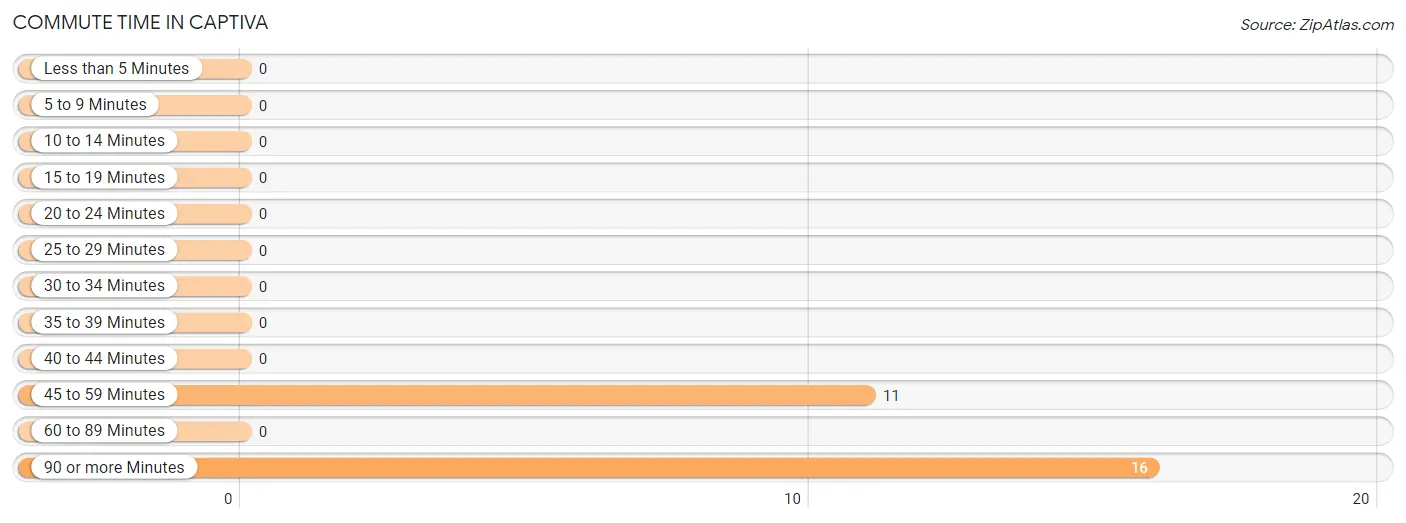
| Commute Time | # Commuters | % Commuters |
| Less than 5 Minutes | 0 | 0.0% |
| 5 to 9 Minutes | 0 | 0.0% |
| 10 to 14 Minutes | 0 | 0.0% |
| 15 to 19 Minutes | 0 | 0.0% |
| 20 to 24 Minutes | 0 | 0.0% |
| 25 to 29 Minutes | 0 | 0.0% |
| 30 to 34 Minutes | 0 | 0.0% |
| 35 to 39 Minutes | 0 | 0.0% |
| 40 to 44 Minutes | 0 | 0.0% |
| 45 to 59 Minutes | 11 | 40.7% |
| 60 to 89 Minutes | 0 | 0.0% |
| 90 or more Minutes | 16 | 59.3% |
Commute Time by Sex in Captiva
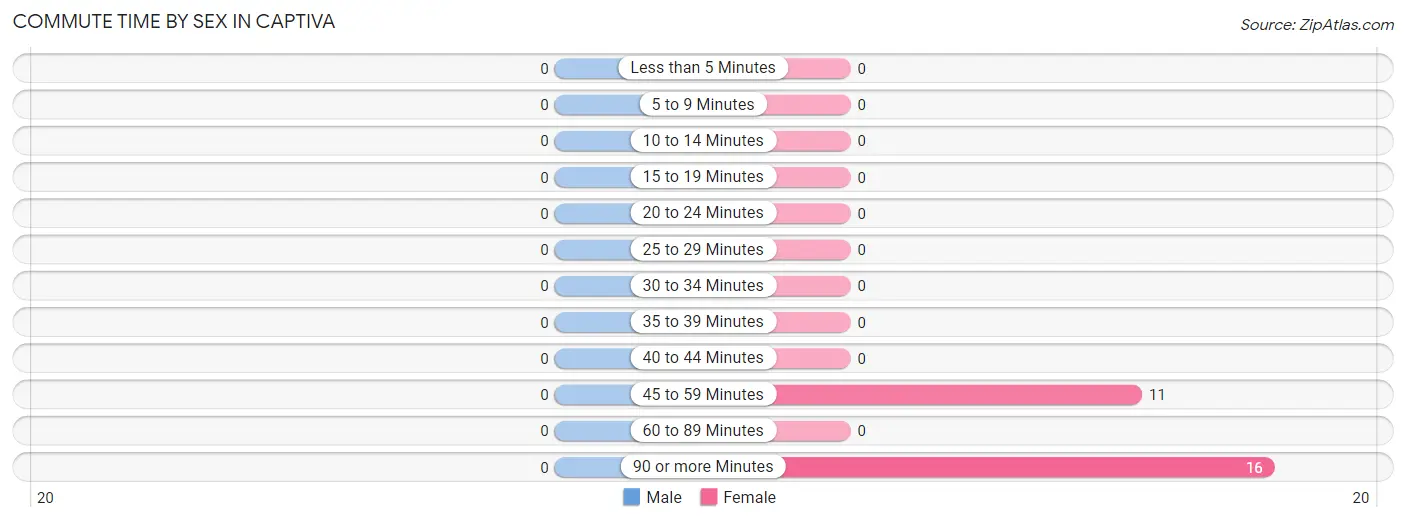
| Commute Time | Male | Female |
| Less than 5 Minutes | 0 (0.0%) | 0 (0.0%) |
| 5 to 9 Minutes | 0 (0.0%) | 0 (0.0%) |
| 10 to 14 Minutes | 0 (0.0%) | 0 (0.0%) |
| 15 to 19 Minutes | 0 (0.0%) | 0 (0.0%) |
| 20 to 24 Minutes | 0 (0.0%) | 0 (0.0%) |
| 25 to 29 Minutes | 0 (0.0%) | 0 (0.0%) |
| 30 to 34 Minutes | 0 (0.0%) | 0 (0.0%) |
| 35 to 39 Minutes | 0 (0.0%) | 0 (0.0%) |
| 40 to 44 Minutes | 0 (0.0%) | 0 (0.0%) |
| 45 to 59 Minutes | 0 (0.0%) | 11 (40.7%) |
| 60 to 89 Minutes | 0 (0.0%) | 0 (0.0%) |
| 90 or more Minutes | 0 (0.0%) | 16 (59.3%) |
Time of Departure to Work by Sex in Captiva
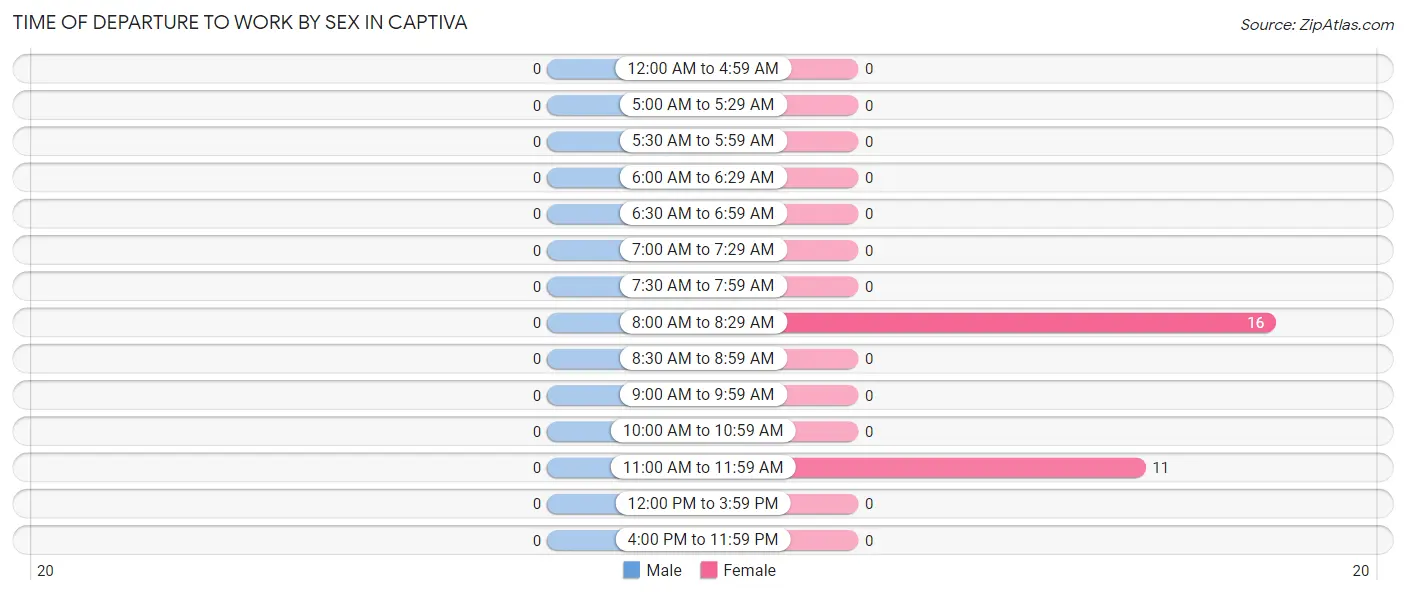
| Time of Departure | Male | Female |
| 12:00 AM to 4:59 AM | 0 (0.0%) | 0 (0.0%) |
| 5:00 AM to 5:29 AM | 0 (0.0%) | 0 (0.0%) |
| 5:30 AM to 5:59 AM | 0 (0.0%) | 0 (0.0%) |
| 6:00 AM to 6:29 AM | 0 (0.0%) | 0 (0.0%) |
| 6:30 AM to 6:59 AM | 0 (0.0%) | 0 (0.0%) |
| 7:00 AM to 7:29 AM | 0 (0.0%) | 0 (0.0%) |
| 7:30 AM to 7:59 AM | 0 (0.0%) | 0 (0.0%) |
| 8:00 AM to 8:29 AM | 0 (0.0%) | 16 (59.3%) |
| 8:30 AM to 8:59 AM | 0 (0.0%) | 0 (0.0%) |
| 9:00 AM to 9:59 AM | 0 (0.0%) | 0 (0.0%) |
| 10:00 AM to 10:59 AM | 0 (0.0%) | 0 (0.0%) |
| 11:00 AM to 11:59 AM | 0 (0.0%) | 11 (40.7%) |
| 12:00 PM to 3:59 PM | 0 (0.0%) | 0 (0.0%) |
| 4:00 PM to 11:59 PM | 0 (0.0%) | 0 (0.0%) |
| Total | 0 (0.0%) | 27 (100.0%) |
Housing Occupancy in Captiva
Occupancy by Ownership in Captiva
Of the total 30 dwellings in Captiva, owner-occupied units account for 30 (100.0%), while renter-occupied units make up 0 (0.0%).
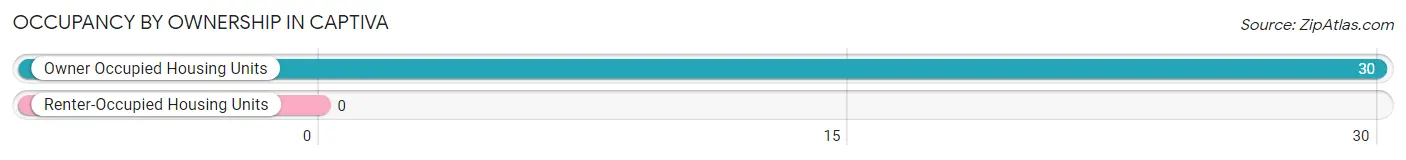
| Occupancy | # Housing Units | % Housing Units |
| Owner Occupied Housing Units | 30 | 100.0% |
| Renter-Occupied Housing Units | 0 | 0.0% |
| Total Occupied Housing Units | 30 | 100.0% |
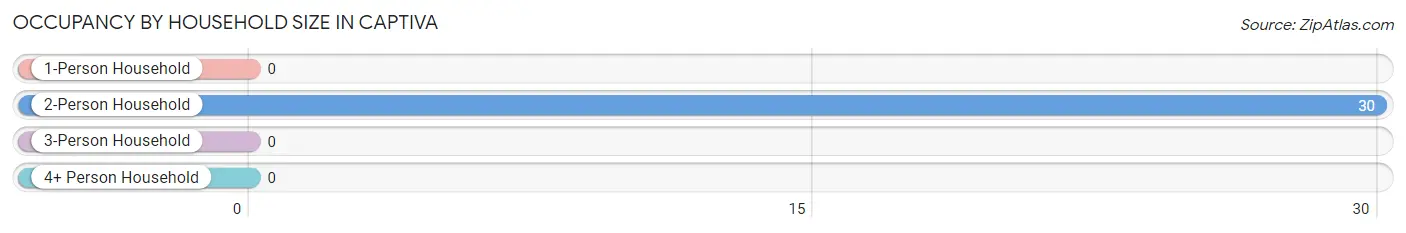
Occupancy by Household Size in Captiva
| Household Size | # Housing Units | % Housing Units |
| 1-Person Household | 0 | 0.0% |
| 2-Person Household | 30 | 100.0% |
| 3-Person Household | 0 | 0.0% |
| 4+ Person Household | 0 | 0.0% |
| Total Housing Units | 30 | 100.0% |
Occupancy by Ownership by Household Size in Captiva
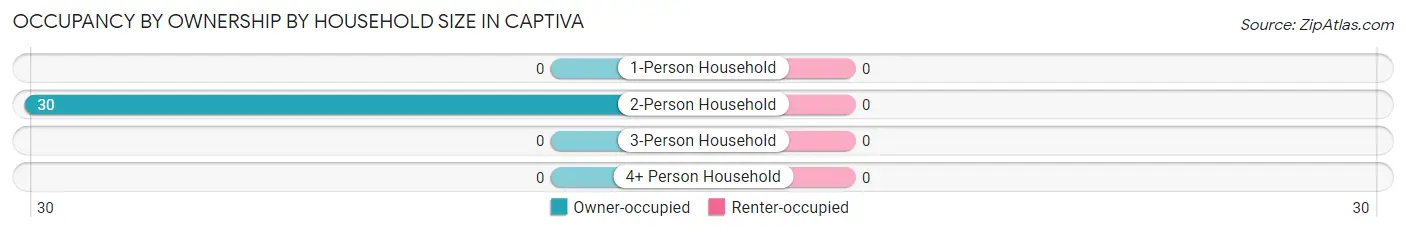
| Household Size | Owner-occupied | Renter-occupied |
| 1-Person Household | 0 (0.0%) | 0 (0.0%) |
| 2-Person Household | 30 (100.0%) | 0 (0.0%) |
| 3-Person Household | 0 (0.0%) | 0 (0.0%) |
| 4+ Person Household | 0 (0.0%) | 0 (0.0%) |
| Total Housing Units | 30 (100.0%) | 0 (0.0%) |
Occupancy by Educational Attainment in Captiva
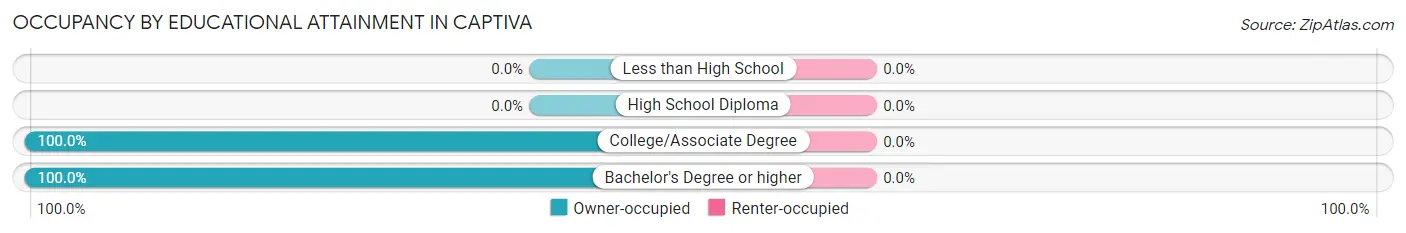
| Household Size | Owner-occupied | Renter-occupied |
| Less than High School | 0 (0.0%) | 0 (0.0%) |
| High School Diploma | 0 (0.0%) | 0 (0.0%) |
| College/Associate Degree | 1 (100.0%) | 0 (0.0%) |
| Bachelor's Degree or higher | 29 (100.0%) | 0 (0.0%) |
Occupancy by Age of Householder in Captiva
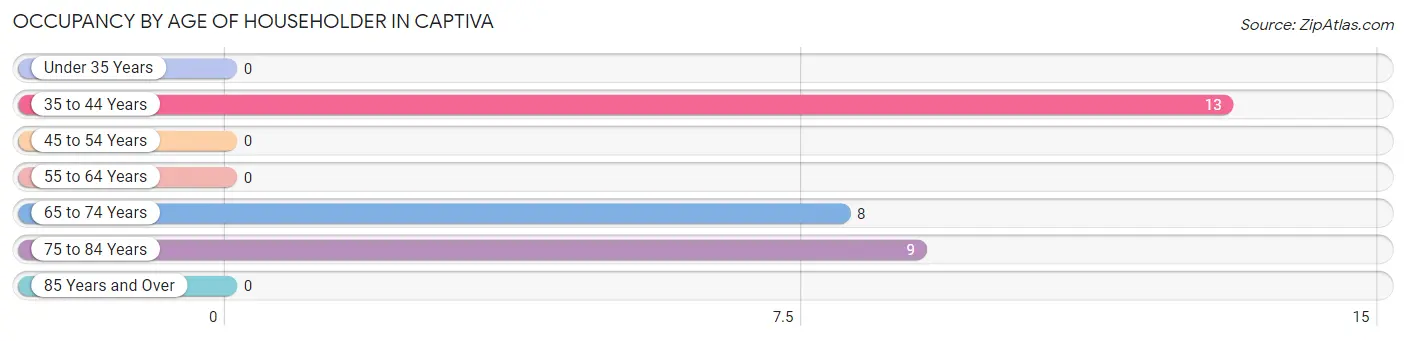
| Age Bracket | # Households | % Households |
| Under 35 Years | 0 | 0.0% |
| 35 to 44 Years | 13 | 43.3% |
| 45 to 54 Years | 0 | 0.0% |
| 55 to 64 Years | 0 | 0.0% |
| 65 to 74 Years | 8 | 26.7% |
| 75 to 84 Years | 9 | 30.0% |
| 85 Years and Over | 0 | 0.0% |
| Total | 30 | 100.0% |
Housing Finances in Captiva
Median Income by Occupancy in Captiva
| Occupancy Type | # Households | Median Income |
| Owner-Occupied | 30 (100.0%) | $0 |
| Renter-Occupied | 0 (0.0%) | $0 |
| Average | 30 (100.0%) | $0 |
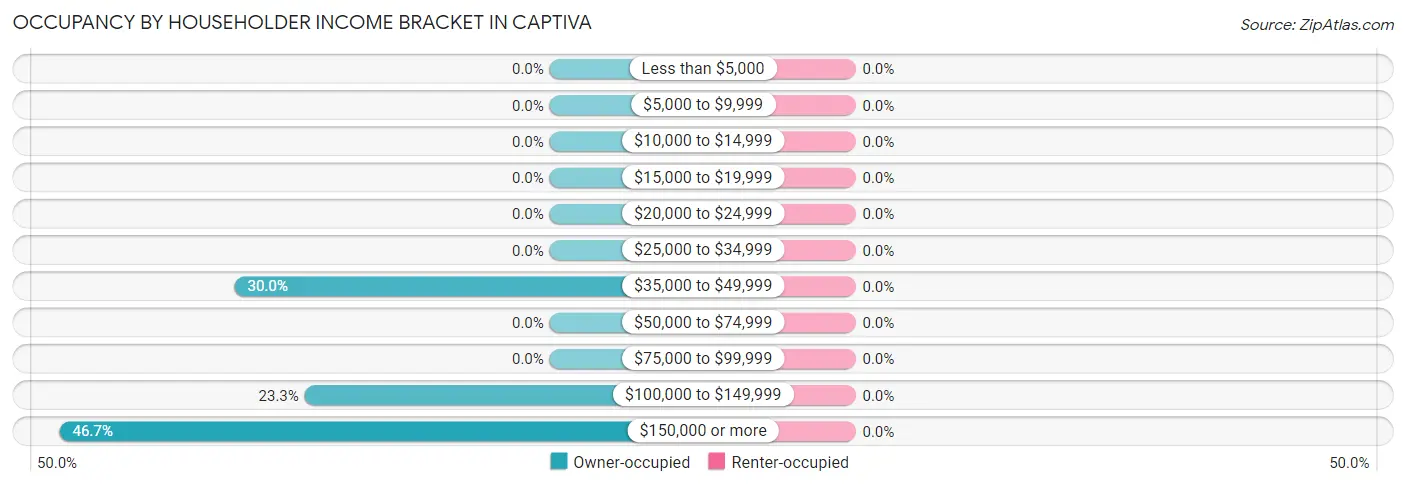
Occupancy by Householder Income Bracket in Captiva
| Income Bracket | Owner-occupied | Renter-occupied |
| Less than $5,000 | 0 (0.0%) | 0 (0.0%) |
| $5,000 to $9,999 | 0 (0.0%) | 0 (0.0%) |
| $10,000 to $14,999 | 0 (0.0%) | 0 (0.0%) |
| $15,000 to $19,999 | 0 (0.0%) | 0 (0.0%) |
| $20,000 to $24,999 | 0 (0.0%) | 0 (0.0%) |
| $25,000 to $34,999 | 0 (0.0%) | 0 (0.0%) |
| $35,000 to $49,999 | 9 (30.0%) | 0 (0.0%) |
| $50,000 to $74,999 | 0 (0.0%) | 0 (0.0%) |
| $75,000 to $99,999 | 0 (0.0%) | 0 (0.0%) |
| $100,000 to $149,999 | 7 (23.3%) | 0 (0.0%) |
| $150,000 or more | 14 (46.7%) | 0 (0.0%) |
| Total | 30 (100.0%) | 0 (0.0%) |
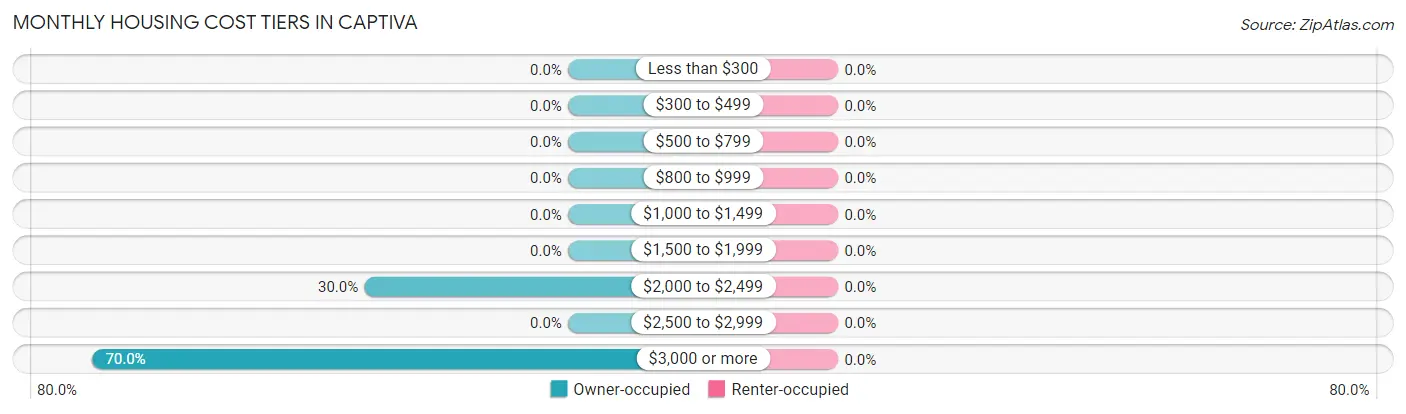
Monthly Housing Cost Tiers in Captiva
| Monthly Cost | Owner-occupied | Renter-occupied |
| Less than $300 | 0 (0.0%) | 0 (0.0%) |
| $300 to $499 | 0 (0.0%) | 0 (0.0%) |
| $500 to $799 | 0 (0.0%) | 0 (0.0%) |
| $800 to $999 | 0 (0.0%) | 0 (0.0%) |
| $1,000 to $1,499 | 0 (0.0%) | 0 (0.0%) |
| $1,500 to $1,999 | 0 (0.0%) | 0 (0.0%) |
| $2,000 to $2,499 | 9 (30.0%) | 0 (0.0%) |
| $2,500 to $2,999 | 0 (0.0%) | 0 (0.0%) |
| $3,000 or more | 21 (70.0%) | 0 (0.0%) |
| Total | 30 (100.0%) | 0 (0.0%) |
Physical Housing Characteristics in Captiva
Housing Structures in Captiva
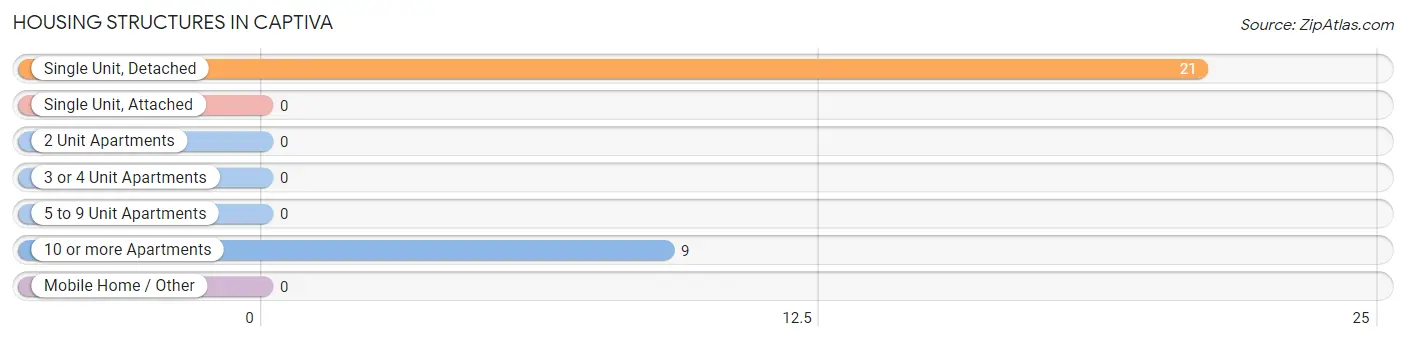
| Structure Type | # Housing Units | % Housing Units |
| Single Unit, Detached | 21 | 70.0% |
| Single Unit, Attached | 0 | 0.0% |
| 2 Unit Apartments | 0 | 0.0% |
| 3 or 4 Unit Apartments | 0 | 0.0% |
| 5 to 9 Unit Apartments | 0 | 0.0% |
| 10 or more Apartments | 9 | 30.0% |
| Mobile Home / Other | 0 | 0.0% |
| Total | 30 | 100.0% |
Housing Structures by Occupancy in Captiva
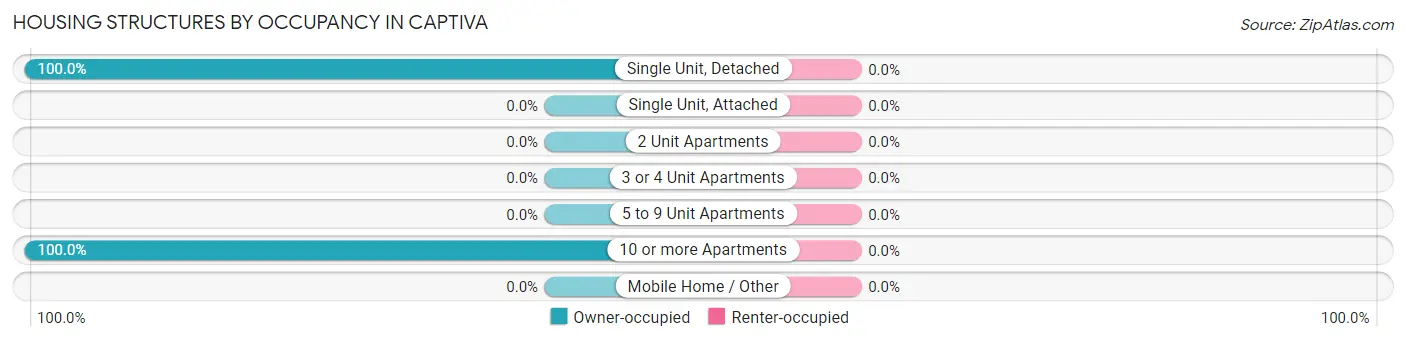
| Structure Type | Owner-occupied | Renter-occupied |
| Single Unit, Detached | 21 (100.0%) | 0 (0.0%) |
| Single Unit, Attached | 0 (0.0%) | 0 (0.0%) |
| 2 Unit Apartments | 0 (0.0%) | 0 (0.0%) |
| 3 or 4 Unit Apartments | 0 (0.0%) | 0 (0.0%) |
| 5 to 9 Unit Apartments | 0 (0.0%) | 0 (0.0%) |
| 10 or more Apartments | 9 (100.0%) | 0 (0.0%) |
| Mobile Home / Other | 0 (0.0%) | 0 (0.0%) |
| Total | 30 (100.0%) | 0 (0.0%) |
Housing Structures by Number of Rooms in Captiva
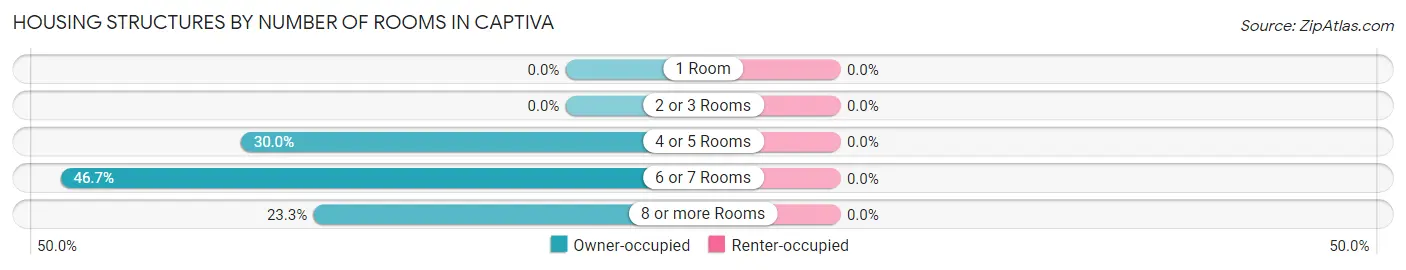
| Number of Rooms | Owner-occupied | Renter-occupied |
| 1 Room | 0 (0.0%) | 0 (0.0%) |
| 2 or 3 Rooms | 0 (0.0%) | 0 (0.0%) |
| 4 or 5 Rooms | 9 (30.0%) | 0 (0.0%) |
| 6 or 7 Rooms | 14 (46.7%) | 0 (0.0%) |
| 8 or more Rooms | 7 (23.3%) | 0 (0.0%) |
| Total | 30 (100.0%) | 0 (0.0%) |
Housing Structure by Heating Type in Captiva
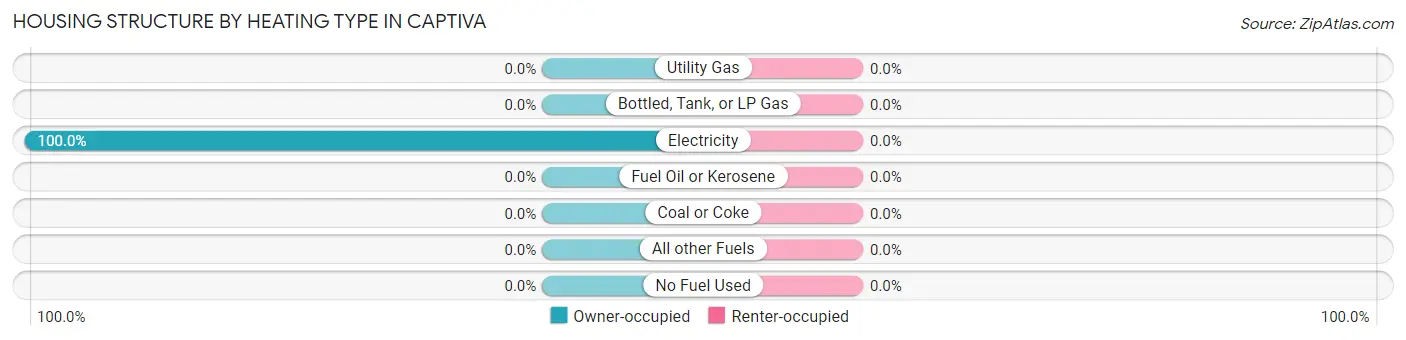
| Heating Type | Owner-occupied | Renter-occupied |
| Utility Gas | 0 (0.0%) | 0 (0.0%) |
| Bottled, Tank, or LP Gas | 0 (0.0%) | 0 (0.0%) |
| Electricity | 30 (100.0%) | 0 (0.0%) |
| Fuel Oil or Kerosene | 0 (0.0%) | 0 (0.0%) |
| Coal or Coke | 0 (0.0%) | 0 (0.0%) |
| All other Fuels | 0 (0.0%) | 0 (0.0%) |
| No Fuel Used | 0 (0.0%) | 0 (0.0%) |
| Total | 30 (100.0%) | 0 (0.0%) |
Household Vehicle Usage in Captiva
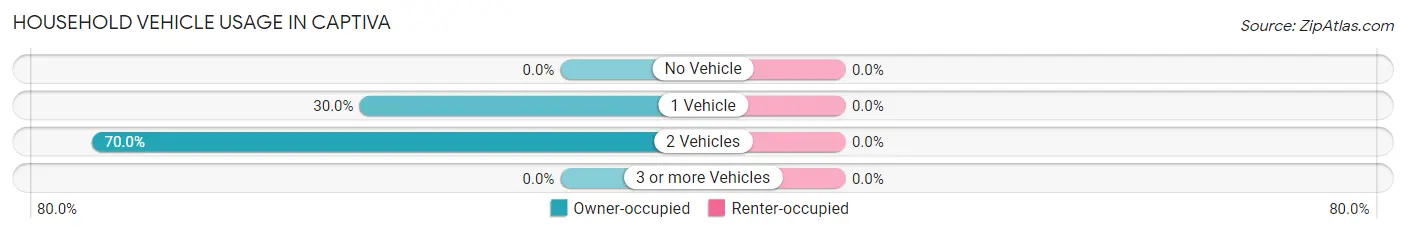
| Vehicles per Household | Owner-occupied | Renter-occupied |
| No Vehicle | 0 (0.0%) | 0 (0.0%) |
| 1 Vehicle | 9 (30.0%) | 0 (0.0%) |
| 2 Vehicles | 21 (70.0%) | 0 (0.0%) |
| 3 or more Vehicles | 0 (0.0%) | 0 (0.0%) |
| Total | 30 (100.0%) | 0 (0.0%) |
Real Estate & Mortgages in Captiva
Real Estate and Mortgage Overview in Captiva
| Characteristic | Without Mortgage | With Mortgage |
| Housing Units | 17 | 13 |
| Median Property Value | - | - |
| Median Household Income | - | - |
| Monthly Housing Costs | $1,501 | $13 |
| Real Estate Taxes | - | - |
Property Value by Mortgage Status in Captiva
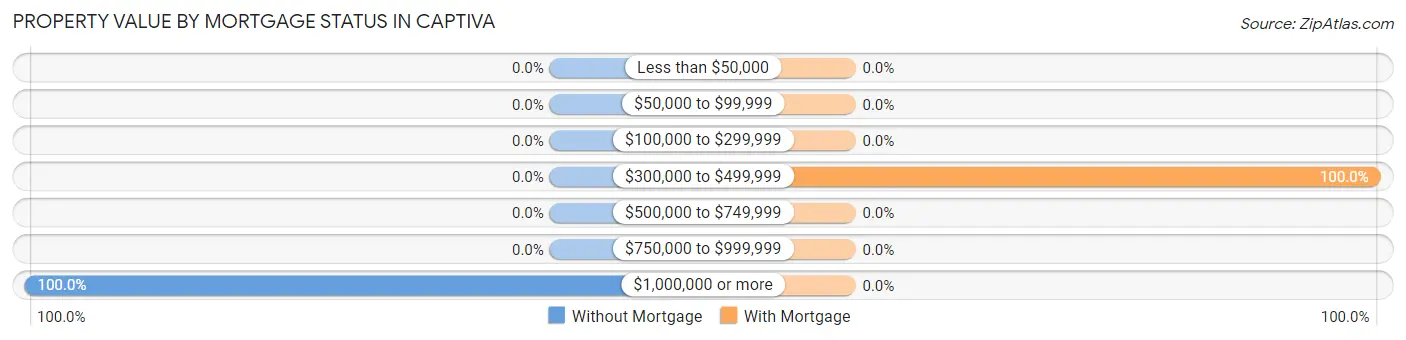
| Property Value | Without Mortgage | With Mortgage |
| Less than $50,000 | 0 (0.0%) | 0 (0.0%) |
| $50,000 to $99,999 | 0 (0.0%) | 0 (0.0%) |
| $100,000 to $299,999 | 0 (0.0%) | 0 (0.0%) |
| $300,000 to $499,999 | 0 (0.0%) | 13 (100.0%) |
| $500,000 to $749,999 | 0 (0.0%) | 0 (0.0%) |
| $750,000 to $999,999 | 0 (0.0%) | 0 (0.0%) |
| $1,000,000 or more | 17 (100.0%) | 0 (0.0%) |
| Total | 17 (100.0%) | 13 (100.0%) |
Household Income by Mortgage Status in Captiva
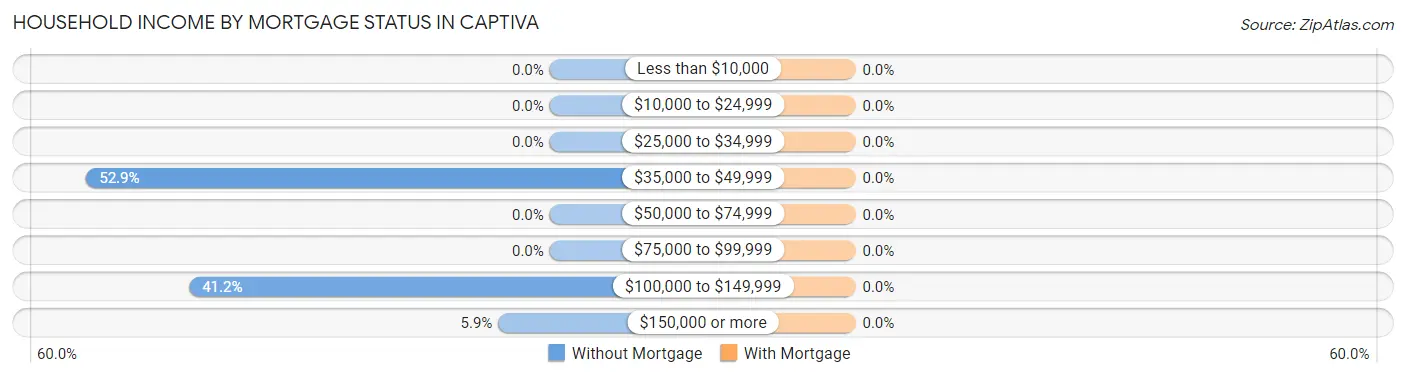
| Household Income | Without Mortgage | With Mortgage |
| Less than $10,000 | 0 (0.0%) | 0 (0.0%) |
| $10,000 to $24,999 | 0 (0.0%) | 0 (0.0%) |
| $25,000 to $34,999 | 0 (0.0%) | 0 (0.0%) |
| $35,000 to $49,999 | 9 (52.9%) | 0 (0.0%) |
| $50,000 to $74,999 | 0 (0.0%) | 0 (0.0%) |
| $75,000 to $99,999 | 0 (0.0%) | 0 (0.0%) |
| $100,000 to $149,999 | 7 (41.2%) | 0 (0.0%) |
| $150,000 or more | 1 (5.9%) | 0 (0.0%) |
| Total | 17 (100.0%) | 13 (100.0%) |
Property Value to Household Income Ratio in Captiva
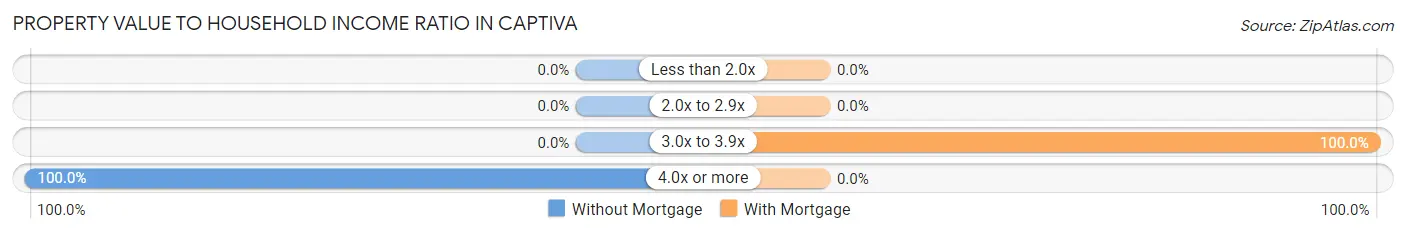
| Value-to-Income Ratio | Without Mortgage | With Mortgage |
| Less than 2.0x | 0 (0.0%) | 0 (0.0%) |
| 2.0x to 2.9x | 0 (0.0%) | 0 (0.0%) |
| 3.0x to 3.9x | 0 (0.0%) | 13 (100.0%) |
| 4.0x or more | 17 (100.0%) | 0 (0.0%) |
| Total | 17 (100.0%) | 13 (100.0%) |
Real Estate Taxes by Mortgage Status in Captiva
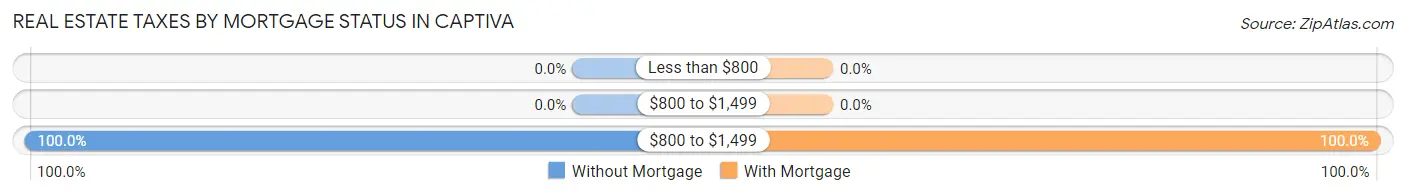
| Property Taxes | Without Mortgage | With Mortgage |
| Less than $800 | 0 (0.0%) | 0 (0.0%) |
| $800 to $1,499 | 0 (0.0%) | 0 (0.0%) |
| $800 to $1,499 | 17 (100.0%) | 13 (100.0%) |
| Total | 17 (100.0%) | 13 (100.0%) |
Health & Disability in Captiva
Health Insurance Coverage by Age in Captiva
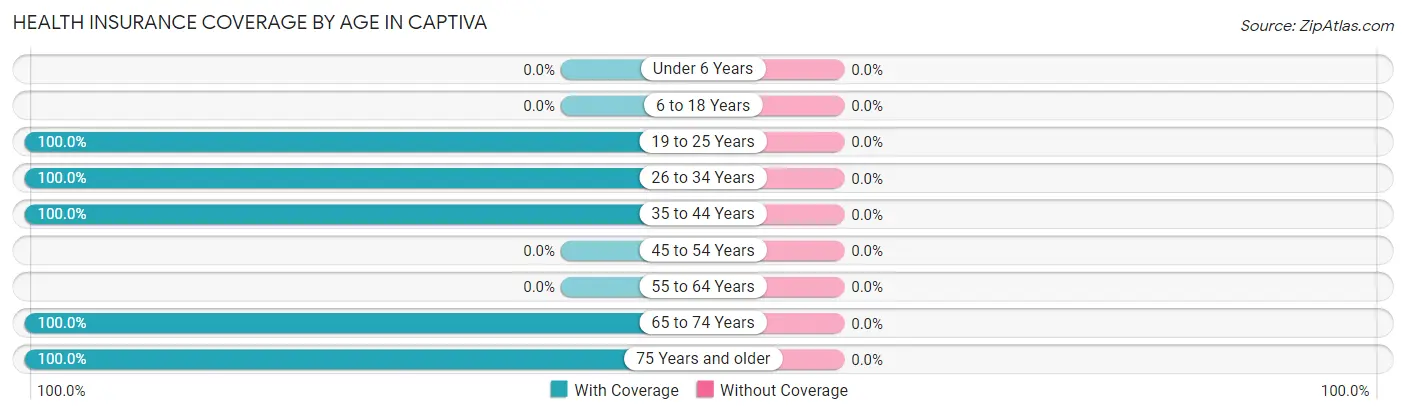
| Age Bracket | With Coverage | Without Coverage |
| Under 6 Years | 0 (0.0%) | 0 (0.0%) |
| 6 to 18 Years | 0 (0.0%) | 0 (0.0%) |
| 19 to 25 Years | 48 (100.0%) | 0 (0.0%) |
| 26 to 34 Years | 15 (100.0%) | 0 (0.0%) |
| 35 to 44 Years | 40 (100.0%) | 0 (0.0%) |
| 45 to 54 Years | 0 (0.0%) | 0 (0.0%) |
| 55 to 64 Years | 0 (0.0%) | 0 (0.0%) |
| 65 to 74 Years | 39 (100.0%) | 0 (0.0%) |
| 75 Years and older | 9 (100.0%) | 0 (0.0%) |
| Total | 151 (100.0%) | 0 (0.0%) |
Health Insurance Coverage by Citizenship Status in Captiva
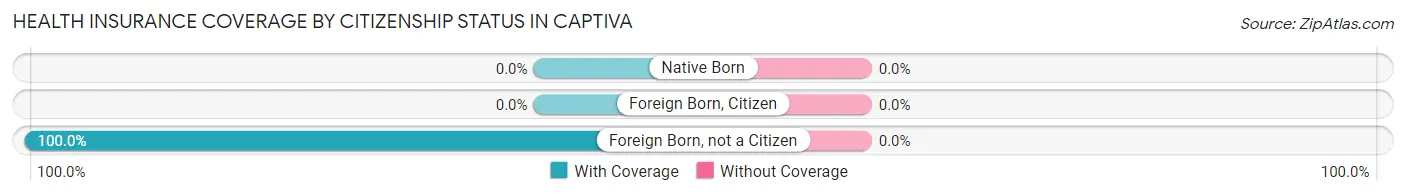
| Citizenship Status | With Coverage | Without Coverage |
| Native Born | 0 (0.0%) | 0 (0.0%) |
| Foreign Born, Citizen | 0 (0.0%) | 0 (0.0%) |
| Foreign Born, not a Citizen | 48 (100.0%) | 0 (0.0%) |
Health Insurance Coverage by Household Income in Captiva
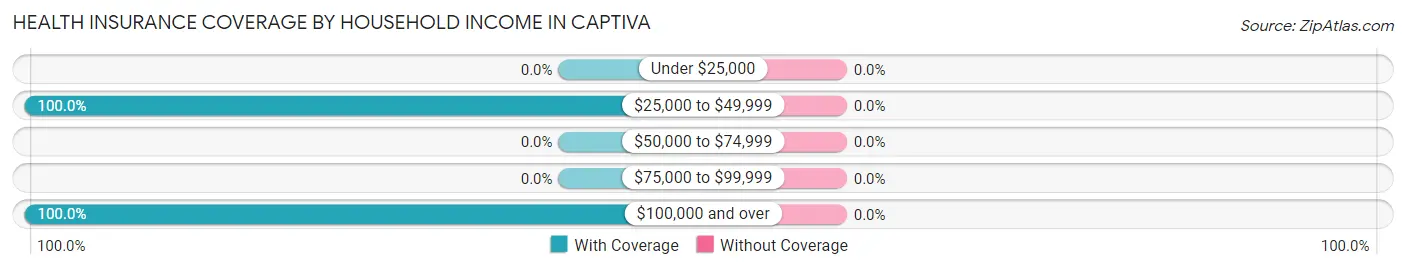
| Household Income | With Coverage | Without Coverage |
| Under $25,000 | 0 (0.0%) | 0 (0.0%) |
| $25,000 to $49,999 | 16 (100.0%) | 0 (0.0%) |
| $50,000 to $74,999 | 0 (0.0%) | 0 (0.0%) |
| $75,000 to $99,999 | 0 (0.0%) | 0 (0.0%) |
| $100,000 and over | 39 (100.0%) | 0 (0.0%) |
Public vs Private Health Insurance Coverage by Age in Captiva
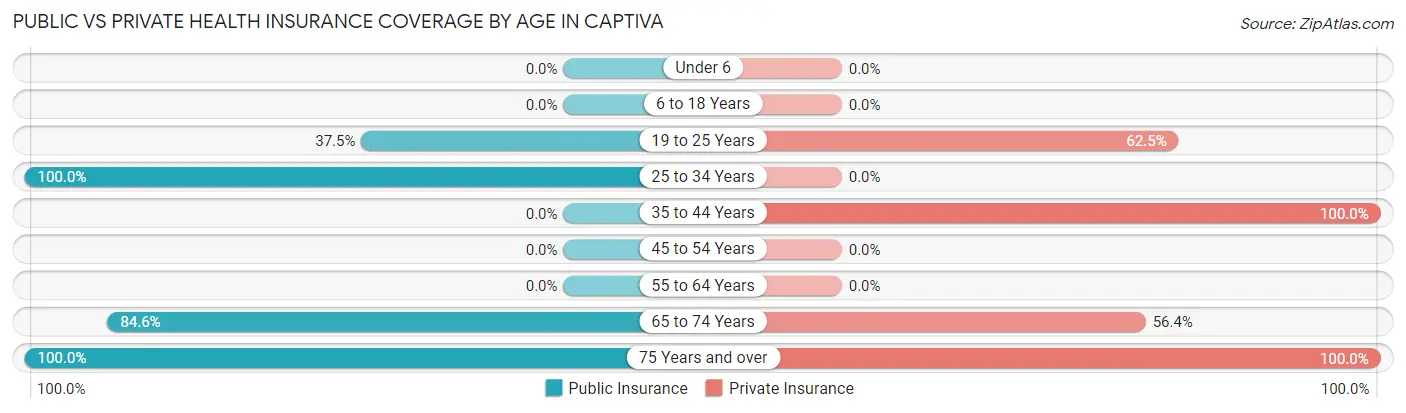
| Age Bracket | Public Insurance | Private Insurance |
| Under 6 | 0 (0.0%) | 0 (0.0%) |
| 6 to 18 Years | 0 (0.0%) | 0 (0.0%) |
| 19 to 25 Years | 18 (37.5%) | 30 (62.5%) |
| 25 to 34 Years | 15 (100.0%) | 0 (0.0%) |
| 35 to 44 Years | 0 (0.0%) | 40 (100.0%) |
| 45 to 54 Years | 0 (0.0%) | 0 (0.0%) |
| 55 to 64 Years | 0 (0.0%) | 0 (0.0%) |
| 65 to 74 Years | 33 (84.6%) | 22 (56.4%) |
| 75 Years and over | 9 (100.0%) | 9 (100.0%) |
| Total | 75 (49.7%) | 101 (66.9%) |
Disability Status by Sex by Age in Captiva
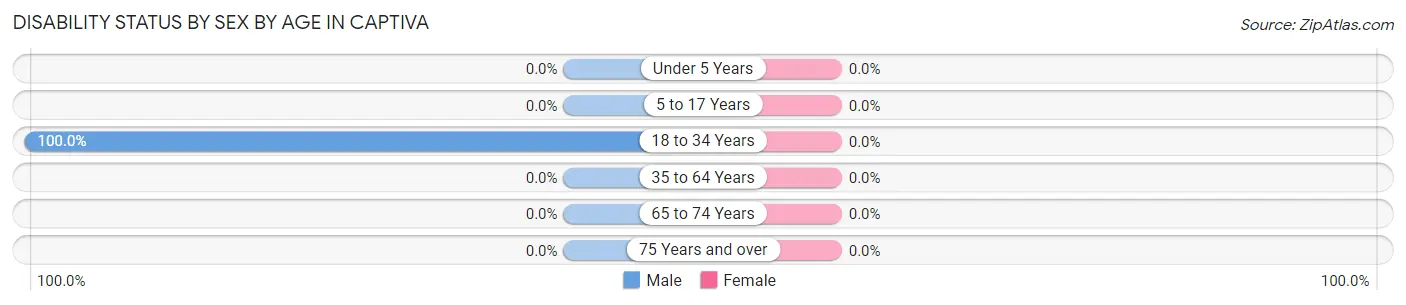
| Age Bracket | Male | Female |
| Under 5 Years | 0 (0.0%) | 0 (0.0%) |
| 5 to 17 Years | 0 (0.0%) | 0 (0.0%) |
| 18 to 34 Years | 18 (100.0%) | 0 (0.0%) |
| 35 to 64 Years | 0 (0.0%) | 0 (0.0%) |
| 65 to 74 Years | 0 (0.0%) | 0 (0.0%) |
| 75 Years and over | 0 (0.0%) | 0 (0.0%) |
Disability Class by Sex by Age in Captiva
Disability Class: Hearing Difficulty
| Age Bracket | Male | Female |
| Under 5 Years | 0 (0.0%) | 0 (0.0%) |
| 5 to 17 Years | 0 (0.0%) | 0 (0.0%) |
| 18 to 34 Years | 0 (0.0%) | 0 (0.0%) |
| 35 to 64 Years | 0 (0.0%) | 0 (0.0%) |
| 65 to 74 Years | 0 (0.0%) | 0 (0.0%) |
| 75 Years and over | 0 (0.0%) | 0 (0.0%) |
Disability Class: Vision Difficulty
| Age Bracket | Male | Female |
| Under 5 Years | 0 (0.0%) | 0 (0.0%) |
| 5 to 17 Years | 0 (0.0%) | 0 (0.0%) |
| 18 to 34 Years | 0 (0.0%) | 0 (0.0%) |
| 35 to 64 Years | 0 (0.0%) | 0 (0.0%) |
| 65 to 74 Years | 0 (0.0%) | 0 (0.0%) |
| 75 Years and over | 0 (0.0%) | 0 (0.0%) |
Disability Class: Cognitive Difficulty
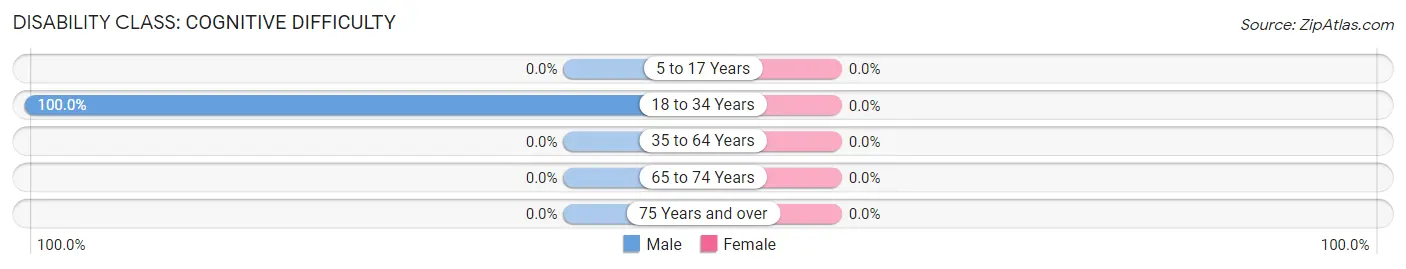
| Age Bracket | Male | Female |
| 5 to 17 Years | 0 (0.0%) | 0 (0.0%) |
| 18 to 34 Years | 18 (100.0%) | 0 (0.0%) |
| 35 to 64 Years | 0 (0.0%) | 0 (0.0%) |
| 65 to 74 Years | 0 (0.0%) | 0 (0.0%) |
| 75 Years and over | 0 (0.0%) | 0 (0.0%) |
Disability Class: Ambulatory Difficulty
| Age Bracket | Male | Female |
| 5 to 17 Years | 0 (0.0%) | 0 (0.0%) |
| 18 to 34 Years | 0 (0.0%) | 0 (0.0%) |
| 35 to 64 Years | 0 (0.0%) | 0 (0.0%) |
| 65 to 74 Years | 0 (0.0%) | 0 (0.0%) |
| 75 Years and over | 0 (0.0%) | 0 (0.0%) |
Disability Class: Self-Care Difficulty
| Age Bracket | Male | Female |
| 5 to 17 Years | 0 (0.0%) | 0 (0.0%) |
| 18 to 34 Years | 0 (0.0%) | 0 (0.0%) |
| 35 to 64 Years | 0 (0.0%) | 0 (0.0%) |
| 65 to 74 Years | 0 (0.0%) | 0 (0.0%) |
| 75 Years and over | 0 (0.0%) | 0 (0.0%) |
Technology Access in Captiva
Computing Device Access in Captiva
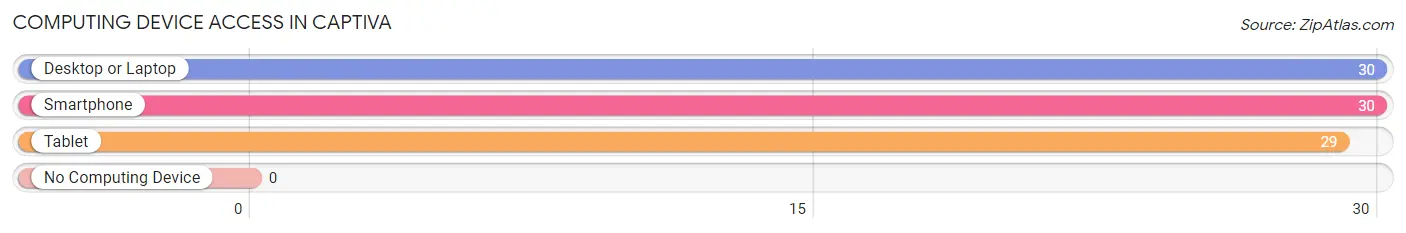
| Device Type | # Households | % Households |
| Desktop or Laptop | 30 | 100.0% |
| Smartphone | 30 | 100.0% |
| Tablet | 29 | 96.7% |
| No Computing Device | 0 | 0.0% |
| Total | 30 | 100.0% |
Internet Access in Captiva
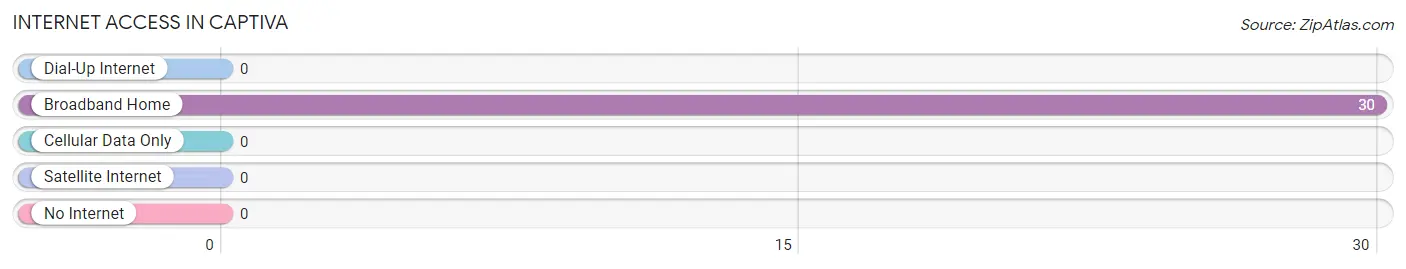
| Internet Type | # Households | % Households |
| Dial-Up Internet | 0 | 0.0% |
| Broadband Home | 30 | 100.0% |
| Cellular Data Only | 0 | 0.0% |
| Satellite Internet | 0 | 0.0% |
| No Internet | 0 | 0.0% |
| Total | 30 | 100.0% |
Captiva Summary
Captiva, Florida is a small island located off the coast of Southwest Florida in Lee County. It is part of the barrier islands that make up the Lee Island Chain, which includes Sanibel, Captiva, North Captiva, and Cayo Costa. Captiva is a popular tourist destination, known for its white sand beaches, lush vegetation, and wildlife.
History
Captiva Island was first inhabited by the Calusa Indians, who lived in the area for centuries before the arrival of Europeans. The island was first visited by Spanish explorers in the 16th century, who named it “Captiva” after the Spanish word for “captive”. The island was later used as a hideout by pirates, who used it as a base for their operations.
In the late 19th century, Captiva was purchased by a group of investors from Michigan, who developed the island into a resort destination. The island was connected to the mainland by a bridge in the early 20th century, and the first hotel was built in 1921. The island was later developed into a residential community, and today it is a popular tourist destination.
Geography
Captiva Island is located off the coast of Southwest Florida in Lee County. It is part of the barrier islands that make up the Lee Island Chain, which includes Sanibel, Captiva, North Captiva, and Cayo Costa. The island is approximately 5 miles long and 1 mile wide, and is connected to the mainland by a bridge. The island is surrounded by the Gulf of Mexico to the west and Pine Island Sound to the east.
The island is home to a variety of wildlife, including dolphins, manatees, sea turtles, and a variety of birds. The island is also home to a variety of vegetation, including mangroves, palm trees, and sea oats.
Economy
Captiva Island’s economy is largely based on tourism. The island is home to a variety of resorts, restaurants, and shops, as well as a variety of recreational activities, such as fishing, boating, and swimming. The island is also home to a number of art galleries and museums.
Demographics
As of the 2010 census, the population of Captiva Island was 583. The median age of the population was 57.7 years, and the median household income was $77,917. The majority of the population (90.2%) was white, and the remainder was made up of African Americans (3.2%), Asians (2.2%), and other races (4.4%). The majority of the population (90.2%) was born in the United States, and the remainder was born in other countries (9.8%).
Conclusion
Captiva Island is a small island located off the coast of Southwest Florida in Lee County. It is part of the barrier islands that make up the Lee Island Chain, and is a popular tourist destination. The island’s economy is largely based on tourism, and the population is mostly white. Captiva Island is home to a variety of wildlife and vegetation, and is a popular destination for fishing, boating, and swimming.
Common Questions
What is Per Capita Income in Captiva?
Per Capita income in Captiva is $31,614.
What is Inequality or Gini Index in Captiva?
Inequality or Gini Index in Captiva is 0.26.
What is the Total Population of Captiva?
Total Population of Captiva is 151.
What is the Total Male Population of Captiva?
Total Male Population of Captiva is 64.
What is the Total Female Population of Captiva?
Total Female Population of Captiva is 87.
What is the Ratio of Males per 100 Females in Captiva?
There are 73.56 Males per 100 Females in Captiva.
What is the Ratio of Females per 100 Males in Captiva?
There are 135.94 Females per 100 Males in Captiva.
What is the Median Population Age in Captiva?
Median Population Age in Captiva is 37.1 Years.
What is the Average Family Size in Captiva
Average Family Size in Captiva is 1.8 People.
What is the Average Household Size in Captiva
Average Household Size in Captiva is 1.8 People.
How Large is the Labor Force in Captiva?
There are 56 People in the Labor Forcein in Captiva.
What is the Percentage of People in the Labor Force in Captiva?
37.1% of People are in the Labor Force in Captiva.