West Nyack, NY Map & Demographics
West Nyack Map
West Nyack Overview
$66,199
PER CAPITA INCOME
$181,250
AVG FAMILY INCOME
$160,020
AVG HOUSEHOLD INCOME
41.1%
WAGE / INCOME GAP [ % ]
58.9¢/ $1
WAGE / INCOME GAP [ $ ]
0.41
INEQUALITY / GINI INDEX
3,768
TOTAL POPULATION
1,697
MALE POPULATION
2,071
FEMALE POPULATION
81.94
MALES / 100 FEMALES
122.04
FEMALES / 100 MALES
48.4
MEDIAN AGE
3.4
AVG FAMILY SIZE
2.8
AVG HOUSEHOLD SIZE
1,648
LABOR FORCE [ PEOPLE ]
52.7%
PERCENT IN LABOR FORCE
3.2%
UNEMPLOYMENT RATE
West Nyack Zip Codes
West Nyack Area Codes
Income in West Nyack
Income Overview in West Nyack
Per Capita Income in West Nyack is $66,199, while median incomes of families and households are $181,250 and $160,020 respectively.
| Characteristic | Number | Measure |
| Per Capita Income | 3,768 | $66,199 |
| Median Family Income | 968 | $181,250 |
| Mean Family Income | 968 | $220,671 |
| Median Household Income | 1,349 | $160,020 |
| Mean Household Income | 1,349 | $181,788 |
| Income Deficit | 968 | $0 |
| Wage / Income Gap (%) | 3,768 | 41.08% |
| Wage / Income Gap ($) | 3,768 | 58.92¢ per $1 |
| Gini / Inequality Index | 3,768 | 0.41 |
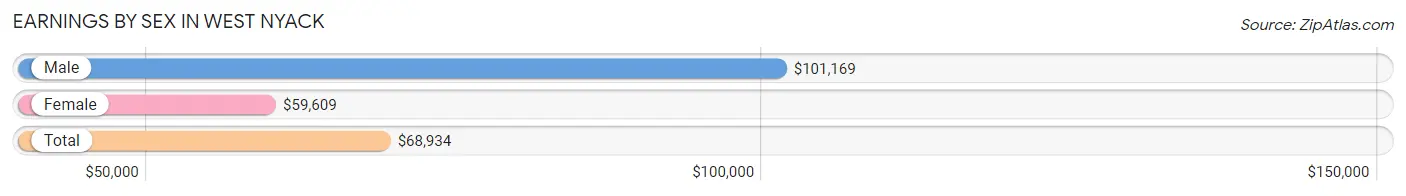
Earnings by Sex in West Nyack
Average Earnings in West Nyack are $68,934, $101,169 for men and $59,609 for women, a difference of 41.1%.
| Sex | Number | Average Earnings |
| Male | 794 (48.9%) | $101,169 |
| Female | 831 (51.1%) | $59,609 |
| Total | 1,625 (100.0%) | $68,934 |
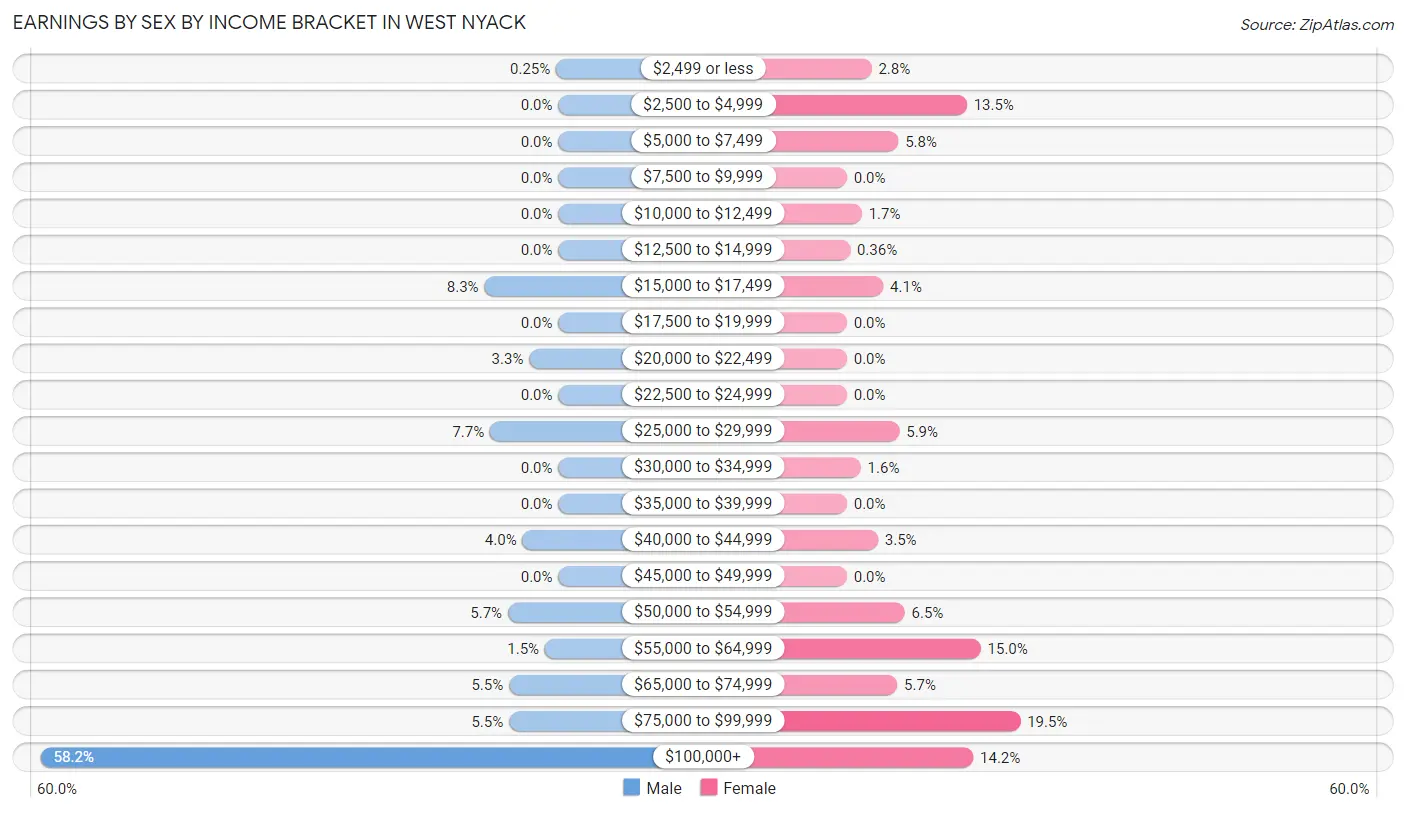
Earnings by Sex by Income Bracket in West Nyack
The most common earnings brackets in West Nyack are $100,000+ for men (462 | 58.2%) and $75,000 to $99,999 for women (162 | 19.5%).
| Income | Male | Female |
| $2,499 or less | 2 (0.3%) | 23 (2.8%) |
| $2,500 to $4,999 | 0 (0.0%) | 112 (13.5%) |
| $5,000 to $7,499 | 0 (0.0%) | 48 (5.8%) |
| $7,500 to $9,999 | 0 (0.0%) | 0 (0.0%) |
| $10,000 to $12,499 | 0 (0.0%) | 14 (1.7%) |
| $12,500 to $14,999 | 0 (0.0%) | 3 (0.4%) |
| $15,000 to $17,499 | 66 (8.3%) | 34 (4.1%) |
| $17,500 to $19,999 | 0 (0.0%) | 0 (0.0%) |
| $20,000 to $22,499 | 26 (3.3%) | 0 (0.0%) |
| $22,500 to $24,999 | 0 (0.0%) | 0 (0.0%) |
| $25,000 to $29,999 | 61 (7.7%) | 49 (5.9%) |
| $30,000 to $34,999 | 0 (0.0%) | 13 (1.6%) |
| $35,000 to $39,999 | 0 (0.0%) | 0 (0.0%) |
| $40,000 to $44,999 | 32 (4.0%) | 29 (3.5%) |
| $45,000 to $49,999 | 0 (0.0%) | 0 (0.0%) |
| $50,000 to $54,999 | 45 (5.7%) | 54 (6.5%) |
| $55,000 to $64,999 | 12 (1.5%) | 125 (15.0%) |
| $65,000 to $74,999 | 44 (5.5%) | 47 (5.7%) |
| $75,000 to $99,999 | 44 (5.5%) | 162 (19.5%) |
| $100,000+ | 462 (58.2%) | 118 (14.2%) |
| Total | 794 (100.0%) | 831 (100.0%) |
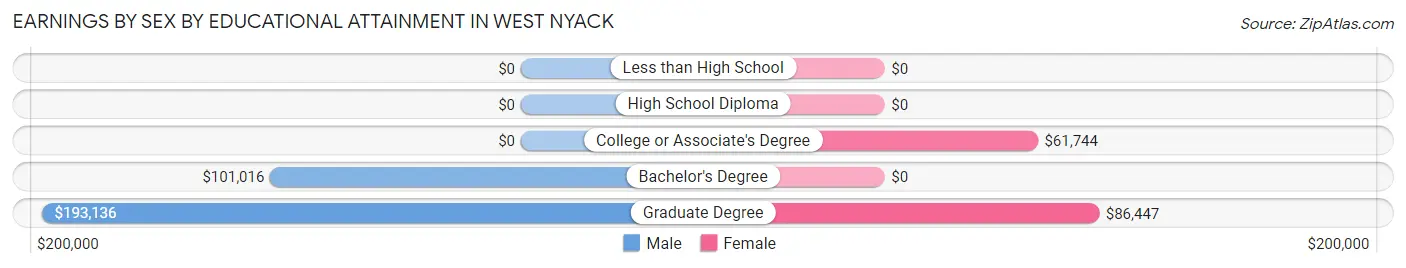
Earnings by Sex by Educational Attainment in West Nyack
Average earnings in West Nyack are $101,879 for men and $66,827 for women, a difference of 34.4%. Men with an educational attainment of graduate degree enjoy the highest average annual earnings of $193,136, while those with bachelor's degree education earn the least with $101,016. Women with an educational attainment of graduate degree earn the most with the average annual earnings of $86,447, while those with college or associate's degree education have the smallest earnings of $61,744.
| Educational Attainment | Male Income | Female Income |
| Less than High School | - | - |
| High School Diploma | - | - |
| College or Associate's Degree | - | - |
| Bachelor's Degree | $101,016 | $0 |
| Graduate Degree | $193,136 | $86,447 |
| Total | $101,879 | $66,827 |
Family Income in West Nyack
Family Income Brackets in West Nyack
According to the West Nyack family income data, there are 437 families falling into the $200,000+ income range, which is the most common income bracket and makes up 45.1% of all families.
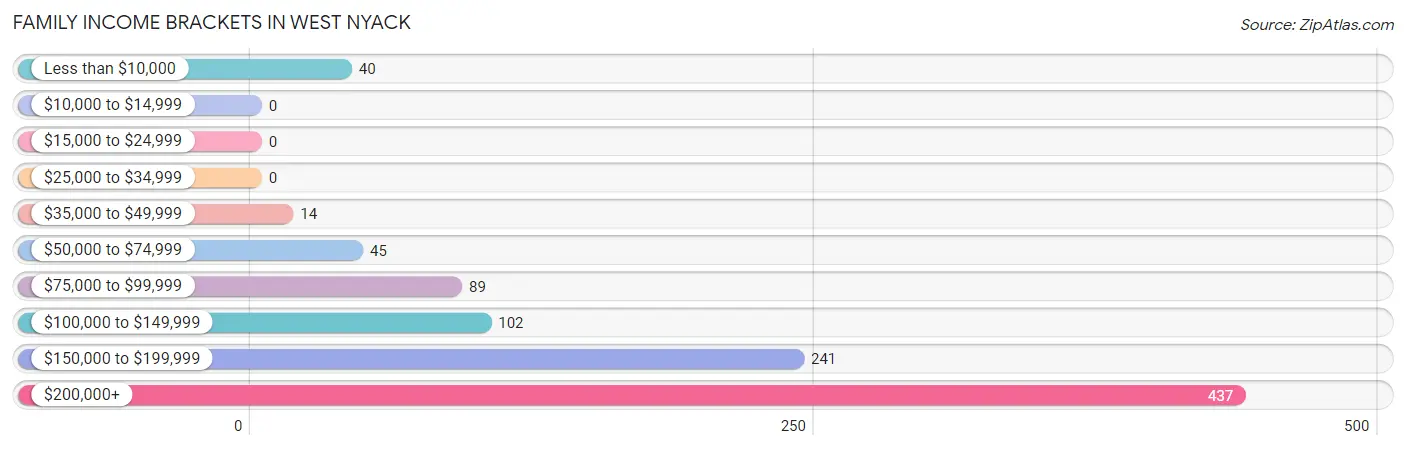
| Income Bracket | # Families | % Families |
| Less than $10,000 | 40 | 4.1% |
| $10,000 to $14,999 | 0 | 0.0% |
| $15,000 to $24,999 | 0 | 0.0% |
| $25,000 to $34,999 | 0 | 0.0% |
| $35,000 to $49,999 | 14 | 1.4% |
| $50,000 to $74,999 | 45 | 4.6% |
| $75,000 to $99,999 | 89 | 9.2% |
| $100,000 to $149,999 | 102 | 10.5% |
| $150,000 to $199,999 | 241 | 24.9% |
| $200,000+ | 437 | 45.1% |
Family Income by Famaliy Size in West Nyack
2-person families (333 | 34.4%) account for the highest median family income in West Nyack with $250,001 per family, while 2-person families (333 | 34.4%) have the highest median income of $125,000 per family member.
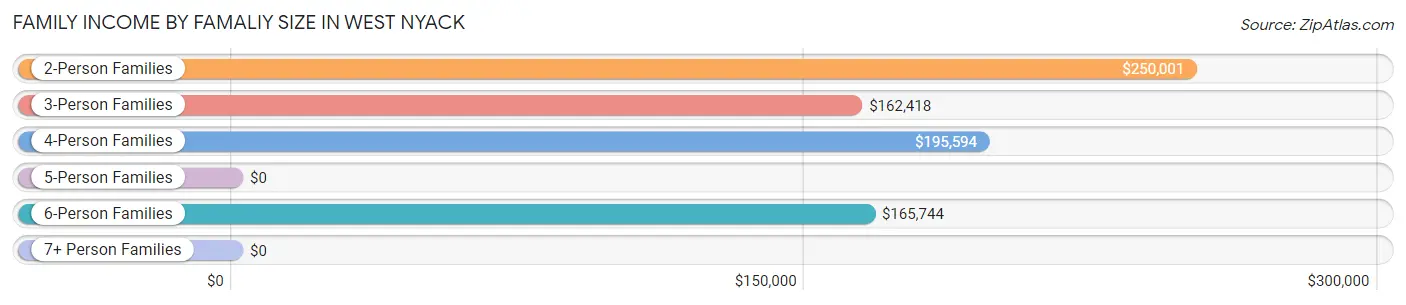
| Income Bracket | # Families | Median Income |
| 2-Person Families | 333 (34.4%) | $250,001 |
| 3-Person Families | 244 (25.2%) | $162,418 |
| 4-Person Families | 219 (22.6%) | $195,594 |
| 5-Person Families | 15 (1.5%) | $0 |
| 6-Person Families | 157 (16.2%) | $165,744 |
| 7+ Person Families | 0 (0.0%) | $0 |
| Total | 968 (100.0%) | $181,250 |
Family Income by Number of Earners in West Nyack
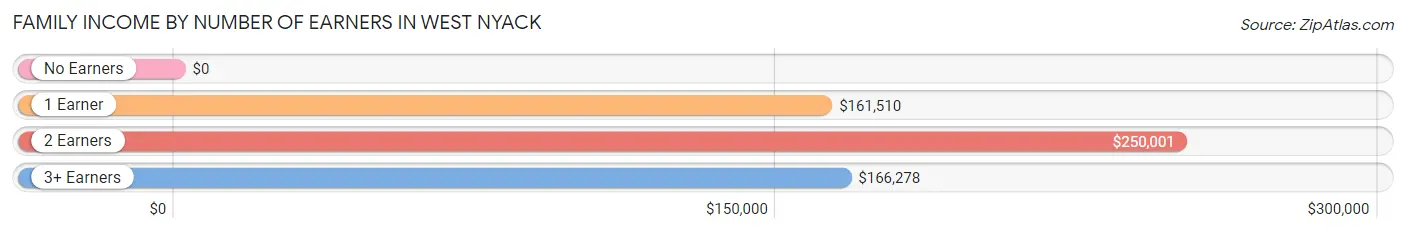
| Number of Earners | # Families | Median Income |
| No Earners | 152 (15.7%) | $0 |
| 1 Earner | 345 (35.6%) | $161,510 |
| 2 Earners | 242 (25.0%) | $250,001 |
| 3+ Earners | 229 (23.7%) | $166,278 |
| Total | 968 (100.0%) | $181,250 |
Household Income in West Nyack
Household Income Brackets in West Nyack
With 437 households falling in the category, the $200,000+ income range is the most frequent in West Nyack, accounting for 32.4% of all households.
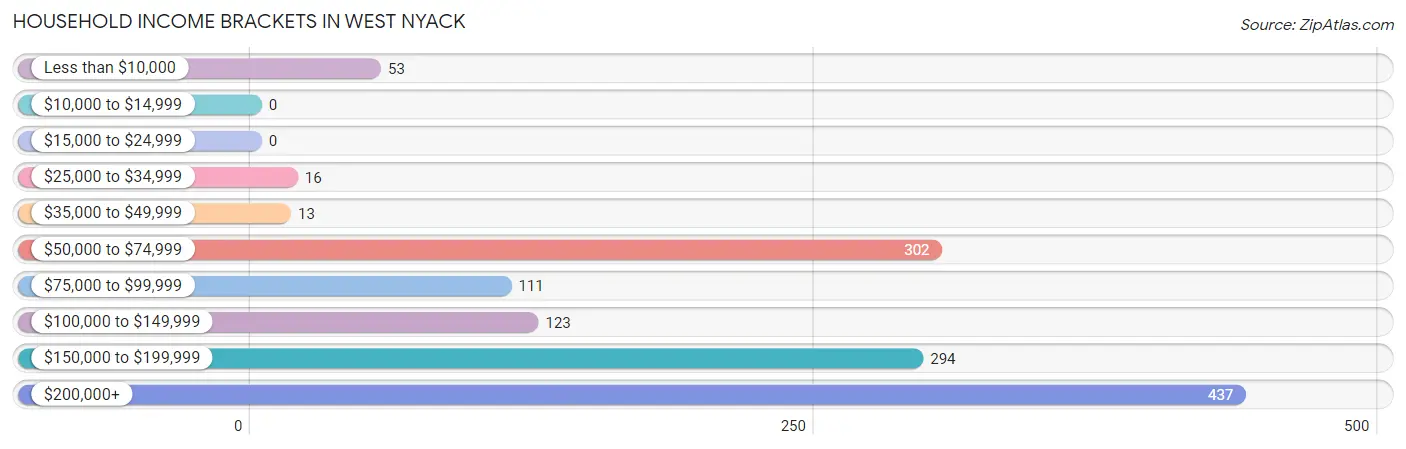
| Income Bracket | # Households | % Households |
| Less than $10,000 | 53 | 3.9% |
| $10,000 to $14,999 | 0 | 0.0% |
| $15,000 to $24,999 | 0 | 0.0% |
| $25,000 to $34,999 | 16 | 1.2% |
| $35,000 to $49,999 | 13 | 1.0% |
| $50,000 to $74,999 | 302 | 22.4% |
| $75,000 to $99,999 | 111 | 8.2% |
| $100,000 to $149,999 | 123 | 9.1% |
| $150,000 to $199,999 | 294 | 21.8% |
| $200,000+ | 437 | 32.4% |
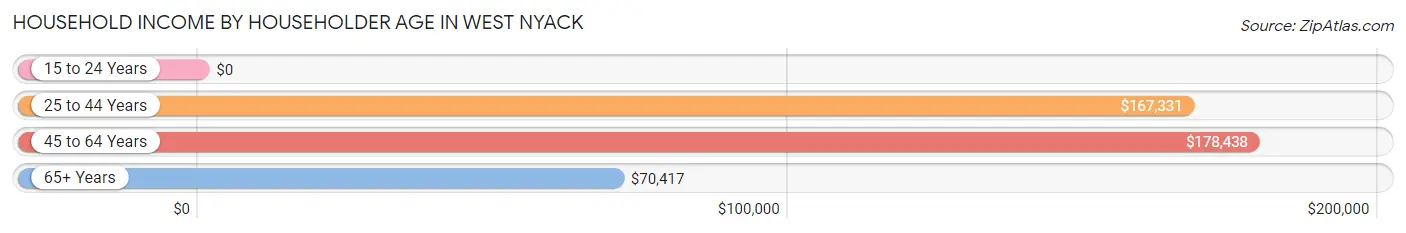
Household Income by Householder Age in West Nyack
The median household income in West Nyack is $160,020, with the highest median household income of $178,438 found in the 45 to 64 years age bracket for the primary householder. A total of 571 households (42.3%) fall into this category.
| Income Bracket | # Households | Median Income |
| 15 to 24 Years | 0 (0.0%) | $0 |
| 25 to 44 Years | 180 (13.3%) | $167,331 |
| 45 to 64 Years | 571 (42.3%) | $178,438 |
| 65+ Years | 598 (44.3%) | $70,417 |
| Total | 1,349 (100.0%) | $160,020 |
Poverty in West Nyack
Income Below Poverty by Sex and Age in West Nyack
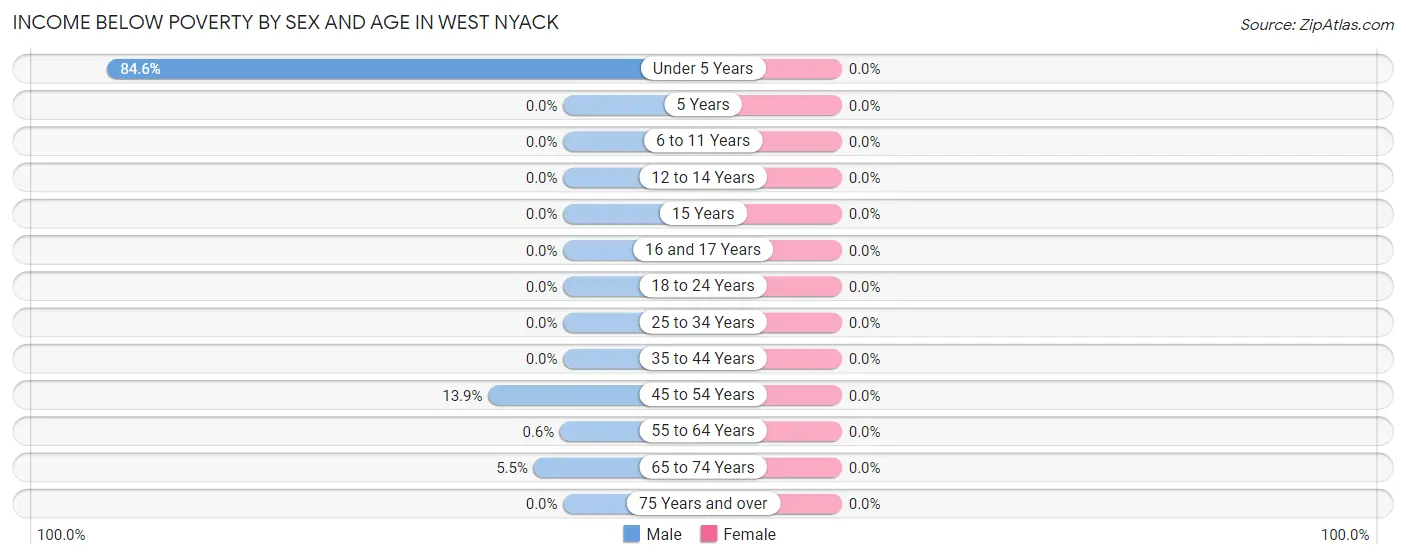
| Age Bracket | Male | Female |
| Under 5 Years | 44 (84.6%) | 0 (0.0%) |
| 5 Years | 0 (0.0%) | 0 (0.0%) |
| 6 to 11 Years | 0 (0.0%) | 0 (0.0%) |
| 12 to 14 Years | 0 (0.0%) | 0 (0.0%) |
| 15 Years | 0 (0.0%) | 0 (0.0%) |
| 16 and 17 Years | 0 (0.0%) | 0 (0.0%) |
| 18 to 24 Years | 0 (0.0%) | 0 (0.0%) |
| 25 to 34 Years | 0 (0.0%) | 0 (0.0%) |
| 35 to 44 Years | 0 (0.0%) | 0 (0.0%) |
| 45 to 54 Years | 45 (13.9%) | 0 (0.0%) |
| 55 to 64 Years | 2 (0.6%) | 0 (0.0%) |
| 65 to 74 Years | 12 (5.5%) | 0 (0.0%) |
| 75 Years and over | 0 (0.0%) | 0 (0.0%) |
| Total | 103 (6.1%) | 0 (0.0%) |
Income Above Poverty by Sex and Age in West Nyack
According to the poverty statistics in West Nyack, males aged 5 years and females aged under 5 years are the age groups that are most secure financially, with 100.0% of males and 100.0% of females in these age groups living above the poverty line.
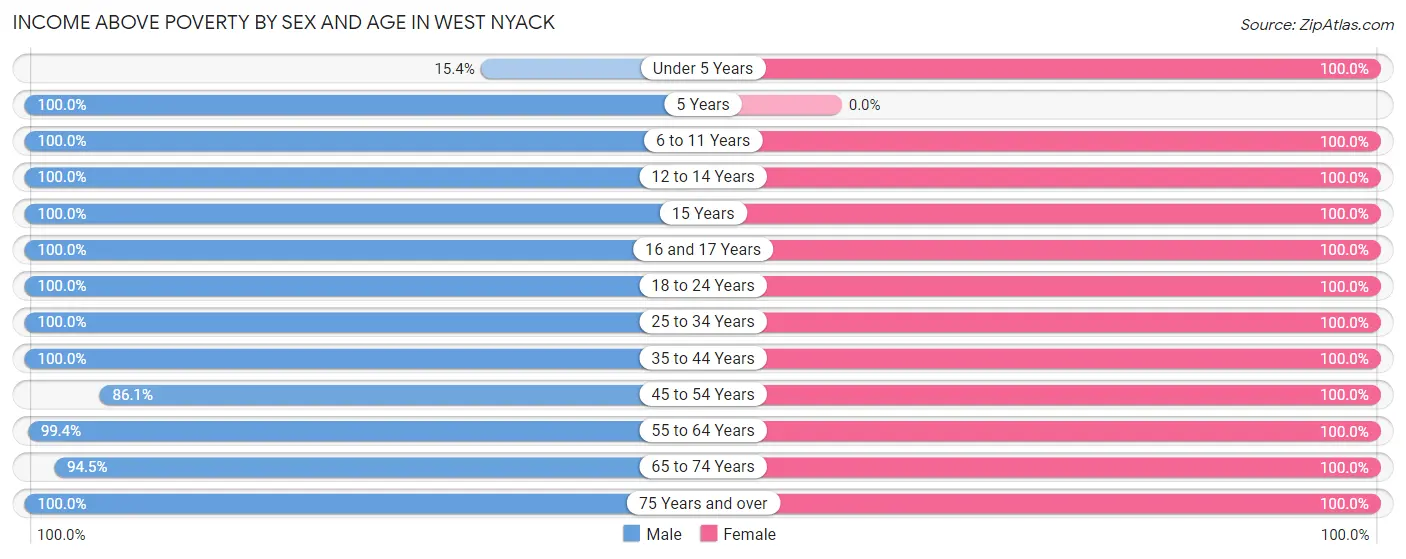
| Age Bracket | Male | Female |
| Under 5 Years | 8 (15.4%) | 200 (100.0%) |
| 5 Years | 46 (100.0%) | 0 (0.0%) |
| 6 to 11 Years | 54 (100.0%) | 140 (100.0%) |
| 12 to 14 Years | 6 (100.0%) | 40 (100.0%) |
| 15 Years | 57 (100.0%) | 45 (100.0%) |
| 16 and 17 Years | 47 (100.0%) | 236 (100.0%) |
| 18 to 24 Years | 215 (100.0%) | 26 (100.0%) |
| 25 to 34 Years | 77 (100.0%) | 130 (100.0%) |
| 35 to 44 Years | 120 (100.0%) | 217 (100.0%) |
| 45 to 54 Years | 278 (86.1%) | 236 (100.0%) |
| 55 to 64 Years | 331 (99.4%) | 275 (100.0%) |
| 65 to 74 Years | 207 (94.5%) | 369 (100.0%) |
| 75 Years and over | 148 (100.0%) | 157 (100.0%) |
| Total | 1,594 (93.9%) | 2,071 (100.0%) |
Income Below Poverty Among Married-Couple Families in West Nyack
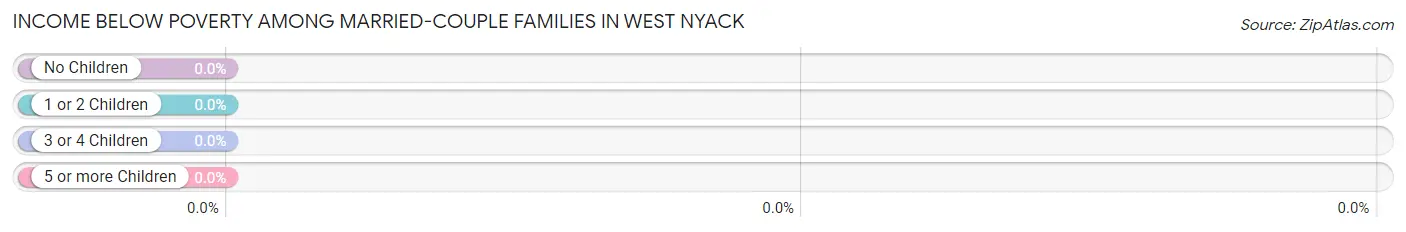
| Children | Above Poverty | Below Poverty |
| No Children | 420 (100.0%) | 0 (0.0%) |
| 1 or 2 Children | 292 (100.0%) | 0 (0.0%) |
| 3 or 4 Children | 106 (100.0%) | 0 (0.0%) |
| 5 or more Children | 0 (0.0%) | 0 (0.0%) |
| Total | 818 (100.0%) | 0 (0.0%) |
Income Below Poverty Among Single-Parent Households in West Nyack
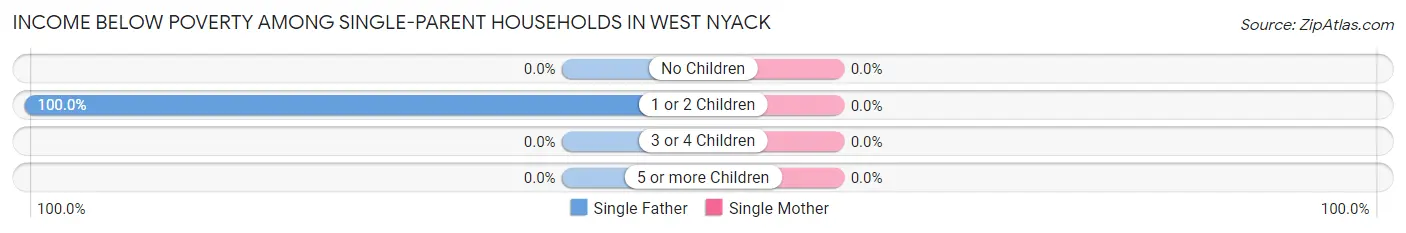
| Children | Single Father | Single Mother |
| No Children | 0 (0.0%) | 0 (0.0%) |
| 1 or 2 Children | 40 (100.0%) | 0 (0.0%) |
| 3 or 4 Children | 0 (0.0%) | 0 (0.0%) |
| 5 or more Children | 0 (0.0%) | 0 (0.0%) |
| Total | 40 (29.0%) | 0 (0.0%) |
Income Below Poverty Among Married-Couple vs Single-Parent Households in West Nyack
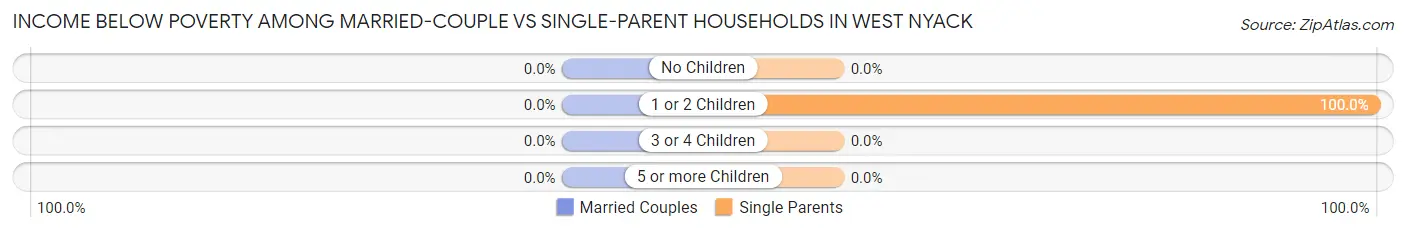
| Children | Married-Couple Families | Single-Parent Households |
| No Children | 0 (0.0%) | 0 (0.0%) |
| 1 or 2 Children | 0 (0.0%) | 40 (100.0%) |
| 3 or 4 Children | 0 (0.0%) | 0 (0.0%) |
| 5 or more Children | 0 (0.0%) | 0 (0.0%) |
| Total | 0 (0.0%) | 40 (26.7%) |
Race in West Nyack
The most populous races in West Nyack are White / Caucasian (2,341 | 62.1%), Hispanic or Latino (918 | 24.4%), and Black / African American (573 | 15.2%).
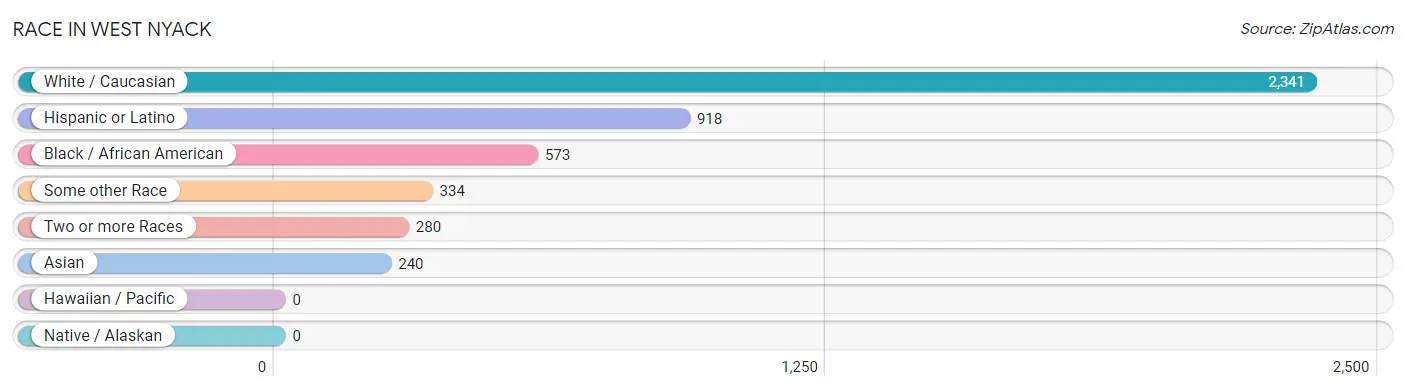
| Race | # Population | % Population |
| Asian | 240 | 6.4% |
| Black / African American | 573 | 15.2% |
| Hawaiian / Pacific | 0 | 0.0% |
| Hispanic or Latino | 918 | 24.4% |
| Native / Alaskan | 0 | 0.0% |
| White / Caucasian | 2,341 | 62.1% |
| Two or more Races | 280 | 7.4% |
| Some other Race | 334 | 8.9% |
| Total | 3,768 | 100.0% |
Ancestry in West Nyack
The most populous ancestries reported in West Nyack are Irish (687 | 18.2%), Italian (536 | 14.2%), South American (368 | 9.8%), German (339 | 9.0%), and Puerto Rican (268 | 7.1%), together accounting for 58.3% of all West Nyack residents.
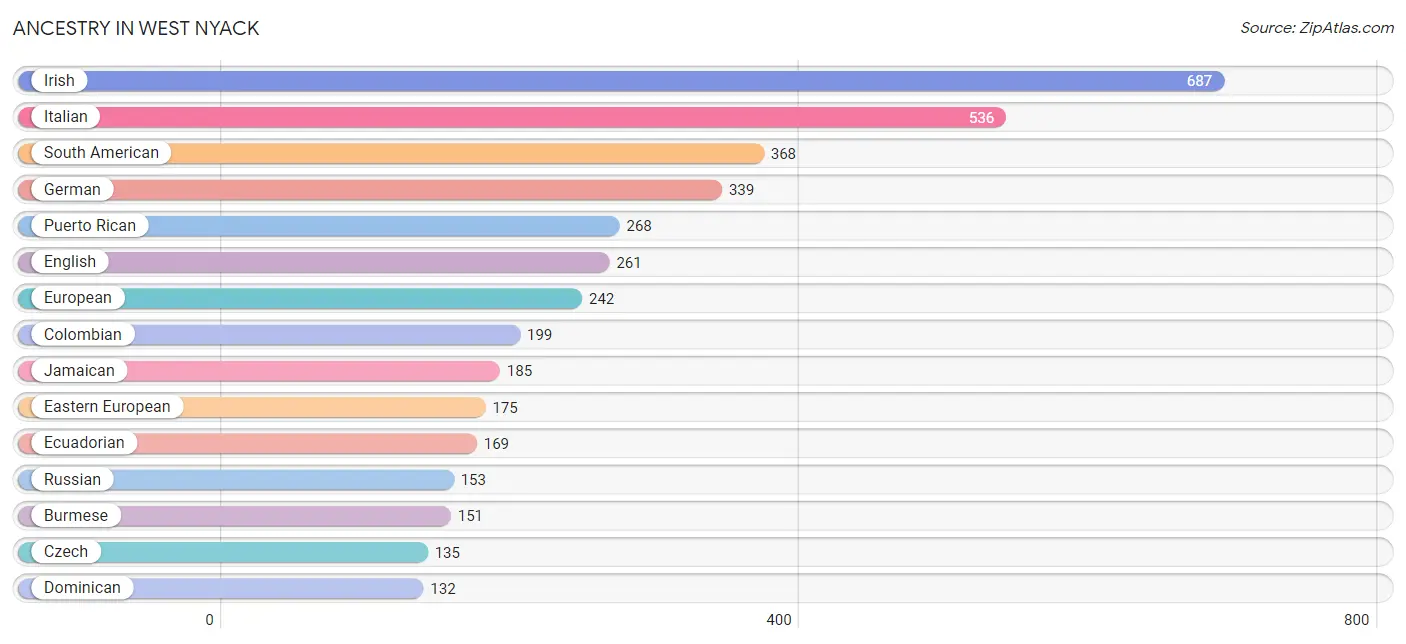
| Ancestry | # Population | % Population |
| American | 86 | 2.3% |
| Austrian | 17 | 0.4% |
| Belgian | 61 | 1.6% |
| Burmese | 151 | 4.0% |
| Colombian | 199 | 5.3% |
| Czech | 135 | 3.6% |
| Czechoslovakian | 38 | 1.0% |
| Dominican | 132 | 3.5% |
| Dutch | 12 | 0.3% |
| Eastern European | 175 | 4.6% |
| Ecuadorian | 169 | 4.5% |
| English | 261 | 6.9% |
| European | 242 | 6.4% |
| French | 49 | 1.3% |
| German | 339 | 9.0% |
| Hungarian | 15 | 0.4% |
| Irish | 687 | 18.2% |
| Israeli | 12 | 0.3% |
| Italian | 536 | 14.2% |
| Jamaican | 185 | 4.9% |
| Korean | 40 | 1.1% |
| Lithuanian | 46 | 1.2% |
| Mexican | 20 | 0.5% |
| Nigerian | 14 | 0.4% |
| Norwegian | 12 | 0.3% |
| Polish | 56 | 1.5% |
| Puerto Rican | 268 | 7.1% |
| Romanian | 12 | 0.3% |
| Russian | 153 | 4.1% |
| Scotch-Irish | 15 | 0.4% |
| Scottish | 12 | 0.3% |
| Slovene | 58 | 1.5% |
| South American | 368 | 9.8% |
| Spaniard | 40 | 1.1% |
| Subsaharan African | 14 | 0.4% |
| Swedish | 12 | 0.3% |
| Swiss | 23 | 0.6% |
| Thai | 69 | 1.8% | View All 38 Rows |
Immigrants in West Nyack
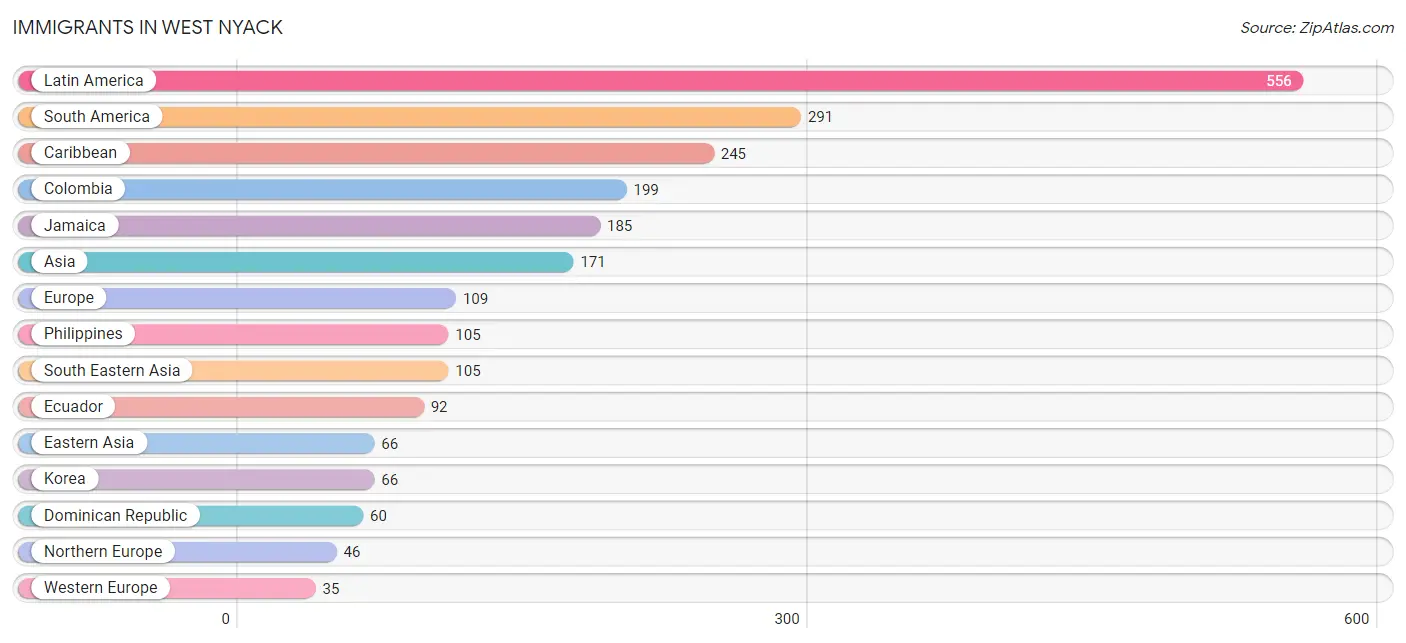
The most numerous immigrant groups reported in West Nyack came from Latin America (556 | 14.8%), South America (291 | 7.7%), Caribbean (245 | 6.5%), Colombia (199 | 5.3%), and Jamaica (185 | 4.9%), together accounting for 39.2% of all West Nyack residents.
| Immigration Origin | # Population | % Population |
| Asia | 171 | 4.5% |
| Belgium | 17 | 0.4% |
| Caribbean | 245 | 6.5% |
| Central America | 20 | 0.5% |
| Colombia | 199 | 5.3% |
| Dominican Republic | 60 | 1.6% |
| Eastern Asia | 66 | 1.8% |
| Ecuador | 92 | 2.4% |
| England | 12 | 0.3% |
| Europe | 109 | 2.9% |
| Germany | 18 | 0.5% |
| Ireland | 34 | 0.9% |
| Italy | 28 | 0.7% |
| Jamaica | 185 | 4.9% |
| Korea | 66 | 1.8% |
| Latin America | 556 | 14.8% |
| Mexico | 20 | 0.5% |
| Northern Europe | 46 | 1.2% |
| Philippines | 105 | 2.8% |
| South America | 291 | 7.7% |
| South Eastern Asia | 105 | 2.8% |
| Southern Europe | 28 | 0.7% |
| Western Europe | 35 | 0.9% | View All 23 Rows |
Sex and Age in West Nyack
Sex and Age in West Nyack
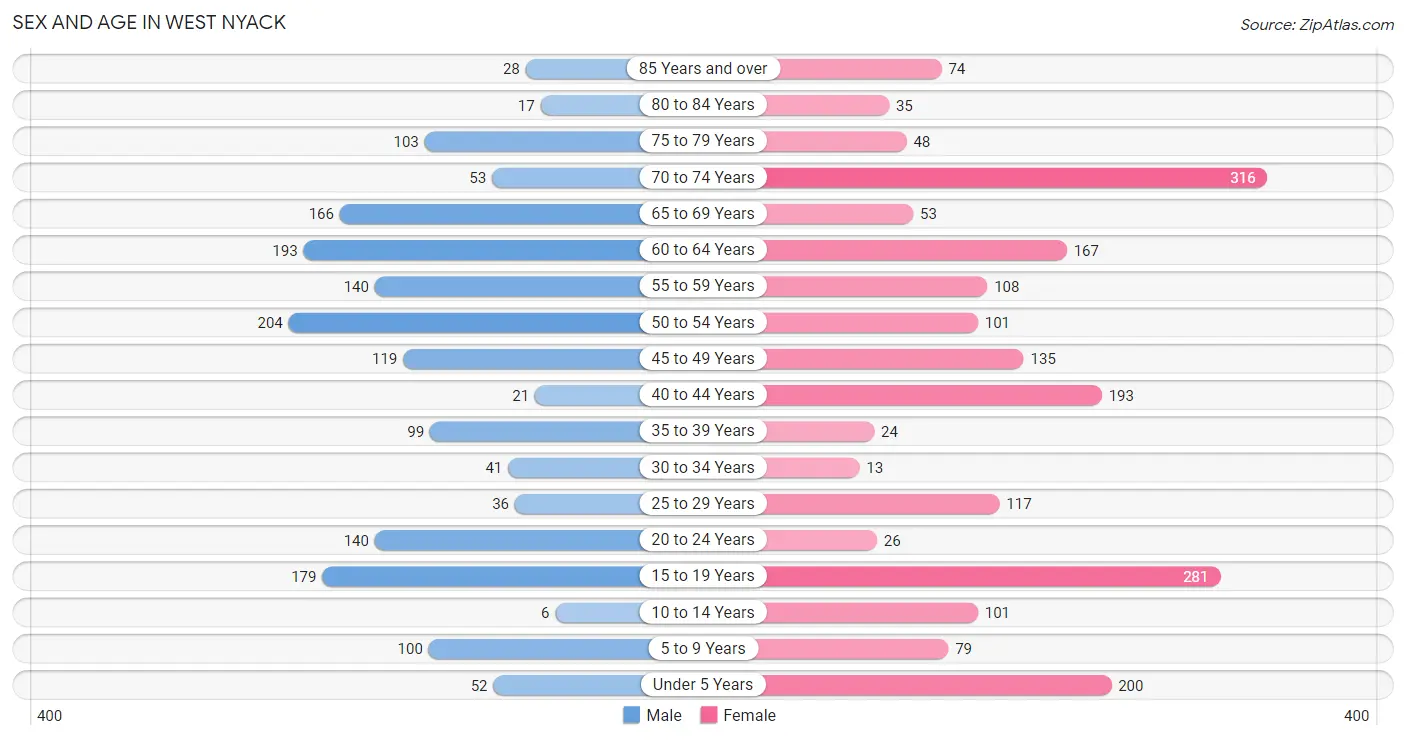
The most populous age groups in West Nyack are 50 to 54 Years (204 | 12.0%) for men and 70 to 74 Years (316 | 15.3%) for women.
| Age Bracket | Male | Female |
| Under 5 Years | 52 (3.1%) | 200 (9.7%) |
| 5 to 9 Years | 100 (5.9%) | 79 (3.8%) |
| 10 to 14 Years | 6 (0.4%) | 101 (4.9%) |
| 15 to 19 Years | 179 (10.5%) | 281 (13.6%) |
| 20 to 24 Years | 140 (8.3%) | 26 (1.3%) |
| 25 to 29 Years | 36 (2.1%) | 117 (5.7%) |
| 30 to 34 Years | 41 (2.4%) | 13 (0.6%) |
| 35 to 39 Years | 99 (5.8%) | 24 (1.2%) |
| 40 to 44 Years | 21 (1.2%) | 193 (9.3%) |
| 45 to 49 Years | 119 (7.0%) | 135 (6.5%) |
| 50 to 54 Years | 204 (12.0%) | 101 (4.9%) |
| 55 to 59 Years | 140 (8.3%) | 108 (5.2%) |
| 60 to 64 Years | 193 (11.4%) | 167 (8.1%) |
| 65 to 69 Years | 166 (9.8%) | 53 (2.6%) |
| 70 to 74 Years | 53 (3.1%) | 316 (15.3%) |
| 75 to 79 Years | 103 (6.1%) | 48 (2.3%) |
| 80 to 84 Years | 17 (1.0%) | 35 (1.7%) |
| 85 Years and over | 28 (1.7%) | 74 (3.6%) |
| Total | 1,697 (100.0%) | 2,071 (100.0%) |
Families and Households in West Nyack
Median Family Size in West Nyack
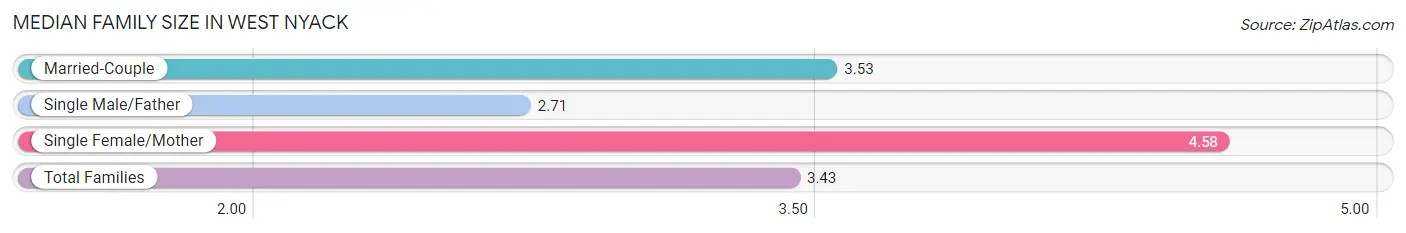
The median family size in West Nyack is 3.43 persons per family, with single female/mother families (12 | 1.2%) accounting for the largest median family size of 4.58 persons per family. On the other hand, single male/father families (138 | 14.3%) represent the smallest median family size with 2.71 persons per family.
| Family Type | # Families | Family Size |
| Married-Couple | 818 (84.5%) | 3.53 |
| Single Male/Father | 138 (14.3%) | 2.71 |
| Single Female/Mother | 12 (1.2%) | 4.58 |
| Total Families | 968 (100.0%) | 3.43 |
Median Household Size in West Nyack
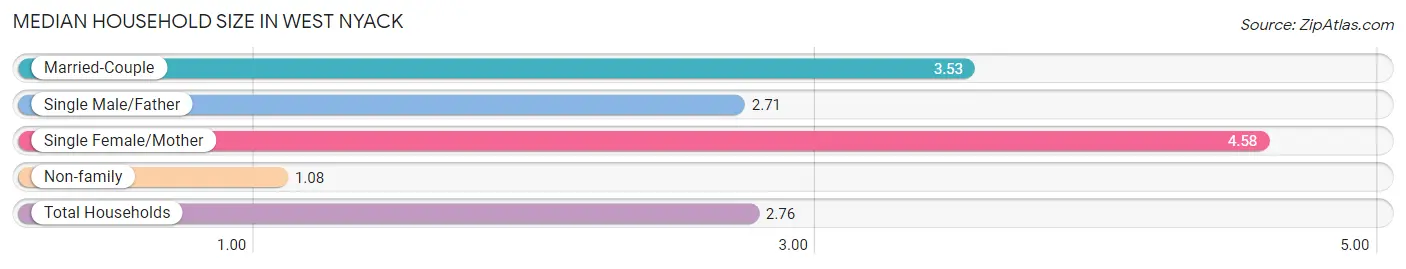
The median household size in West Nyack is 2.76 persons per household, with single female/mother households (12 | 0.9%) accounting for the largest median household size of 4.58 persons per household. non-family households (381 | 28.2%) represent the smallest median household size with 1.08 persons per household.
| Household Type | # Households | Household Size |
| Married-Couple | 818 (60.6%) | 3.53 |
| Single Male/Father | 138 (10.2%) | 2.71 |
| Single Female/Mother | 12 (0.9%) | 4.58 |
| Non-family | 381 (28.2%) | 1.08 |
| Total Households | 1,349 (100.0%) | 2.76 |
Household Size by Marriage Status in West Nyack
Out of a total of 1,349 households in West Nyack, 968 (71.8%) are family households, while 381 (28.2%) are nonfamily households. The most numerous type of family households are 2-person households, comprising 333, and the most common type of nonfamily households are 1-person households, comprising 346.
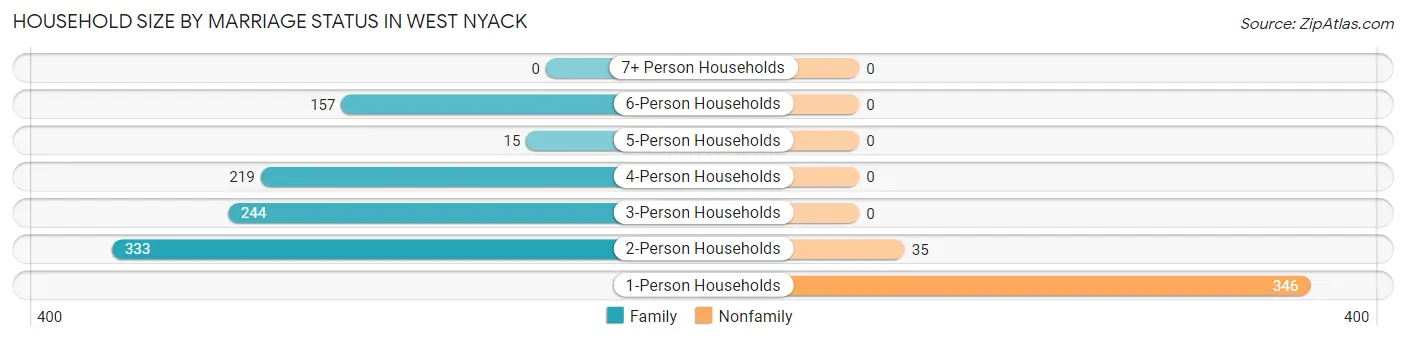
| Household Size | Family Households | Nonfamily Households |
| 1-Person Households | - | 346 (25.7%) |
| 2-Person Households | 333 (24.7%) | 35 (2.6%) |
| 3-Person Households | 244 (18.1%) | 0 (0.0%) |
| 4-Person Households | 219 (16.2%) | 0 (0.0%) |
| 5-Person Households | 15 (1.1%) | 0 (0.0%) |
| 6-Person Households | 157 (11.6%) | 0 (0.0%) |
| 7+ Person Households | 0 (0.0%) | 0 (0.0%) |
| Total | 968 (71.8%) | 381 (28.2%) |
Female Fertility in West Nyack
Fertility by Age in West Nyack
| Age Bracket | Women with Births | Births / 1,000 Women |
| 15 to 19 years | 0 (0.0%) | 0.0 |
| 20 to 34 years | 0 (0.0%) | 0.0 |
| 35 to 50 years | 0 (0.0%) | 0.0 |
| Total | 0 (0.0%) | 0.0 |
Fertility by Age by Marriage Status in West Nyack
| Age Bracket | Married | Unmarried |
| 15 to 19 years | 0 (0.0%) | 0 (0.0%) |
| 20 to 34 years | 0 (0.0%) | 0 (0.0%) |
| 35 to 50 years | 0 (0.0%) | 0 (0.0%) |
| Total | 0 (0.0%) | 0 (0.0%) |
Fertility by Education in West Nyack
| Educational Attainment | Women with Births | Births / 1,000 Women |
| Less than High School | 0 (0.0%) | 0.0 |
| High School Diploma | 0 (0.0%) | 0.0 |
| College or Associate's Degree | 0 (0.0%) | 0.0 |
| Bachelor's Degree | 0 (0.0%) | 0.0 |
| Graduate Degree | 0 (0.0%) | 0.0 |
| Total | 0 (0.0%) | 0.0 |
Fertility by Education by Marriage Status in West Nyack
| Educational Attainment | Married | Unmarried |
| Less than High School | 0 (0.0%) | 0 (0.0%) |
| High School Diploma | 0 (0.0%) | 0 (0.0%) |
| College or Associate's Degree | 0 (0.0%) | 0 (0.0%) |
| Bachelor's Degree | 0 (0.0%) | 0 (0.0%) |
| Graduate Degree | 0 (0.0%) | 0 (0.0%) |
| Total | 0 (0.0%) | 0 (0.0%) |
Employment Characteristics in West Nyack
Employment by Class of Employer in West Nyack
Among the 1,584 employed individuals in West Nyack, private company employees (1,052 | 66.4%), local government employees (151 | 9.5%), and self-employed (incorporated) (107 | 6.8%) make up the most common classes of employment.
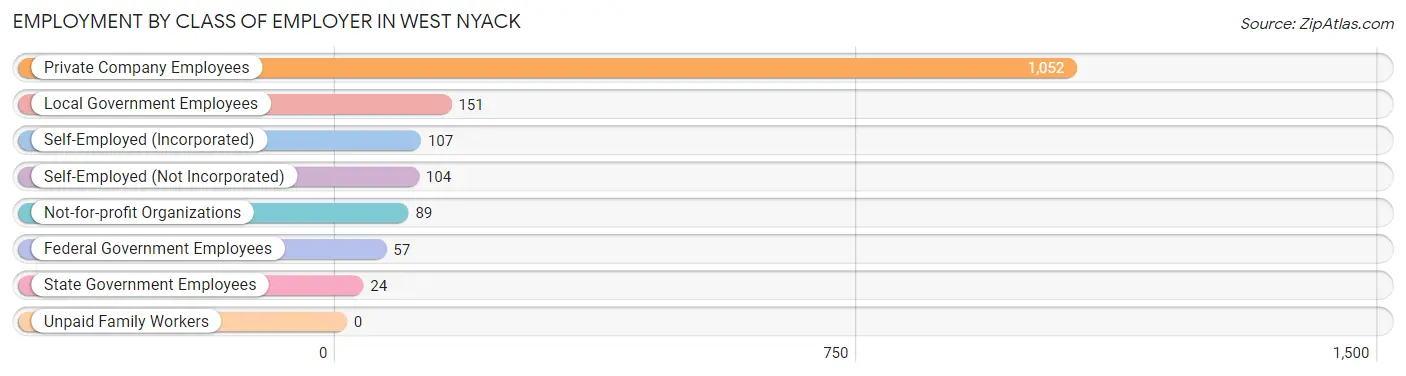
| Employer Class | # Employees | % Employees |
| Private Company Employees | 1,052 | 66.4% |
| Self-Employed (Incorporated) | 107 | 6.8% |
| Self-Employed (Not Incorporated) | 104 | 6.6% |
| Not-for-profit Organizations | 89 | 5.6% |
| Local Government Employees | 151 | 9.5% |
| State Government Employees | 24 | 1.5% |
| Federal Government Employees | 57 | 3.6% |
| Unpaid Family Workers | 0 | 0.0% |
| Total | 1,584 | 100.0% |
Employment Status by Age in West Nyack
According to the labor force statistics for West Nyack, out of the total population over 16 years of age (3,128), 52.7% or 1,648 individuals are in the labor force, with 3.2% or 53 of them unemployed. The age group with the highest labor force participation rate is 30 to 34 years, with 96.3% or 52 individuals in the labor force. Within the labor force, the 55 to 59 years age range has the highest percentage of unemployed individuals, with 19.7% or 36 of them being unemployed.
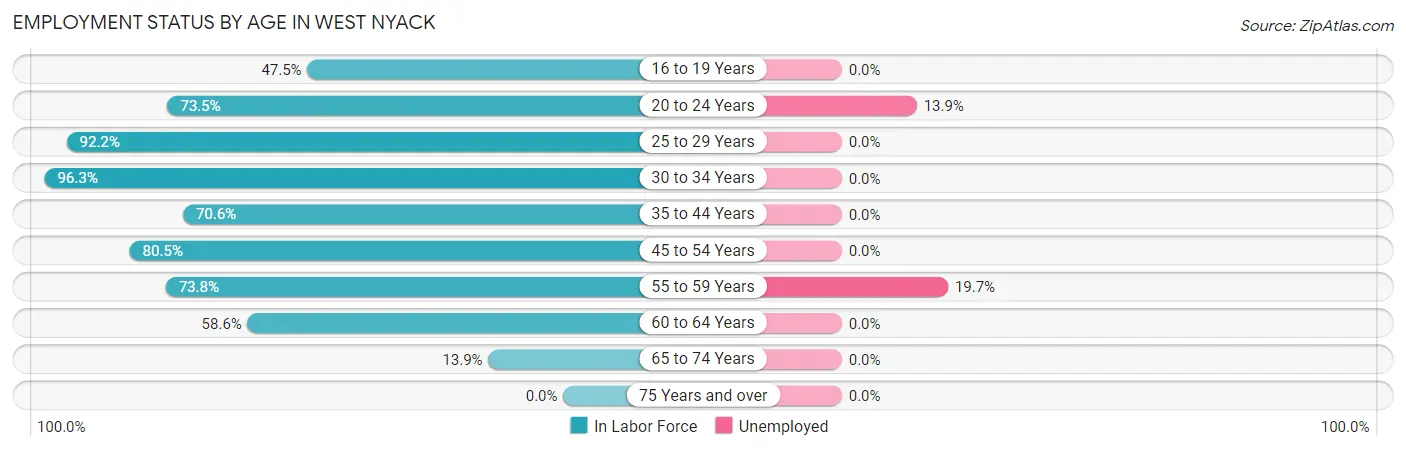
| Age Bracket | In Labor Force | Unemployed |
| 16 to 19 Years | 170 (47.5%) | 0 (0.0%) |
| 20 to 24 Years | 122 (73.5%) | 17 (13.9%) |
| 25 to 29 Years | 141 (92.2%) | 0 (0.0%) |
| 30 to 34 Years | 52 (96.3%) | 0 (0.0%) |
| 35 to 44 Years | 238 (70.6%) | 0 (0.0%) |
| 45 to 54 Years | 450 (80.5%) | 0 (0.0%) |
| 55 to 59 Years | 183 (73.8%) | 36 (19.7%) |
| 60 to 64 Years | 211 (58.6%) | 0 (0.0%) |
| 65 to 74 Years | 82 (13.9%) | 0 (0.0%) |
| 75 Years and over | 0 (0.0%) | 0 (0.0%) |
| Total | 1,648 (52.7%) | 53 (3.2%) |
Employment Status by Educational Attainment in West Nyack
According to labor force statistics for West Nyack, 74.5% of individuals (1,275) out of the total population between 25 and 64 years of age (1,711) are in the labor force, with 2.8% or 36 of them being unemployed. The group with the highest labor force participation rate are those with the educational attainment of bachelor's degree or higher, with 82.6% or 881 individuals in the labor force. Within the labor force, individuals with bachelor's degree or higher education have the highest percentage of unemployment, with 4.1% or 36 of them being unemployed.
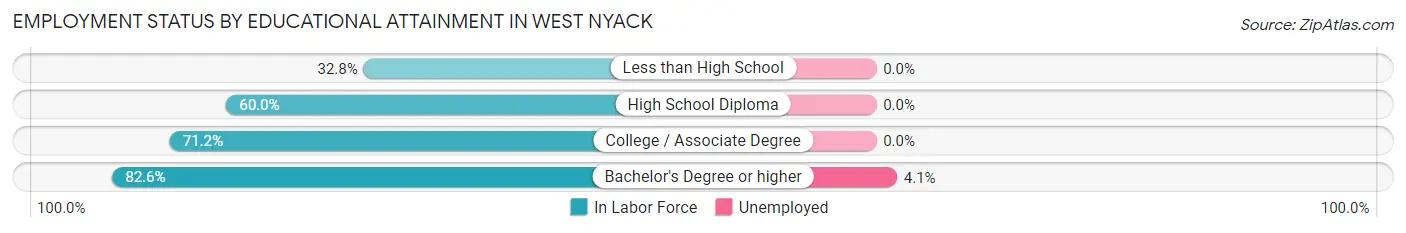
| Educational Attainment | In Labor Force | Unemployed |
| Less than High School | 44 (32.8%) | 0 (0.0%) |
| High School Diploma | 75 (60.0%) | 0 (0.0%) |
| College / Associate Degree | 275 (71.2%) | 0 (0.0%) |
| Bachelor's Degree or higher | 881 (82.6%) | 44 (4.1%) |
| Total | 1,275 (74.5%) | 48 (2.8%) |
Employment Occupations by Sex in West Nyack
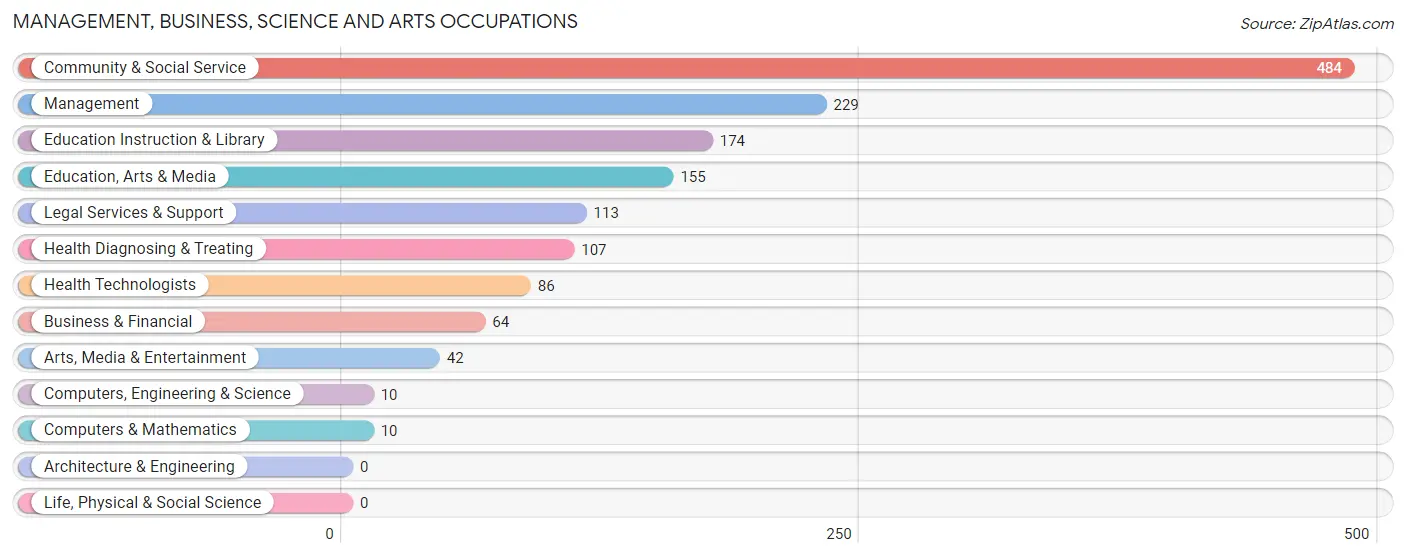
Management, Business, Science and Arts Occupations
The most common Management, Business, Science and Arts occupations in West Nyack are Community & Social Service (484 | 30.3%), Management (229 | 14.3%), Education Instruction & Library (174 | 10.9%), Education, Arts & Media (155 | 9.7%), and Legal Services & Support (113 | 7.1%).
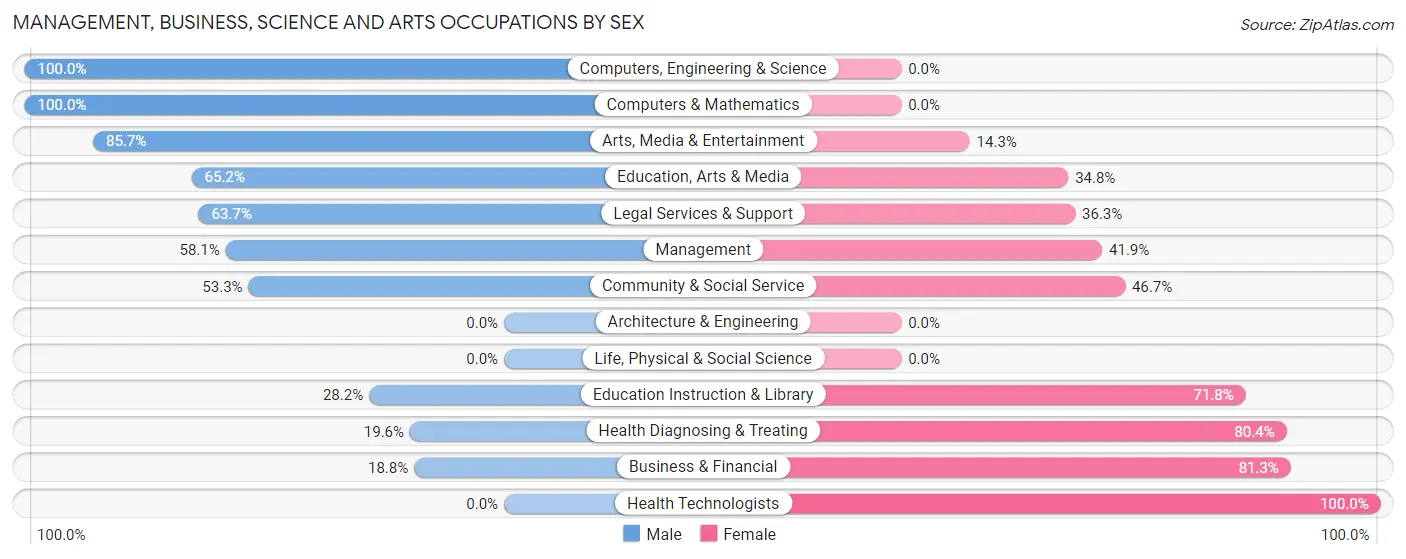
Management, Business, Science and Arts Occupations by Sex
Within the Management, Business, Science and Arts occupations in West Nyack, the most male-oriented occupations are Computers, Engineering & Science (100.0%), Computers & Mathematics (100.0%), and Arts, Media & Entertainment (85.7%), while the most female-oriented occupations are Health Technologists (100.0%), Business & Financial (81.2%), and Health Diagnosing & Treating (80.4%).
| Occupation | Male | Female |
| Management | 133 (58.1%) | 96 (41.9%) |
| Business & Financial | 12 (18.8%) | 52 (81.2%) |
| Computers, Engineering & Science | 10 (100.0%) | 0 (0.0%) |
| Computers & Mathematics | 10 (100.0%) | 0 (0.0%) |
| Architecture & Engineering | 0 (0.0%) | 0 (0.0%) |
| Life, Physical & Social Science | 0 (0.0%) | 0 (0.0%) |
| Community & Social Service | 258 (53.3%) | 226 (46.7%) |
| Education, Arts & Media | 101 (65.2%) | 54 (34.8%) |
| Legal Services & Support | 72 (63.7%) | 41 (36.3%) |
| Education Instruction & Library | 49 (28.2%) | 125 (71.8%) |
| Arts, Media & Entertainment | 36 (85.7%) | 6 (14.3%) |
| Health Diagnosing & Treating | 21 (19.6%) | 86 (80.4%) |
| Health Technologists | 0 (0.0%) | 86 (100.0%) |
| Total (Category) | 434 (48.5%) | 460 (51.4%) |
| Total (Overall) | 792 (49.6%) | 804 (50.4%) |
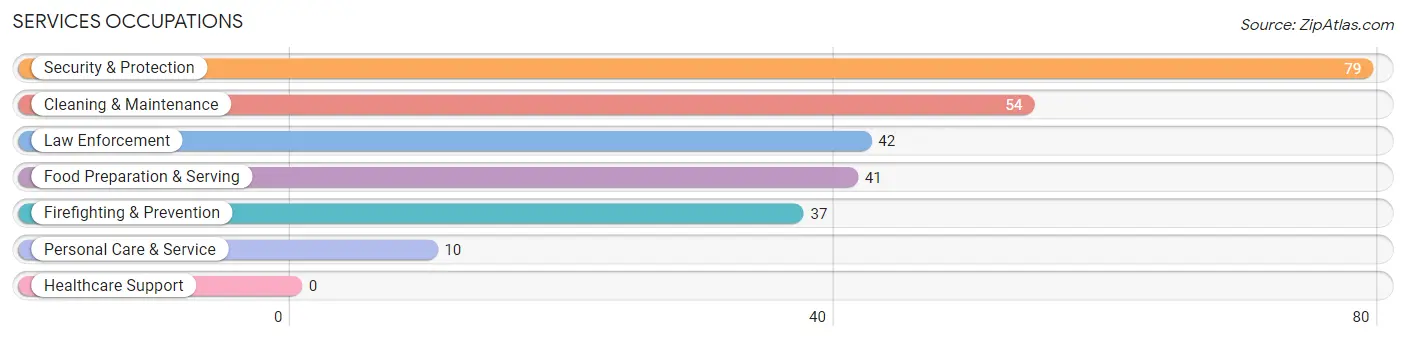
Services Occupations
The most common Services occupations in West Nyack are Security & Protection (79 | 5.0%), Cleaning & Maintenance (54 | 3.4%), Law Enforcement (42 | 2.6%), Food Preparation & Serving (41 | 2.6%), and Firefighting & Prevention (37 | 2.3%).
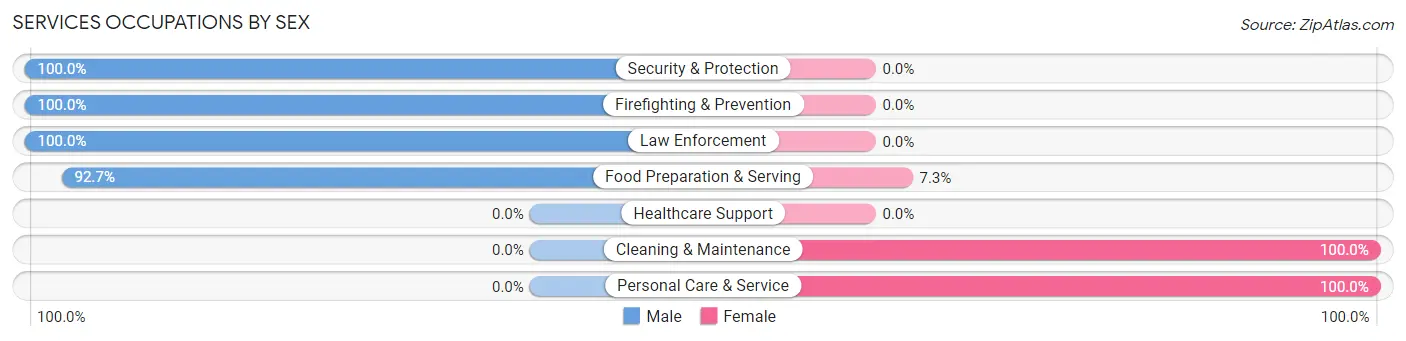
Services Occupations by Sex
Within the Services occupations in West Nyack, the most male-oriented occupations are Security & Protection (100.0%), Firefighting & Prevention (100.0%), and Law Enforcement (100.0%), while the most female-oriented occupations are Cleaning & Maintenance (100.0%), Personal Care & Service (100.0%), and Food Preparation & Serving (7.3%).
| Occupation | Male | Female |
| Healthcare Support | 0 (0.0%) | 0 (0.0%) |
| Security & Protection | 79 (100.0%) | 0 (0.0%) |
| Firefighting & Prevention | 37 (100.0%) | 0 (0.0%) |
| Law Enforcement | 42 (100.0%) | 0 (0.0%) |
| Food Preparation & Serving | 38 (92.7%) | 3 (7.3%) |
| Cleaning & Maintenance | 0 (0.0%) | 54 (100.0%) |
| Personal Care & Service | 0 (0.0%) | 10 (100.0%) |
| Total (Category) | 117 (63.6%) | 67 (36.4%) |
| Total (Overall) | 792 (49.6%) | 804 (50.4%) |
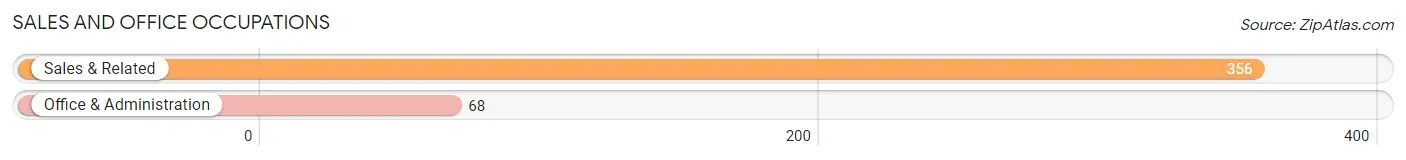
Sales and Office Occupations
The most common Sales and Office occupations in West Nyack are Sales & Related (356 | 22.3%), and Office & Administration (68 | 4.3%).
Sales and Office Occupations by Sex
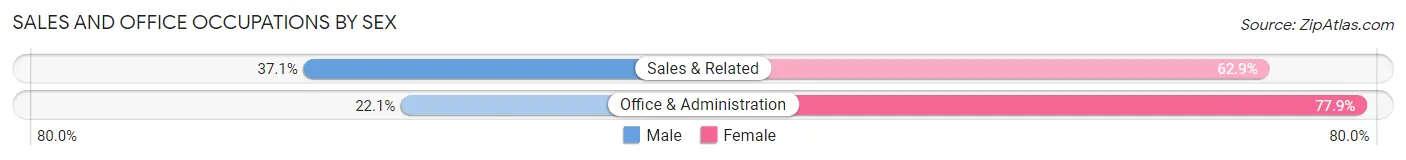
| Occupation | Male | Female |
| Sales & Related | 132 (37.1%) | 224 (62.9%) |
| Office & Administration | 15 (22.1%) | 53 (77.9%) |
| Total (Category) | 147 (34.7%) | 277 (65.3%) |
| Total (Overall) | 792 (49.6%) | 804 (50.4%) |
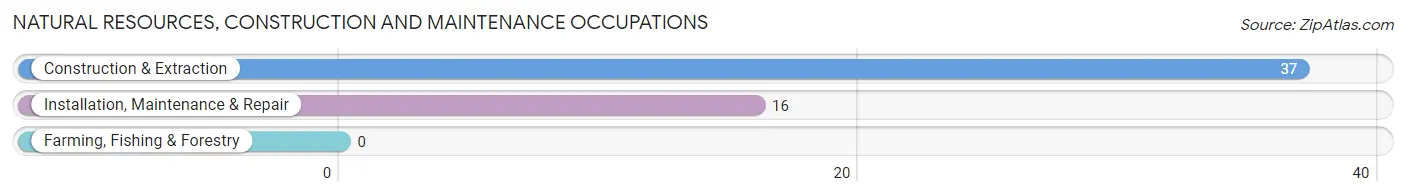
Natural Resources, Construction and Maintenance Occupations
The most common Natural Resources, Construction and Maintenance occupations in West Nyack are Construction & Extraction (37 | 2.3%), and Installation, Maintenance & Repair (16 | 1.0%).
Natural Resources, Construction and Maintenance Occupations by Sex
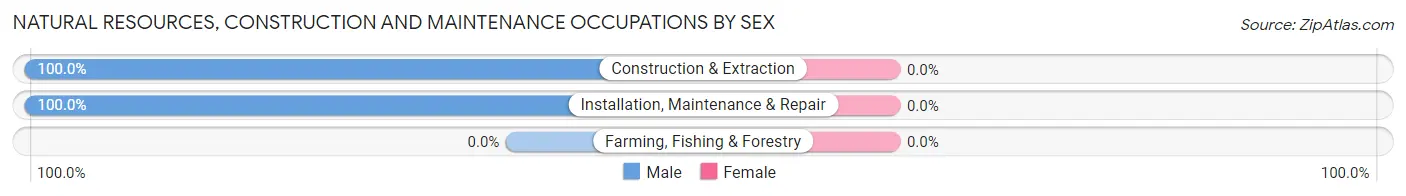
| Occupation | Male | Female |
| Farming, Fishing & Forestry | 0 (0.0%) | 0 (0.0%) |
| Construction & Extraction | 37 (100.0%) | 0 (0.0%) |
| Installation, Maintenance & Repair | 16 (100.0%) | 0 (0.0%) |
| Total (Category) | 53 (100.0%) | 0 (0.0%) |
| Total (Overall) | 792 (49.6%) | 804 (50.4%) |
Production, Transportation and Moving Occupations
The most common Production, Transportation and Moving occupations in West Nyack are , and Production (41 | 2.6%).
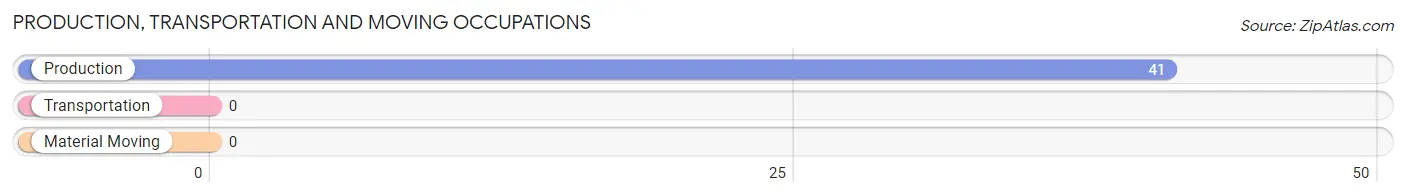
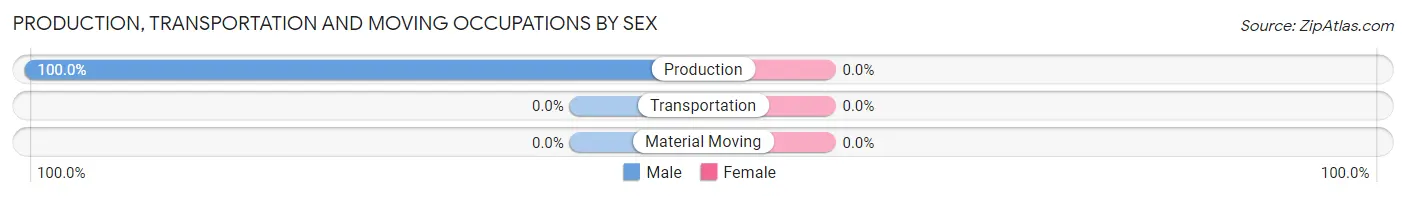
Production, Transportation and Moving Occupations by Sex
| Occupation | Male | Female |
| Production | 41 (100.0%) | 0 (0.0%) |
| Transportation | 0 (0.0%) | 0 (0.0%) |
| Material Moving | 0 (0.0%) | 0 (0.0%) |
| Total (Category) | 41 (100.0%) | 0 (0.0%) |
| Total (Overall) | 792 (49.6%) | 804 (50.4%) |
Employment Industries by Sex in West Nyack
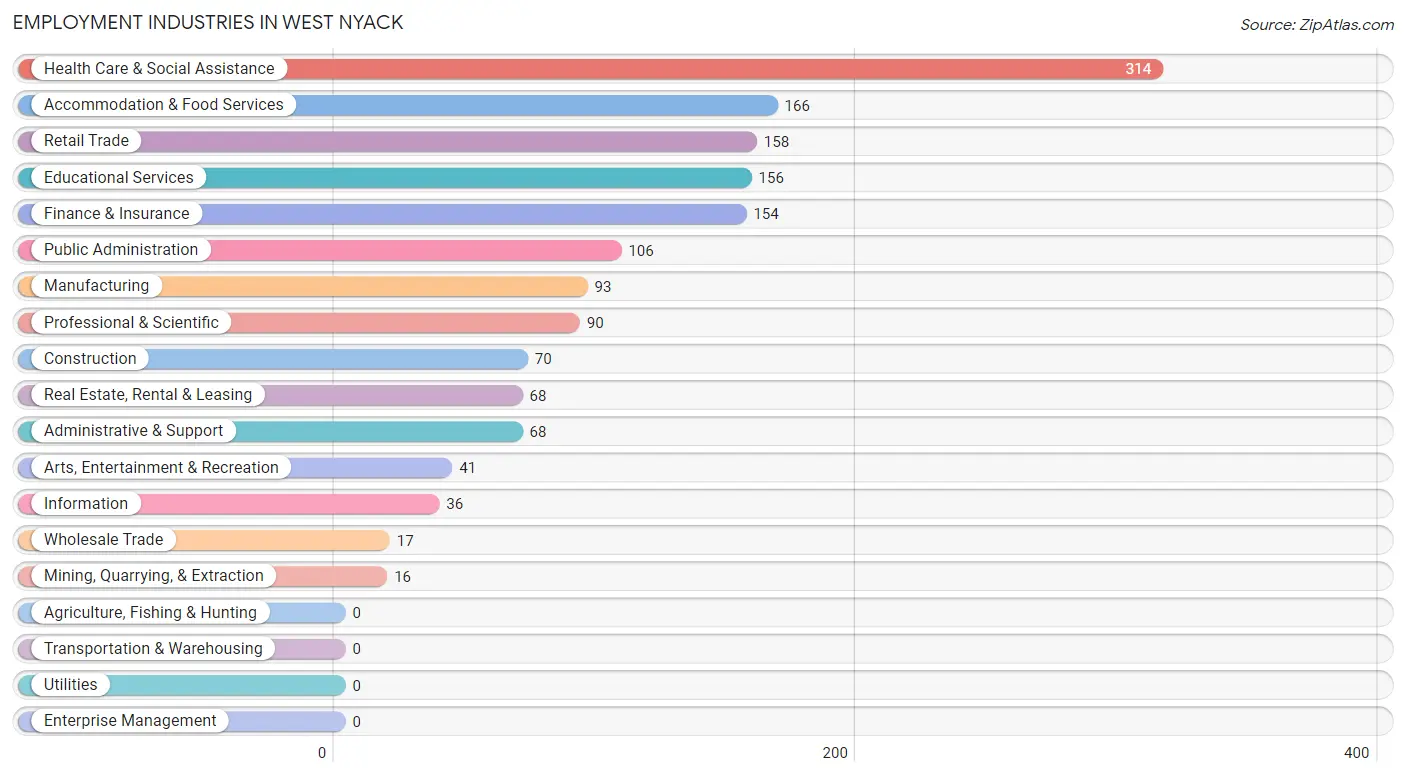
Employment Industries in West Nyack
The major employment industries in West Nyack include Health Care & Social Assistance (314 | 19.7%), Accommodation & Food Services (166 | 10.4%), Retail Trade (158 | 9.9%), Educational Services (156 | 9.8%), and Finance & Insurance (154 | 9.7%).
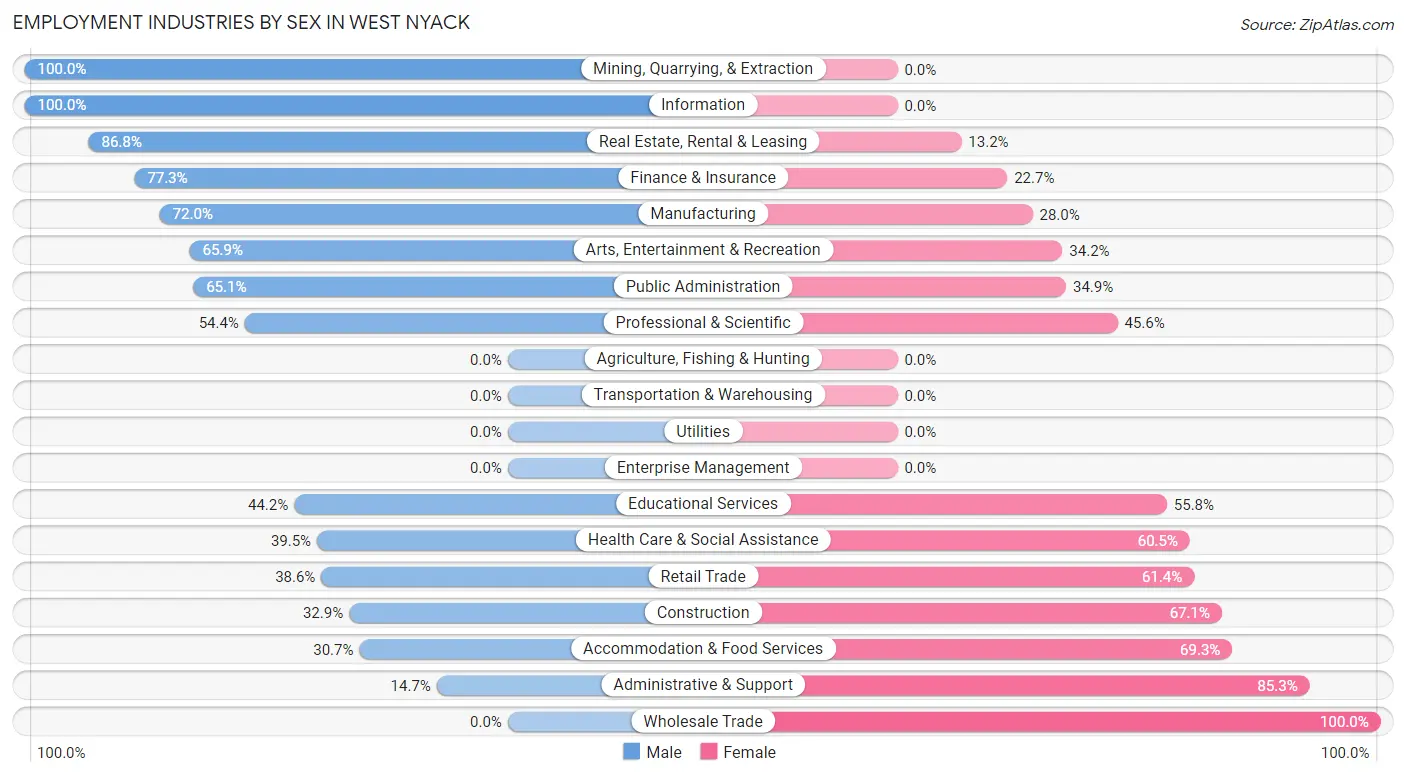
Employment Industries by Sex in West Nyack
The West Nyack industries that see more men than women are Mining, Quarrying, & Extraction (100.0%), Information (100.0%), and Real Estate, Rental & Leasing (86.8%), whereas the industries that tend to have a higher number of women are Wholesale Trade (100.0%), Administrative & Support (85.3%), and Accommodation & Food Services (69.3%).
| Industry | Male | Female |
| Agriculture, Fishing & Hunting | 0 (0.0%) | 0 (0.0%) |
| Mining, Quarrying, & Extraction | 16 (100.0%) | 0 (0.0%) |
| Construction | 23 (32.9%) | 47 (67.1%) |
| Manufacturing | 67 (72.0%) | 26 (28.0%) |
| Wholesale Trade | 0 (0.0%) | 17 (100.0%) |
| Retail Trade | 61 (38.6%) | 97 (61.4%) |
| Transportation & Warehousing | 0 (0.0%) | 0 (0.0%) |
| Utilities | 0 (0.0%) | 0 (0.0%) |
| Information | 36 (100.0%) | 0 (0.0%) |
| Finance & Insurance | 119 (77.3%) | 35 (22.7%) |
| Real Estate, Rental & Leasing | 59 (86.8%) | 9 (13.2%) |
| Professional & Scientific | 49 (54.4%) | 41 (45.6%) |
| Enterprise Management | 0 (0.0%) | 0 (0.0%) |
| Administrative & Support | 10 (14.7%) | 58 (85.3%) |
| Educational Services | 69 (44.2%) | 87 (55.8%) |
| Health Care & Social Assistance | 124 (39.5%) | 190 (60.5%) |
| Arts, Entertainment & Recreation | 27 (65.8%) | 14 (34.2%) |
| Accommodation & Food Services | 51 (30.7%) | 115 (69.3%) |
| Public Administration | 69 (65.1%) | 37 (34.9%) |
| Total | 792 (49.6%) | 804 (50.4%) |
Education in West Nyack
School Enrollment in West Nyack
The most common levels of schooling among the 1,024 students in West Nyack are high school (403 | 39.4%), college / undergraduate (182 | 17.8%), and elementary school (119 | 11.6%).
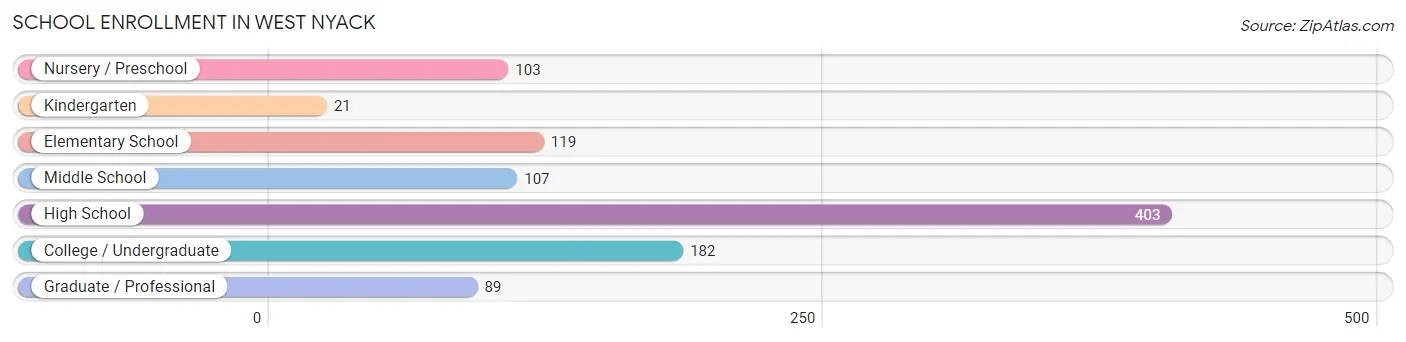
| School Level | # Students | % Students |
| Nursery / Preschool | 103 | 10.1% |
| Kindergarten | 21 | 2.1% |
| Elementary School | 119 | 11.6% |
| Middle School | 107 | 10.4% |
| High School | 403 | 39.4% |
| College / Undergraduate | 182 | 17.8% |
| Graduate / Professional | 89 | 8.7% |
| Total | 1,024 | 100.0% |
School Enrollment by Age by Funding Source in West Nyack
Out of a total of 1,024 students who are enrolled in schools in West Nyack, 43 (4.2%) attend a private institution, while the remaining 981 (95.8%) are enrolled in public schools. The age group of 5 to 9 year old has the highest likelihood of being enrolled in private schools, with 33 (18.4% in the age bracket) enrolled. Conversely, the age group of 3 to 4 year olds has the lowest likelihood of being enrolled in a private school, with 64 (100.0% in the age bracket) attending a public institution.
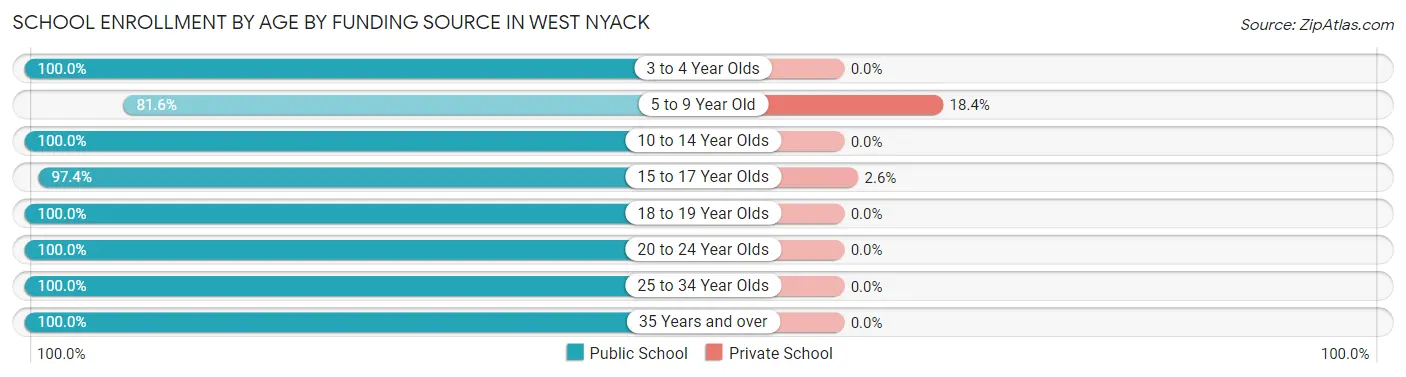
| Age Bracket | Public School | Private School |
| 3 to 4 Year Olds | 64 (100.0%) | 0 (0.0%) |
| 5 to 9 Year Old | 146 (81.6%) | 33 (18.4%) |
| 10 to 14 Year Olds | 107 (100.0%) | 0 (0.0%) |
| 15 to 17 Year Olds | 375 (97.4%) | 10 (2.6%) |
| 18 to 19 Year Olds | 75 (100.0%) | 0 (0.0%) |
| 20 to 24 Year Olds | 102 (100.0%) | 0 (0.0%) |
| 25 to 34 Year Olds | 23 (100.0%) | 0 (0.0%) |
| 35 Years and over | 89 (100.0%) | 0 (0.0%) |
| Total | 981 (95.8%) | 43 (4.2%) |
Educational Attainment by Field of Study in West Nyack
Science & technology (441 | 26.5%), business (265 | 15.9%), social sciences (250 | 15.0%), education (163 | 9.8%), and bio, nature & agricultural (107 | 6.4%) are the most common fields of study among 1,664 individuals in West Nyack who have obtained a bachelor's degree or higher.
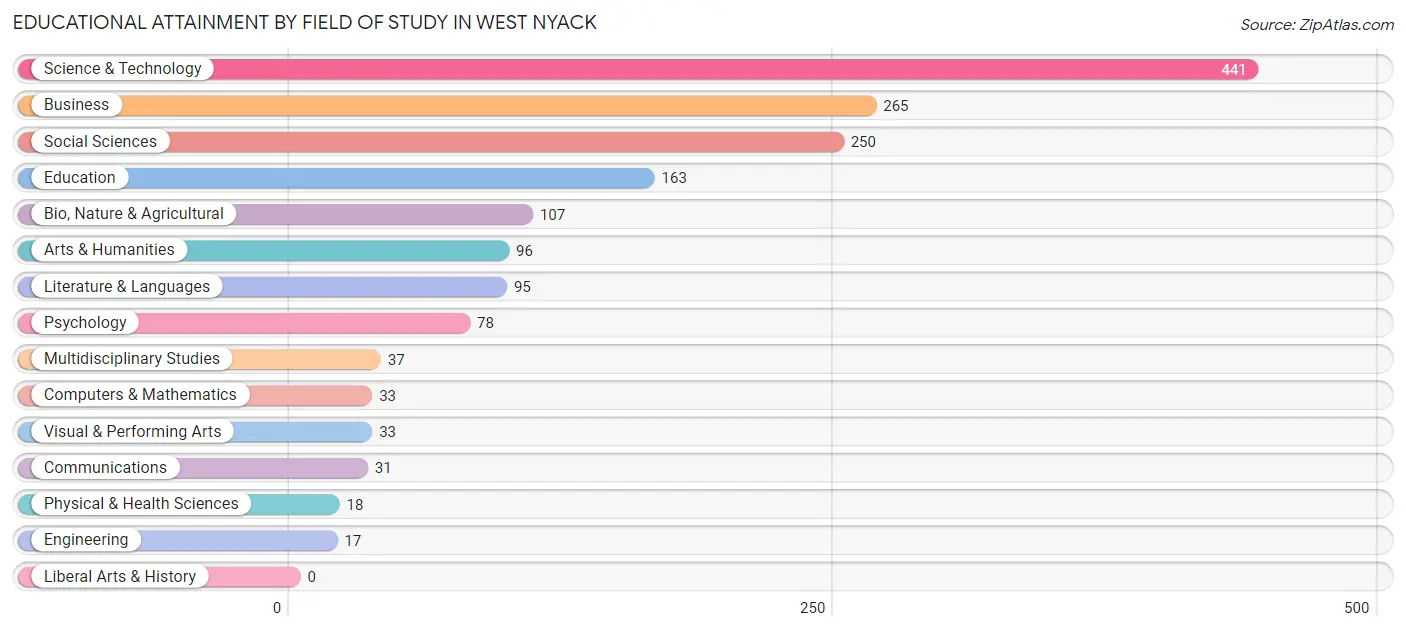
| Field of Study | # Graduates | % Graduates |
| Computers & Mathematics | 33 | 2.0% |
| Bio, Nature & Agricultural | 107 | 6.4% |
| Physical & Health Sciences | 18 | 1.1% |
| Psychology | 78 | 4.7% |
| Social Sciences | 250 | 15.0% |
| Engineering | 17 | 1.0% |
| Multidisciplinary Studies | 37 | 2.2% |
| Science & Technology | 441 | 26.5% |
| Business | 265 | 15.9% |
| Education | 163 | 9.8% |
| Literature & Languages | 95 | 5.7% |
| Liberal Arts & History | 0 | 0.0% |
| Visual & Performing Arts | 33 | 2.0% |
| Communications | 31 | 1.9% |
| Arts & Humanities | 96 | 5.8% |
| Total | 1,664 | 100.0% |
Transportation & Commute in West Nyack
Vehicle Availability by Sex in West Nyack
The most prevalent vehicle ownership categories in West Nyack are males with 3 vehicles (442, accounting for 55.8%) and females with 3 vehicles (538, making up 55.8%).
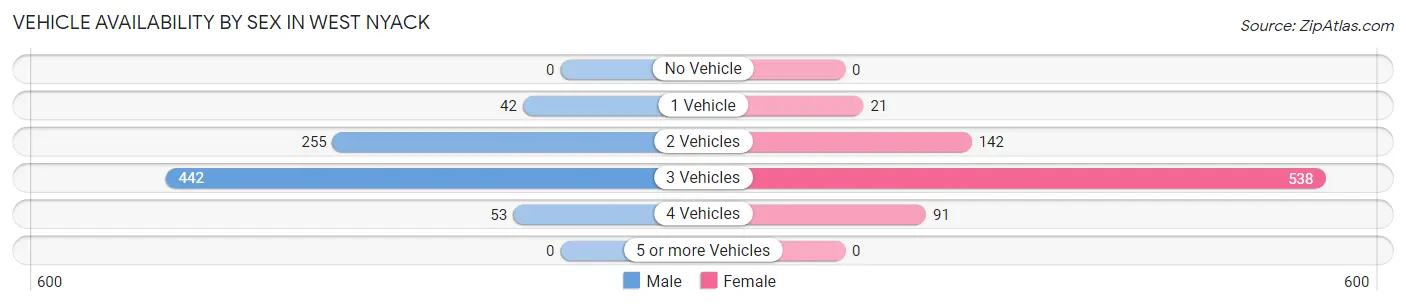
| Vehicles Available | Male | Female |
| No Vehicle | 0 (0.0%) | 0 (0.0%) |
| 1 Vehicle | 42 (5.3%) | 21 (2.6%) |
| 2 Vehicles | 255 (32.2%) | 142 (17.9%) |
| 3 Vehicles | 442 (55.8%) | 538 (67.9%) |
| 4 Vehicles | 53 (6.7%) | 91 (11.5%) |
| 5 or more Vehicles | 0 (0.0%) | 0 (0.0%) |
| Total | 792 (100.0%) | 792 (100.0%) |
Commute Time in West Nyack
The most frequently occuring commute durations in West Nyack are 5 to 9 minutes (284 commuters, 20.6%), 20 to 24 minutes (284 commuters, 20.6%), and 35 to 39 minutes (148 commuters, 10.7%).
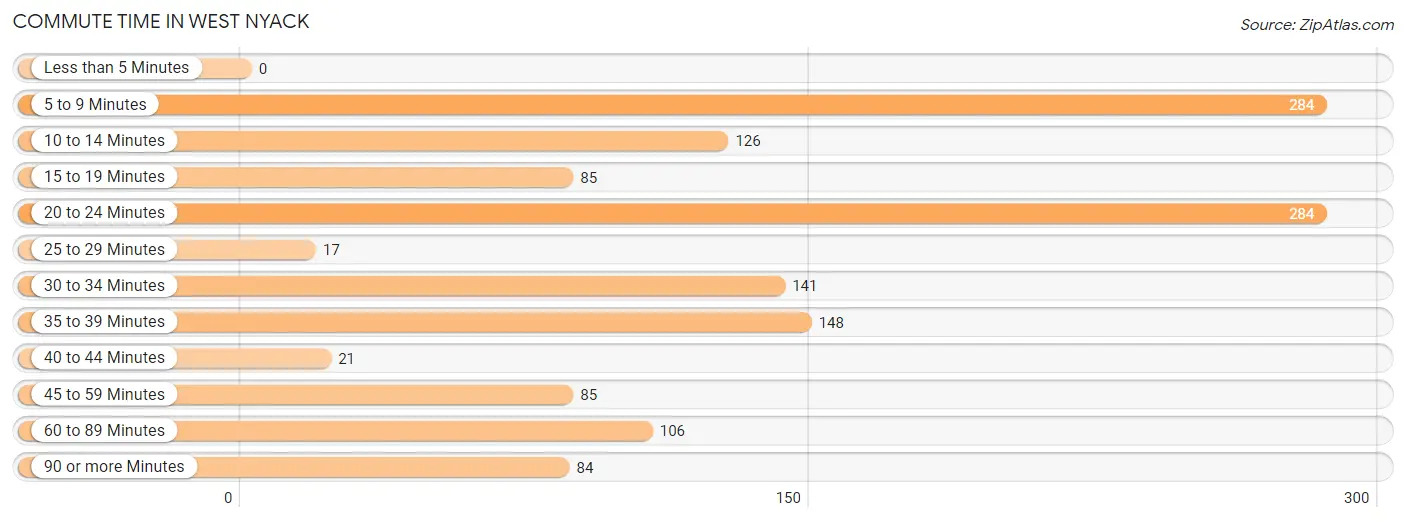
| Commute Time | # Commuters | % Commuters |
| Less than 5 Minutes | 0 | 0.0% |
| 5 to 9 Minutes | 284 | 20.6% |
| 10 to 14 Minutes | 126 | 9.1% |
| 15 to 19 Minutes | 85 | 6.1% |
| 20 to 24 Minutes | 284 | 20.6% |
| 25 to 29 Minutes | 17 | 1.2% |
| 30 to 34 Minutes | 141 | 10.2% |
| 35 to 39 Minutes | 148 | 10.7% |
| 40 to 44 Minutes | 21 | 1.5% |
| 45 to 59 Minutes | 85 | 6.1% |
| 60 to 89 Minutes | 106 | 7.7% |
| 90 or more Minutes | 84 | 6.1% |
Commute Time by Sex in West Nyack
The most common commute times in West Nyack are 35 to 39 minutes (114 commuters, 15.9%) for males and 20 to 24 minutes (202 commuters, 30.5%) for females.
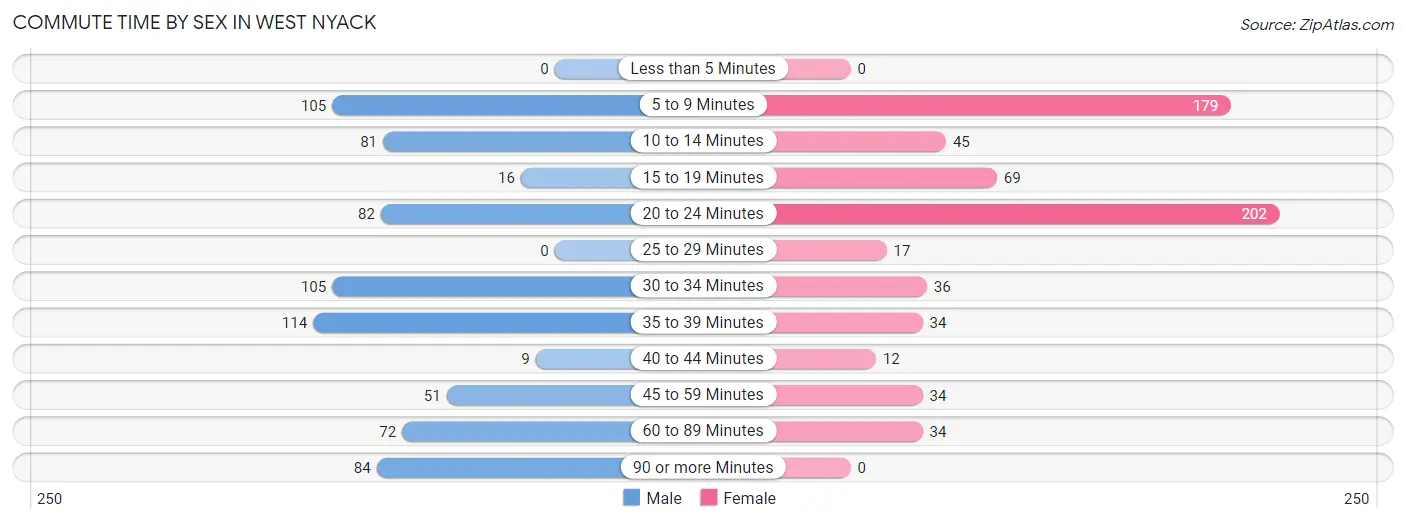
| Commute Time | Male | Female |
| Less than 5 Minutes | 0 (0.0%) | 0 (0.0%) |
| 5 to 9 Minutes | 105 (14.6%) | 179 (27.0%) |
| 10 to 14 Minutes | 81 (11.3%) | 45 (6.8%) |
| 15 to 19 Minutes | 16 (2.2%) | 69 (10.4%) |
| 20 to 24 Minutes | 82 (11.4%) | 202 (30.5%) |
| 25 to 29 Minutes | 0 (0.0%) | 17 (2.6%) |
| 30 to 34 Minutes | 105 (14.6%) | 36 (5.4%) |
| 35 to 39 Minutes | 114 (15.9%) | 34 (5.1%) |
| 40 to 44 Minutes | 9 (1.3%) | 12 (1.8%) |
| 45 to 59 Minutes | 51 (7.1%) | 34 (5.1%) |
| 60 to 89 Minutes | 72 (10.0%) | 34 (5.1%) |
| 90 or more Minutes | 84 (11.7%) | 0 (0.0%) |
Time of Departure to Work by Sex in West Nyack
The most frequent times of departure to work in West Nyack are 10:00 AM to 10:59 AM (159, 22.1%) for males and 9:00 AM to 9:59 AM (122, 18.4%) for females.
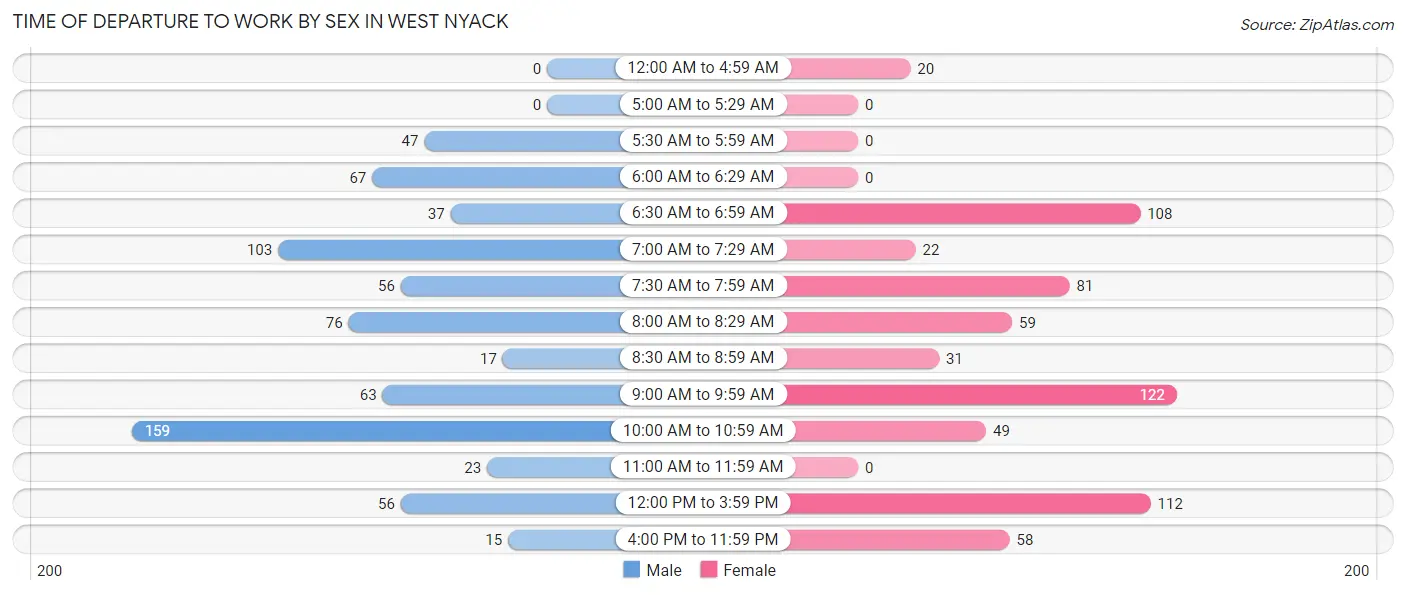
| Time of Departure | Male | Female |
| 12:00 AM to 4:59 AM | 0 (0.0%) | 20 (3.0%) |
| 5:00 AM to 5:29 AM | 0 (0.0%) | 0 (0.0%) |
| 5:30 AM to 5:59 AM | 47 (6.5%) | 0 (0.0%) |
| 6:00 AM to 6:29 AM | 67 (9.3%) | 0 (0.0%) |
| 6:30 AM to 6:59 AM | 37 (5.1%) | 108 (16.3%) |
| 7:00 AM to 7:29 AM | 103 (14.3%) | 22 (3.3%) |
| 7:30 AM to 7:59 AM | 56 (7.8%) | 81 (12.2%) |
| 8:00 AM to 8:29 AM | 76 (10.6%) | 59 (8.9%) |
| 8:30 AM to 8:59 AM | 17 (2.4%) | 31 (4.7%) |
| 9:00 AM to 9:59 AM | 63 (8.8%) | 122 (18.4%) |
| 10:00 AM to 10:59 AM | 159 (22.1%) | 49 (7.4%) |
| 11:00 AM to 11:59 AM | 23 (3.2%) | 0 (0.0%) |
| 12:00 PM to 3:59 PM | 56 (7.8%) | 112 (16.9%) |
| 4:00 PM to 11:59 PM | 15 (2.1%) | 58 (8.8%) |
| Total | 719 (100.0%) | 662 (100.0%) |
Housing Occupancy in West Nyack
Occupancy by Ownership in West Nyack
Of the total 1,349 dwellings in West Nyack, owner-occupied units account for 1,337 (99.1%), while renter-occupied units make up 12 (0.9%).
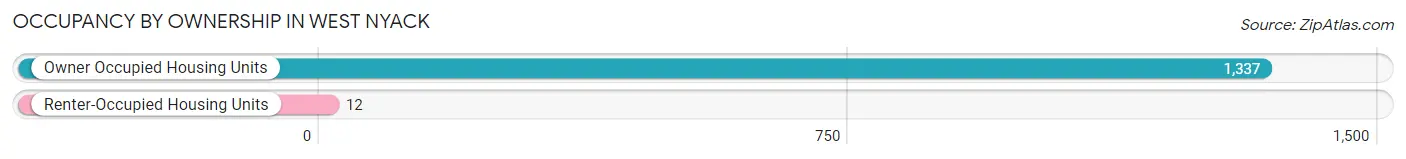
| Occupancy | # Housing Units | % Housing Units |
| Owner Occupied Housing Units | 1,337 | 99.1% |
| Renter-Occupied Housing Units | 12 | 0.9% |
| Total Occupied Housing Units | 1,349 | 100.0% |
Occupancy by Household Size in West Nyack
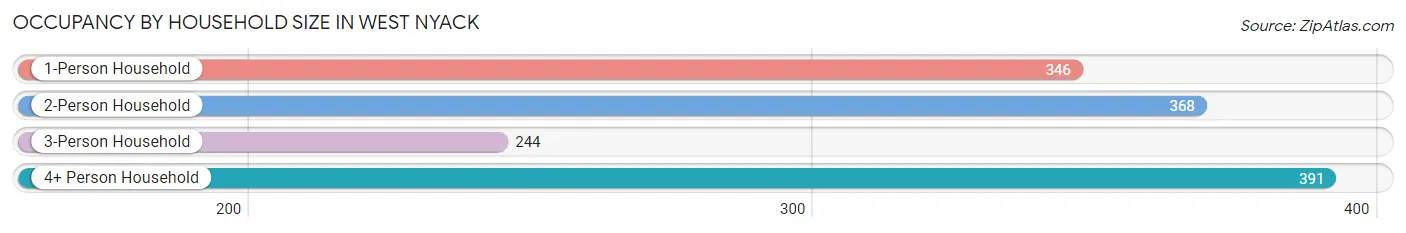
| Household Size | # Housing Units | % Housing Units |
| 1-Person Household | 346 | 25.7% |
| 2-Person Household | 368 | 27.3% |
| 3-Person Household | 244 | 18.1% |
| 4+ Person Household | 391 | 29.0% |
| Total Housing Units | 1,349 | 100.0% |
Occupancy by Ownership by Household Size in West Nyack
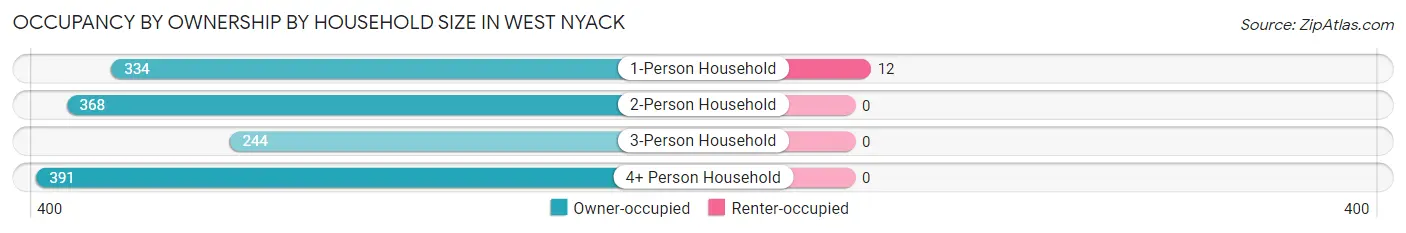
| Household Size | Owner-occupied | Renter-occupied |
| 1-Person Household | 334 (96.5%) | 12 (3.5%) |
| 2-Person Household | 368 (100.0%) | 0 (0.0%) |
| 3-Person Household | 244 (100.0%) | 0 (0.0%) |
| 4+ Person Household | 391 (100.0%) | 0 (0.0%) |
| Total Housing Units | 1,337 (99.1%) | 12 (0.9%) |
Occupancy by Educational Attainment in West Nyack
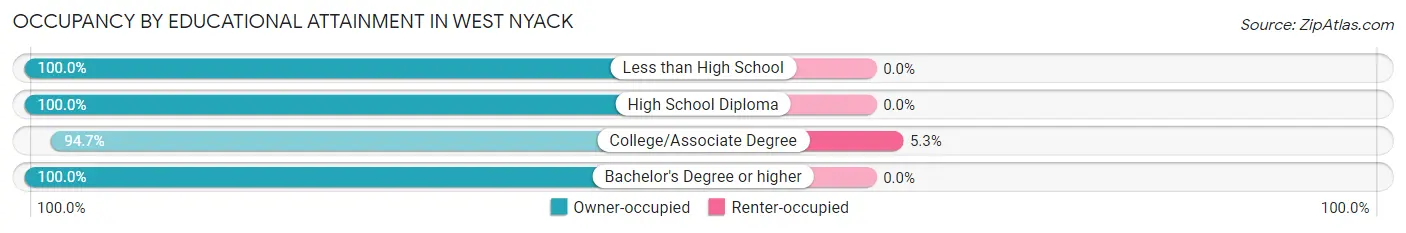
| Household Size | Owner-occupied | Renter-occupied |
| Less than High School | 52 (100.0%) | 0 (0.0%) |
| High School Diploma | 126 (100.0%) | 0 (0.0%) |
| College/Associate Degree | 214 (94.7%) | 12 (5.3%) |
| Bachelor's Degree or higher | 945 (100.0%) | 0 (0.0%) |
Occupancy by Age of Householder in West Nyack
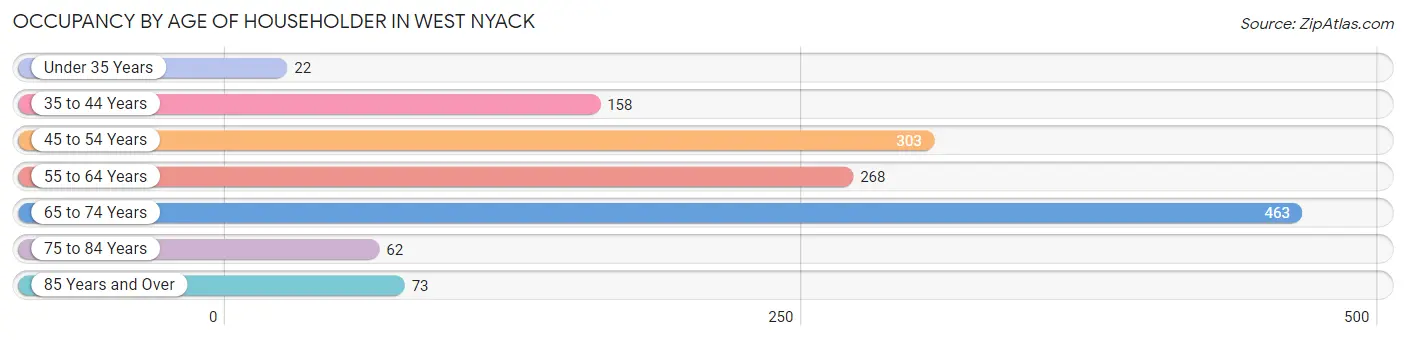
| Age Bracket | # Households | % Households |
| Under 35 Years | 22 | 1.6% |
| 35 to 44 Years | 158 | 11.7% |
| 45 to 54 Years | 303 | 22.5% |
| 55 to 64 Years | 268 | 19.9% |
| 65 to 74 Years | 463 | 34.3% |
| 75 to 84 Years | 62 | 4.6% |
| 85 Years and Over | 73 | 5.4% |
| Total | 1,349 | 100.0% |
Housing Finances in West Nyack
Median Income by Occupancy in West Nyack
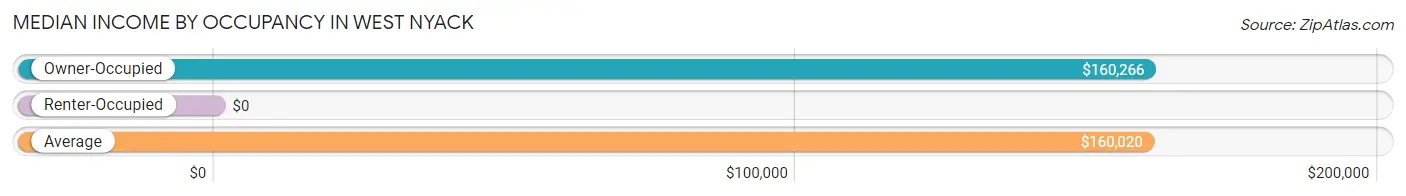
| Occupancy Type | # Households | Median Income |
| Owner-Occupied | 1,337 (99.1%) | $160,266 |
| Renter-Occupied | 12 (0.9%) | $0 |
| Average | 1,349 (100.0%) | $160,020 |
Occupancy by Householder Income Bracket in West Nyack
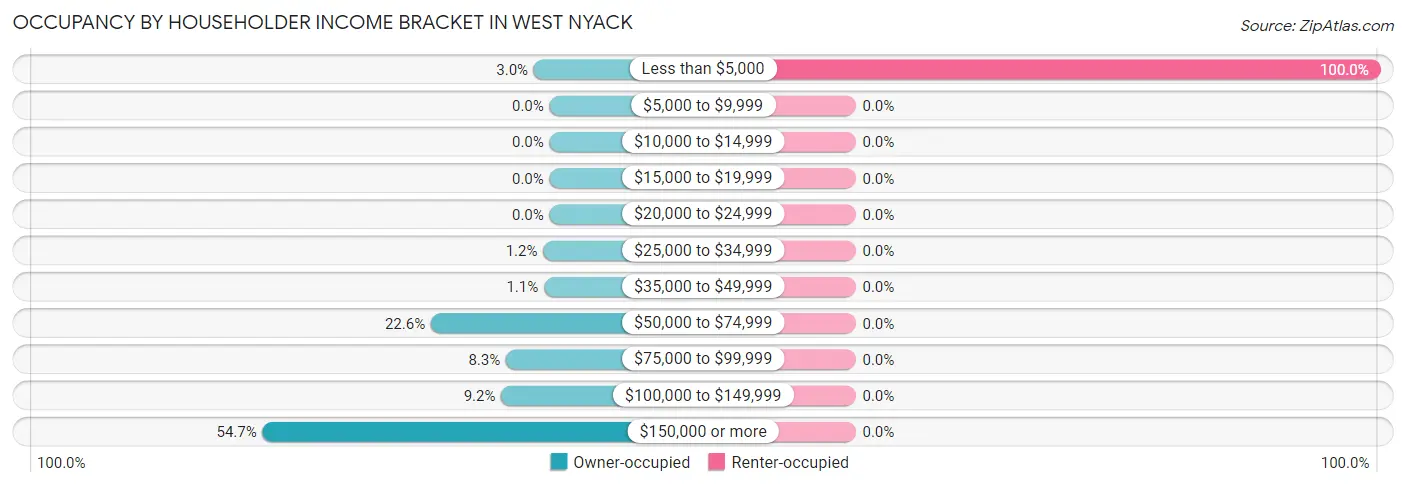
| Income Bracket | Owner-occupied | Renter-occupied |
| Less than $5,000 | 40 (3.0%) | 12 (100.0%) |
| $5,000 to $9,999 | 0 (0.0%) | 0 (0.0%) |
| $10,000 to $14,999 | 0 (0.0%) | 0 (0.0%) |
| $15,000 to $19,999 | 0 (0.0%) | 0 (0.0%) |
| $20,000 to $24,999 | 0 (0.0%) | 0 (0.0%) |
| $25,000 to $34,999 | 16 (1.2%) | 0 (0.0%) |
| $35,000 to $49,999 | 14 (1.1%) | 0 (0.0%) |
| $50,000 to $74,999 | 302 (22.6%) | 0 (0.0%) |
| $75,000 to $99,999 | 111 (8.3%) | 0 (0.0%) |
| $100,000 to $149,999 | 123 (9.2%) | 0 (0.0%) |
| $150,000 or more | 731 (54.7%) | 0 (0.0%) |
| Total | 1,337 (100.0%) | 12 (100.0%) |
Monthly Housing Cost Tiers in West Nyack
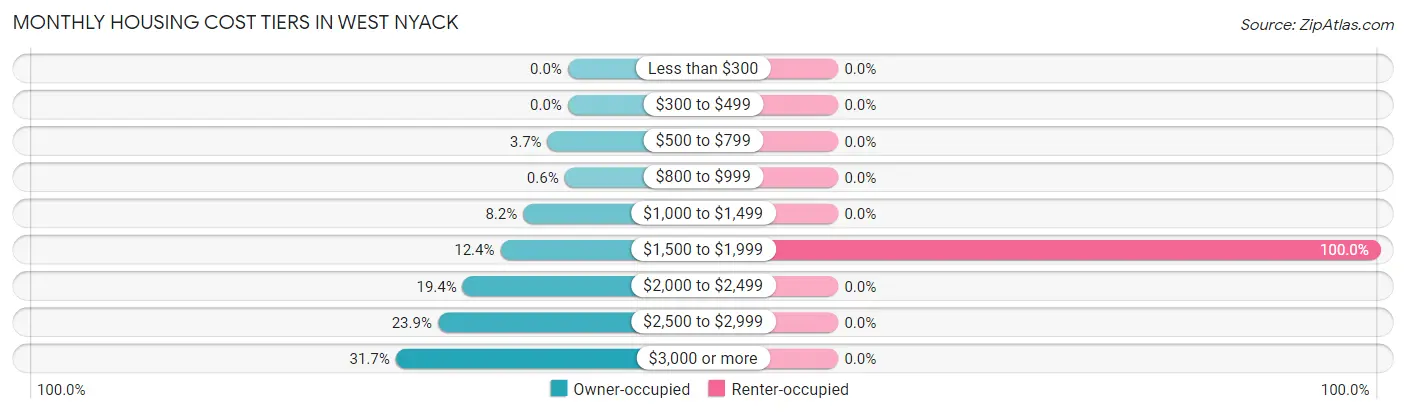
| Monthly Cost | Owner-occupied | Renter-occupied |
| Less than $300 | 0 (0.0%) | 0 (0.0%) |
| $300 to $499 | 0 (0.0%) | 0 (0.0%) |
| $500 to $799 | 50 (3.7%) | 0 (0.0%) |
| $800 to $999 | 8 (0.6%) | 0 (0.0%) |
| $1,000 to $1,499 | 110 (8.2%) | 0 (0.0%) |
| $1,500 to $1,999 | 166 (12.4%) | 12 (100.0%) |
| $2,000 to $2,499 | 259 (19.4%) | 0 (0.0%) |
| $2,500 to $2,999 | 320 (23.9%) | 0 (0.0%) |
| $3,000 or more | 424 (31.7%) | 0 (0.0%) |
| Total | 1,337 (100.0%) | 12 (100.0%) |
Physical Housing Characteristics in West Nyack
Housing Structures in West Nyack
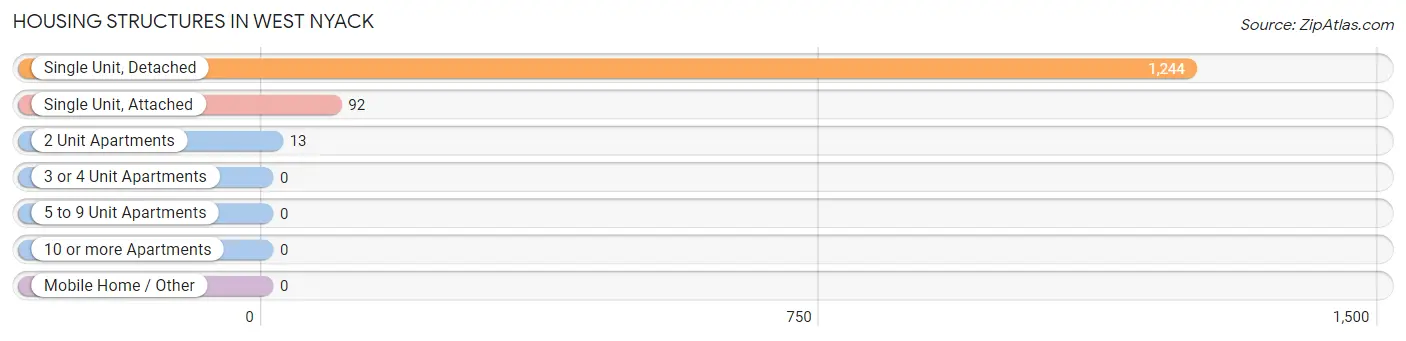
| Structure Type | # Housing Units | % Housing Units |
| Single Unit, Detached | 1,244 | 92.2% |
| Single Unit, Attached | 92 | 6.8% |
| 2 Unit Apartments | 13 | 1.0% |
| 3 or 4 Unit Apartments | 0 | 0.0% |
| 5 to 9 Unit Apartments | 0 | 0.0% |
| 10 or more Apartments | 0 | 0.0% |
| Mobile Home / Other | 0 | 0.0% |
| Total | 1,349 | 100.0% |
Housing Structures by Occupancy in West Nyack
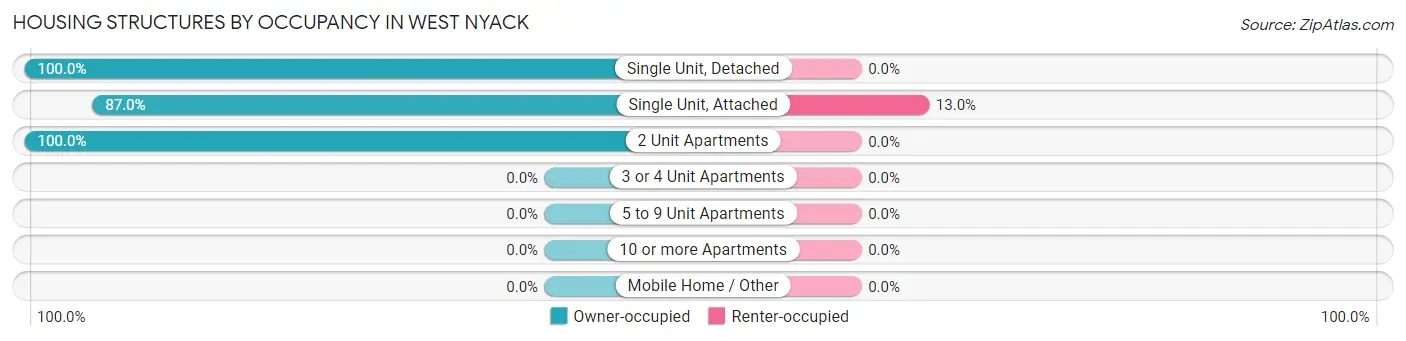
| Structure Type | Owner-occupied | Renter-occupied |
| Single Unit, Detached | 1,244 (100.0%) | 0 (0.0%) |
| Single Unit, Attached | 80 (87.0%) | 12 (13.0%) |
| 2 Unit Apartments | 13 (100.0%) | 0 (0.0%) |
| 3 or 4 Unit Apartments | 0 (0.0%) | 0 (0.0%) |
| 5 to 9 Unit Apartments | 0 (0.0%) | 0 (0.0%) |
| 10 or more Apartments | 0 (0.0%) | 0 (0.0%) |
| Mobile Home / Other | 0 (0.0%) | 0 (0.0%) |
| Total | 1,337 (99.1%) | 12 (0.9%) |
Housing Structures by Number of Rooms in West Nyack
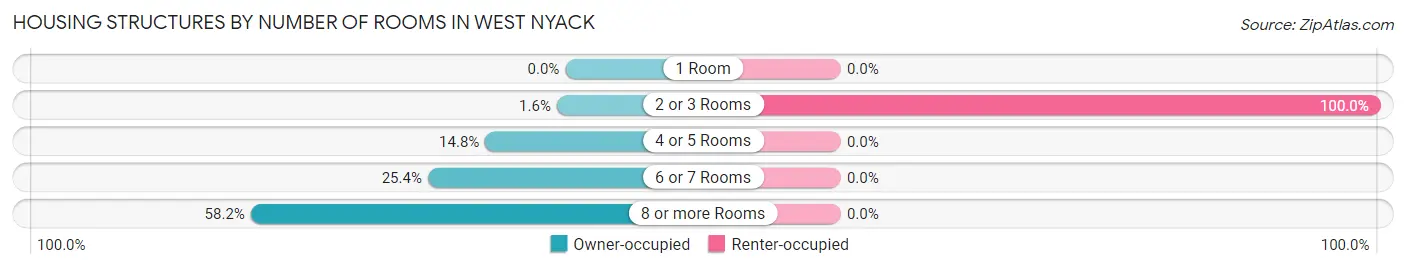
| Number of Rooms | Owner-occupied | Renter-occupied |
| 1 Room | 0 (0.0%) | 0 (0.0%) |
| 2 or 3 Rooms | 21 (1.6%) | 12 (100.0%) |
| 4 or 5 Rooms | 198 (14.8%) | 0 (0.0%) |
| 6 or 7 Rooms | 340 (25.4%) | 0 (0.0%) |
| 8 or more Rooms | 778 (58.2%) | 0 (0.0%) |
| Total | 1,337 (100.0%) | 12 (100.0%) |
Housing Structure by Heating Type in West Nyack
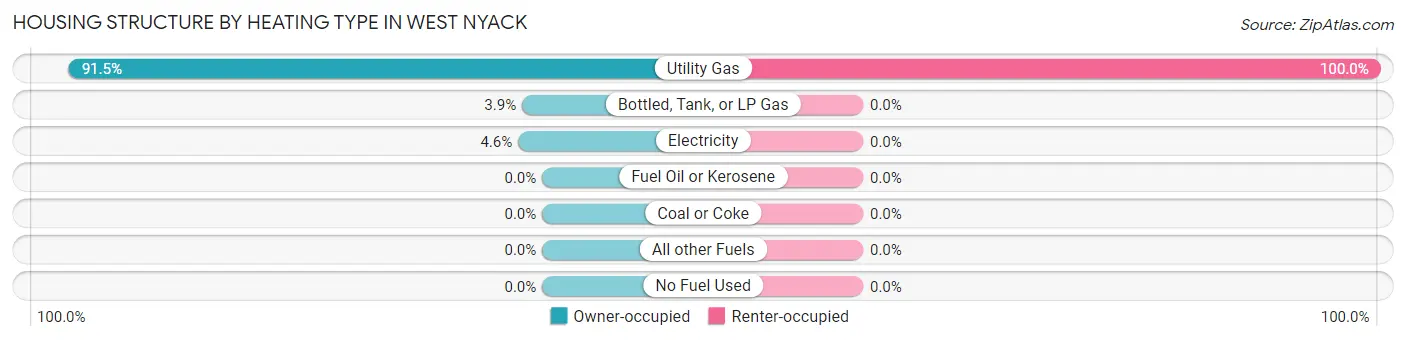
| Heating Type | Owner-occupied | Renter-occupied |
| Utility Gas | 1,223 (91.5%) | 12 (100.0%) |
| Bottled, Tank, or LP Gas | 52 (3.9%) | 0 (0.0%) |
| Electricity | 62 (4.6%) | 0 (0.0%) |
| Fuel Oil or Kerosene | 0 (0.0%) | 0 (0.0%) |
| Coal or Coke | 0 (0.0%) | 0 (0.0%) |
| All other Fuels | 0 (0.0%) | 0 (0.0%) |
| No Fuel Used | 0 (0.0%) | 0 (0.0%) |
| Total | 1,337 (100.0%) | 12 (100.0%) |
Household Vehicle Usage in West Nyack
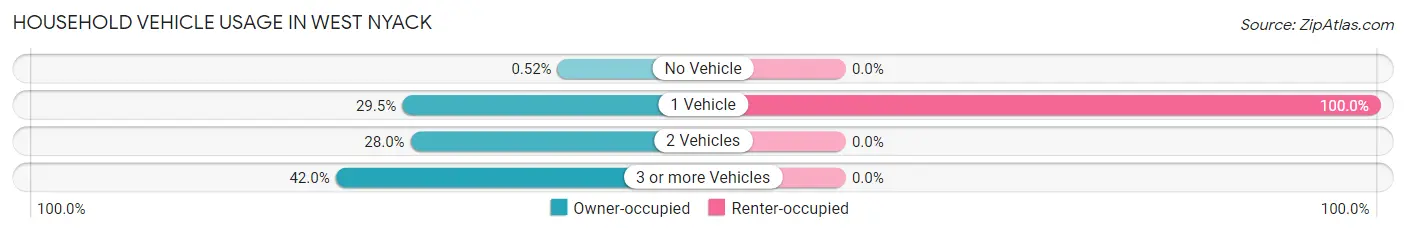
| Vehicles per Household | Owner-occupied | Renter-occupied |
| No Vehicle | 7 (0.5%) | 0 (0.0%) |
| 1 Vehicle | 395 (29.5%) | 12 (100.0%) |
| 2 Vehicles | 374 (28.0%) | 0 (0.0%) |
| 3 or more Vehicles | 561 (42.0%) | 0 (0.0%) |
| Total | 1,337 (100.0%) | 12 (100.0%) |
Real Estate & Mortgages in West Nyack
Real Estate and Mortgage Overview in West Nyack
| Characteristic | Without Mortgage | With Mortgage |
| Housing Units | 541 | 796 |
| Median Property Value | $602,500 | $491,200 |
| Median Household Income | $160,709 | $407 |
| Monthly Housing Costs | $1,501 | $424 |
| Real Estate Taxes | $10,001 | $22 |
Property Value by Mortgage Status in West Nyack
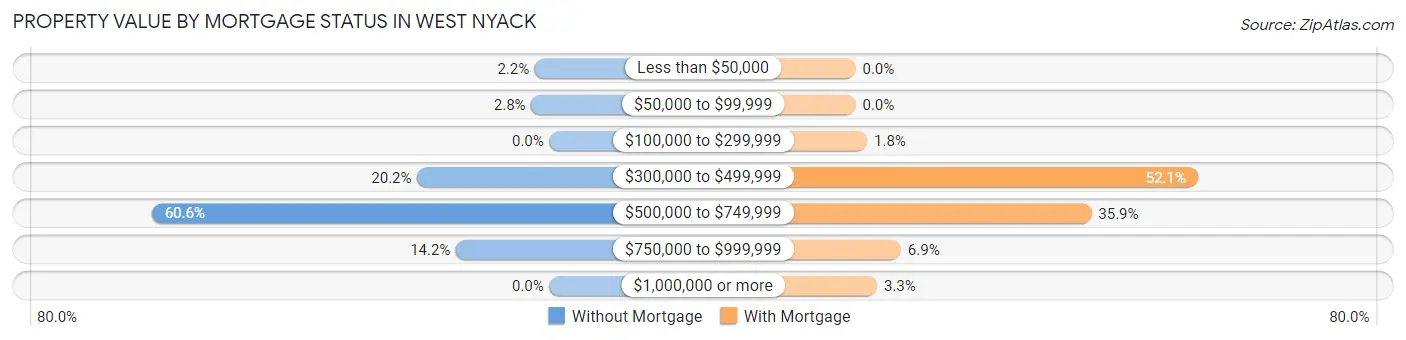
| Property Value | Without Mortgage | With Mortgage |
| Less than $50,000 | 12 (2.2%) | 0 (0.0%) |
| $50,000 to $99,999 | 15 (2.8%) | 0 (0.0%) |
| $100,000 to $299,999 | 0 (0.0%) | 14 (1.8%) |
| $300,000 to $499,999 | 109 (20.2%) | 415 (52.1%) |
| $500,000 to $749,999 | 328 (60.6%) | 286 (35.9%) |
| $750,000 to $999,999 | 77 (14.2%) | 55 (6.9%) |
| $1,000,000 or more | 0 (0.0%) | 26 (3.3%) |
| Total | 541 (100.0%) | 796 (100.0%) |
Household Income by Mortgage Status in West Nyack
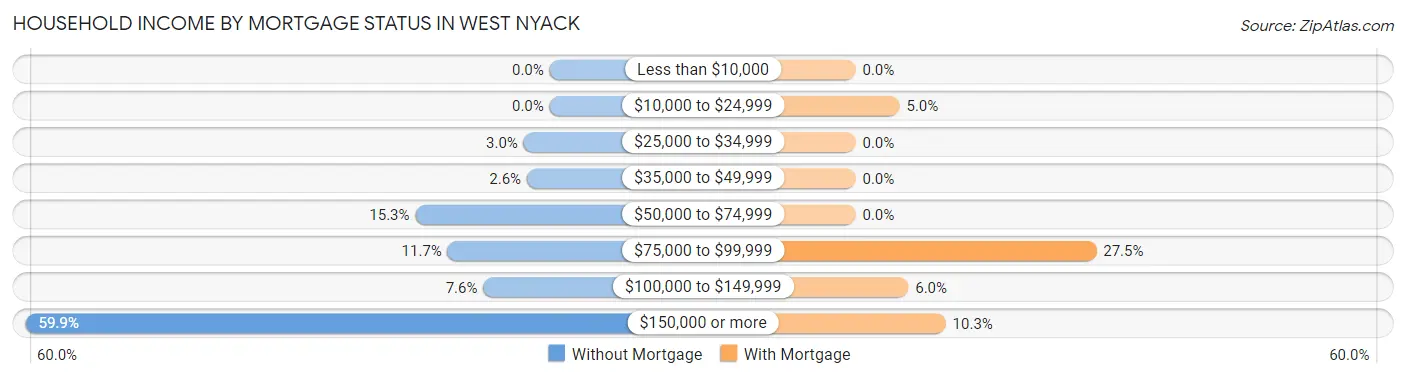
| Household Income | Without Mortgage | With Mortgage |
| Less than $10,000 | 0 (0.0%) | 0 (0.0%) |
| $10,000 to $24,999 | 0 (0.0%) | 40 (5.0%) |
| $25,000 to $34,999 | 16 (3.0%) | 0 (0.0%) |
| $35,000 to $49,999 | 14 (2.6%) | 0 (0.0%) |
| $50,000 to $74,999 | 83 (15.3%) | 0 (0.0%) |
| $75,000 to $99,999 | 63 (11.7%) | 219 (27.5%) |
| $100,000 to $149,999 | 41 (7.6%) | 48 (6.0%) |
| $150,000 or more | 324 (59.9%) | 82 (10.3%) |
| Total | 541 (100.0%) | 796 (100.0%) |
Property Value to Household Income Ratio in West Nyack
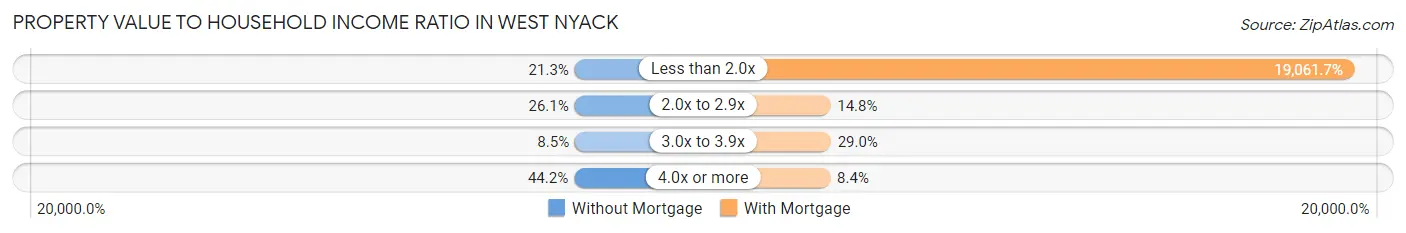
| Value-to-Income Ratio | Without Mortgage | With Mortgage |
| Less than 2.0x | 115 (21.3%) | 151,731 (19,061.7%) |
| 2.0x to 2.9x | 141 (26.1%) | 118 (14.8%) |
| 3.0x to 3.9x | 46 (8.5%) | 231 (29.0%) |
| 4.0x or more | 239 (44.2%) | 67 (8.4%) |
| Total | 541 (100.0%) | 796 (100.0%) |
Real Estate Taxes by Mortgage Status in West Nyack
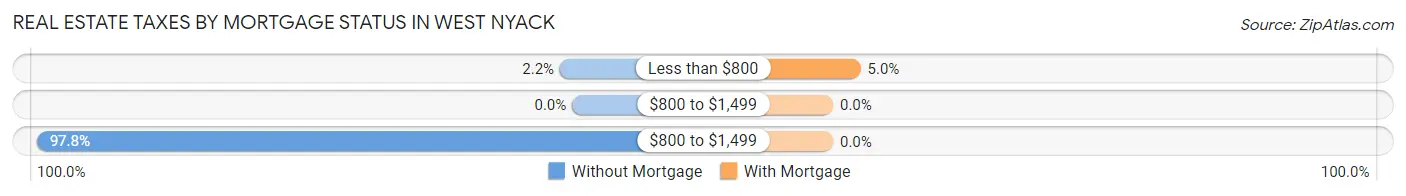
| Property Taxes | Without Mortgage | With Mortgage |
| Less than $800 | 12 (2.2%) | 40 (5.0%) |
| $800 to $1,499 | 0 (0.0%) | 0 (0.0%) |
| $800 to $1,499 | 529 (97.8%) | 0 (0.0%) |
| Total | 541 (100.0%) | 796 (100.0%) |
Health & Disability in West Nyack
Health Insurance Coverage by Age in West Nyack
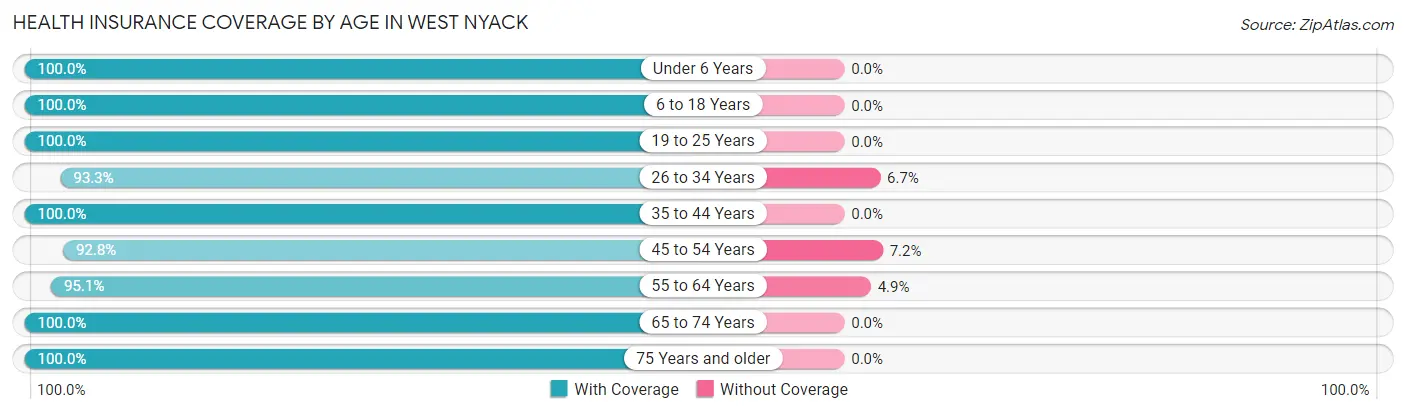
| Age Bracket | With Coverage | Without Coverage |
| Under 6 Years | 298 (100.0%) | 0 (0.0%) |
| 6 to 18 Years | 700 (100.0%) | 0 (0.0%) |
| 19 to 25 Years | 178 (100.0%) | 0 (0.0%) |
| 26 to 34 Years | 182 (93.3%) | 13 (6.7%) |
| 35 to 44 Years | 337 (100.0%) | 0 (0.0%) |
| 45 to 54 Years | 519 (92.8%) | 40 (7.2%) |
| 55 to 64 Years | 578 (95.1%) | 30 (4.9%) |
| 65 to 74 Years | 588 (100.0%) | 0 (0.0%) |
| 75 Years and older | 305 (100.0%) | 0 (0.0%) |
| Total | 3,685 (97.8%) | 83 (2.2%) |
Health Insurance Coverage by Citizenship Status in West Nyack
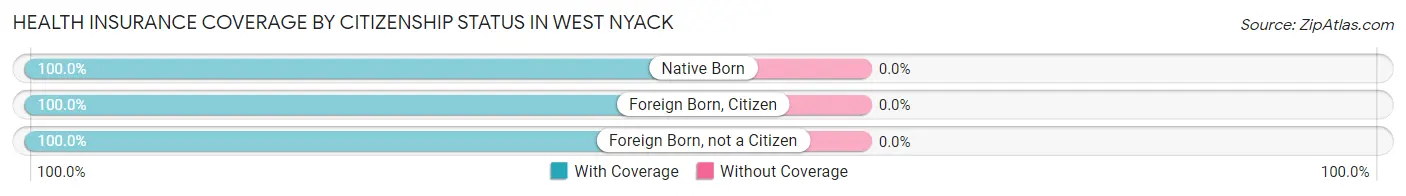
| Citizenship Status | With Coverage | Without Coverage |
| Native Born | 298 (100.0%) | 0 (0.0%) |
| Foreign Born, Citizen | 700 (100.0%) | 0 (0.0%) |
| Foreign Born, not a Citizen | 178 (100.0%) | 0 (0.0%) |
Health Insurance Coverage by Household Income in West Nyack
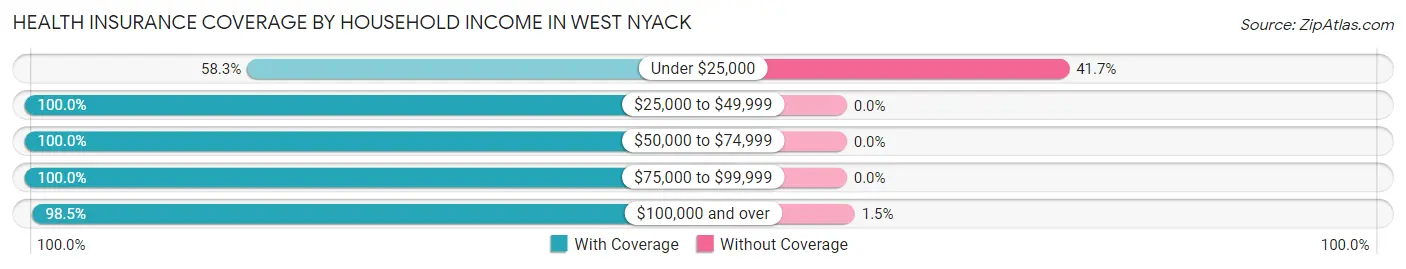
| Household Income | With Coverage | Without Coverage |
| Under $25,000 | 56 (58.3%) | 40 (41.7%) |
| $25,000 to $49,999 | 45 (100.0%) | 0 (0.0%) |
| $50,000 to $74,999 | 417 (100.0%) | 0 (0.0%) |
| $75,000 to $99,999 | 306 (100.0%) | 0 (0.0%) |
| $100,000 and over | 2,821 (98.5%) | 43 (1.5%) |
Public vs Private Health Insurance Coverage by Age in West Nyack
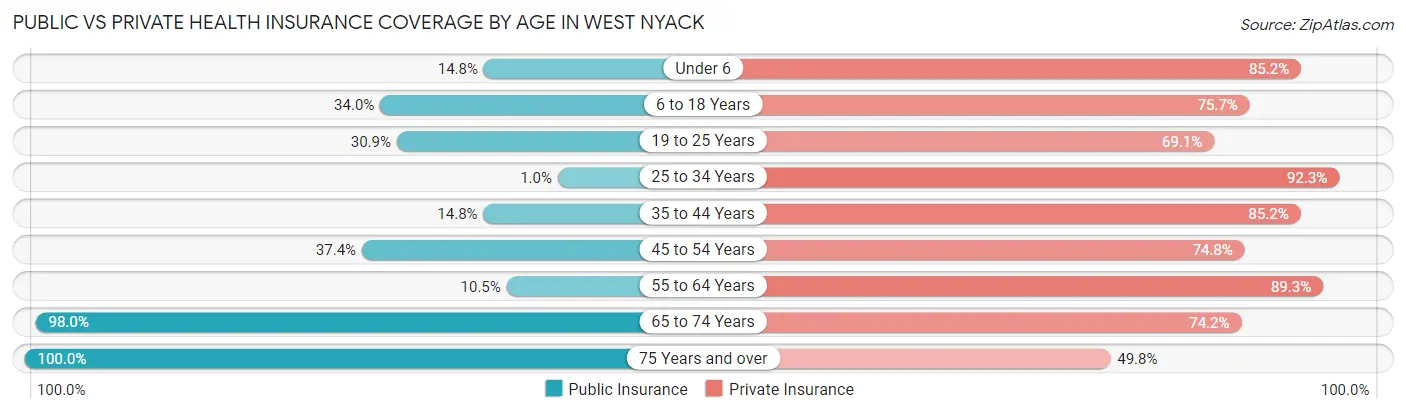
| Age Bracket | Public Insurance | Private Insurance |
| Under 6 | 44 (14.8%) | 254 (85.2%) |
| 6 to 18 Years | 238 (34.0%) | 530 (75.7%) |
| 19 to 25 Years | 55 (30.9%) | 123 (69.1%) |
| 25 to 34 Years | 2 (1.0%) | 180 (92.3%) |
| 35 to 44 Years | 50 (14.8%) | 287 (85.2%) |
| 45 to 54 Years | 209 (37.4%) | 418 (74.8%) |
| 55 to 64 Years | 64 (10.5%) | 543 (89.3%) |
| 65 to 74 Years | 576 (98.0%) | 436 (74.2%) |
| 75 Years and over | 305 (100.0%) | 152 (49.8%) |
| Total | 1,543 (40.9%) | 2,923 (77.6%) |
Disability Status by Sex by Age in West Nyack
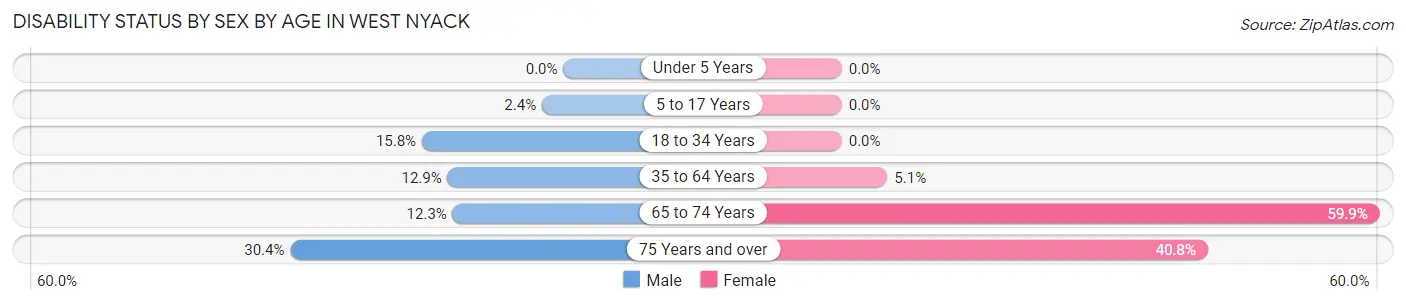
| Age Bracket | Male | Female |
| Under 5 Years | 0 (0.0%) | 0 (0.0%) |
| 5 to 17 Years | 5 (2.4%) | 0 (0.0%) |
| 18 to 34 Years | 46 (15.8%) | 0 (0.0%) |
| 35 to 64 Years | 100 (12.9%) | 37 (5.1%) |
| 65 to 74 Years | 27 (12.3%) | 221 (59.9%) |
| 75 Years and over | 45 (30.4%) | 64 (40.8%) |
Disability Class by Sex by Age in West Nyack
Disability Class: Hearing Difficulty
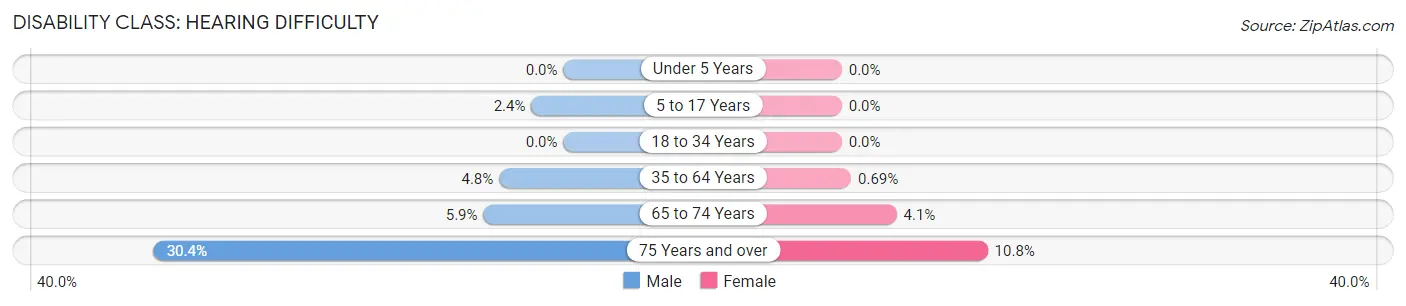
| Age Bracket | Male | Female |
| Under 5 Years | 0 (0.0%) | 0 (0.0%) |
| 5 to 17 Years | 5 (2.4%) | 0 (0.0%) |
| 18 to 34 Years | 0 (0.0%) | 0 (0.0%) |
| 35 to 64 Years | 37 (4.8%) | 5 (0.7%) |
| 65 to 74 Years | 13 (5.9%) | 15 (4.1%) |
| 75 Years and over | 45 (30.4%) | 17 (10.8%) |
Disability Class: Vision Difficulty
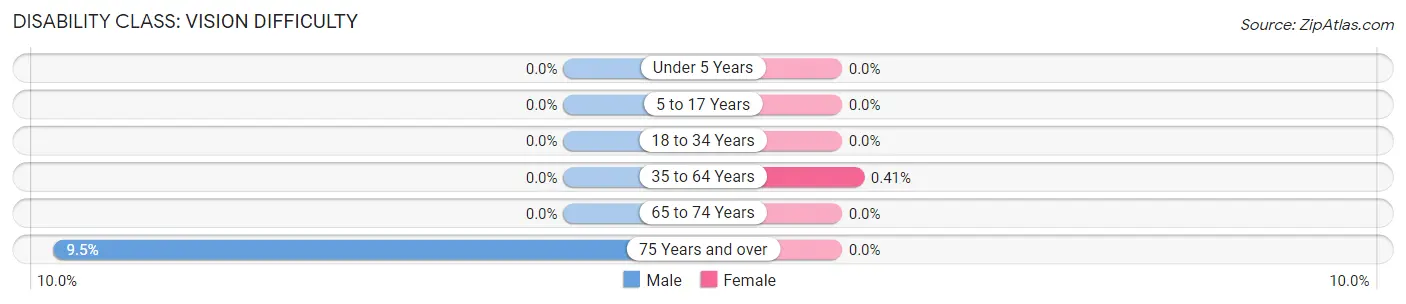
| Age Bracket | Male | Female |
| Under 5 Years | 0 (0.0%) | 0 (0.0%) |
| 5 to 17 Years | 0 (0.0%) | 0 (0.0%) |
| 18 to 34 Years | 0 (0.0%) | 0 (0.0%) |
| 35 to 64 Years | 0 (0.0%) | 3 (0.4%) |
| 65 to 74 Years | 0 (0.0%) | 0 (0.0%) |
| 75 Years and over | 14 (9.5%) | 0 (0.0%) |
Disability Class: Cognitive Difficulty
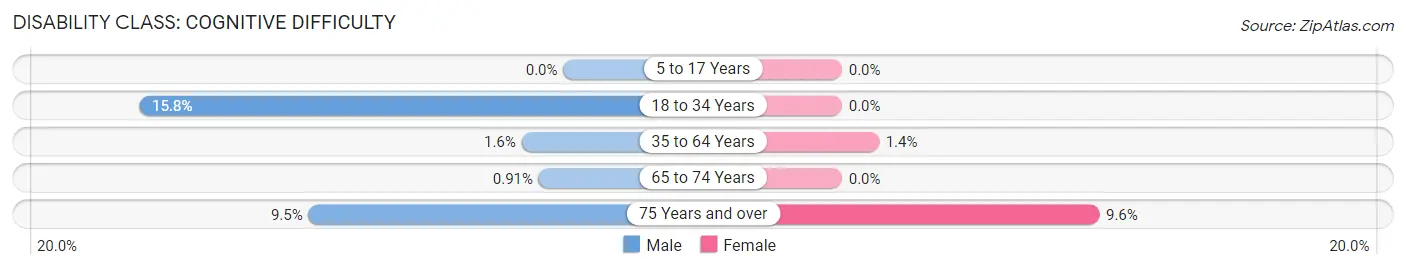
| Age Bracket | Male | Female |
| 5 to 17 Years | 0 (0.0%) | 0 (0.0%) |
| 18 to 34 Years | 46 (15.8%) | 0 (0.0%) |
| 35 to 64 Years | 12 (1.5%) | 10 (1.4%) |
| 65 to 74 Years | 2 (0.9%) | 0 (0.0%) |
| 75 Years and over | 14 (9.5%) | 15 (9.6%) |
Disability Class: Ambulatory Difficulty
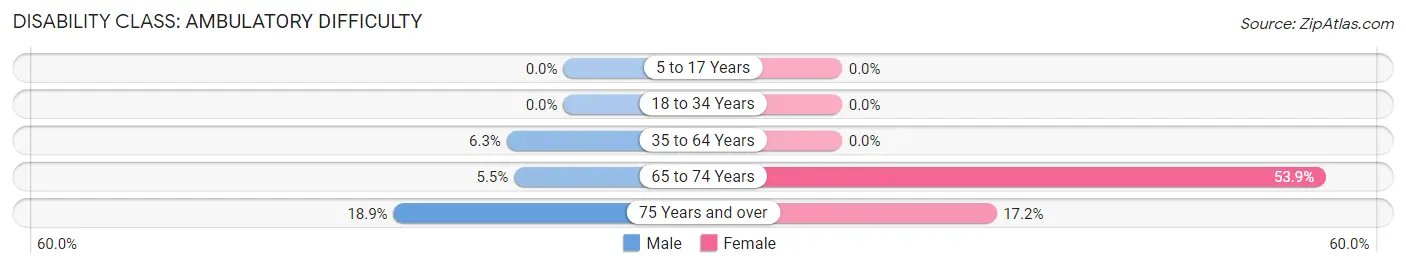
| Age Bracket | Male | Female |
| 5 to 17 Years | 0 (0.0%) | 0 (0.0%) |
| 18 to 34 Years | 0 (0.0%) | 0 (0.0%) |
| 35 to 64 Years | 49 (6.3%) | 0 (0.0%) |
| 65 to 74 Years | 12 (5.5%) | 199 (53.9%) |
| 75 Years and over | 28 (18.9%) | 27 (17.2%) |
Disability Class: Self-Care Difficulty
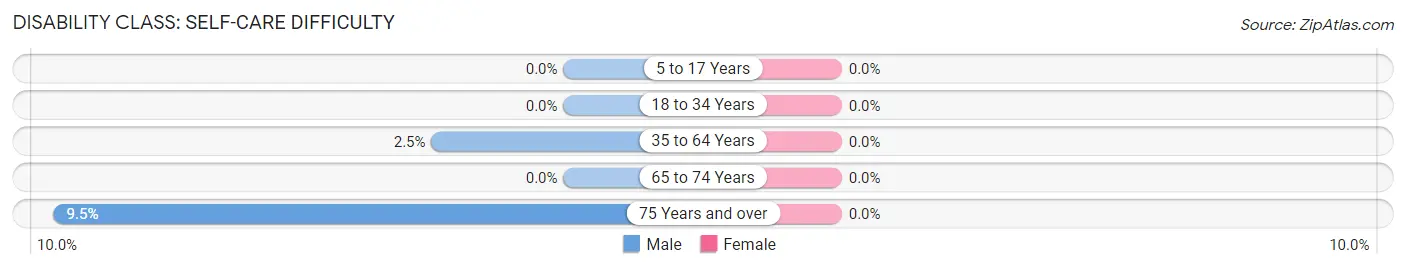
| Age Bracket | Male | Female |
| 5 to 17 Years | 0 (0.0%) | 0 (0.0%) |
| 18 to 34 Years | 0 (0.0%) | 0 (0.0%) |
| 35 to 64 Years | 19 (2.5%) | 0 (0.0%) |
| 65 to 74 Years | 0 (0.0%) | 0 (0.0%) |
| 75 Years and over | 14 (9.5%) | 0 (0.0%) |
Technology Access in West Nyack
Computing Device Access in West Nyack
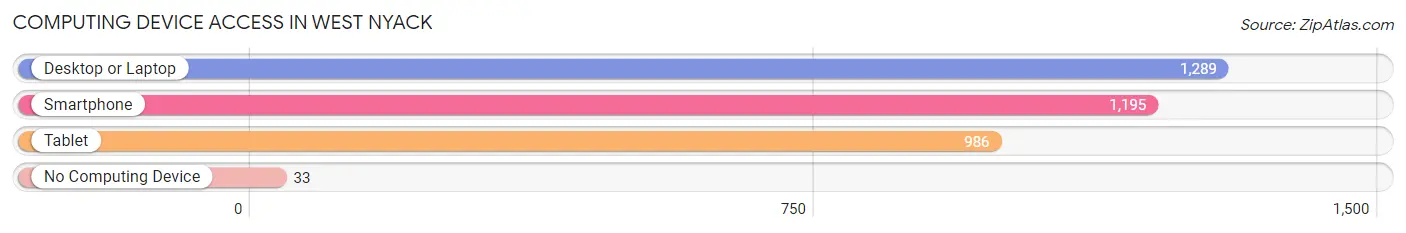
| Device Type | # Households | % Households |
| Desktop or Laptop | 1,289 | 95.6% |
| Smartphone | 1,195 | 88.6% |
| Tablet | 986 | 73.1% |
| No Computing Device | 33 | 2.5% |
| Total | 1,349 | 100.0% |
Internet Access in West Nyack
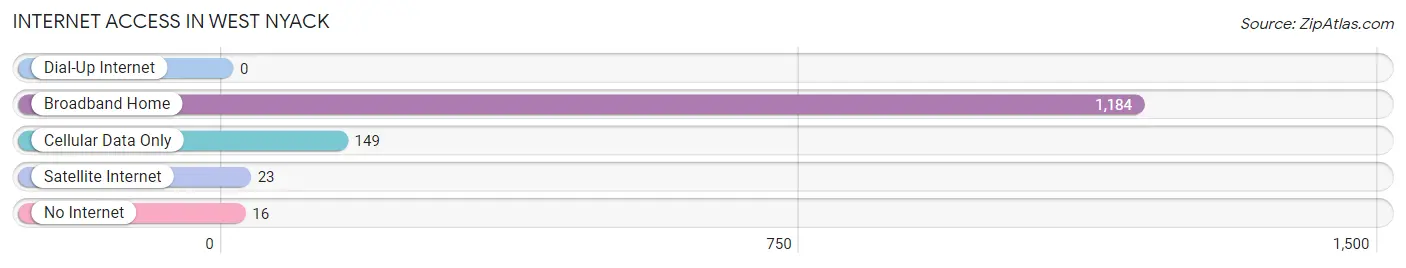
| Internet Type | # Households | % Households |
| Dial-Up Internet | 0 | 0.0% |
| Broadband Home | 1,184 | 87.8% |
| Cellular Data Only | 149 | 11.1% |
| Satellite Internet | 23 | 1.7% |
| No Internet | 16 | 1.2% |
| Total | 1,349 | 100.0% |
West Nyack Summary
History
West Nyack is a hamlet located in the town of Clarkstown in Rockland County, New York. It is located about 25 miles north of New York City. The hamlet was first settled in the late 1700s by Dutch and English settlers. The area was originally known as “Nyack”, but the name was changed to “West Nyack” in 1845 to distinguish it from the nearby village of Nyack.
The hamlet was primarily an agricultural community until the mid-1800s when the New York and Erie Railroad was built through the area. This allowed for the development of industry and commerce in the area. The hamlet grew rapidly in the late 1800s and early 1900s, with the construction of several factories and businesses. The hamlet was also home to a number of summer resorts, which attracted visitors from New York City and other parts of the country.
In the 1950s, West Nyack began to experience a period of suburbanization. The hamlet was transformed from a rural community to a suburban one, with the construction of new homes and businesses. The hamlet also experienced a population boom, with the population increasing from 2,000 in 1950 to over 10,000 in 2000.
Geography
West Nyack is located in the town of Clarkstown in Rockland County, New York. It is located about 25 miles north of New York City. The hamlet is situated on the western bank of the Hudson River, and is bordered by the hamlets of Valley Cottage to the north, Nanuet to the east, and Blauvelt to the south. The hamlet is also bordered by the Palisades Interstate Park to the west.
The hamlet has a total area of 4.2 square miles, of which 4.1 square miles is land and 0.1 square miles is water. The terrain of the hamlet is mostly flat, with some hills in the northern part of the hamlet. The hamlet is located in the Hudson Valley region, and is part of the New York metropolitan area.
Economy
West Nyack is primarily a residential community, with a few small businesses located in the hamlet. The hamlet is home to a number of retail stores, including a Walmart Supercenter, a Target, and a Home Depot. The hamlet is also home to a number of restaurants, including Applebee’s, Olive Garden, and Red Lobster.
The hamlet is also home to a number of corporate offices, including the headquarters of the pharmaceutical company Pfizer. The hamlet is also home to a number of medical offices, including a hospital and a number of medical clinics.
Demographics
As of the 2010 census, the population of West Nyack was 10,845. The population is primarily white (87.3%), with a small percentage of African Americans (4.2%), Asians (3.2%), and Hispanics (2.7%). The median household income in the hamlet is $90,845, and the median home value is $521,000. The hamlet has a high rate of homeownership (83.3%), and a low rate of poverty (4.3%).
Conclusion
West Nyack is a hamlet located in the town of Clarkstown in Rockland County, New York. It is located about 25 miles north of New York City. The hamlet was first settled in the late 1700s by Dutch and English settlers, and was primarily an agricultural community until the mid-1800s. The hamlet experienced a period of suburbanization in the 1950s, and has since become a primarily residential community. The population of West Nyack is 10,845, and the median household income is $90,845. The hamlet is home to a number of retail stores, corporate offices, and medical offices.
Common Questions
What is Per Capita Income in West Nyack?
Per Capita income in West Nyack is $66,199.
What is the Median Family Income in West Nyack?
Median Family Income in West Nyack is $181,250.
What is the Median Household income in West Nyack?
Median Household Income in West Nyack is $160,020.
What is Income or Wage Gap in West Nyack?
Income or Wage Gap in West Nyack is 41.1%.
Women in West Nyack earn 58.9 cents for every dollar earned by a man.
What is Inequality or Gini Index in West Nyack?
Inequality or Gini Index in West Nyack is 0.41.
What is the Total Population of West Nyack?
Total Population of West Nyack is 3,768.
What is the Total Male Population of West Nyack?
Total Male Population of West Nyack is 1,697.
What is the Total Female Population of West Nyack?
Total Female Population of West Nyack is 2,071.
What is the Ratio of Males per 100 Females in West Nyack?
There are 81.94 Males per 100 Females in West Nyack.
What is the Ratio of Females per 100 Males in West Nyack?
There are 122.04 Females per 100 Males in West Nyack.
What is the Median Population Age in West Nyack?
Median Population Age in West Nyack is 48.4 Years.
What is the Average Family Size in West Nyack
Average Family Size in West Nyack is 3.4 People.
What is the Average Household Size in West Nyack
Average Household Size in West Nyack is 2.8 People.
How Large is the Labor Force in West Nyack?
There are 1,648 People in the Labor Forcein in West Nyack.
What is the Percentage of People in the Labor Force in West Nyack?
52.7% of People are in the Labor Force in West Nyack.
What is the Unemployment Rate in West Nyack?
Unemployment Rate in West Nyack is 3.2%.