Perry, FL Map & Demographics
Perry Map
Perry Overview
$24,254
PER CAPITA INCOME
$51,581
AVG FAMILY INCOME
$45,833
AVG HOUSEHOLD INCOME
30.0%
WAGE / INCOME GAP [ % ]
70.0¢/ $1
WAGE / INCOME GAP [ $ ]
0.42
INEQUALITY / GINI INDEX
6,879
TOTAL POPULATION
3,206
MALE POPULATION
3,673
FEMALE POPULATION
87.29
MALES / 100 FEMALES
114.57
FEMALES / 100 MALES
38.3
MEDIAN AGE
3.3
AVG FAMILY SIZE
2.8
AVG HOUSEHOLD SIZE
2,880
LABOR FORCE [ PEOPLE ]
56.2%
PERCENT IN LABOR FORCE
8.1%
UNEMPLOYMENT RATE
Perry Area Codes
Income in Perry
Income Overview in Perry
Per Capita Income in Perry is $24,254, while median incomes of families and households are $51,581 and $45,833 respectively.
| Characteristic | Number | Measure |
| Per Capita Income | 6,879 | $24,254 |
| Median Family Income | 1,685 | $51,581 |
| Mean Family Income | 1,685 | $70,278 |
| Median Household Income | 2,372 | $45,833 |
| Mean Household Income | 2,372 | $62,724 |
| Income Deficit | 1,685 | $0 |
| Wage / Income Gap (%) | 6,879 | 30.00% |
| Wage / Income Gap ($) | 6,879 | 70.00¢ per $1 |
| Gini / Inequality Index | 6,879 | 0.42 |
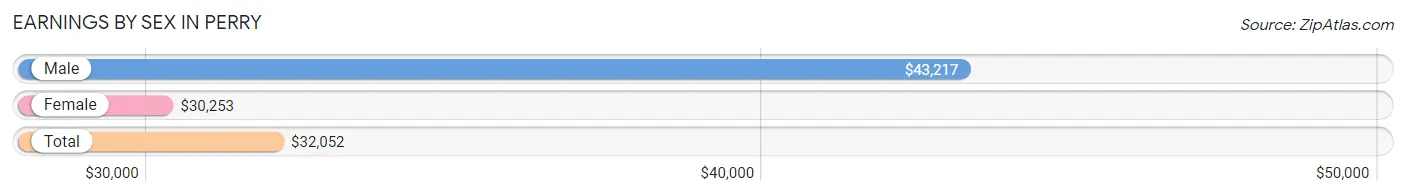
Earnings by Sex in Perry
Average Earnings in Perry are $32,052, $43,217 for men and $30,253 for women, a difference of 30.0%.
| Sex | Number | Average Earnings |
| Male | 1,277 (45.2%) | $43,217 |
| Female | 1,550 (54.8%) | $30,253 |
| Total | 2,827 (100.0%) | $32,052 |
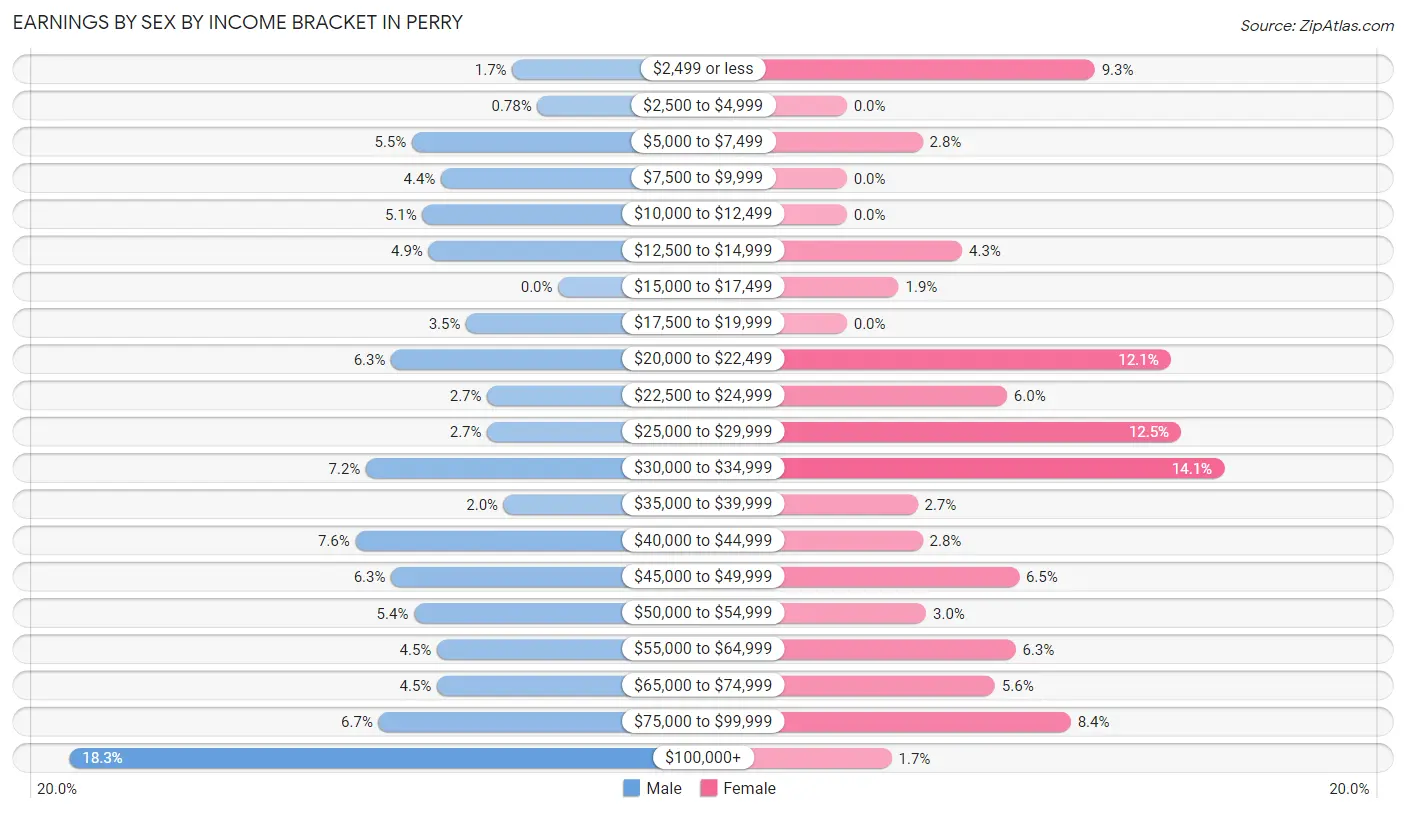
Earnings by Sex by Income Bracket in Perry
The most common earnings brackets in Perry are $100,000+ for men (234 | 18.3%) and $30,000 to $34,999 for women (219 | 14.1%).
| Income | Male | Female |
| $2,499 or less | 22 (1.7%) | 144 (9.3%) |
| $2,500 to $4,999 | 10 (0.8%) | 0 (0.0%) |
| $5,000 to $7,499 | 70 (5.5%) | 44 (2.8%) |
| $7,500 to $9,999 | 56 (4.4%) | 0 (0.0%) |
| $10,000 to $12,499 | 65 (5.1%) | 0 (0.0%) |
| $12,500 to $14,999 | 62 (4.9%) | 67 (4.3%) |
| $15,000 to $17,499 | 0 (0.0%) | 30 (1.9%) |
| $17,500 to $19,999 | 44 (3.5%) | 0 (0.0%) |
| $20,000 to $22,499 | 80 (6.3%) | 188 (12.1%) |
| $22,500 to $24,999 | 34 (2.7%) | 93 (6.0%) |
| $25,000 to $29,999 | 34 (2.7%) | 194 (12.5%) |
| $30,000 to $34,999 | 92 (7.2%) | 219 (14.1%) |
| $35,000 to $39,999 | 26 (2.0%) | 41 (2.6%) |
| $40,000 to $44,999 | 97 (7.6%) | 44 (2.8%) |
| $45,000 to $49,999 | 80 (6.3%) | 100 (6.5%) |
| $50,000 to $54,999 | 69 (5.4%) | 46 (3.0%) |
| $55,000 to $64,999 | 58 (4.5%) | 98 (6.3%) |
| $65,000 to $74,999 | 58 (4.5%) | 86 (5.6%) |
| $75,000 to $99,999 | 86 (6.7%) | 130 (8.4%) |
| $100,000+ | 234 (18.3%) | 26 (1.7%) |
| Total | 1,277 (100.0%) | 1,550 (100.0%) |
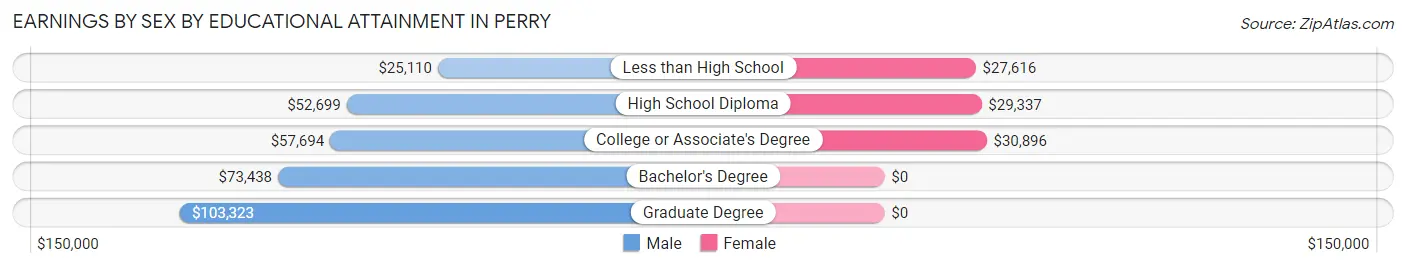
Earnings by Sex by Educational Attainment in Perry
Average earnings in Perry are $46,766 for men and $31,233 for women, a difference of 33.2%. Men with an educational attainment of graduate degree enjoy the highest average annual earnings of $103,323, while those with less than high school education earn the least with $25,110. Women with an educational attainment of college or associate's degree earn the most with the average annual earnings of $30,896, while those with less than high school education have the smallest earnings of $27,616.
| Educational Attainment | Male Income | Female Income |
| Less than High School | $25,110 | $27,616 |
| High School Diploma | $52,699 | $29,337 |
| College or Associate's Degree | $57,694 | $30,896 |
| Bachelor's Degree | $73,438 | $0 |
| Graduate Degree | $103,323 | $0 |
| Total | $46,766 | $31,233 |
Family Income in Perry
Family Income Brackets in Perry
According to the Perry family income data, there are 340 families falling into the $50,000 to $74,999 income range, which is the most common income bracket and makes up 20.2% of all families. Conversely, the less than $10,000 income bracket is the least frequent group with only 30 families (1.8%) belonging to this category.
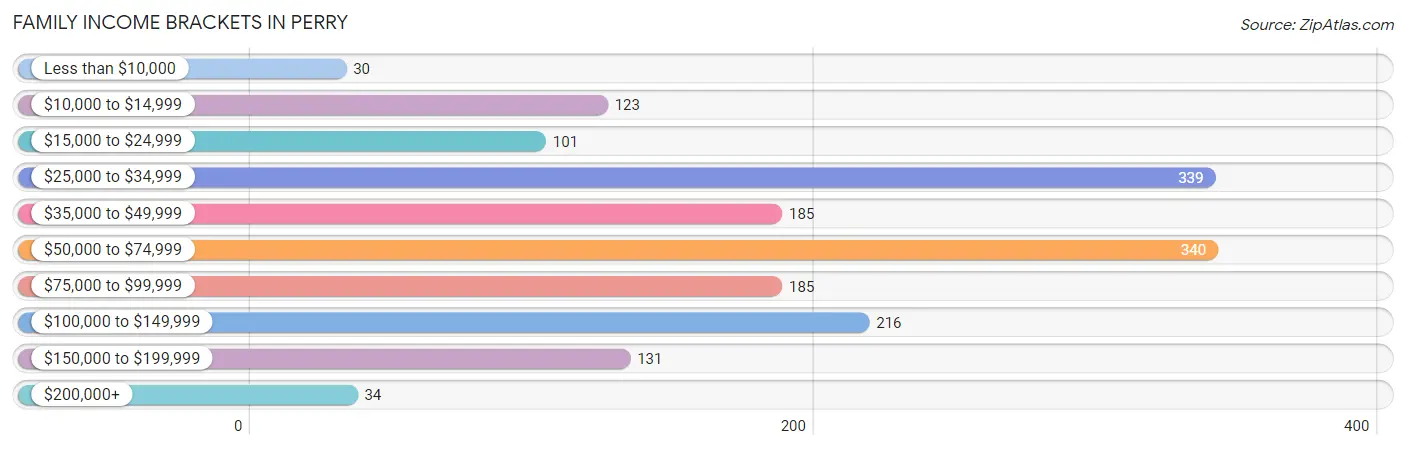
| Income Bracket | # Families | % Families |
| Less than $10,000 | 30 | 1.8% |
| $10,000 to $14,999 | 123 | 7.3% |
| $15,000 to $24,999 | 101 | 6.0% |
| $25,000 to $34,999 | 339 | 20.1% |
| $35,000 to $49,999 | 185 | 11.0% |
| $50,000 to $74,999 | 340 | 20.2% |
| $75,000 to $99,999 | 185 | 11.0% |
| $100,000 to $149,999 | 216 | 12.8% |
| $150,000 to $199,999 | 131 | 7.8% |
| $200,000+ | 34 | 2.0% |
Family Income by Famaliy Size in Perry
5-person families (75 | 4.4%) account for the highest median family income in Perry with $147,713 per family, while 5-person families (75 | 4.4%) have the highest median income of $29,543 per family member.
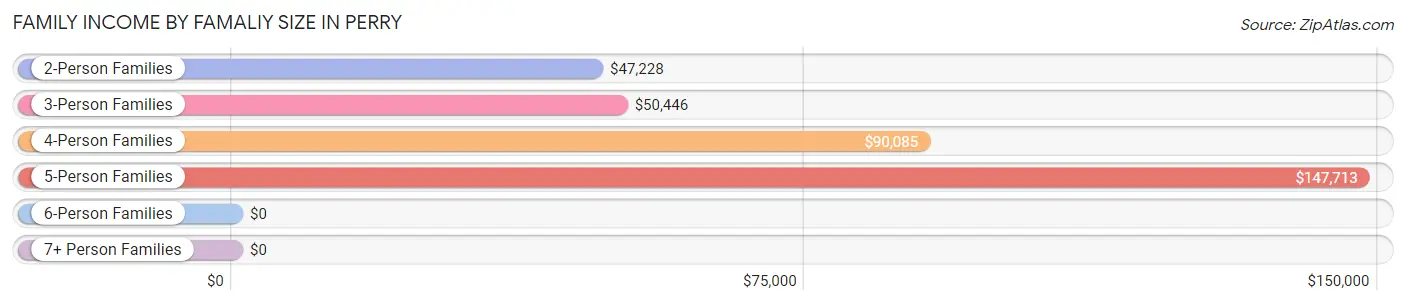
| Income Bracket | # Families | Median Income |
| 2-Person Families | 977 (58.0%) | $47,228 |
| 3-Person Families | 267 (15.9%) | $50,446 |
| 4-Person Families | 330 (19.6%) | $90,085 |
| 5-Person Families | 75 (4.4%) | $147,713 |
| 6-Person Families | 0 (0.0%) | $0 |
| 7+ Person Families | 36 (2.1%) | $0 |
| Total | 1,685 (100.0%) | $51,581 |
Family Income by Number of Earners in Perry
The median family income in Perry is $51,581, with families comprising 3+ earners (119) having the highest median family income of $148,567, while families with no earners (403) have the lowest median family income of $32,135, accounting for 7.1% and 23.9% of families, respectively.
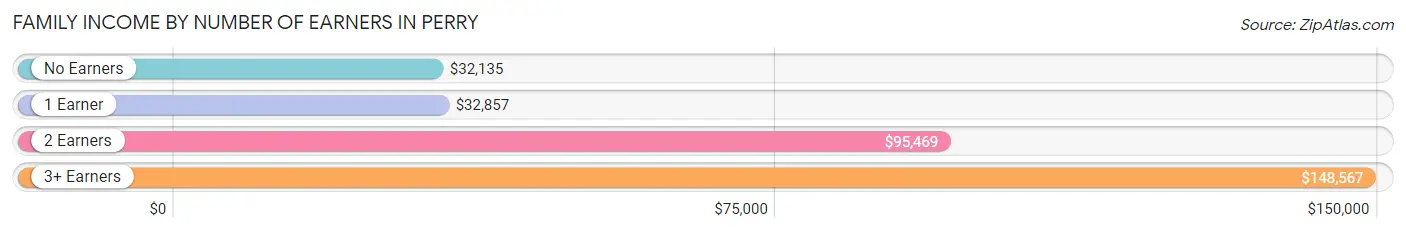
| Number of Earners | # Families | Median Income |
| No Earners | 403 (23.9%) | $32,135 |
| 1 Earner | 626 (37.1%) | $32,857 |
| 2 Earners | 537 (31.9%) | $95,469 |
| 3+ Earners | 119 (7.1%) | $148,567 |
| Total | 1,685 (100.0%) | $51,581 |
Household Income in Perry
Household Income Brackets in Perry
With 448 households falling in the category, the $25,000 to $34,999 income range is the most frequent in Perry, accounting for 18.9% of all households. In contrast, only 31 households (1.3%) fall into the less than $10,000 income bracket, making it the least populous group.
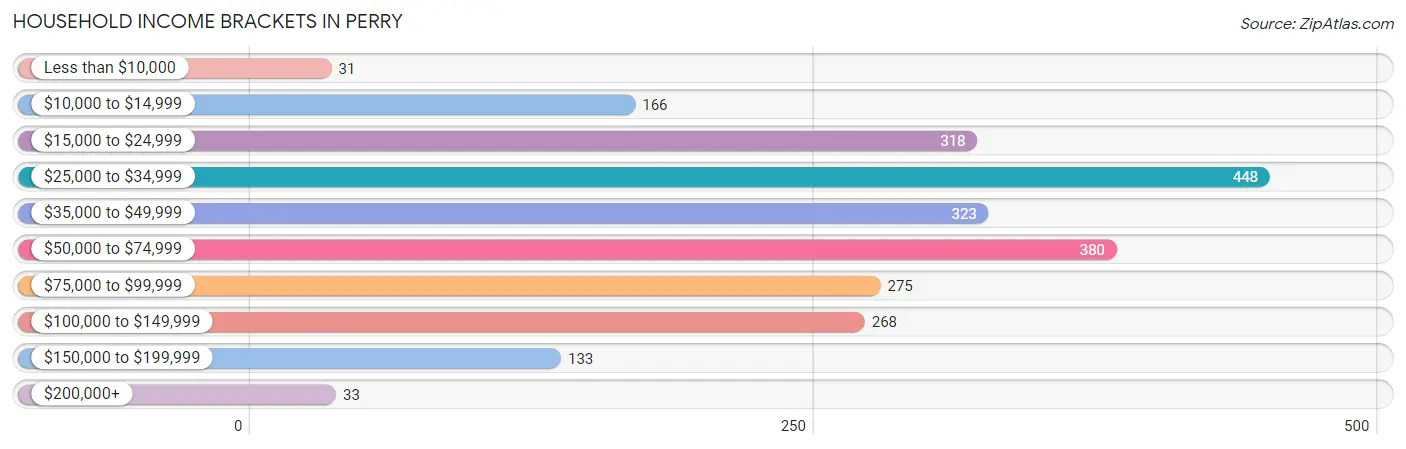
| Income Bracket | # Households | % Households |
| Less than $10,000 | 31 | 1.3% |
| $10,000 to $14,999 | 166 | 7.0% |
| $15,000 to $24,999 | 318 | 13.4% |
| $25,000 to $34,999 | 448 | 18.9% |
| $35,000 to $49,999 | 323 | 13.6% |
| $50,000 to $74,999 | 380 | 16.0% |
| $75,000 to $99,999 | 275 | 11.6% |
| $100,000 to $149,999 | 268 | 11.3% |
| $150,000 to $199,999 | 133 | 5.6% |
| $200,000+ | 33 | 1.4% |
Household Income by Householder Age in Perry
The median household income in Perry is $45,833, with the highest median household income of $70,076 found in the 25 to 44 years age bracket for the primary householder. A total of 578 households (24.4%) fall into this category. Meanwhile, the 65+ years age bracket for the primary householder has the lowest median household income of $30,546, with 774 households (32.6%) in this group.
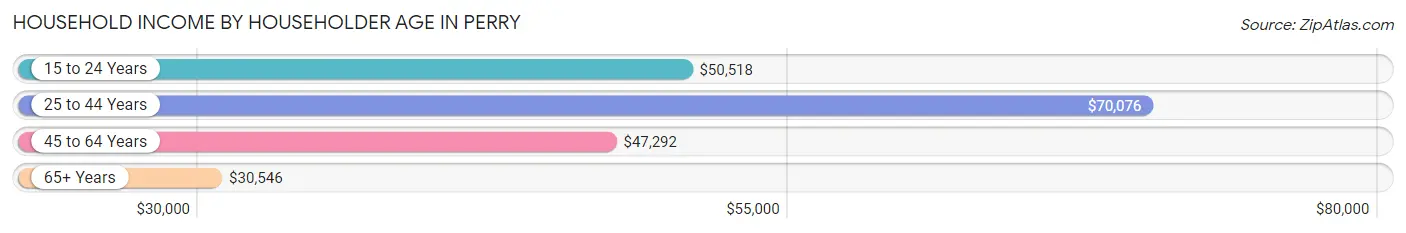
| Income Bracket | # Households | Median Income |
| 15 to 24 Years | 97 (4.1%) | $50,518 |
| 25 to 44 Years | 578 (24.4%) | $70,076 |
| 45 to 64 Years | 923 (38.9%) | $47,292 |
| 65+ Years | 774 (32.6%) | $30,546 |
| Total | 2,372 (100.0%) | $45,833 |
Poverty in Perry
Income Below Poverty by Sex and Age in Perry
With 19.0% poverty level for males and 12.0% for females among the residents of Perry, 5 year old males and 6 to 11 year old females are the most vulnerable to poverty, with 4 males (100.0%) and 92 females (20.8%) in their respective age groups living below the poverty level.
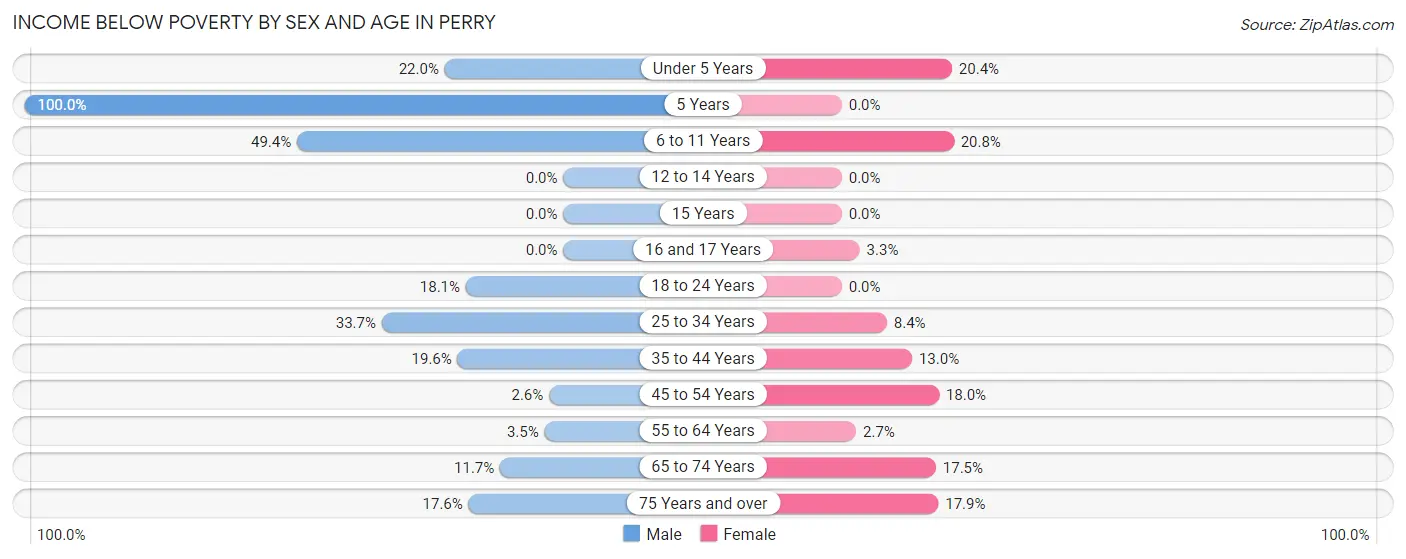
| Age Bracket | Male | Female |
| Under 5 Years | 24 (22.0%) | 28 (20.4%) |
| 5 Years | 4 (100.0%) | 0 (0.0%) |
| 6 to 11 Years | 262 (49.4%) | 92 (20.8%) |
| 12 to 14 Years | 0 (0.0%) | 0 (0.0%) |
| 15 Years | 0 (0.0%) | 0 (0.0%) |
| 16 and 17 Years | 0 (0.0%) | 6 (3.3%) |
| 18 to 24 Years | 42 (18.1%) | 0 (0.0%) |
| 25 to 34 Years | 122 (33.7%) | 32 (8.4%) |
| 35 to 44 Years | 43 (19.6%) | 49 (13.0%) |
| 45 to 54 Years | 13 (2.6%) | 86 (18.0%) |
| 55 to 64 Years | 13 (3.5%) | 10 (2.6%) |
| 65 to 74 Years | 27 (11.7%) | 77 (17.5%) |
| 75 Years and over | 29 (17.6%) | 48 (17.9%) |
| Total | 579 (19.0%) | 428 (12.0%) |
Income Above Poverty by Sex and Age in Perry
According to the poverty statistics in Perry, males aged 12 to 14 years and females aged 5 years are the age groups that are most secure financially, with 100.0% of males and 100.0% of females in these age groups living above the poverty line.
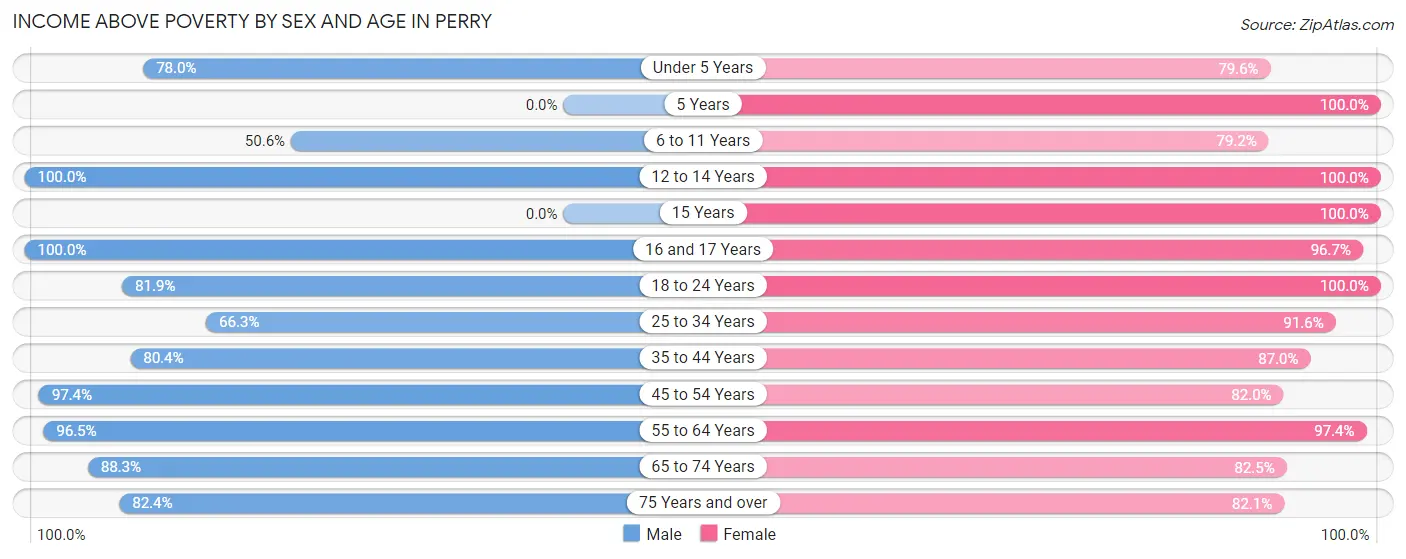
| Age Bracket | Male | Female |
| Under 5 Years | 85 (78.0%) | 109 (79.6%) |
| 5 Years | 0 (0.0%) | 79 (100.0%) |
| 6 to 11 Years | 268 (50.6%) | 351 (79.2%) |
| 12 to 14 Years | 200 (100.0%) | 152 (100.0%) |
| 15 Years | 0 (0.0%) | 66 (100.0%) |
| 16 and 17 Years | 128 (100.0%) | 175 (96.7%) |
| 18 to 24 Years | 190 (81.9%) | 183 (100.0%) |
| 25 to 34 Years | 240 (66.3%) | 351 (91.6%) |
| 35 to 44 Years | 176 (80.4%) | 327 (87.0%) |
| 45 to 54 Years | 479 (97.4%) | 391 (82.0%) |
| 55 to 64 Years | 359 (96.5%) | 367 (97.4%) |
| 65 to 74 Years | 203 (88.3%) | 364 (82.5%) |
| 75 Years and over | 136 (82.4%) | 220 (82.1%) |
| Total | 2,464 (81.0%) | 3,135 (88.0%) |
Income Below Poverty Among Married-Couple Families in Perry
The poverty statistics for married-couple families in Perry show that 7.0% or 63 of the total 896 families live below the poverty line. Families with no children have the highest poverty rate of 9.6%, comprising of 50 families. On the other hand, families with 3 or 4 children have the lowest poverty rate of 0.0%, which includes 0 families.
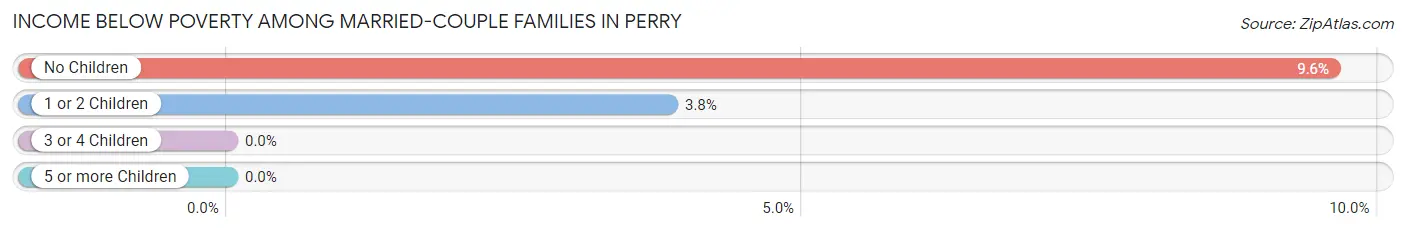
| Children | Above Poverty | Below Poverty |
| No Children | 471 (90.4%) | 50 (9.6%) |
| 1 or 2 Children | 326 (96.2%) | 13 (3.8%) |
| 3 or 4 Children | 36 (100.0%) | 0 (0.0%) |
| 5 or more Children | 0 (0.0%) | 0 (0.0%) |
| Total | 833 (93.0%) | 63 (7.0%) |
Income Below Poverty Among Single-Parent Households in Perry
According to the poverty data in Perry, 32.5% or 40 single-father households and 23.7% or 158 single-mother households are living below the poverty line. Among single-father households, those with 1 or 2 children have the highest poverty rate, with 40 households (49.4%) experiencing poverty. Likewise, among single-mother households, those with 3 or 4 children have the highest poverty rate, with 60 households (57.7%) falling below the poverty line.
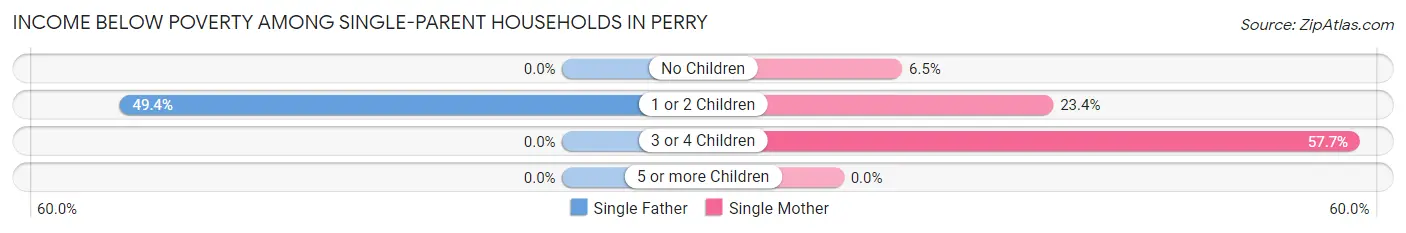
| Children | Single Father | Single Mother |
| No Children | 0 (0.0%) | 13 (6.5%) |
| 1 or 2 Children | 40 (49.4%) | 85 (23.4%) |
| 3 or 4 Children | 0 (0.0%) | 60 (57.7%) |
| 5 or more Children | 0 (0.0%) | 0 (0.0%) |
| Total | 40 (32.5%) | 158 (23.7%) |
Income Below Poverty Among Married-Couple vs Single-Parent Households in Perry
The poverty data for Perry shows that 63 of the married-couple family households (7.0%) and 198 of the single-parent households (25.1%) are living below the poverty level. Within the married-couple family households, those with no children have the highest poverty rate, with 50 households (9.6%) falling below the poverty line. Among the single-parent households, those with 3 or 4 children have the highest poverty rate, with 60 household (57.7%) living below poverty.
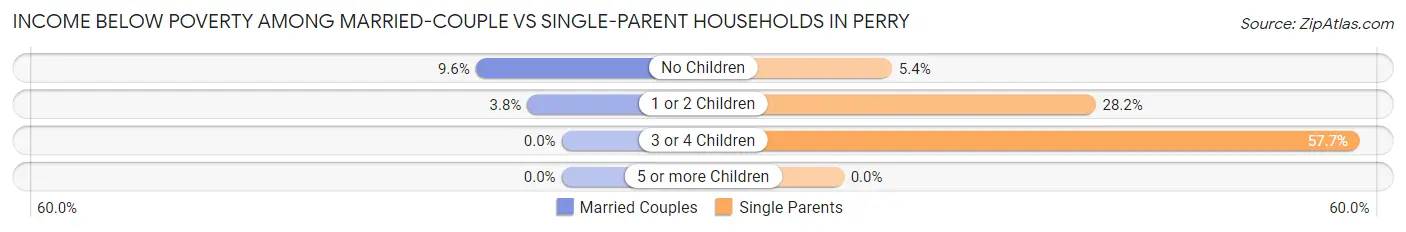
| Children | Married-Couple Families | Single-Parent Households |
| No Children | 50 (9.6%) | 13 (5.4%) |
| 1 or 2 Children | 13 (3.8%) | 125 (28.1%) |
| 3 or 4 Children | 0 (0.0%) | 60 (57.7%) |
| 5 or more Children | 0 (0.0%) | 0 (0.0%) |
| Total | 63 (7.0%) | 198 (25.1%) |
Race in Perry
The most populous races in Perry are White / Caucasian (4,004 | 58.2%), Black / African American (2,667 | 38.8%), and Hispanic or Latino (168 | 2.4%).
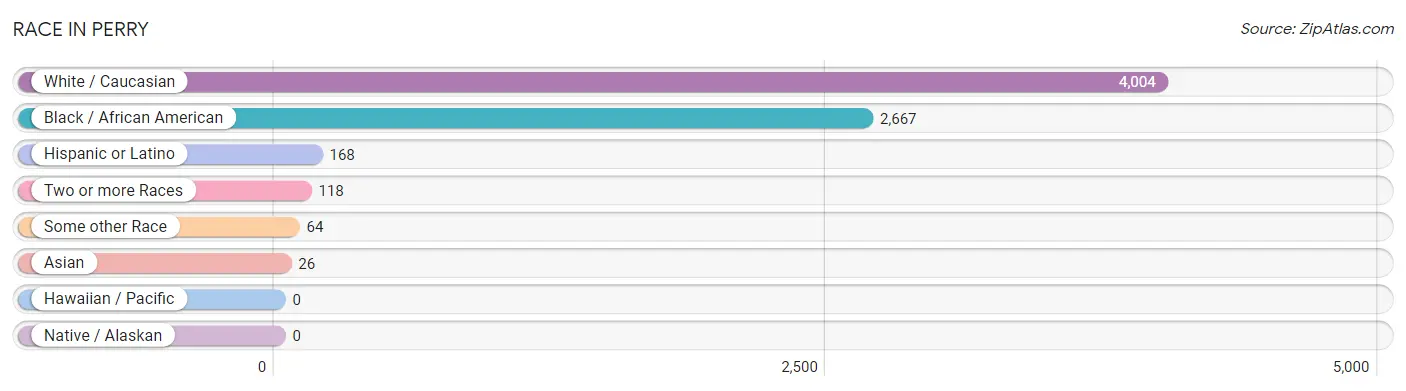
| Race | # Population | % Population |
| Asian | 26 | 0.4% |
| Black / African American | 2,667 | 38.8% |
| Hawaiian / Pacific | 0 | 0.0% |
| Hispanic or Latino | 168 | 2.4% |
| Native / Alaskan | 0 | 0.0% |
| White / Caucasian | 4,004 | 58.2% |
| Two or more Races | 118 | 1.7% |
| Some other Race | 64 | 0.9% |
| Total | 6,879 | 100.0% |
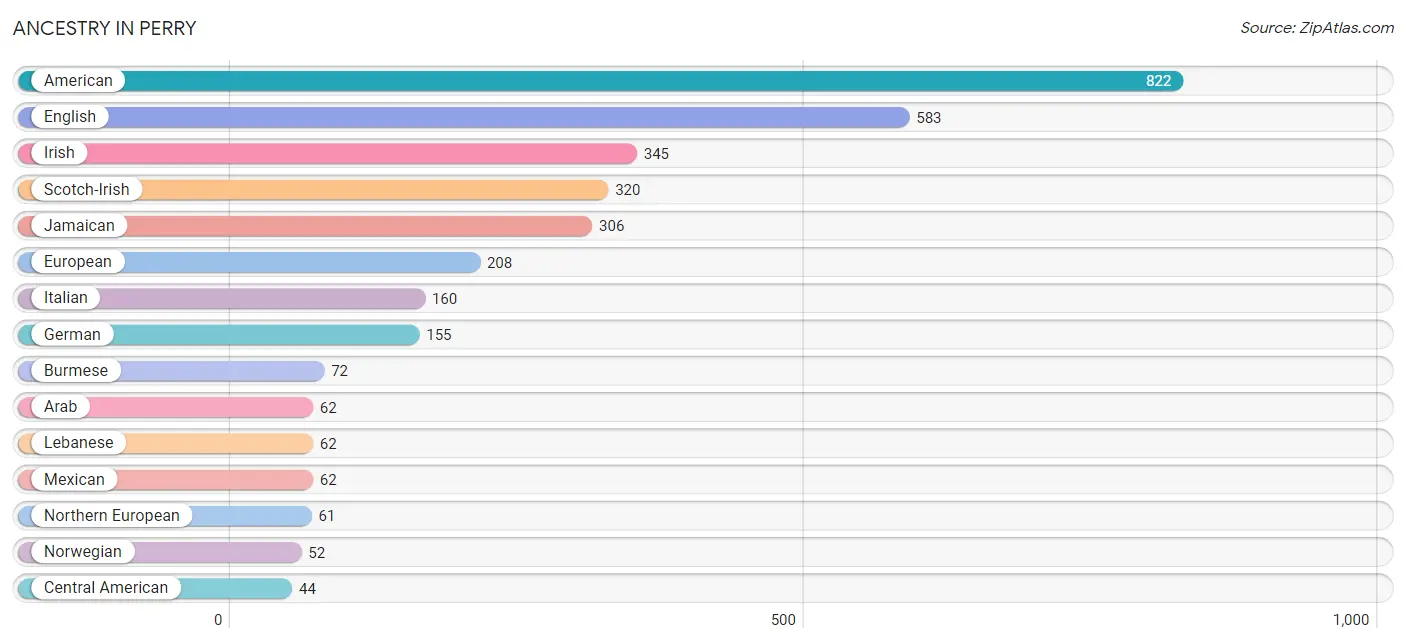
Ancestry in Perry
The most populous ancestries reported in Perry are American (822 | 11.9%), English (583 | 8.5%), Irish (345 | 5.0%), Scotch-Irish (320 | 4.6%), and Jamaican (306 | 4.4%), together accounting for 34.5% of all Perry residents.
| Ancestry | # Population | % Population |
| African | 28 | 0.4% |
| American | 822 | 11.9% |
| Arab | 62 | 0.9% |
| Bhutanese | 10 | 0.2% |
| British | 15 | 0.2% |
| Burmese | 72 | 1.1% |
| Central American | 44 | 0.6% |
| Costa Rican | 13 | 0.2% |
| Cuban | 17 | 0.3% |
| Danish | 3 | 0.0% |
| Dutch | 39 | 0.6% |
| English | 583 | 8.5% |
| European | 208 | 3.0% |
| French | 42 | 0.6% |
| German | 155 | 2.2% |
| Haitian | 7 | 0.1% |
| Hungarian | 7 | 0.1% |
| Irish | 345 | 5.0% |
| Italian | 160 | 2.3% |
| Jamaican | 306 | 4.4% |
| Lebanese | 62 | 0.9% |
| Mexican | 62 | 0.9% |
| Northern European | 61 | 0.9% |
| Norwegian | 52 | 0.8% |
| Polish | 31 | 0.4% |
| Portuguese | 8 | 0.1% |
| Puerto Rican | 21 | 0.3% |
| Salvadoran | 31 | 0.4% |
| Scandinavian | 12 | 0.2% |
| Scotch-Irish | 320 | 4.6% |
| Scottish | 13 | 0.2% |
| Spanish | 4 | 0.1% |
| Subsaharan African | 28 | 0.4% |
| Swedish | 9 | 0.1% |
| Thai | 26 | 0.4% |
| Trinidadian and Tobagonian | 13 | 0.2% |
| Welsh | 13 | 0.2% | View All 37 Rows |
Immigrants in Perry
The most numerous immigrant groups reported in Perry came from Latin America (393 | 5.7%), Caribbean (343 | 5.0%), Jamaica (306 | 4.4%), Central America (50 | 0.7%), and El Salvador (31 | 0.4%), together accounting for 16.3% of all Perry residents.
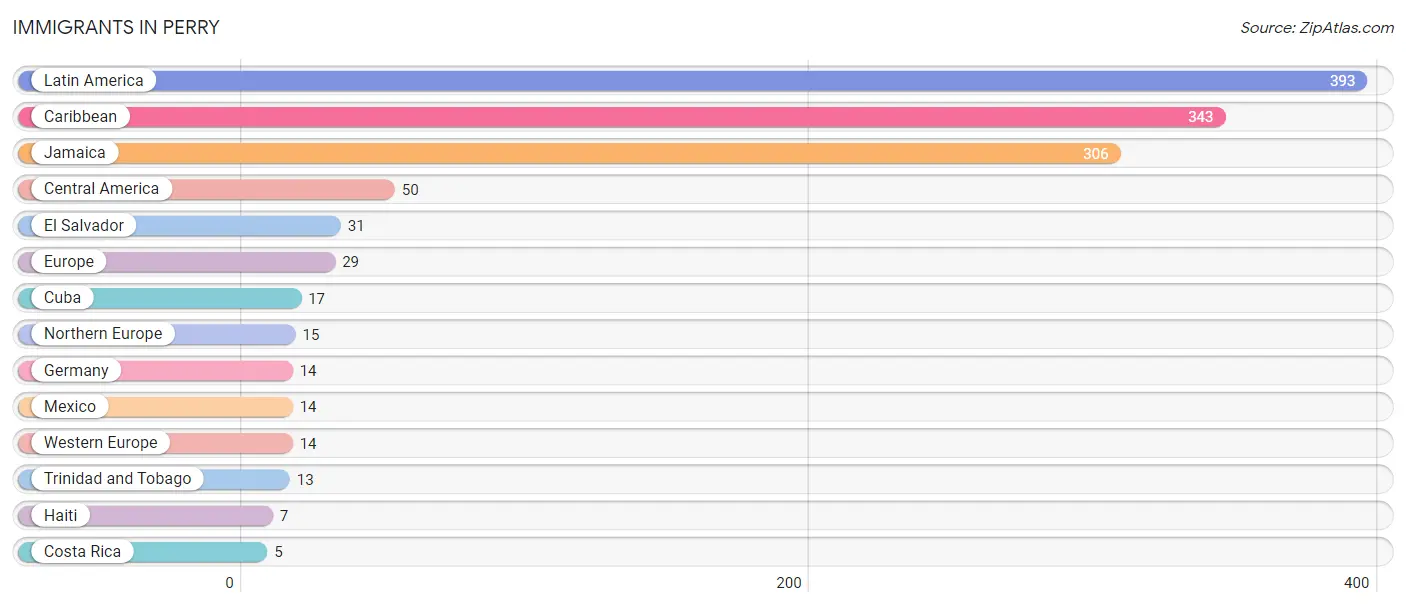
| Immigration Origin | # Population | % Population |
| Caribbean | 343 | 5.0% |
| Central America | 50 | 0.7% |
| Costa Rica | 5 | 0.1% |
| Cuba | 17 | 0.3% |
| El Salvador | 31 | 0.4% |
| Europe | 29 | 0.4% |
| Germany | 14 | 0.2% |
| Haiti | 7 | 0.1% |
| Jamaica | 306 | 4.4% |
| Latin America | 393 | 5.7% |
| Mexico | 14 | 0.2% |
| Northern Europe | 15 | 0.2% |
| Trinidad and Tobago | 13 | 0.2% |
| Western Europe | 14 | 0.2% | View All 14 Rows |
Sex and Age in Perry
Sex and Age in Perry
The most populous age groups in Perry are 10 to 14 Years (483 | 15.1%) for men and 5 to 9 Years (407 | 11.1%) for women.
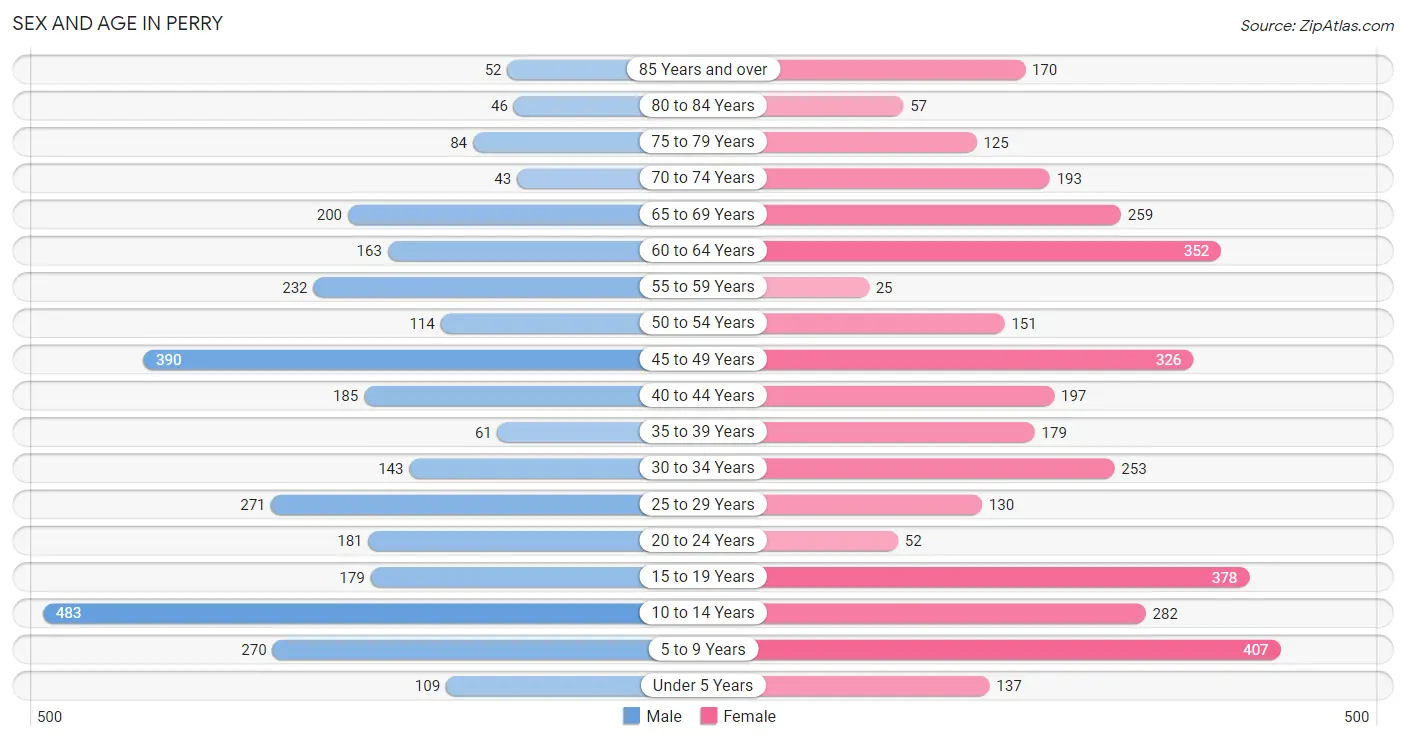
| Age Bracket | Male | Female |
| Under 5 Years | 109 (3.4%) | 137 (3.7%) |
| 5 to 9 Years | 270 (8.4%) | 407 (11.1%) |
| 10 to 14 Years | 483 (15.1%) | 282 (7.7%) |
| 15 to 19 Years | 179 (5.6%) | 378 (10.3%) |
| 20 to 24 Years | 181 (5.7%) | 52 (1.4%) |
| 25 to 29 Years | 271 (8.5%) | 130 (3.5%) |
| 30 to 34 Years | 143 (4.5%) | 253 (6.9%) |
| 35 to 39 Years | 61 (1.9%) | 179 (4.9%) |
| 40 to 44 Years | 185 (5.8%) | 197 (5.4%) |
| 45 to 49 Years | 390 (12.2%) | 326 (8.9%) |
| 50 to 54 Years | 114 (3.6%) | 151 (4.1%) |
| 55 to 59 Years | 232 (7.2%) | 25 (0.7%) |
| 60 to 64 Years | 163 (5.1%) | 352 (9.6%) |
| 65 to 69 Years | 200 (6.2%) | 259 (7.0%) |
| 70 to 74 Years | 43 (1.3%) | 193 (5.2%) |
| 75 to 79 Years | 84 (2.6%) | 125 (3.4%) |
| 80 to 84 Years | 46 (1.4%) | 57 (1.5%) |
| 85 Years and over | 52 (1.6%) | 170 (4.6%) |
| Total | 3,206 (100.0%) | 3,673 (100.0%) |
Families and Households in Perry
Median Family Size in Perry
The median family size in Perry is 3.31 persons per family, with single female/mother families (666 | 39.5%) accounting for the largest median family size of 3.45 persons per family. On the other hand, single male/father families (123 | 7.3%) represent the smallest median family size with 2.26 persons per family.
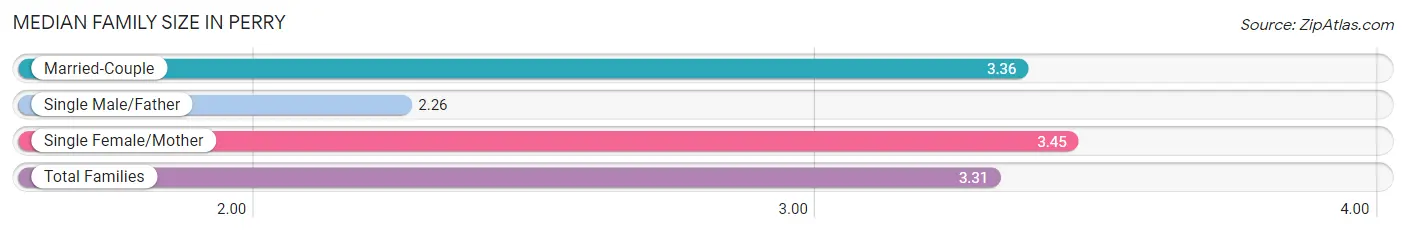
| Family Type | # Families | Family Size |
| Married-Couple | 896 (53.2%) | 3.36 |
| Single Male/Father | 123 (7.3%) | 2.26 |
| Single Female/Mother | 666 (39.5%) | 3.45 |
| Total Families | 1,685 (100.0%) | 3.31 |
Median Household Size in Perry
The median household size in Perry is 2.78 persons per household, with single female/mother households (666 | 28.1%) accounting for the largest median household size of 3.59 persons per household. non-family households (687 | 29.0%) represent the smallest median household size with 1.09 persons per household.
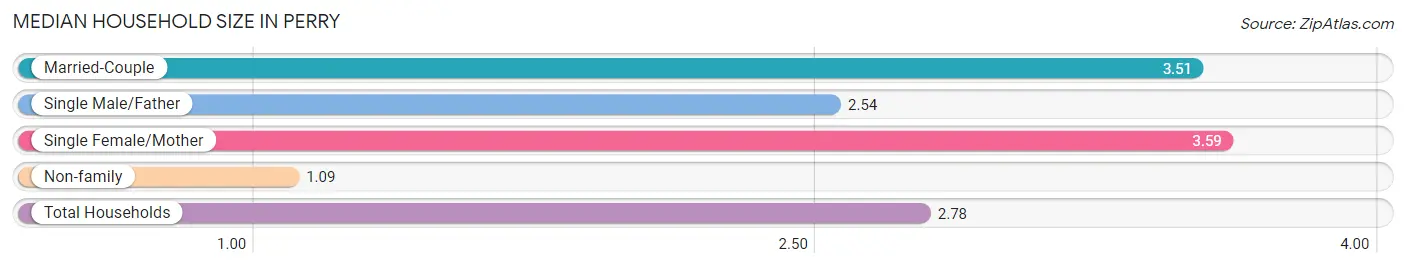
| Household Type | # Households | Household Size |
| Married-Couple | 896 (37.8%) | 3.51 |
| Single Male/Father | 123 (5.2%) | 2.54 |
| Single Female/Mother | 666 (28.1%) | 3.59 |
| Non-family | 687 (29.0%) | 1.09 |
| Total Households | 2,372 (100.0%) | 2.78 |
Household Size by Marriage Status in Perry
Out of a total of 2,372 households in Perry, 1,685 (71.0%) are family households, while 687 (29.0%) are nonfamily households. The most numerous type of family households are 2-person households, comprising 880, and the most common type of nonfamily households are 1-person households, comprising 642.
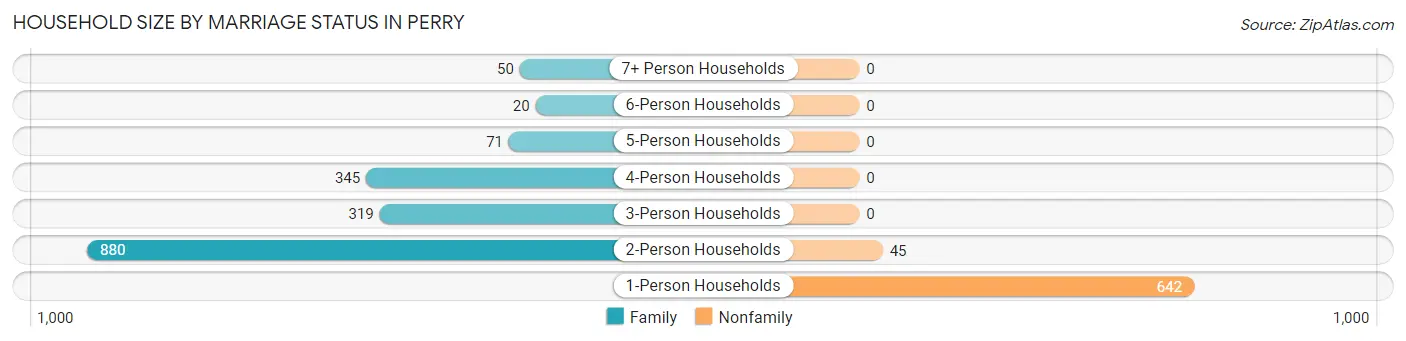
| Household Size | Family Households | Nonfamily Households |
| 1-Person Households | - | 642 (27.1%) |
| 2-Person Households | 880 (37.1%) | 45 (1.9%) |
| 3-Person Households | 319 (13.5%) | 0 (0.0%) |
| 4-Person Households | 345 (14.5%) | 0 (0.0%) |
| 5-Person Households | 71 (3.0%) | 0 (0.0%) |
| 6-Person Households | 20 (0.8%) | 0 (0.0%) |
| 7+ Person Households | 50 (2.1%) | 0 (0.0%) |
| Total | 1,685 (71.0%) | 687 (29.0%) |
Female Fertility in Perry
Fertility by Age in Perry
Average fertility rate in Perry is 68.0 births per 1,000 women. Women in the age bracket of 20 to 34 years have the highest fertility rate with 101.0 births per 1,000 women. Women in the age bracket of 35 to 50 years acount for 58.5% of all women with births.
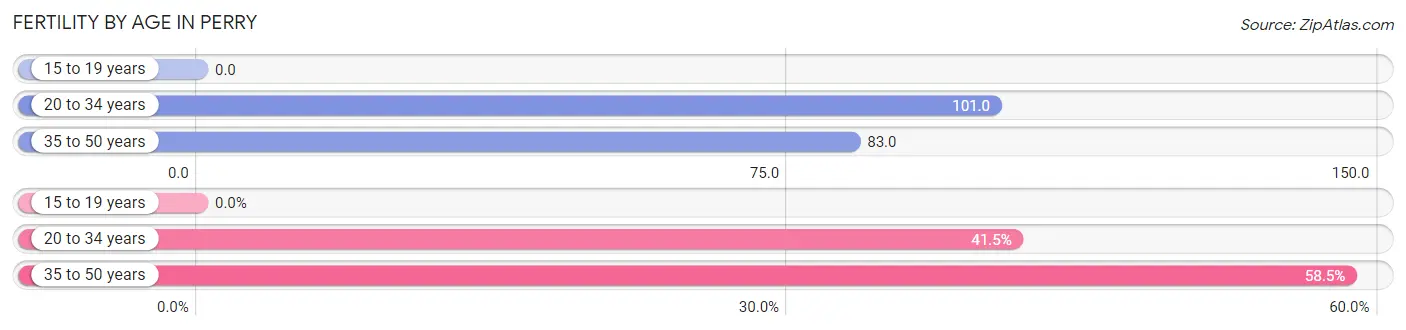
| Age Bracket | Women with Births | Births / 1,000 Women |
| 15 to 19 years | 0 (0.0%) | 0.0 |
| 20 to 34 years | 44 (41.5%) | 101.0 |
| 35 to 50 years | 62 (58.5%) | 83.0 |
| Total | 106 (100.0%) | 68.0 |
Fertility by Age by Marriage Status in Perry
34.0% of women with births (106) in Perry are married. The highest percentage of unmarried women with births falls into 20 to 34 years age bracket with 68.2% of them unmarried at the time of birth, while the lowest percentage of unmarried women with births belong to 35 to 50 years age bracket with 64.5% of them unmarried.
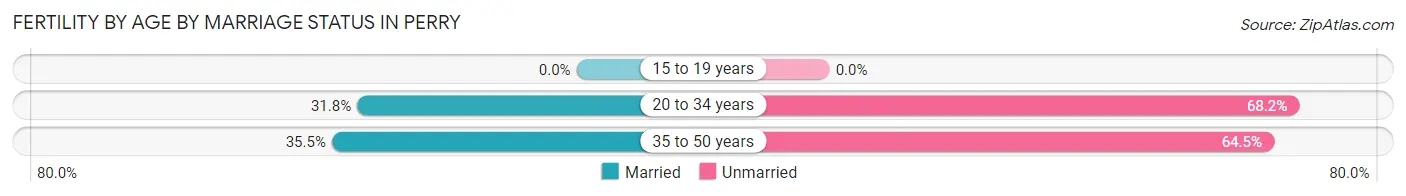
| Age Bracket | Married | Unmarried |
| 15 to 19 years | 0 (0.0%) | 0 (0.0%) |
| 20 to 34 years | 14 (31.8%) | 30 (68.2%) |
| 35 to 50 years | 22 (35.5%) | 40 (64.5%) |
| Total | 36 (34.0%) | 70 (66.0%) |
Fertility by Education in Perry
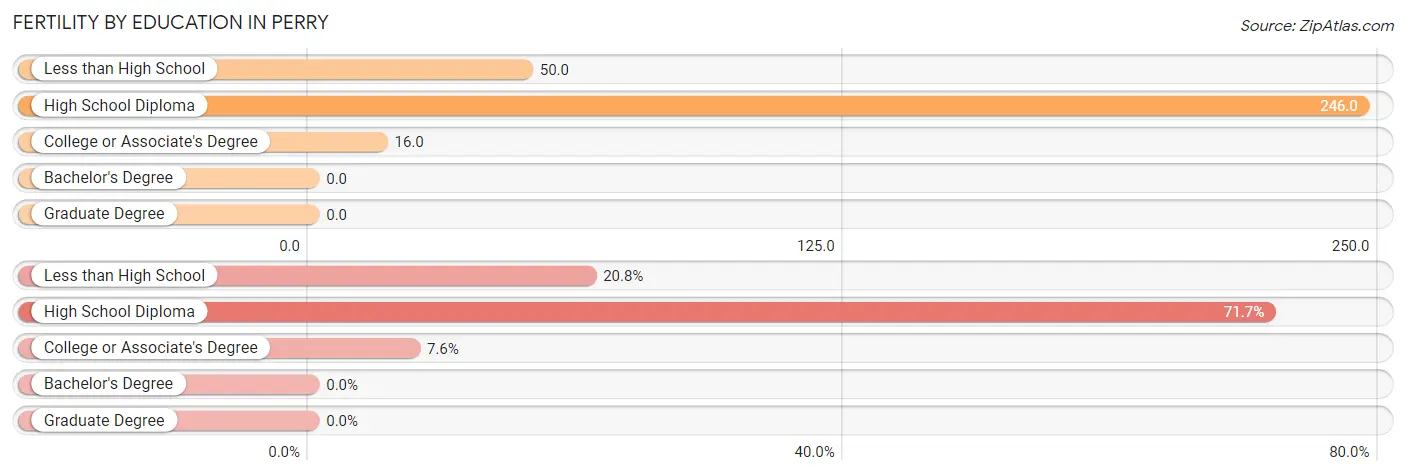
| Educational Attainment | Women with Births | Births / 1,000 Women |
| Less than High School | 22 (20.7%) | 50.0 |
| High School Diploma | 76 (71.7%) | 246.0 |
| College or Associate's Degree | 8 (7.5%) | 16.0 |
| Bachelor's Degree | 0 (0.0%) | 0.0 |
| Graduate Degree | 0 (0.0%) | 0.0 |
| Total | 106 (100.0%) | 68.0 |
Fertility by Education by Marriage Status in Perry
66.0% of women with births in Perry are unmarried. Women with the educational attainment of high school diploma are most likely to be married with 47.4% of them married at childbirth, while women with the educational attainment of less than high school are least likely to be married with 100.0% of them unmarried at childbirth.
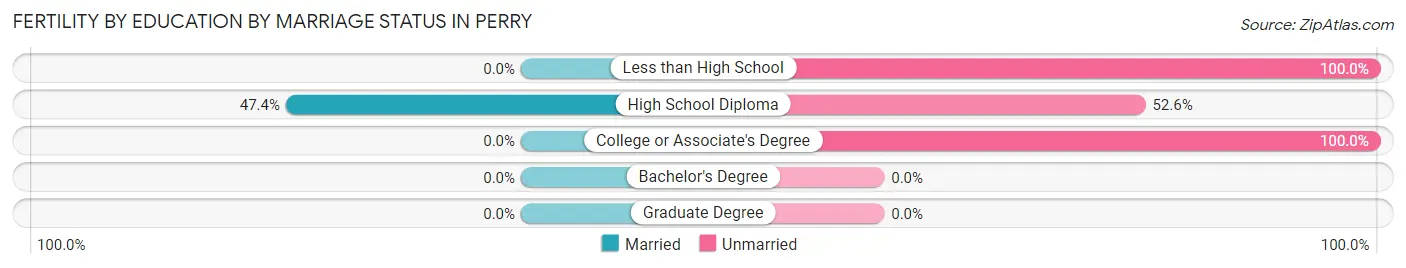
| Educational Attainment | Married | Unmarried |
| Less than High School | 0 (0.0%) | 22 (100.0%) |
| High School Diploma | 36 (47.4%) | 40 (52.6%) |
| College or Associate's Degree | 0 (0.0%) | 8 (100.0%) |
| Bachelor's Degree | 0 (0.0%) | 0 (0.0%) |
| Graduate Degree | 0 (0.0%) | 0 (0.0%) |
| Total | 36 (34.0%) | 70 (66.0%) |
Employment Characteristics in Perry
Employment by Class of Employer in Perry
Among the 2,506 employed individuals in Perry, private company employees (1,362 | 54.3%), local government employees (477 | 19.0%), and self-employed (not incorporated) (252 | 10.1%) make up the most common classes of employment.
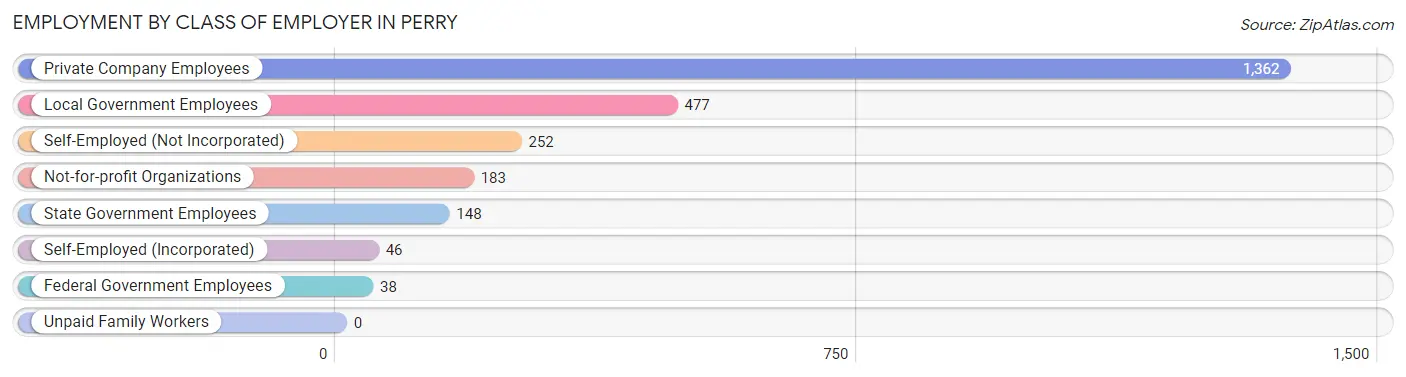
| Employer Class | # Employees | % Employees |
| Private Company Employees | 1,362 | 54.3% |
| Self-Employed (Incorporated) | 46 | 1.8% |
| Self-Employed (Not Incorporated) | 252 | 10.1% |
| Not-for-profit Organizations | 183 | 7.3% |
| Local Government Employees | 477 | 19.0% |
| State Government Employees | 148 | 5.9% |
| Federal Government Employees | 38 | 1.5% |
| Unpaid Family Workers | 0 | 0.0% |
| Total | 2,506 | 100.0% |
Employment Status by Age in Perry
According to the labor force statistics for Perry, out of the total population over 16 years of age (5,125), 56.2% or 2,880 individuals are in the labor force, with 8.1% or 233 of them unemployed. The age group with the highest labor force participation rate is 20 to 24 years, with 99.1% or 231 individuals in the labor force. Within the labor force, the 25 to 29 years age range has the highest percentage of unemployed individuals, with 33.4% or 107 of them being unemployed.
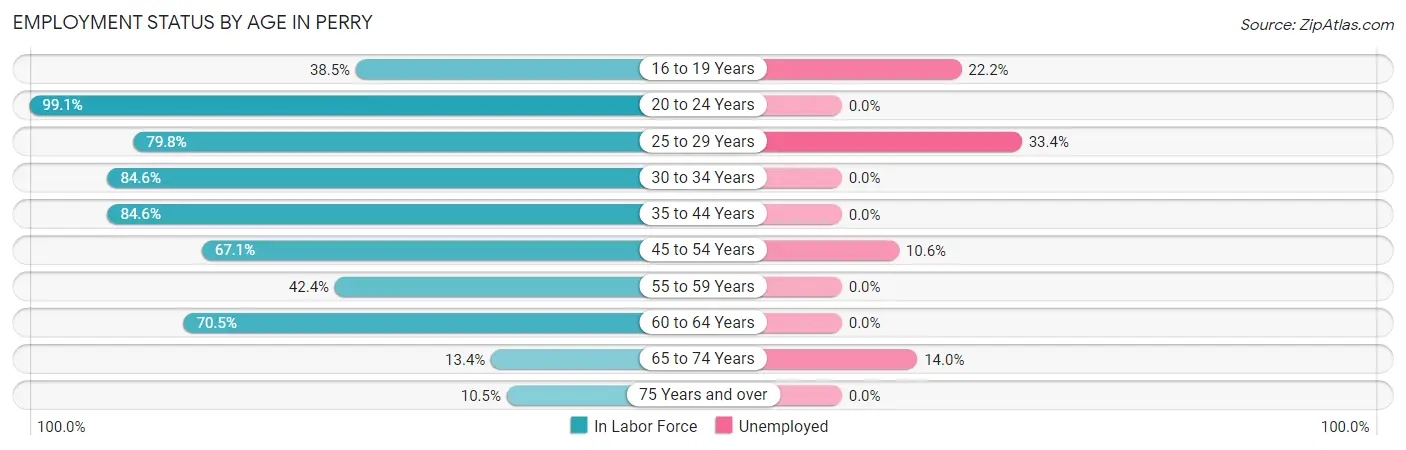
| Age Bracket | In Labor Force | Unemployed |
| 16 to 19 Years | 189 (38.5%) | 42 (22.2%) |
| 20 to 24 Years | 231 (99.1%) | 0 (0.0%) |
| 25 to 29 Years | 320 (79.8%) | 107 (33.4%) |
| 30 to 34 Years | 335 (84.6%) | 0 (0.0%) |
| 35 to 44 Years | 526 (84.6%) | 0 (0.0%) |
| 45 to 54 Years | 658 (67.1%) | 70 (10.6%) |
| 55 to 59 Years | 109 (42.4%) | 0 (0.0%) |
| 60 to 64 Years | 363 (70.5%) | 0 (0.0%) |
| 65 to 74 Years | 93 (13.4%) | 13 (14.0%) |
| 75 Years and over | 56 (10.5%) | 0 (0.0%) |
| Total | 2,880 (56.2%) | 233 (8.1%) |
Employment Status by Educational Attainment in Perry
According to labor force statistics for Perry, 72.9% of individuals (2,312) out of the total population between 25 and 64 years of age (3,172) are in the labor force, with 7.7% or 178 of them being unemployed. The group with the highest labor force participation rate are those with the educational attainment of bachelor's degree or higher, with 88.0% or 631 individuals in the labor force. Within the labor force, individuals with less than high school education have the highest percentage of unemployment, with 22.2% or 42 of them being unemployed.
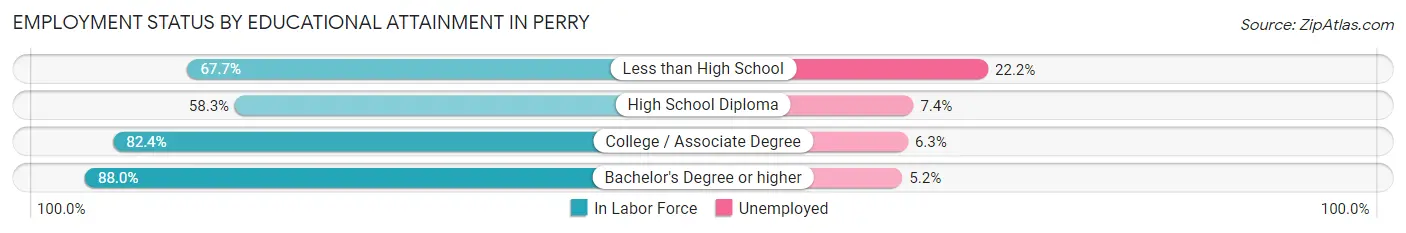
| Educational Attainment | In Labor Force | Unemployed |
| Less than High School | 189 (67.7%) | 62 (22.2%) |
| High School Diploma | 732 (58.3%) | 93 (7.4%) |
| College / Associate Degree | 759 (82.4%) | 58 (6.3%) |
| Bachelor's Degree or higher | 631 (88.0%) | 37 (5.2%) |
| Total | 2,312 (72.9%) | 244 (7.7%) |
Employment Occupations by Sex in Perry
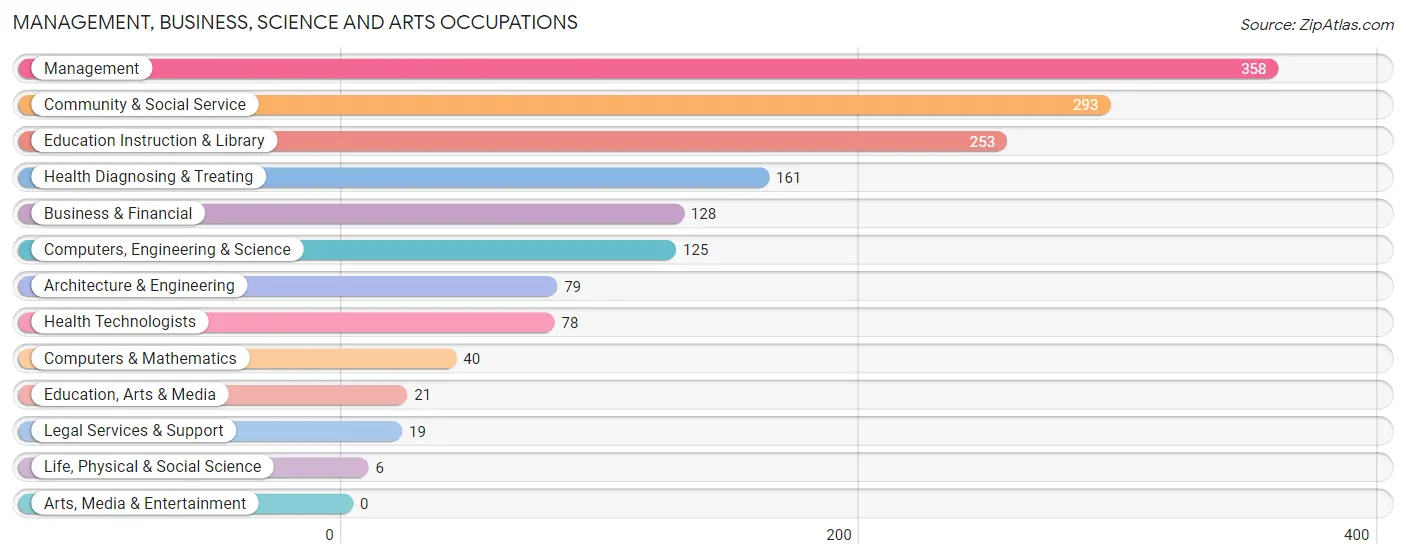
Management, Business, Science and Arts Occupations
The most common Management, Business, Science and Arts occupations in Perry are Management (358 | 13.5%), Community & Social Service (293 | 11.1%), Education Instruction & Library (253 | 9.6%), Health Diagnosing & Treating (161 | 6.1%), and Business & Financial (128 | 4.8%).
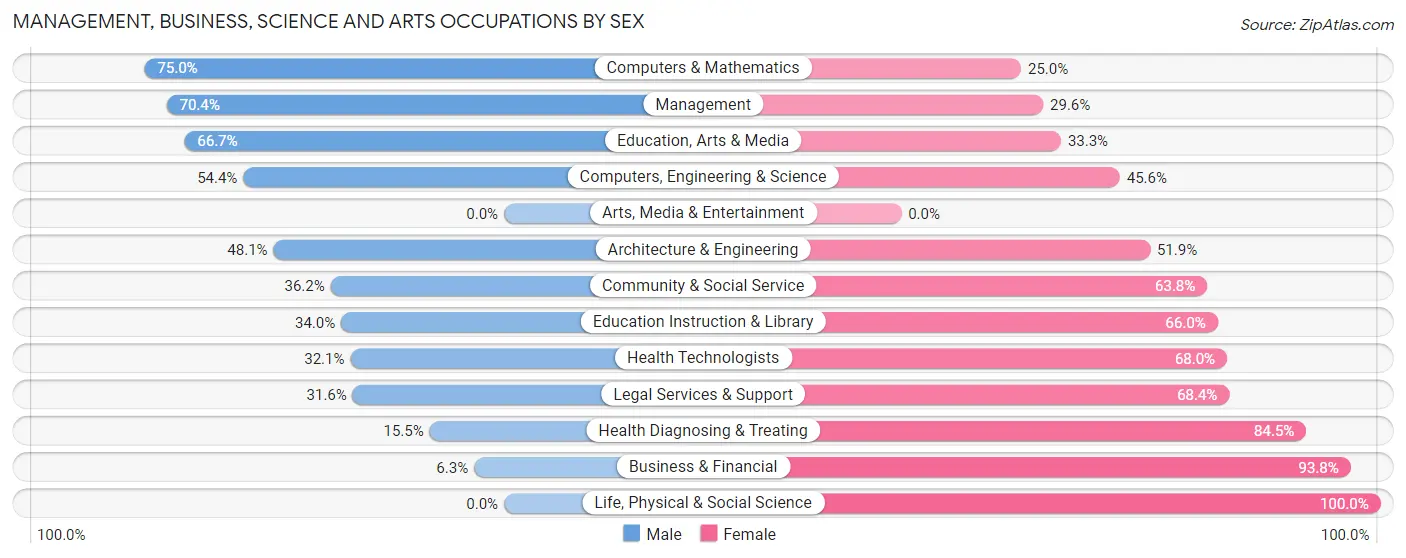
Management, Business, Science and Arts Occupations by Sex
Within the Management, Business, Science and Arts occupations in Perry, the most male-oriented occupations are Computers & Mathematics (75.0%), Management (70.4%), and Education, Arts & Media (66.7%), while the most female-oriented occupations are Life, Physical & Social Science (100.0%), Business & Financial (93.8%), and Health Diagnosing & Treating (84.5%).
| Occupation | Male | Female |
| Management | 252 (70.4%) | 106 (29.6%) |
| Business & Financial | 8 (6.2%) | 120 (93.8%) |
| Computers, Engineering & Science | 68 (54.4%) | 57 (45.6%) |
| Computers & Mathematics | 30 (75.0%) | 10 (25.0%) |
| Architecture & Engineering | 38 (48.1%) | 41 (51.9%) |
| Life, Physical & Social Science | 0 (0.0%) | 6 (100.0%) |
| Community & Social Service | 106 (36.2%) | 187 (63.8%) |
| Education, Arts & Media | 14 (66.7%) | 7 (33.3%) |
| Legal Services & Support | 6 (31.6%) | 13 (68.4%) |
| Education Instruction & Library | 86 (34.0%) | 167 (66.0%) |
| Arts, Media & Entertainment | 0 (0.0%) | 0 (0.0%) |
| Health Diagnosing & Treating | 25 (15.5%) | 136 (84.5%) |
| Health Technologists | 25 (32.1%) | 53 (67.9%) |
| Total (Category) | 459 (43.1%) | 606 (56.9%) |
| Total (Overall) | 1,156 (43.7%) | 1,492 (56.3%) |
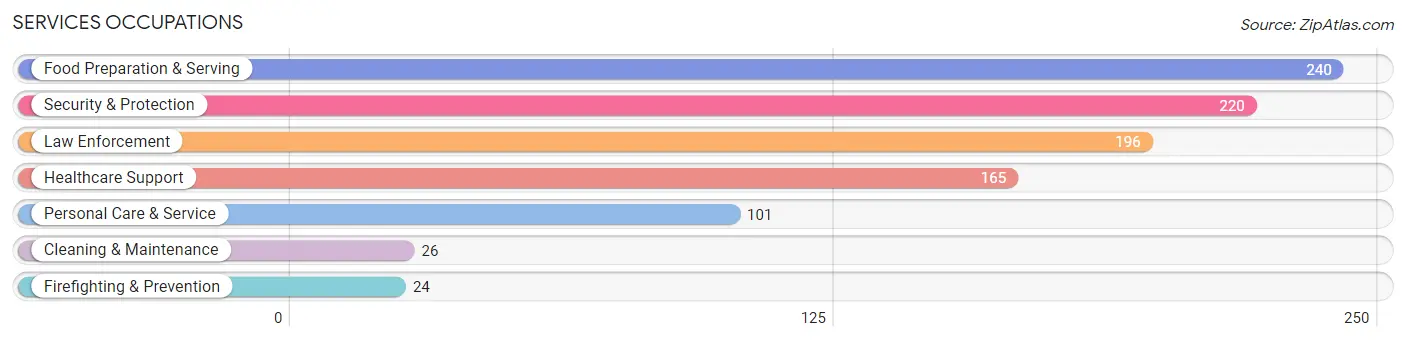
Services Occupations
The most common Services occupations in Perry are Food Preparation & Serving (240 | 9.1%), Security & Protection (220 | 8.3%), Law Enforcement (196 | 7.4%), Healthcare Support (165 | 6.2%), and Personal Care & Service (101 | 3.8%).
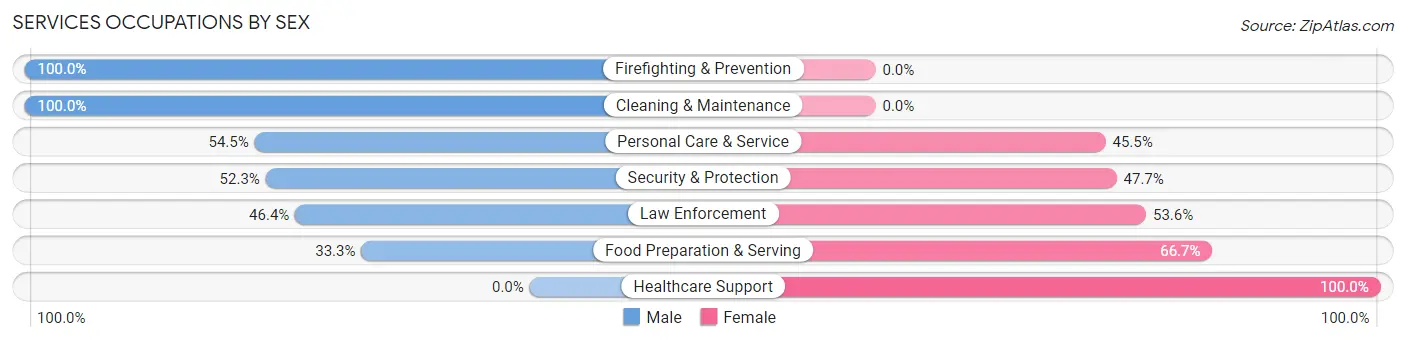
Services Occupations by Sex
Within the Services occupations in Perry, the most male-oriented occupations are Firefighting & Prevention (100.0%), Cleaning & Maintenance (100.0%), and Personal Care & Service (54.5%), while the most female-oriented occupations are Healthcare Support (100.0%), Food Preparation & Serving (66.7%), and Law Enforcement (53.6%).
| Occupation | Male | Female |
| Healthcare Support | 0 (0.0%) | 165 (100.0%) |
| Security & Protection | 115 (52.3%) | 105 (47.7%) |
| Firefighting & Prevention | 24 (100.0%) | 0 (0.0%) |
| Law Enforcement | 91 (46.4%) | 105 (53.6%) |
| Food Preparation & Serving | 80 (33.3%) | 160 (66.7%) |
| Cleaning & Maintenance | 26 (100.0%) | 0 (0.0%) |
| Personal Care & Service | 55 (54.5%) | 46 (45.5%) |
| Total (Category) | 276 (36.7%) | 476 (63.3%) |
| Total (Overall) | 1,156 (43.7%) | 1,492 (56.3%) |
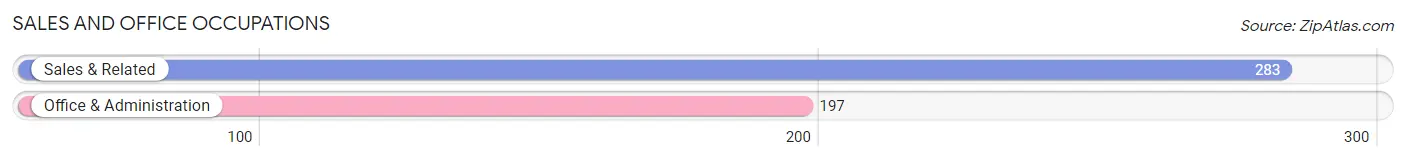
Sales and Office Occupations
The most common Sales and Office occupations in Perry are Sales & Related (283 | 10.7%), and Office & Administration (197 | 7.4%).
Sales and Office Occupations by Sex
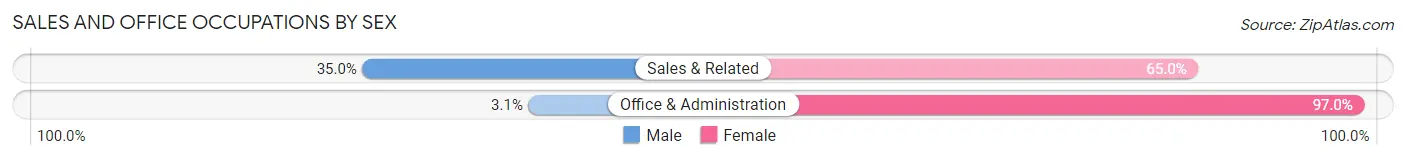
| Occupation | Male | Female |
| Sales & Related | 99 (35.0%) | 184 (65.0%) |
| Office & Administration | 6 (3.0%) | 191 (97.0%) |
| Total (Category) | 105 (21.9%) | 375 (78.1%) |
| Total (Overall) | 1,156 (43.7%) | 1,492 (56.3%) |
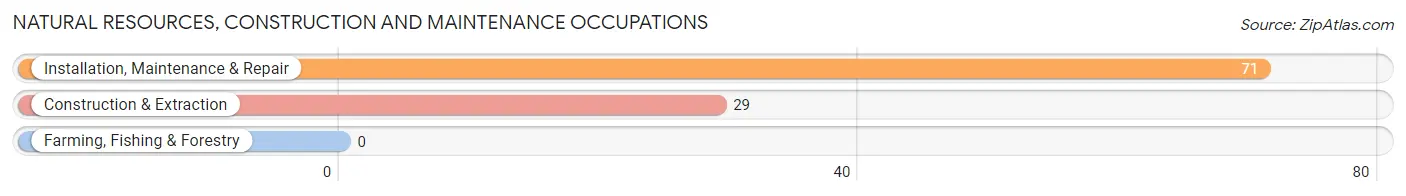
Natural Resources, Construction and Maintenance Occupations
The most common Natural Resources, Construction and Maintenance occupations in Perry are Installation, Maintenance & Repair (71 | 2.7%), and Construction & Extraction (29 | 1.1%).
Natural Resources, Construction and Maintenance Occupations by Sex
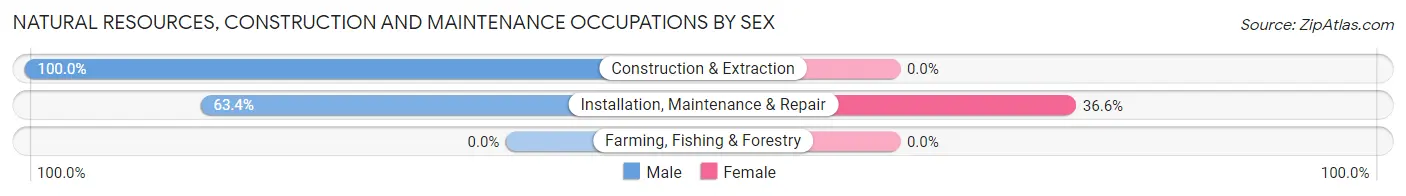
| Occupation | Male | Female |
| Farming, Fishing & Forestry | 0 (0.0%) | 0 (0.0%) |
| Construction & Extraction | 29 (100.0%) | 0 (0.0%) |
| Installation, Maintenance & Repair | 45 (63.4%) | 26 (36.6%) |
| Total (Category) | 74 (74.0%) | 26 (26.0%) |
| Total (Overall) | 1,156 (43.7%) | 1,492 (56.3%) |
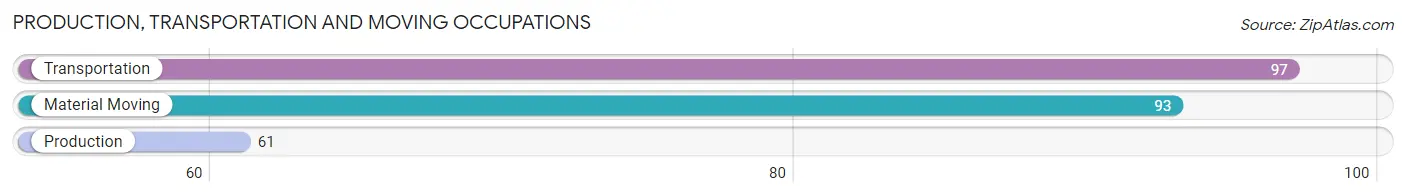
Production, Transportation and Moving Occupations
The most common Production, Transportation and Moving occupations in Perry are Transportation (97 | 3.7%), Material Moving (93 | 3.5%), and Production (61 | 2.3%).
Production, Transportation and Moving Occupations by Sex
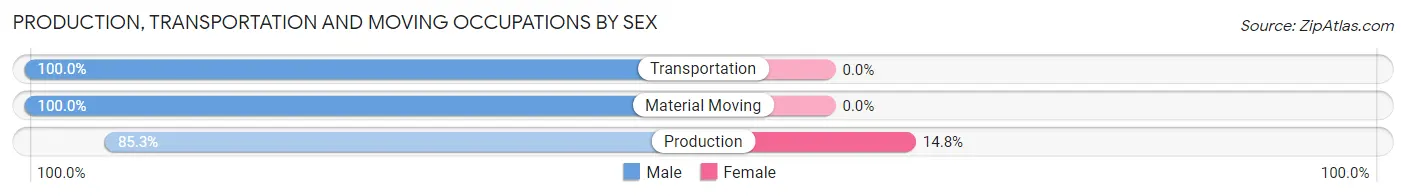
| Occupation | Male | Female |
| Production | 52 (85.3%) | 9 (14.7%) |
| Transportation | 97 (100.0%) | 0 (0.0%) |
| Material Moving | 93 (100.0%) | 0 (0.0%) |
| Total (Category) | 242 (96.4%) | 9 (3.6%) |
| Total (Overall) | 1,156 (43.7%) | 1,492 (56.3%) |
Employment Industries by Sex in Perry
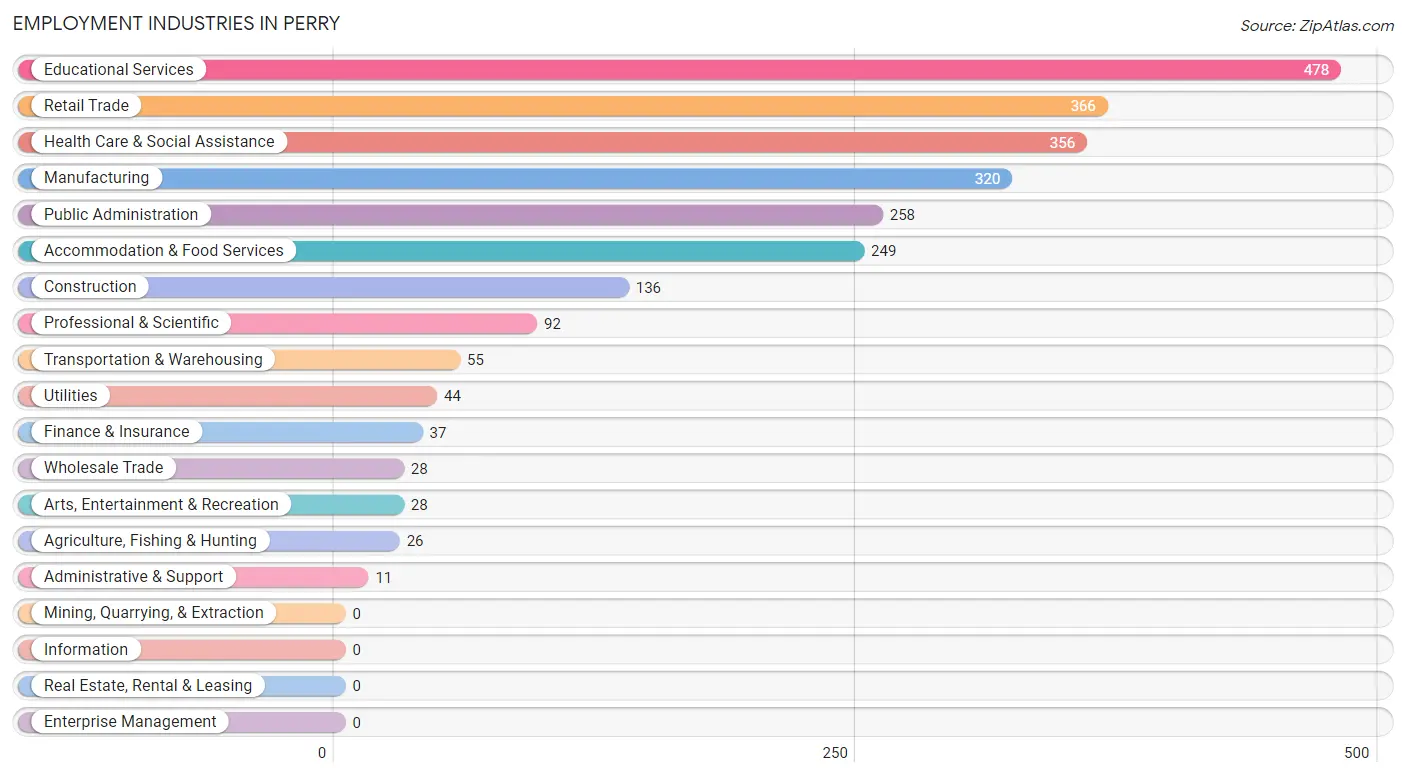
Employment Industries in Perry
The major employment industries in Perry include Educational Services (478 | 18.0%), Retail Trade (366 | 13.8%), Health Care & Social Assistance (356 | 13.4%), Manufacturing (320 | 12.1%), and Public Administration (258 | 9.7%).
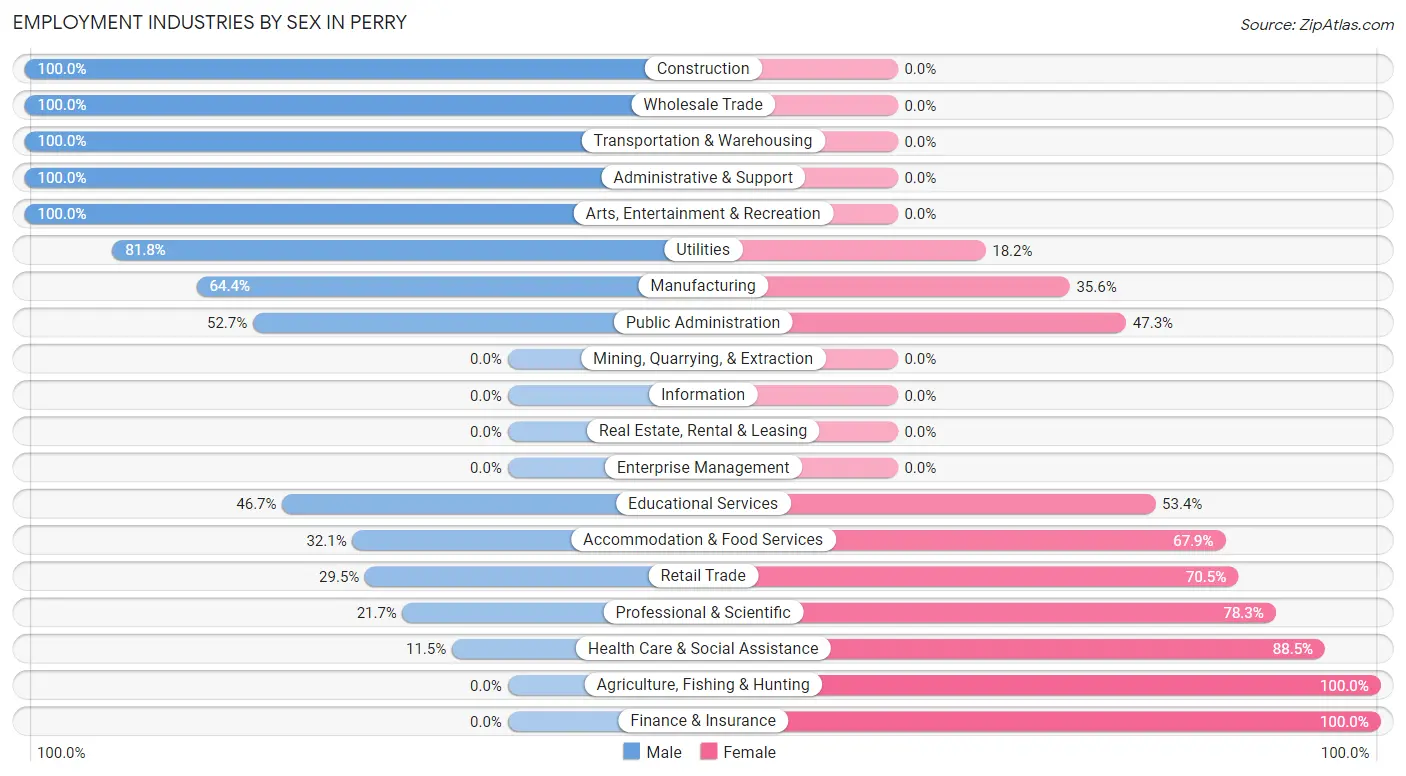
Employment Industries by Sex in Perry
The Perry industries that see more men than women are Construction (100.0%), Wholesale Trade (100.0%), and Transportation & Warehousing (100.0%), whereas the industries that tend to have a higher number of women are Agriculture, Fishing & Hunting (100.0%), Finance & Insurance (100.0%), and Health Care & Social Assistance (88.5%).
| Industry | Male | Female |
| Agriculture, Fishing & Hunting | 0 (0.0%) | 26 (100.0%) |
| Mining, Quarrying, & Extraction | 0 (0.0%) | 0 (0.0%) |
| Construction | 136 (100.0%) | 0 (0.0%) |
| Manufacturing | 206 (64.4%) | 114 (35.6%) |
| Wholesale Trade | 28 (100.0%) | 0 (0.0%) |
| Retail Trade | 108 (29.5%) | 258 (70.5%) |
| Transportation & Warehousing | 55 (100.0%) | 0 (0.0%) |
| Utilities | 36 (81.8%) | 8 (18.2%) |
| Information | 0 (0.0%) | 0 (0.0%) |
| Finance & Insurance | 0 (0.0%) | 37 (100.0%) |
| Real Estate, Rental & Leasing | 0 (0.0%) | 0 (0.0%) |
| Professional & Scientific | 20 (21.7%) | 72 (78.3%) |
| Enterprise Management | 0 (0.0%) | 0 (0.0%) |
| Administrative & Support | 11 (100.0%) | 0 (0.0%) |
| Educational Services | 223 (46.7%) | 255 (53.3%) |
| Health Care & Social Assistance | 41 (11.5%) | 315 (88.5%) |
| Arts, Entertainment & Recreation | 28 (100.0%) | 0 (0.0%) |
| Accommodation & Food Services | 80 (32.1%) | 169 (67.9%) |
| Public Administration | 136 (52.7%) | 122 (47.3%) |
| Total | 1,156 (43.7%) | 1,492 (56.3%) |
Education in Perry
School Enrollment in Perry
The most common levels of schooling among the 2,168 students in Perry are middle school (679 | 31.3%), elementary school (585 | 27.0%), and high school (493 | 22.7%).
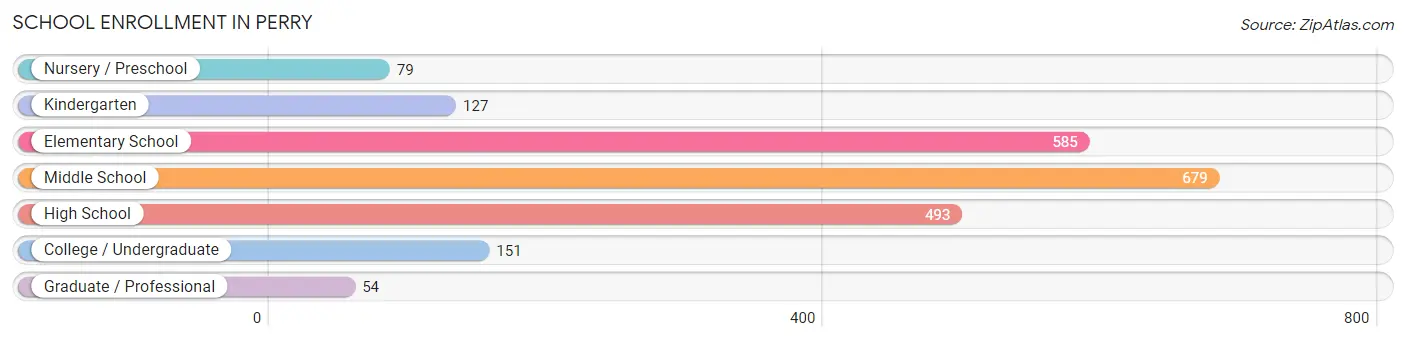
| School Level | # Students | % Students |
| Nursery / Preschool | 79 | 3.6% |
| Kindergarten | 127 | 5.9% |
| Elementary School | 585 | 27.0% |
| Middle School | 679 | 31.3% |
| High School | 493 | 22.7% |
| College / Undergraduate | 151 | 7.0% |
| Graduate / Professional | 54 | 2.5% |
| Total | 2,168 | 100.0% |
School Enrollment by Age by Funding Source in Perry
Out of a total of 2,168 students who are enrolled in schools in Perry, 486 (22.4%) attend a private institution, while the remaining 1,682 (77.6%) are enrolled in public schools. The age group of 3 to 4 year olds has the highest likelihood of being enrolled in private schools, with 46 (100.0% in the age bracket) enrolled. Conversely, the age group of 18 to 19 year olds has the lowest likelihood of being enrolled in a private school, with 177 (100.0% in the age bracket) attending a public institution.
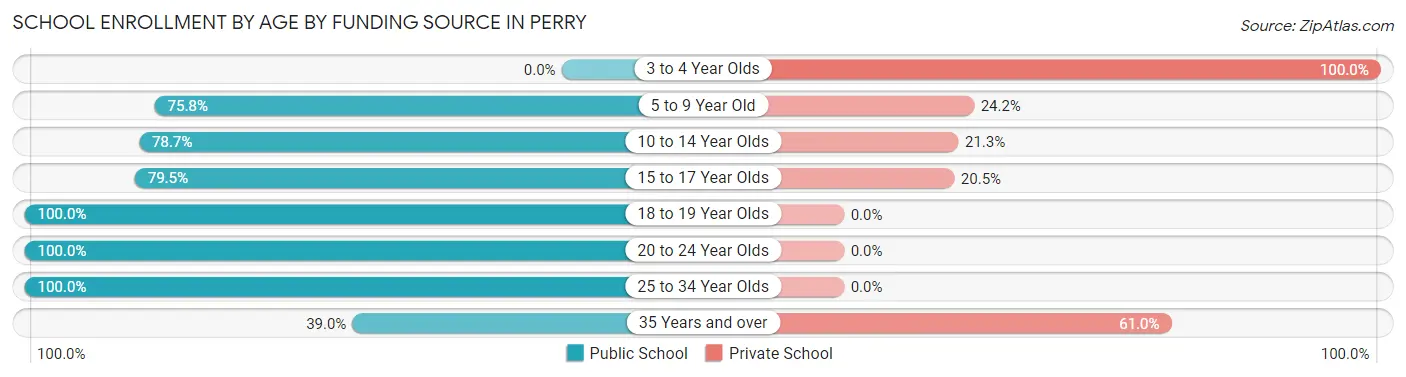
| Age Bracket | Public School | Private School |
| 3 to 4 Year Olds | 0 (0.0%) | 46 (100.0%) |
| 5 to 9 Year Old | 510 (75.8%) | 163 (24.2%) |
| 10 to 14 Year Olds | 602 (78.7%) | 163 (21.3%) |
| 15 to 17 Year Olds | 298 (79.5%) | 77 (20.5%) |
| 18 to 19 Year Olds | 177 (100.0%) | 0 (0.0%) |
| 20 to 24 Year Olds | 21 (100.0%) | 0 (0.0%) |
| 25 to 34 Year Olds | 52 (100.0%) | 0 (0.0%) |
| 35 Years and over | 23 (39.0%) | 36 (61.0%) |
| Total | 1,682 (77.6%) | 486 (22.4%) |
Educational Attainment by Field of Study in Perry
Engineering (163 | 18.1%), arts & humanities (137 | 15.2%), education (120 | 13.3%), liberal arts & history (99 | 11.0%), and business (90 | 10.0%) are the most common fields of study among 900 individuals in Perry who have obtained a bachelor's degree or higher.
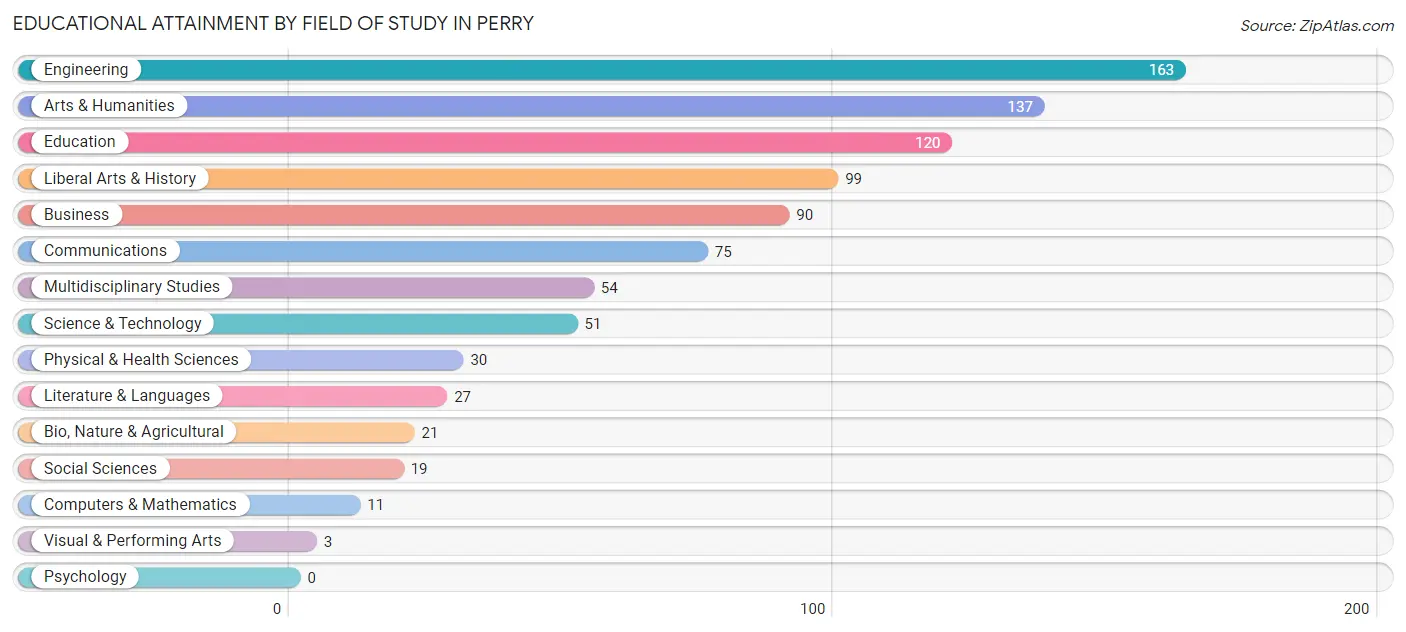
| Field of Study | # Graduates | % Graduates |
| Computers & Mathematics | 11 | 1.2% |
| Bio, Nature & Agricultural | 21 | 2.3% |
| Physical & Health Sciences | 30 | 3.3% |
| Psychology | 0 | 0.0% |
| Social Sciences | 19 | 2.1% |
| Engineering | 163 | 18.1% |
| Multidisciplinary Studies | 54 | 6.0% |
| Science & Technology | 51 | 5.7% |
| Business | 90 | 10.0% |
| Education | 120 | 13.3% |
| Literature & Languages | 27 | 3.0% |
| Liberal Arts & History | 99 | 11.0% |
| Visual & Performing Arts | 3 | 0.3% |
| Communications | 75 | 8.3% |
| Arts & Humanities | 137 | 15.2% |
| Total | 900 | 100.0% |
Transportation & Commute in Perry
Vehicle Availability by Sex in Perry
The most prevalent vehicle ownership categories in Perry are males with 2 vehicles (661, accounting for 58.2%) and females with 2 vehicles (715, making up 48.2%).
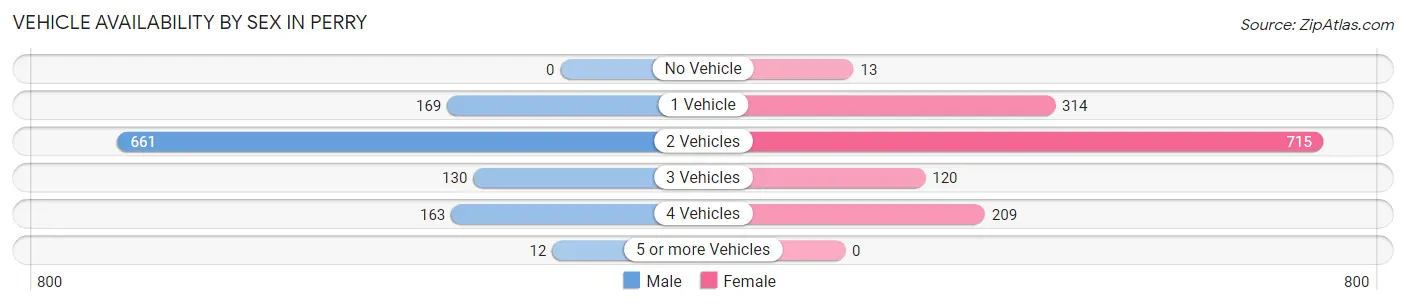
| Vehicles Available | Male | Female |
| No Vehicle | 0 (0.0%) | 13 (0.9%) |
| 1 Vehicle | 169 (14.9%) | 314 (22.9%) |
| 2 Vehicles | 661 (58.2%) | 715 (52.1%) |
| 3 Vehicles | 130 (11.5%) | 120 (8.7%) |
| 4 Vehicles | 163 (14.4%) | 209 (15.2%) |
| 5 or more Vehicles | 12 (1.1%) | 0 (0.0%) |
| Total | 1,135 (100.0%) | 1,371 (100.0%) |
Commute Time in Perry
The most frequently occuring commute durations in Perry are 5 to 9 minutes (667 commuters, 28.6%), 10 to 14 minutes (469 commuters, 20.1%), and 15 to 19 minutes (339 commuters, 14.5%).

| Commute Time | # Commuters | % Commuters |
| Less than 5 Minutes | 163 | 7.0% |
| 5 to 9 Minutes | 667 | 28.6% |
| 10 to 14 Minutes | 469 | 20.1% |
| 15 to 19 Minutes | 339 | 14.5% |
| 20 to 24 Minutes | 231 | 9.9% |
| 25 to 29 Minutes | 24 | 1.0% |
| 30 to 34 Minutes | 72 | 3.1% |
| 35 to 39 Minutes | 0 | 0.0% |
| 40 to 44 Minutes | 9 | 0.4% |
| 45 to 59 Minutes | 107 | 4.6% |
| 60 to 89 Minutes | 162 | 6.9% |
| 90 or more Minutes | 91 | 3.9% |
Commute Time by Sex in Perry
The most common commute times in Perry are 5 to 9 minutes (435 commuters, 38.7%) for males and 10 to 14 minutes (292 commuters, 24.1%) for females.
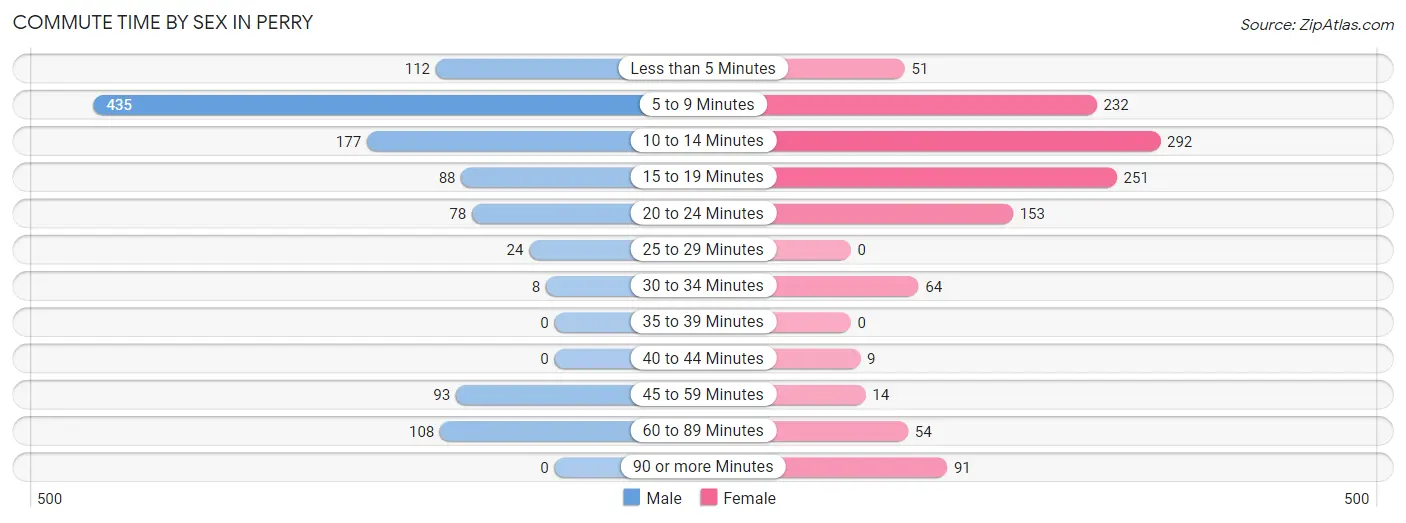
| Commute Time | Male | Female |
| Less than 5 Minutes | 112 (10.0%) | 51 (4.2%) |
| 5 to 9 Minutes | 435 (38.7%) | 232 (19.2%) |
| 10 to 14 Minutes | 177 (15.8%) | 292 (24.1%) |
| 15 to 19 Minutes | 88 (7.8%) | 251 (20.7%) |
| 20 to 24 Minutes | 78 (7.0%) | 153 (12.6%) |
| 25 to 29 Minutes | 24 (2.1%) | 0 (0.0%) |
| 30 to 34 Minutes | 8 (0.7%) | 64 (5.3%) |
| 35 to 39 Minutes | 0 (0.0%) | 0 (0.0%) |
| 40 to 44 Minutes | 0 (0.0%) | 9 (0.7%) |
| 45 to 59 Minutes | 93 (8.3%) | 14 (1.2%) |
| 60 to 89 Minutes | 108 (9.6%) | 54 (4.5%) |
| 90 or more Minutes | 0 (0.0%) | 91 (7.5%) |
Time of Departure to Work by Sex in Perry
The most frequent times of departure to work in Perry are 7:00 AM to 7:29 AM (245, 21.8%) for males and 7:30 AM to 7:59 AM (331, 27.3%) for females.
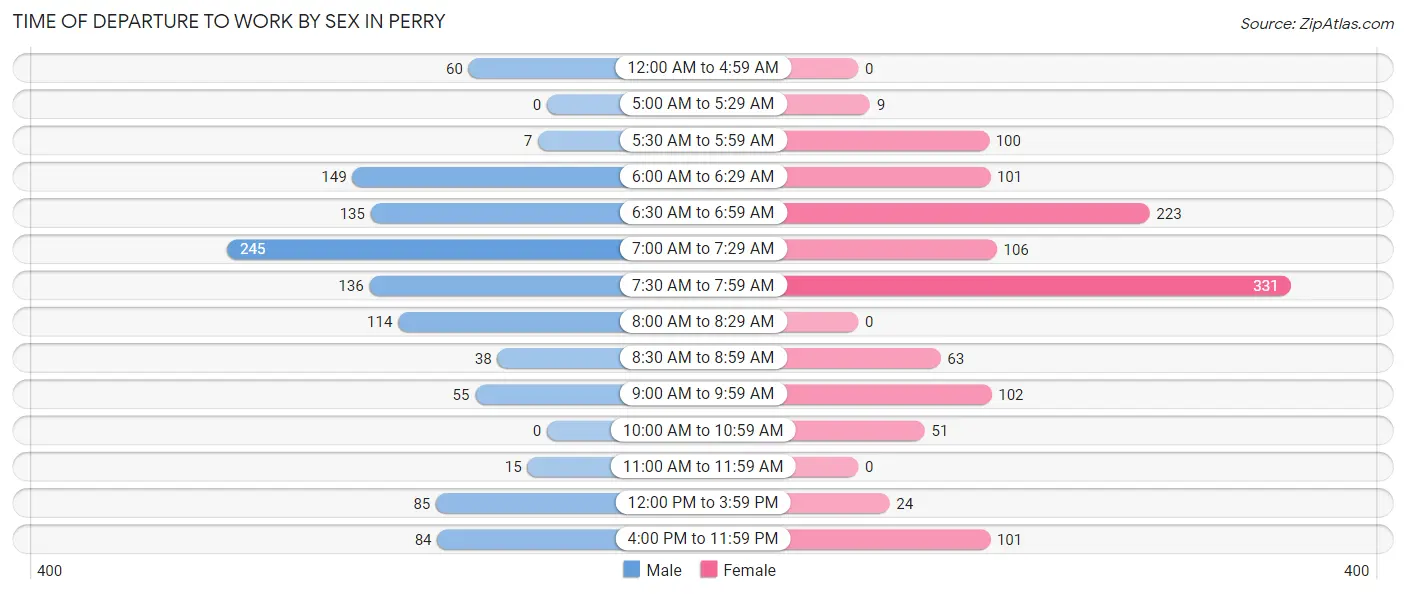
| Time of Departure | Male | Female |
| 12:00 AM to 4:59 AM | 60 (5.3%) | 0 (0.0%) |
| 5:00 AM to 5:29 AM | 0 (0.0%) | 9 (0.7%) |
| 5:30 AM to 5:59 AM | 7 (0.6%) | 100 (8.3%) |
| 6:00 AM to 6:29 AM | 149 (13.3%) | 101 (8.3%) |
| 6:30 AM to 6:59 AM | 135 (12.0%) | 223 (18.4%) |
| 7:00 AM to 7:29 AM | 245 (21.8%) | 106 (8.7%) |
| 7:30 AM to 7:59 AM | 136 (12.1%) | 331 (27.3%) |
| 8:00 AM to 8:29 AM | 114 (10.2%) | 0 (0.0%) |
| 8:30 AM to 8:59 AM | 38 (3.4%) | 63 (5.2%) |
| 9:00 AM to 9:59 AM | 55 (4.9%) | 102 (8.4%) |
| 10:00 AM to 10:59 AM | 0 (0.0%) | 51 (4.2%) |
| 11:00 AM to 11:59 AM | 15 (1.3%) | 0 (0.0%) |
| 12:00 PM to 3:59 PM | 85 (7.6%) | 24 (2.0%) |
| 4:00 PM to 11:59 PM | 84 (7.5%) | 101 (8.3%) |
| Total | 1,123 (100.0%) | 1,211 (100.0%) |
Housing Occupancy in Perry
Occupancy by Ownership in Perry
Of the total 2,372 dwellings in Perry, owner-occupied units account for 1,514 (63.8%), while renter-occupied units make up 858 (36.2%).
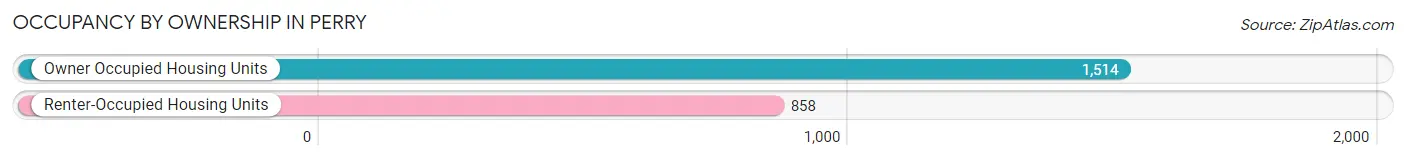
| Occupancy | # Housing Units | % Housing Units |
| Owner Occupied Housing Units | 1,514 | 63.8% |
| Renter-Occupied Housing Units | 858 | 36.2% |
| Total Occupied Housing Units | 2,372 | 100.0% |
Occupancy by Household Size in Perry
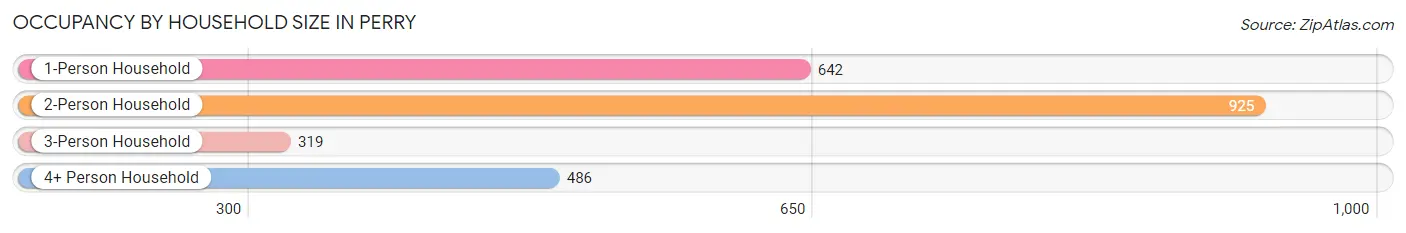
| Household Size | # Housing Units | % Housing Units |
| 1-Person Household | 642 | 27.1% |
| 2-Person Household | 925 | 39.0% |
| 3-Person Household | 319 | 13.5% |
| 4+ Person Household | 486 | 20.5% |
| Total Housing Units | 2,372 | 100.0% |
Occupancy by Ownership by Household Size in Perry
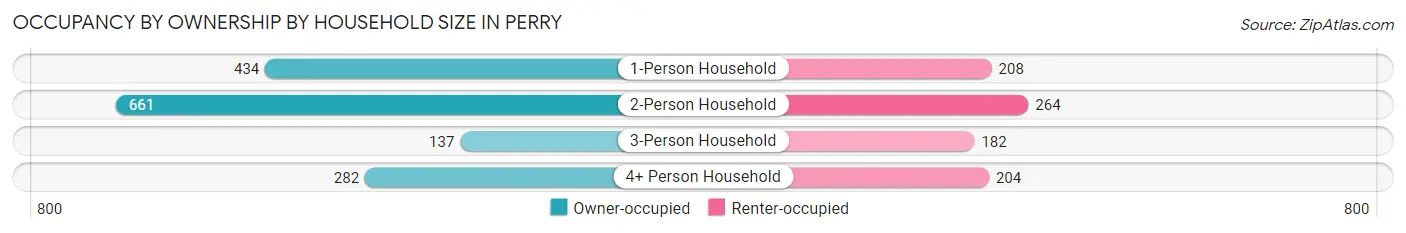
| Household Size | Owner-occupied | Renter-occupied |
| 1-Person Household | 434 (67.6%) | 208 (32.4%) |
| 2-Person Household | 661 (71.5%) | 264 (28.5%) |
| 3-Person Household | 137 (42.9%) | 182 (57.1%) |
| 4+ Person Household | 282 (58.0%) | 204 (42.0%) |
| Total Housing Units | 1,514 (63.8%) | 858 (36.2%) |
Occupancy by Educational Attainment in Perry
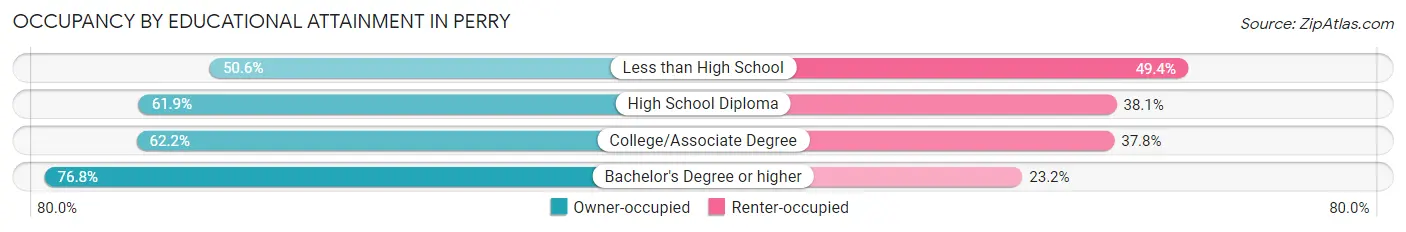
| Household Size | Owner-occupied | Renter-occupied |
| Less than High School | 128 (50.6%) | 125 (49.4%) |
| High School Diploma | 547 (61.9%) | 337 (38.1%) |
| College/Associate Degree | 468 (62.2%) | 284 (37.8%) |
| Bachelor's Degree or higher | 371 (76.8%) | 112 (23.2%) |
Occupancy by Age of Householder in Perry
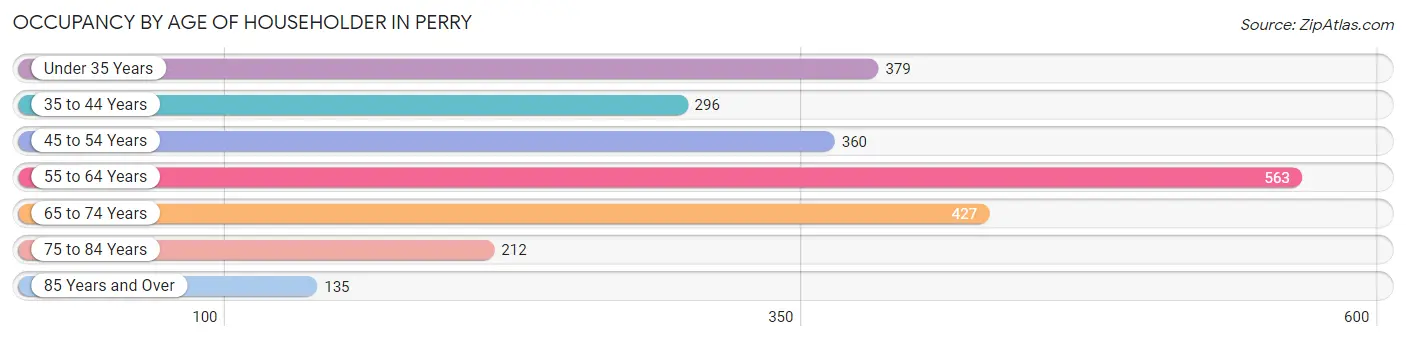
| Age Bracket | # Households | % Households |
| Under 35 Years | 379 | 16.0% |
| 35 to 44 Years | 296 | 12.5% |
| 45 to 54 Years | 360 | 15.2% |
| 55 to 64 Years | 563 | 23.7% |
| 65 to 74 Years | 427 | 18.0% |
| 75 to 84 Years | 212 | 8.9% |
| 85 Years and Over | 135 | 5.7% |
| Total | 2,372 | 100.0% |
Housing Finances in Perry
Median Income by Occupancy in Perry
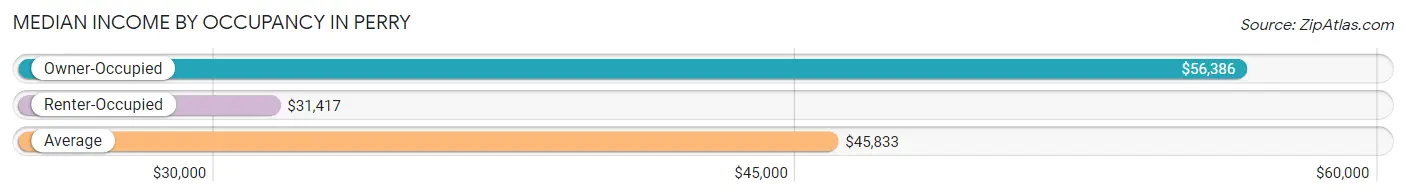
| Occupancy Type | # Households | Median Income |
| Owner-Occupied | 1,514 (63.8%) | $56,386 |
| Renter-Occupied | 858 (36.2%) | $31,417 |
| Average | 2,372 (100.0%) | $45,833 |
Occupancy by Householder Income Bracket in Perry
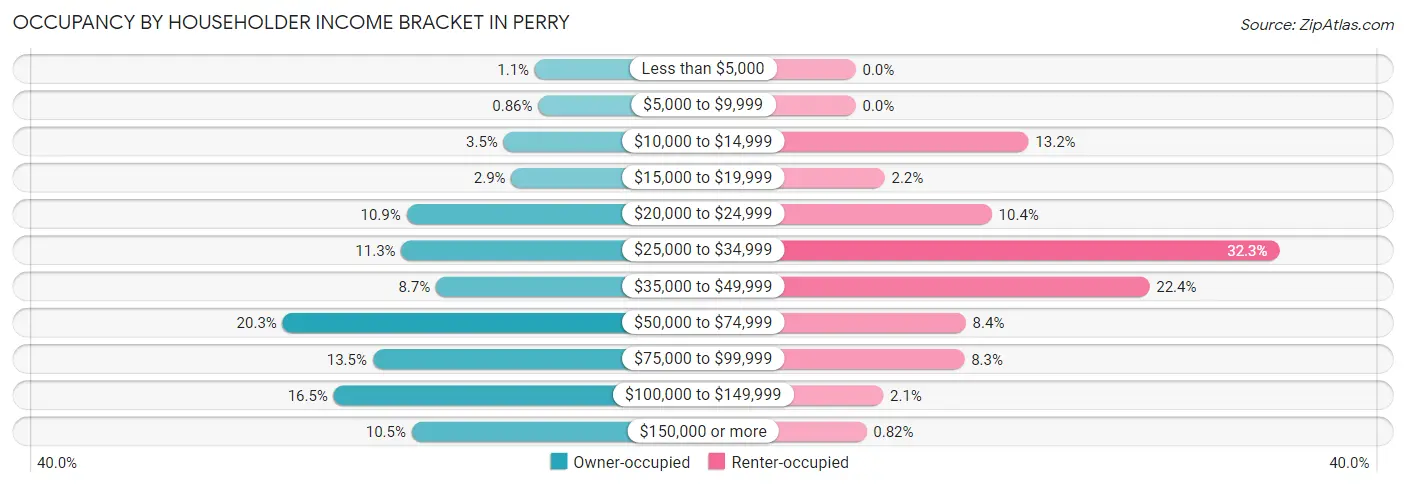
| Income Bracket | Owner-occupied | Renter-occupied |
| Less than $5,000 | 17 (1.1%) | 0 (0.0%) |
| $5,000 to $9,999 | 13 (0.9%) | 0 (0.0%) |
| $10,000 to $14,999 | 53 (3.5%) | 113 (13.2%) |
| $15,000 to $19,999 | 44 (2.9%) | 19 (2.2%) |
| $20,000 to $24,999 | 165 (10.9%) | 89 (10.4%) |
| $25,000 to $34,999 | 171 (11.3%) | 277 (32.3%) |
| $35,000 to $49,999 | 131 (8.6%) | 192 (22.4%) |
| $50,000 to $74,999 | 308 (20.3%) | 72 (8.4%) |
| $75,000 to $99,999 | 204 (13.5%) | 71 (8.3%) |
| $100,000 to $149,999 | 249 (16.5%) | 18 (2.1%) |
| $150,000 or more | 159 (10.5%) | 7 (0.8%) |
| Total | 1,514 (100.0%) | 858 (100.0%) |
Monthly Housing Cost Tiers in Perry
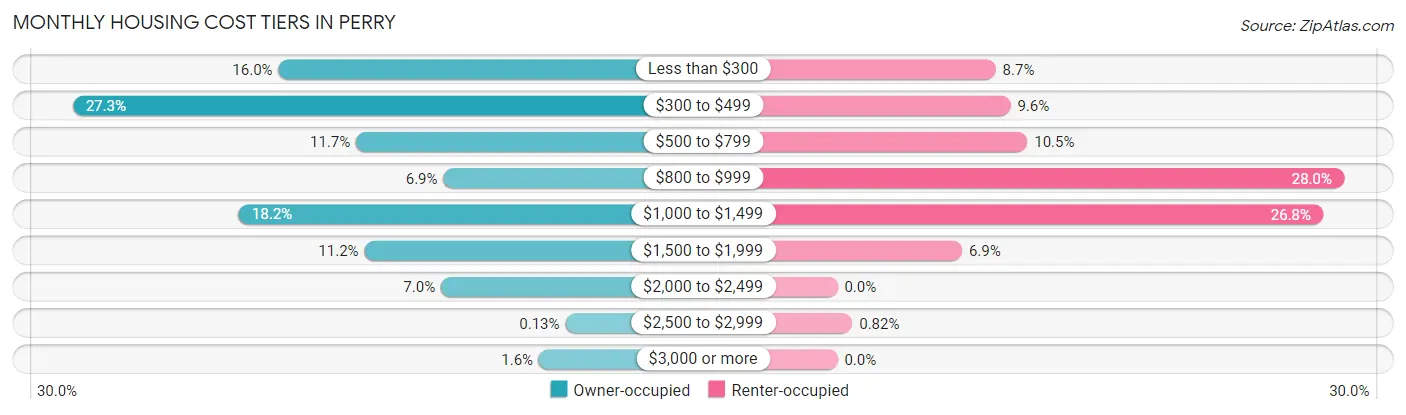
| Monthly Cost | Owner-occupied | Renter-occupied |
| Less than $300 | 242 (16.0%) | 75 (8.7%) |
| $300 to $499 | 414 (27.3%) | 82 (9.6%) |
| $500 to $799 | 177 (11.7%) | 90 (10.5%) |
| $800 to $999 | 104 (6.9%) | 240 (28.0%) |
| $1,000 to $1,499 | 275 (18.2%) | 230 (26.8%) |
| $1,500 to $1,999 | 170 (11.2%) | 59 (6.9%) |
| $2,000 to $2,499 | 106 (7.0%) | 0 (0.0%) |
| $2,500 to $2,999 | 2 (0.1%) | 7 (0.8%) |
| $3,000 or more | 24 (1.6%) | 0 (0.0%) |
| Total | 1,514 (100.0%) | 858 (100.0%) |
Physical Housing Characteristics in Perry
Housing Structures in Perry
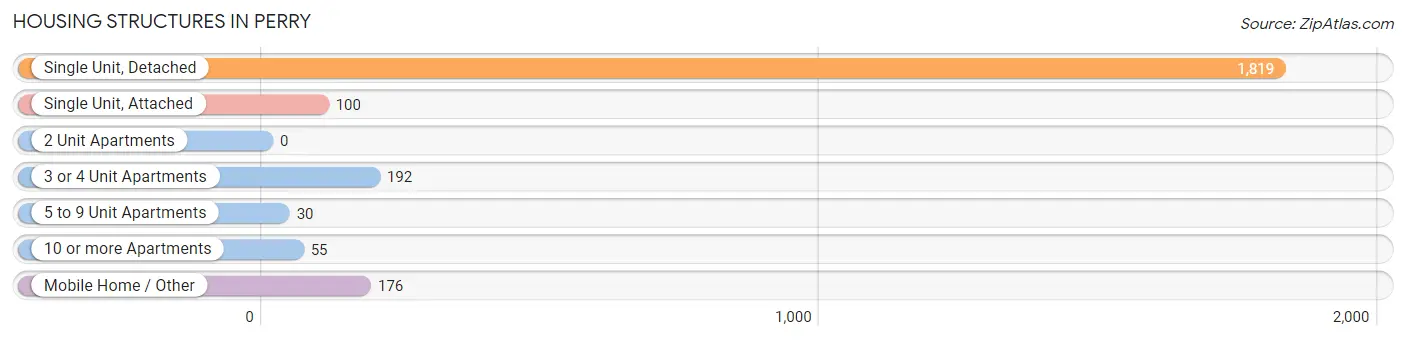
| Structure Type | # Housing Units | % Housing Units |
| Single Unit, Detached | 1,819 | 76.7% |
| Single Unit, Attached | 100 | 4.2% |
| 2 Unit Apartments | 0 | 0.0% |
| 3 or 4 Unit Apartments | 192 | 8.1% |
| 5 to 9 Unit Apartments | 30 | 1.3% |
| 10 or more Apartments | 55 | 2.3% |
| Mobile Home / Other | 176 | 7.4% |
| Total | 2,372 | 100.0% |
Housing Structures by Occupancy in Perry
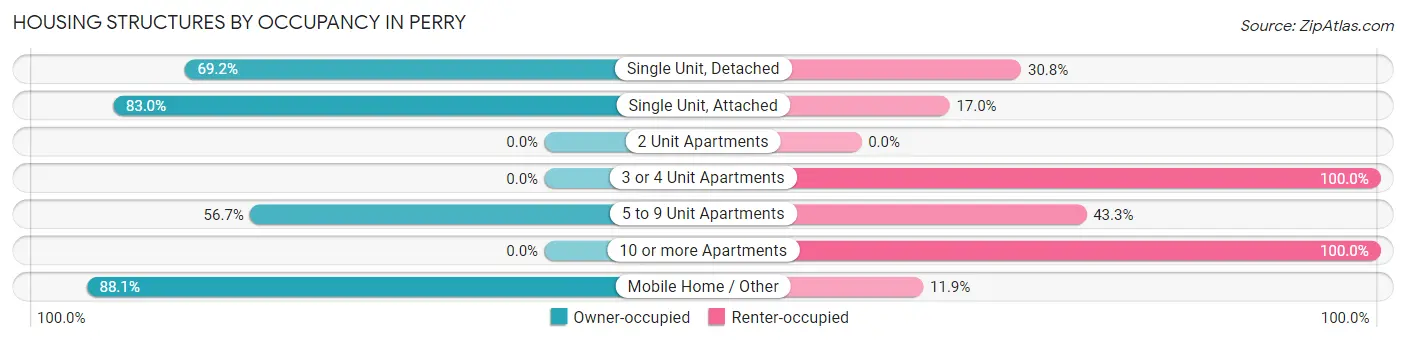
| Structure Type | Owner-occupied | Renter-occupied |
| Single Unit, Detached | 1,259 (69.2%) | 560 (30.8%) |
| Single Unit, Attached | 83 (83.0%) | 17 (17.0%) |
| 2 Unit Apartments | 0 (0.0%) | 0 (0.0%) |
| 3 or 4 Unit Apartments | 0 (0.0%) | 192 (100.0%) |
| 5 to 9 Unit Apartments | 17 (56.7%) | 13 (43.3%) |
| 10 or more Apartments | 0 (0.0%) | 55 (100.0%) |
| Mobile Home / Other | 155 (88.1%) | 21 (11.9%) |
| Total | 1,514 (63.8%) | 858 (36.2%) |
Housing Structures by Number of Rooms in Perry
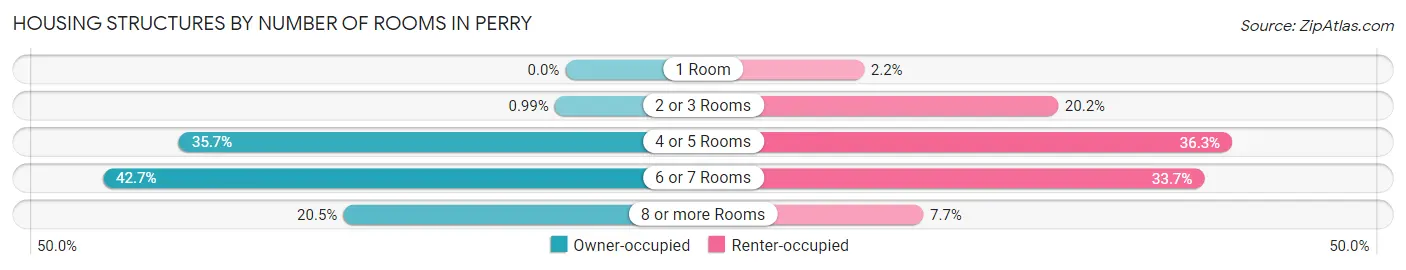
| Number of Rooms | Owner-occupied | Renter-occupied |
| 1 Room | 0 (0.0%) | 19 (2.2%) |
| 2 or 3 Rooms | 15 (1.0%) | 173 (20.2%) |
| 4 or 5 Rooms | 541 (35.7%) | 311 (36.2%) |
| 6 or 7 Rooms | 647 (42.7%) | 289 (33.7%) |
| 8 or more Rooms | 311 (20.5%) | 66 (7.7%) |
| Total | 1,514 (100.0%) | 858 (100.0%) |
Housing Structure by Heating Type in Perry
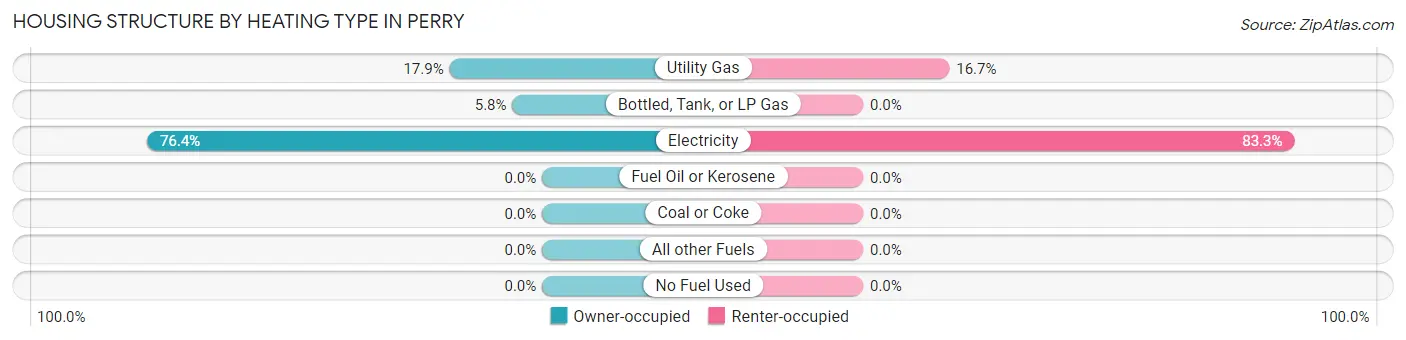
| Heating Type | Owner-occupied | Renter-occupied |
| Utility Gas | 271 (17.9%) | 143 (16.7%) |
| Bottled, Tank, or LP Gas | 87 (5.8%) | 0 (0.0%) |
| Electricity | 1,156 (76.3%) | 715 (83.3%) |
| Fuel Oil or Kerosene | 0 (0.0%) | 0 (0.0%) |
| Coal or Coke | 0 (0.0%) | 0 (0.0%) |
| All other Fuels | 0 (0.0%) | 0 (0.0%) |
| No Fuel Used | 0 (0.0%) | 0 (0.0%) |
| Total | 1,514 (100.0%) | 858 (100.0%) |
Household Vehicle Usage in Perry
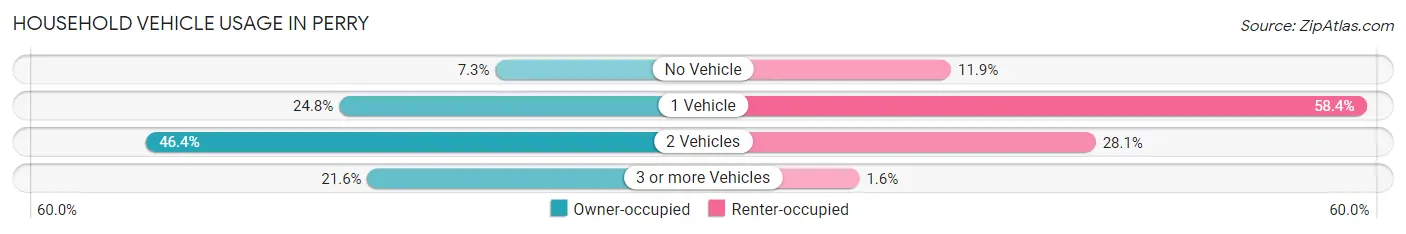
| Vehicles per Household | Owner-occupied | Renter-occupied |
| No Vehicle | 110 (7.3%) | 102 (11.9%) |
| 1 Vehicle | 375 (24.8%) | 501 (58.4%) |
| 2 Vehicles | 702 (46.4%) | 241 (28.1%) |
| 3 or more Vehicles | 327 (21.6%) | 14 (1.6%) |
| Total | 1,514 (100.0%) | 858 (100.0%) |
Real Estate & Mortgages in Perry
Real Estate and Mortgage Overview in Perry
| Characteristic | Without Mortgage | With Mortgage |
| Housing Units | 851 | 663 |
| Median Property Value | $79,700 | $206,100 |
| Median Household Income | $46,036 | $80 |
| Monthly Housing Costs | $362 | $24 |
| Real Estate Taxes | $564 | $68 |
Property Value by Mortgage Status in Perry
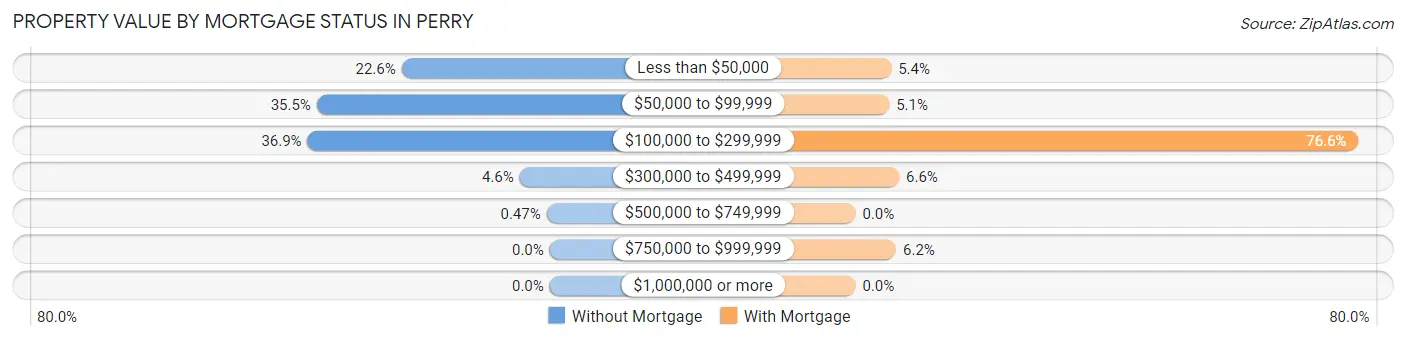
| Property Value | Without Mortgage | With Mortgage |
| Less than $50,000 | 192 (22.6%) | 36 (5.4%) |
| $50,000 to $99,999 | 302 (35.5%) | 34 (5.1%) |
| $100,000 to $299,999 | 314 (36.9%) | 508 (76.6%) |
| $300,000 to $499,999 | 39 (4.6%) | 44 (6.6%) |
| $500,000 to $749,999 | 4 (0.5%) | 0 (0.0%) |
| $750,000 to $999,999 | 0 (0.0%) | 41 (6.2%) |
| $1,000,000 or more | 0 (0.0%) | 0 (0.0%) |
| Total | 851 (100.0%) | 663 (100.0%) |
Household Income by Mortgage Status in Perry
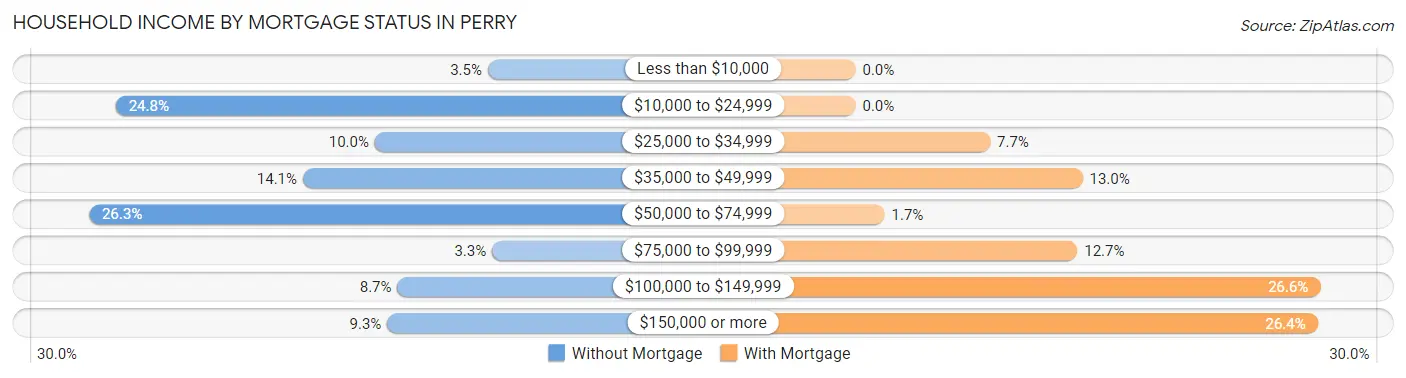
| Household Income | Without Mortgage | With Mortgage |
| Less than $10,000 | 30 (3.5%) | 0 (0.0%) |
| $10,000 to $24,999 | 211 (24.8%) | 0 (0.0%) |
| $25,000 to $34,999 | 85 (10.0%) | 51 (7.7%) |
| $35,000 to $49,999 | 120 (14.1%) | 86 (13.0%) |
| $50,000 to $74,999 | 224 (26.3%) | 11 (1.7%) |
| $75,000 to $99,999 | 28 (3.3%) | 84 (12.7%) |
| $100,000 to $149,999 | 74 (8.7%) | 176 (26.6%) |
| $150,000 or more | 79 (9.3%) | 175 (26.4%) |
| Total | 851 (100.0%) | 663 (100.0%) |
Property Value to Household Income Ratio in Perry
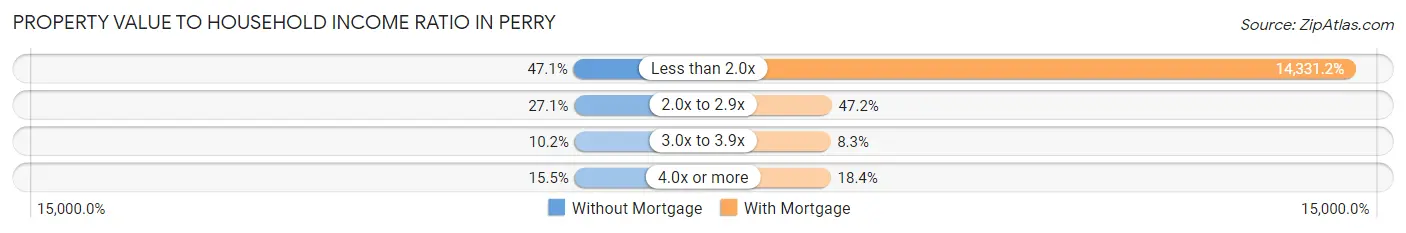
| Value-to-Income Ratio | Without Mortgage | With Mortgage |
| Less than 2.0x | 401 (47.1%) | 95,016 (14,331.2%) |
| 2.0x to 2.9x | 231 (27.1%) | 313 (47.2%) |
| 3.0x to 3.9x | 87 (10.2%) | 55 (8.3%) |
| 4.0x or more | 132 (15.5%) | 122 (18.4%) |
| Total | 851 (100.0%) | 663 (100.0%) |
Real Estate Taxes by Mortgage Status in Perry
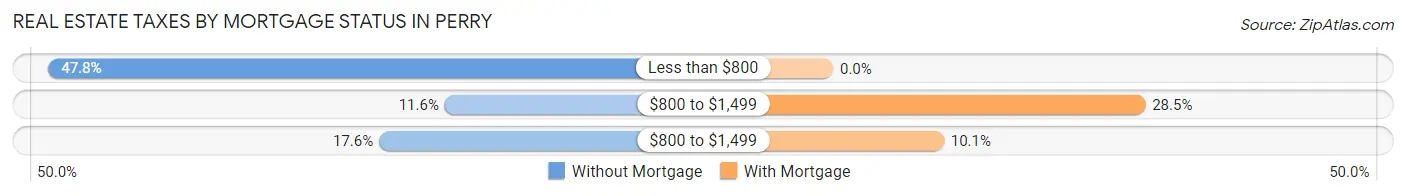
| Property Taxes | Without Mortgage | With Mortgage |
| Less than $800 | 407 (47.8%) | 0 (0.0%) |
| $800 to $1,499 | 99 (11.6%) | 189 (28.5%) |
| $800 to $1,499 | 150 (17.6%) | 67 (10.1%) |
| Total | 851 (100.0%) | 663 (100.0%) |
Health & Disability in Perry
Health Insurance Coverage by Age in Perry
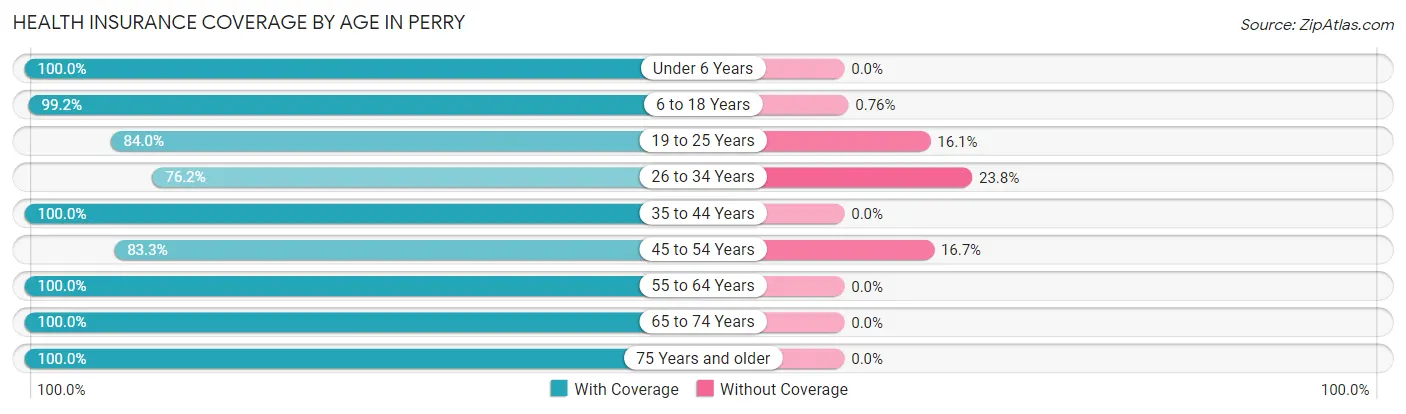
| Age Bracket | With Coverage | Without Coverage |
| Under 6 Years | 329 (100.0%) | 0 (0.0%) |
| 6 to 18 Years | 1,829 (99.2%) | 14 (0.8%) |
| 19 to 25 Years | 361 (84.0%) | 69 (16.1%) |
| 26 to 34 Years | 473 (76.2%) | 148 (23.8%) |
| 35 to 44 Years | 595 (100.0%) | 0 (0.0%) |
| 45 to 54 Years | 807 (83.3%) | 162 (16.7%) |
| 55 to 64 Years | 749 (100.0%) | 0 (0.0%) |
| 65 to 74 Years | 671 (100.0%) | 0 (0.0%) |
| 75 Years and older | 433 (100.0%) | 0 (0.0%) |
| Total | 6,247 (94.1%) | 393 (5.9%) |
Health Insurance Coverage by Citizenship Status in Perry
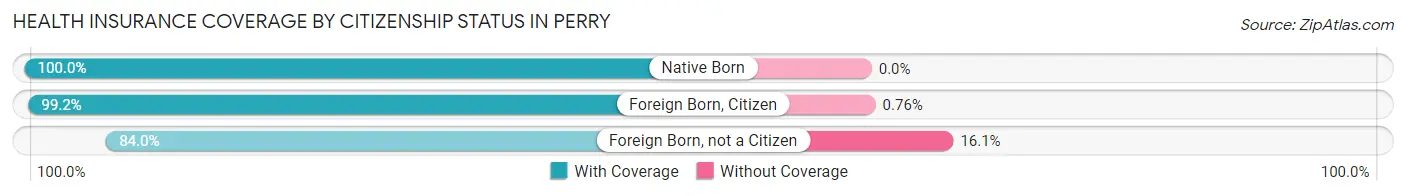
| Citizenship Status | With Coverage | Without Coverage |
| Native Born | 329 (100.0%) | 0 (0.0%) |
| Foreign Born, Citizen | 1,829 (99.2%) | 14 (0.8%) |
| Foreign Born, not a Citizen | 361 (84.0%) | 69 (16.1%) |
Health Insurance Coverage by Household Income in Perry
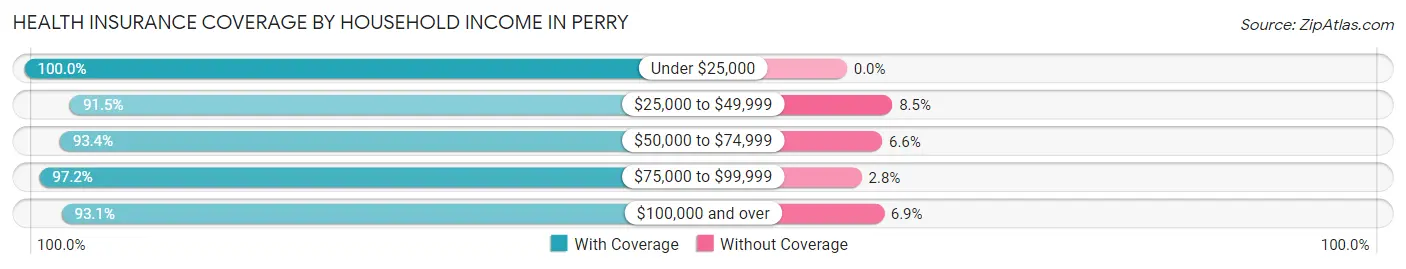
| Household Income | With Coverage | Without Coverage |
| Under $25,000 | 914 (100.0%) | 0 (0.0%) |
| $25,000 to $49,999 | 1,774 (91.5%) | 165 (8.5%) |
| $50,000 to $74,999 | 1,076 (93.4%) | 76 (6.6%) |
| $75,000 to $99,999 | 908 (97.2%) | 26 (2.8%) |
| $100,000 and over | 1,545 (93.1%) | 115 (6.9%) |
Public vs Private Health Insurance Coverage by Age in Perry
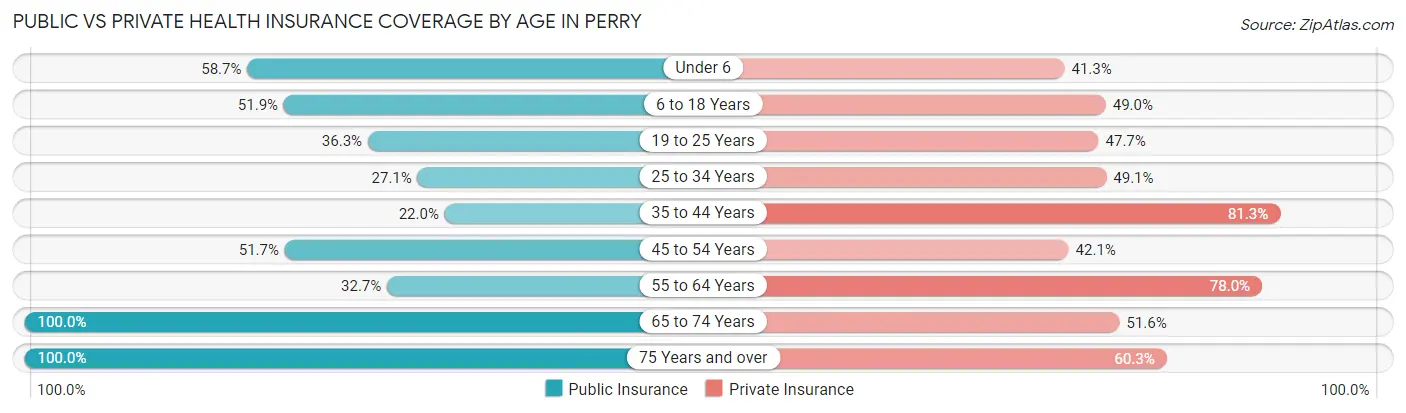
| Age Bracket | Public Insurance | Private Insurance |
| Under 6 | 193 (58.7%) | 136 (41.3%) |
| 6 to 18 Years | 956 (51.9%) | 903 (49.0%) |
| 19 to 25 Years | 156 (36.3%) | 205 (47.7%) |
| 25 to 34 Years | 168 (27.1%) | 305 (49.1%) |
| 35 to 44 Years | 131 (22.0%) | 484 (81.3%) |
| 45 to 54 Years | 501 (51.7%) | 408 (42.1%) |
| 55 to 64 Years | 245 (32.7%) | 584 (78.0%) |
| 65 to 74 Years | 671 (100.0%) | 346 (51.6%) |
| 75 Years and over | 433 (100.0%) | 261 (60.3%) |
| Total | 3,454 (52.0%) | 3,632 (54.7%) |
Disability Status by Sex by Age in Perry
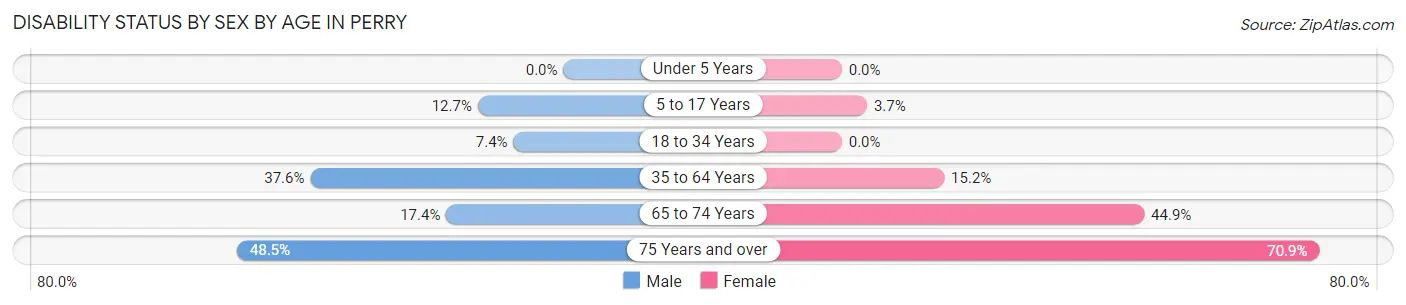
| Age Bracket | Male | Female |
| Under 5 Years | 0 (0.0%) | 0 (0.0%) |
| 5 to 17 Years | 112 (12.7%) | 35 (3.7%) |
| 18 to 34 Years | 44 (7.4%) | 0 (0.0%) |
| 35 to 64 Years | 407 (37.6%) | 187 (15.2%) |
| 65 to 74 Years | 40 (17.4%) | 198 (44.9%) |
| 75 Years and over | 80 (48.5%) | 190 (70.9%) |
Disability Class by Sex by Age in Perry
Disability Class: Hearing Difficulty
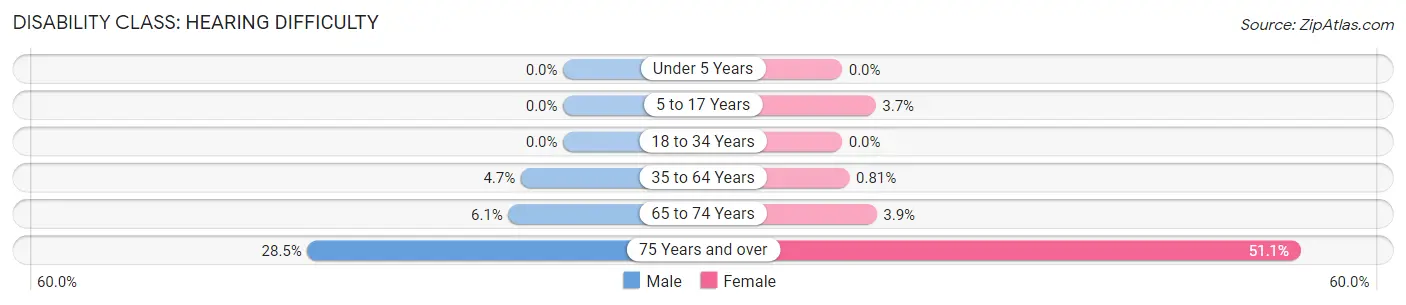
| Age Bracket | Male | Female |
| Under 5 Years | 0 (0.0%) | 0 (0.0%) |
| 5 to 17 Years | 0 (0.0%) | 35 (3.7%) |
| 18 to 34 Years | 0 (0.0%) | 0 (0.0%) |
| 35 to 64 Years | 51 (4.7%) | 10 (0.8%) |
| 65 to 74 Years | 14 (6.1%) | 17 (3.8%) |
| 75 Years and over | 47 (28.5%) | 137 (51.1%) |
Disability Class: Vision Difficulty
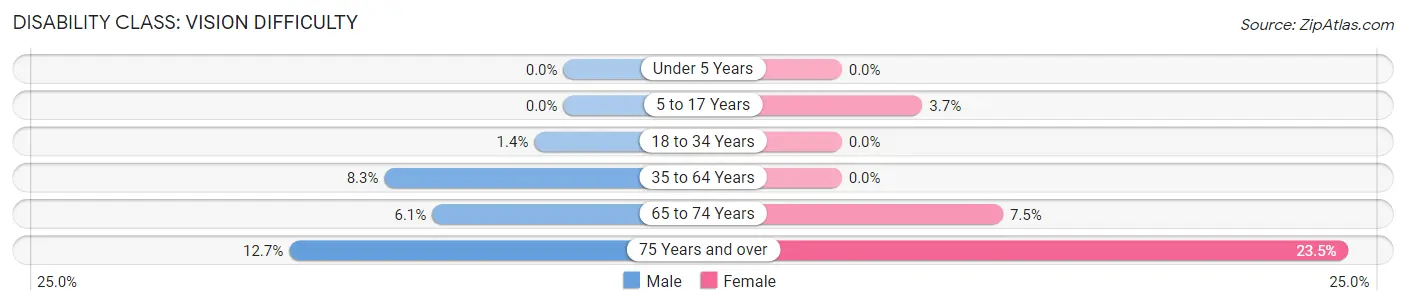
| Age Bracket | Male | Female |
| Under 5 Years | 0 (0.0%) | 0 (0.0%) |
| 5 to 17 Years | 0 (0.0%) | 35 (3.7%) |
| 18 to 34 Years | 8 (1.3%) | 0 (0.0%) |
| 35 to 64 Years | 90 (8.3%) | 0 (0.0%) |
| 65 to 74 Years | 14 (6.1%) | 33 (7.5%) |
| 75 Years and over | 21 (12.7%) | 63 (23.5%) |
Disability Class: Cognitive Difficulty
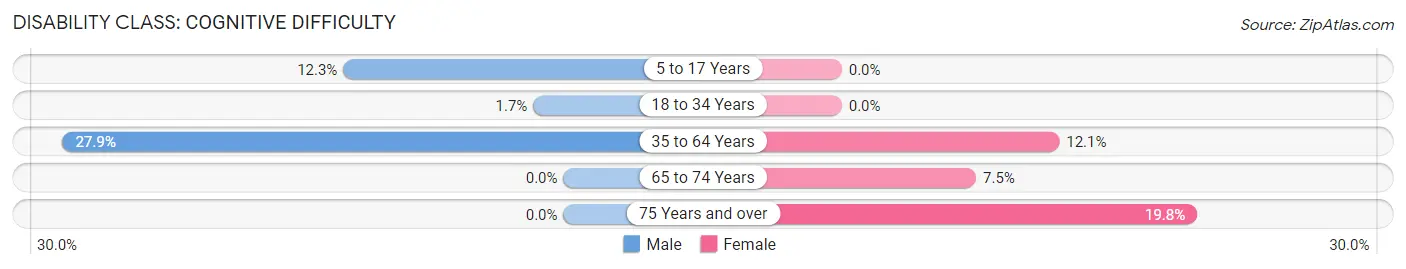
| Age Bracket | Male | Female |
| 5 to 17 Years | 108 (12.3%) | 0 (0.0%) |
| 18 to 34 Years | 10 (1.7%) | 0 (0.0%) |
| 35 to 64 Years | 302 (27.9%) | 149 (12.1%) |
| 65 to 74 Years | 0 (0.0%) | 33 (7.5%) |
| 75 Years and over | 0 (0.0%) | 53 (19.8%) |
Disability Class: Ambulatory Difficulty
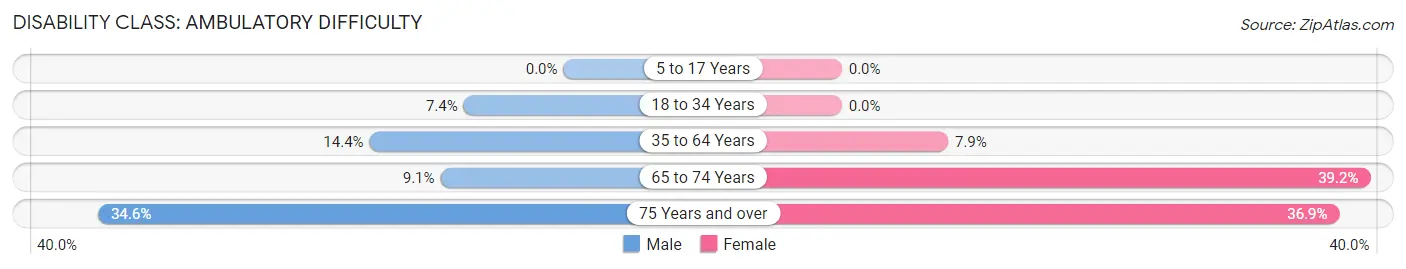
| Age Bracket | Male | Female |
| 5 to 17 Years | 0 (0.0%) | 0 (0.0%) |
| 18 to 34 Years | 44 (7.4%) | 0 (0.0%) |
| 35 to 64 Years | 156 (14.4%) | 97 (7.9%) |
| 65 to 74 Years | 21 (9.1%) | 173 (39.2%) |
| 75 Years and over | 57 (34.5%) | 99 (36.9%) |
Disability Class: Self-Care Difficulty
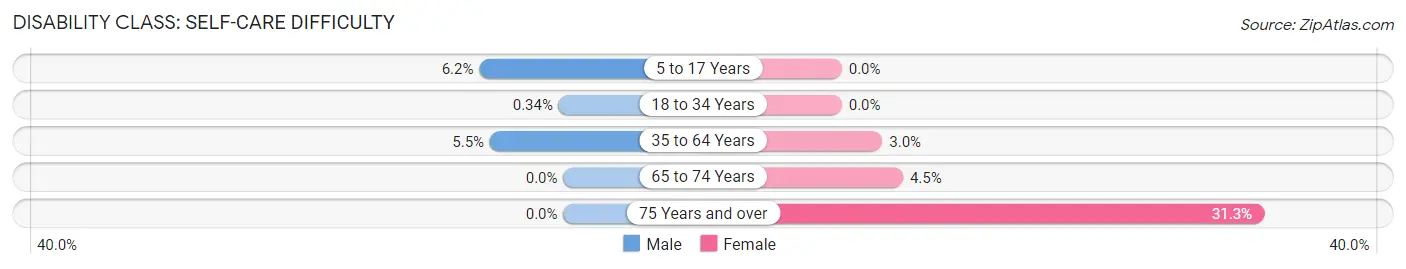
| Age Bracket | Male | Female |
| 5 to 17 Years | 55 (6.2%) | 0 (0.0%) |
| 18 to 34 Years | 2 (0.3%) | 0 (0.0%) |
| 35 to 64 Years | 59 (5.4%) | 37 (3.0%) |
| 65 to 74 Years | 0 (0.0%) | 20 (4.5%) |
| 75 Years and over | 0 (0.0%) | 84 (31.3%) |
Technology Access in Perry
Computing Device Access in Perry
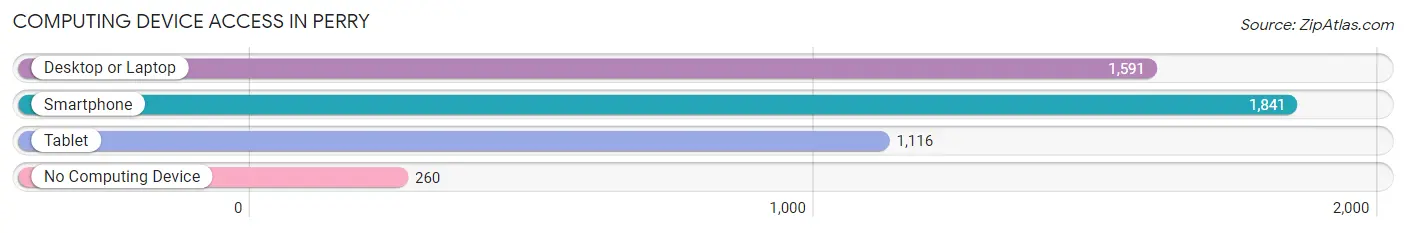
| Device Type | # Households | % Households |
| Desktop or Laptop | 1,591 | 67.1% |
| Smartphone | 1,841 | 77.6% |
| Tablet | 1,116 | 47.0% |
| No Computing Device | 260 | 11.0% |
| Total | 2,372 | 100.0% |
Internet Access in Perry
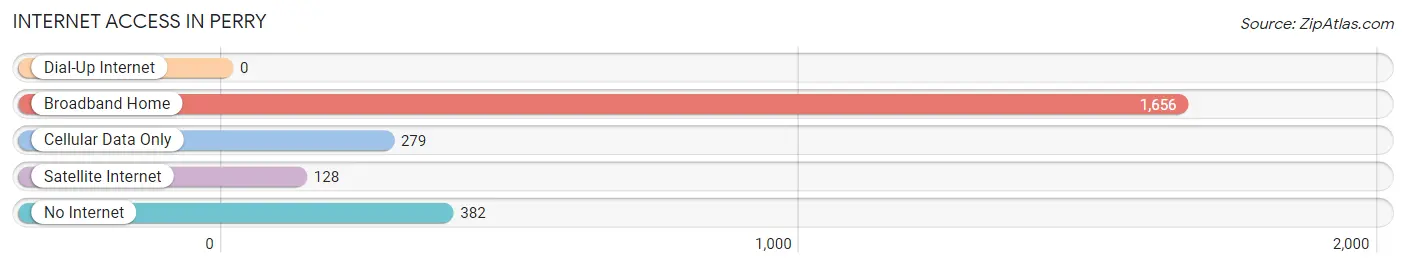
| Internet Type | # Households | % Households |
| Dial-Up Internet | 0 | 0.0% |
| Broadband Home | 1,656 | 69.8% |
| Cellular Data Only | 279 | 11.8% |
| Satellite Internet | 128 | 5.4% |
| No Internet | 382 | 16.1% |
| Total | 2,372 | 100.0% |
Perry Summary
Perry, Florida is a small city located in Taylor County, Florida. It is the county seat of Taylor County and is located about 50 miles southeast of Tallahassee. The city has a population of about 7,000 people and is known for its historic downtown area, which is listed on the National Register of Historic Places.
Geography
Perry is located in the Big Bend region of Florida, which is known for its rolling hills and flatwoods. The city is situated on the banks of the Steinhatchee River, which is a tributary of the Suwannee River. The city is surrounded by the Taylor County Conservation Area, which is a protected area of natural beauty. The city is also located near the Gulf of Mexico, which is about 30 miles away.
The climate in Perry is humid subtropical, with hot summers and mild winters. The average temperature in the summer is around 90 degrees Fahrenheit, and the average temperature in the winter is around 60 degrees Fahrenheit. The city receives an average of 54 inches of rain per year.
Economy
Perry is a small city with a diverse economy. The city is home to several industries, including timber, agriculture, and manufacturing. The timber industry is the largest employer in the city, with several sawmills and wood-processing plants located in the area. Agriculture is also an important part of the economy, with several farms located in the area. Manufacturing is also an important part of the economy, with several factories located in the city.
The city is also home to several retail stores, restaurants, and other businesses. The city is also home to several government offices, including the Taylor County Courthouse and the Taylor County Sheriff's Office.
Demographics
As of the 2010 census, the population of Perry was 7,017. The racial makeup of the city was 75.3% White, 19.2% African American, 0.4% Native American, 0.7% Asian, 0.1% Pacific Islander, and 4.3% from other races. Hispanic or Latino of any race were 8.2% of the population.
The median income for a household in Perry was $30,938, and the median income for a family was $37,917. The per capita income for the city was $17,845. About 19.2% of the population was below the poverty line.
Conclusion
Perry, Florida is a small city located in Taylor County, Florida. It is the county seat of Taylor County and is known for its historic downtown area, which is listed on the National Register of Historic Places. The city has a diverse economy, with industries such as timber, agriculture, and manufacturing. The population of Perry was 7,017 as of the 2010 census, and the median income for a household was $30,938. Perry is a small city with a rich history and a diverse economy, making it an attractive place to live and work.
Common Questions
What is Per Capita Income in Perry?
Per Capita income in Perry is $24,254.
What is the Median Family Income in Perry?
Median Family Income in Perry is $51,581.
What is the Median Household income in Perry?
Median Household Income in Perry is $45,833.
What is Income or Wage Gap in Perry?
Income or Wage Gap in Perry is 30.0%.
Women in Perry earn 70.0 cents for every dollar earned by a man.
What is Inequality or Gini Index in Perry?
Inequality or Gini Index in Perry is 0.42.
What is the Total Population of Perry?
Total Population of Perry is 6,879.
What is the Total Male Population of Perry?
Total Male Population of Perry is 3,206.
What is the Total Female Population of Perry?
Total Female Population of Perry is 3,673.
What is the Ratio of Males per 100 Females in Perry?
There are 87.29 Males per 100 Females in Perry.
What is the Ratio of Females per 100 Males in Perry?
There are 114.57 Females per 100 Males in Perry.
What is the Median Population Age in Perry?
Median Population Age in Perry is 38.3 Years.
What is the Average Family Size in Perry
Average Family Size in Perry is 3.3 People.
What is the Average Household Size in Perry
Average Household Size in Perry is 2.8 People.
How Large is the Labor Force in Perry?
There are 2,880 People in the Labor Forcein in Perry.
What is the Percentage of People in the Labor Force in Perry?
56.2% of People are in the Labor Force in Perry.
What is the Unemployment Rate in Perry?
Unemployment Rate in Perry is 8.1%.