Bishopville, SC Map & Demographics
Bishopville Map
Bishopville Overview
$23,701
PER CAPITA INCOME
$43,194
AVG FAMILY INCOME
$40,909
AVG HOUSEHOLD INCOME
36.4%
WAGE / INCOME GAP [ % ]
63.6¢/ $1
WAGE / INCOME GAP [ $ ]
0.46
INEQUALITY / GINI INDEX
2,986
TOTAL POPULATION
1,534
MALE POPULATION
1,452
FEMALE POPULATION
105.65
MALES / 100 FEMALES
94.65
FEMALES / 100 MALES
47.3
MEDIAN AGE
2.9
AVG FAMILY SIZE
2.1
AVG HOUSEHOLD SIZE
1,169
LABOR FORCE [ PEOPLE ]
49.6%
PERCENT IN LABOR FORCE
4.0%
UNEMPLOYMENT RATE
Bishopville Zip Codes
Bishopville Area Codes
Income in Bishopville
Income Overview in Bishopville
Per Capita Income in Bishopville is $23,701, while median incomes of families and households are $43,194 and $40,909 respectively.
| Characteristic | Number | Measure |
| Per Capita Income | 2,986 | $23,701 |
| Median Family Income | 717 | $43,194 |
| Mean Family Income | 717 | $60,042 |
| Median Household Income | 1,332 | $40,909 |
| Mean Household Income | 1,332 | $50,621 |
| Income Deficit | 717 | $0 |
| Wage / Income Gap (%) | 2,986 | 36.42% |
| Wage / Income Gap ($) | 2,986 | 63.58¢ per $1 |
| Gini / Inequality Index | 2,986 | 0.46 |
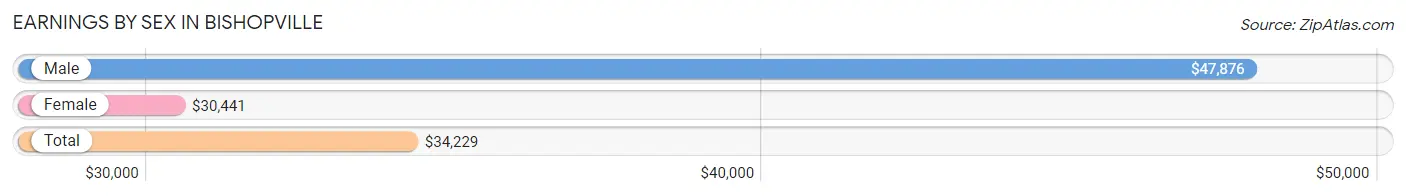
Earnings by Sex in Bishopville
Average Earnings in Bishopville are $34,229, $47,876 for men and $30,441 for women, a difference of 36.4%.
| Sex | Number | Average Earnings |
| Male | 620 (49.2%) | $47,876 |
| Female | 640 (50.8%) | $30,441 |
| Total | 1,260 (100.0%) | $34,229 |
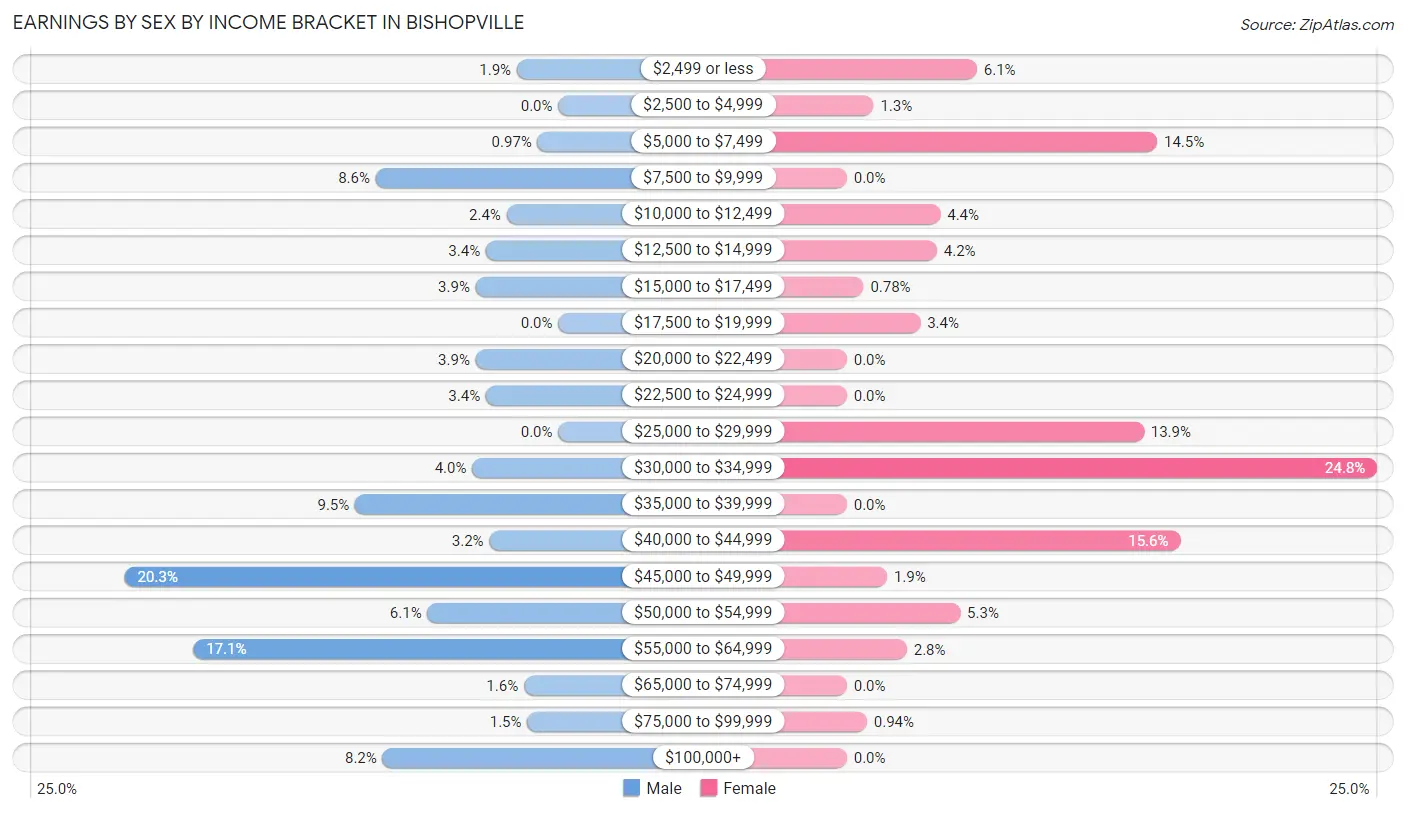
Earnings by Sex by Income Bracket in Bishopville
The most common earnings brackets in Bishopville are $45,000 to $49,999 for men (126 | 20.3%) and $30,000 to $34,999 for women (159 | 24.8%).
| Income | Male | Female |
| $2,499 or less | 12 (1.9%) | 39 (6.1%) |
| $2,500 to $4,999 | 0 (0.0%) | 8 (1.3%) |
| $5,000 to $7,499 | 6 (1.0%) | 93 (14.5%) |
| $7,500 to $9,999 | 53 (8.6%) | 0 (0.0%) |
| $10,000 to $12,499 | 15 (2.4%) | 28 (4.4%) |
| $12,500 to $14,999 | 21 (3.4%) | 27 (4.2%) |
| $15,000 to $17,499 | 24 (3.9%) | 5 (0.8%) |
| $17,500 to $19,999 | 0 (0.0%) | 22 (3.4%) |
| $20,000 to $22,499 | 24 (3.9%) | 0 (0.0%) |
| $22,500 to $24,999 | 21 (3.4%) | 0 (0.0%) |
| $25,000 to $29,999 | 0 (0.0%) | 89 (13.9%) |
| $30,000 to $34,999 | 25 (4.0%) | 159 (24.8%) |
| $35,000 to $39,999 | 59 (9.5%) | 0 (0.0%) |
| $40,000 to $44,999 | 20 (3.2%) | 100 (15.6%) |
| $45,000 to $49,999 | 126 (20.3%) | 12 (1.9%) |
| $50,000 to $54,999 | 38 (6.1%) | 34 (5.3%) |
| $55,000 to $64,999 | 106 (17.1%) | 18 (2.8%) |
| $65,000 to $74,999 | 10 (1.6%) | 0 (0.0%) |
| $75,000 to $99,999 | 9 (1.5%) | 6 (0.9%) |
| $100,000+ | 51 (8.2%) | 0 (0.0%) |
| Total | 620 (100.0%) | 640 (100.0%) |
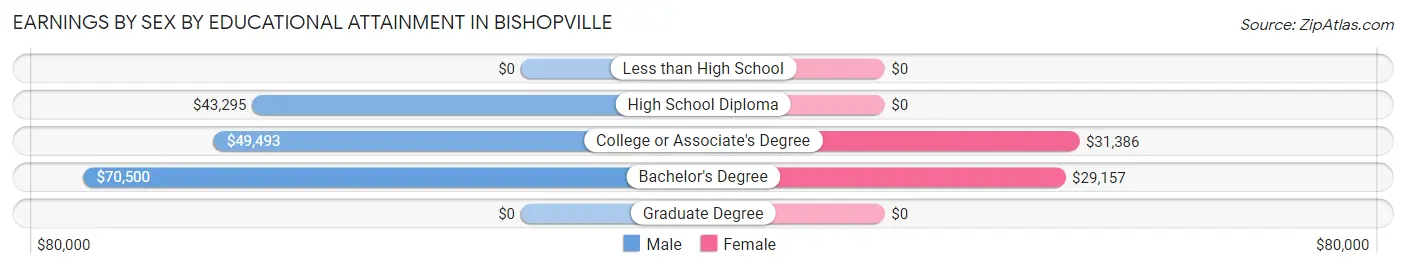
Earnings by Sex by Educational Attainment in Bishopville
Average earnings in Bishopville are $48,042 for men and $29,962 for women, a difference of 37.6%. Men with an educational attainment of bachelor's degree enjoy the highest average annual earnings of $70,500, while those with high school diploma education earn the least with $43,295. Women with an educational attainment of college or associate's degree earn the most with the average annual earnings of $31,386, while those with bachelor's degree education have the smallest earnings of $29,157.
| Educational Attainment | Male Income | Female Income |
| Less than High School | - | - |
| High School Diploma | $43,295 | $0 |
| College or Associate's Degree | $49,493 | $31,386 |
| Bachelor's Degree | $70,500 | $29,157 |
| Graduate Degree | - | - |
| Total | $48,042 | $29,962 |
Family Income in Bishopville
Family Income Brackets in Bishopville
According to the Bishopville family income data, there are 187 families falling into the $35,000 to $49,999 income range, which is the most common income bracket and makes up 26.1% of all families. Conversely, the $200,000+ income bracket is the least frequent group with only 13 families (1.8%) belonging to this category.
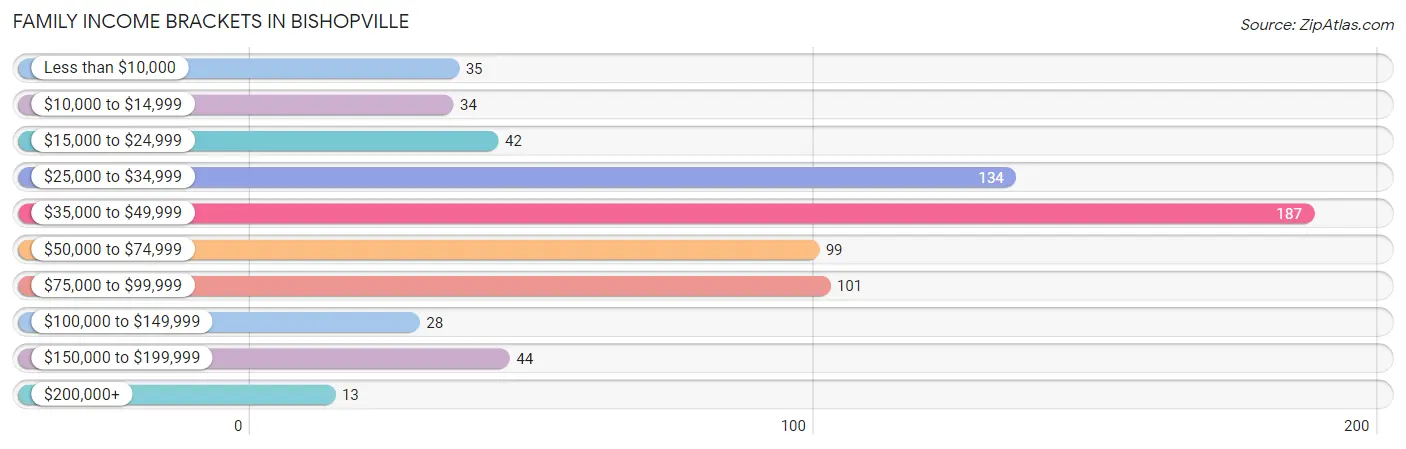
| Income Bracket | # Families | % Families |
| Less than $10,000 | 35 | 4.9% |
| $10,000 to $14,999 | 34 | 4.7% |
| $15,000 to $24,999 | 42 | 5.9% |
| $25,000 to $34,999 | 134 | 18.7% |
| $35,000 to $49,999 | 187 | 26.1% |
| $50,000 to $74,999 | 99 | 13.8% |
| $75,000 to $99,999 | 101 | 14.1% |
| $100,000 to $149,999 | 28 | 3.9% |
| $150,000 to $199,999 | 44 | 6.1% |
| $200,000+ | 13 | 1.8% |
Family Income by Famaliy Size in Bishopville
3-person families (143 | 19.9%) account for the highest median family income in Bishopville with $87,917 per family, while 3-person families (143 | 19.9%) have the highest median income of $29,306 per family member.
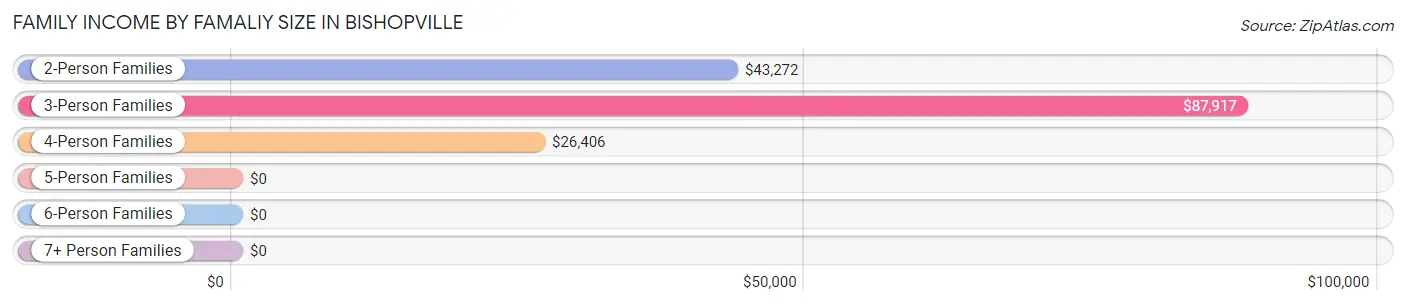
| Income Bracket | # Families | Median Income |
| 2-Person Families | 406 (56.6%) | $43,272 |
| 3-Person Families | 143 (19.9%) | $87,917 |
| 4-Person Families | 73 (10.2%) | $26,406 |
| 5-Person Families | 72 (10.0%) | $0 |
| 6-Person Families | 23 (3.2%) | $0 |
| 7+ Person Families | 0 (0.0%) | $0 |
| Total | 717 (100.0%) | $43,194 |
Family Income by Number of Earners in Bishopville
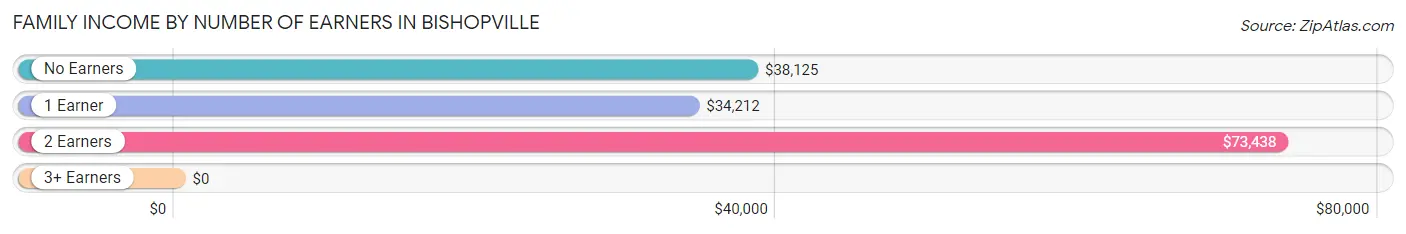
| Number of Earners | # Families | Median Income |
| No Earners | 138 (19.3%) | $38,125 |
| 1 Earner | 329 (45.9%) | $34,212 |
| 2 Earners | 244 (34.0%) | $73,438 |
| 3+ Earners | 6 (0.8%) | $0 |
| Total | 717 (100.0%) | $43,194 |
Household Income in Bishopville
Household Income Brackets in Bishopville
With 301 households falling in the category, the $35,000 to $49,999 income range is the most frequent in Bishopville, accounting for 22.6% of all households. In contrast, only 28 households (2.1%) fall into the $100,000 to $149,999 income bracket, making it the least populous group.
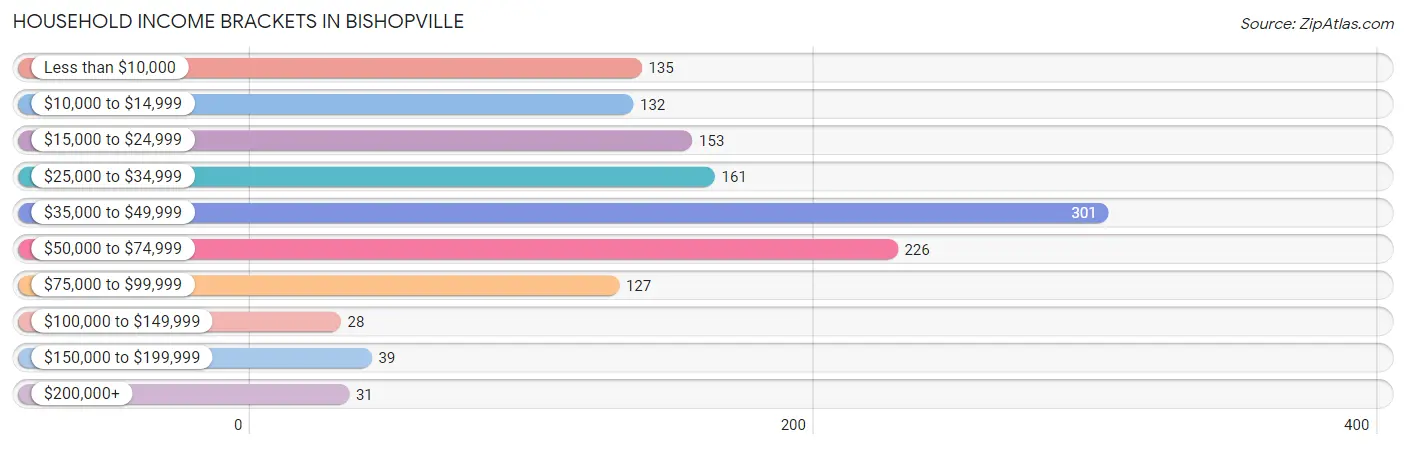
| Income Bracket | # Households | % Households |
| Less than $10,000 | 135 | 10.1% |
| $10,000 to $14,999 | 132 | 9.9% |
| $15,000 to $24,999 | 153 | 11.5% |
| $25,000 to $34,999 | 161 | 12.1% |
| $35,000 to $49,999 | 301 | 22.6% |
| $50,000 to $74,999 | 226 | 17.0% |
| $75,000 to $99,999 | 127 | 9.5% |
| $100,000 to $149,999 | 28 | 2.1% |
| $150,000 to $199,999 | 39 | 2.9% |
| $200,000+ | 31 | 2.3% |
Household Income by Householder Age in Bishopville
The median household income in Bishopville is $40,909, with the highest median household income of $45,795 found in the 25 to 44 years age bracket for the primary householder. A total of 427 households (32.1%) fall into this category. Meanwhile, the 15 to 24 years age bracket for the primary householder has the lowest median household income of $0, with 8 households (0.6%) in this group.
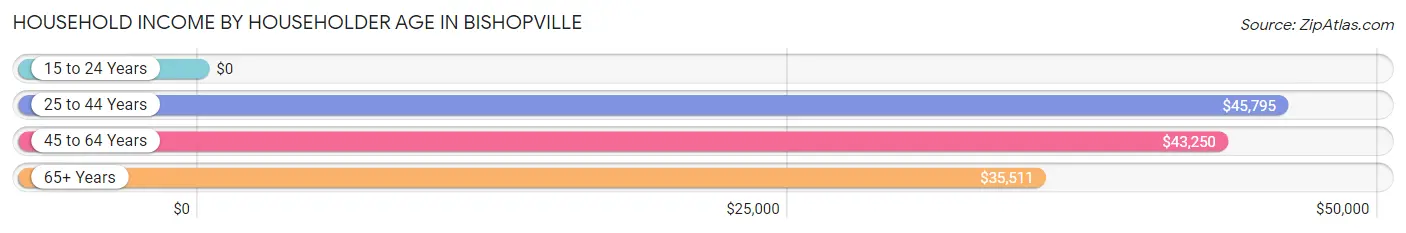
| Income Bracket | # Households | Median Income |
| 15 to 24 Years | 8 (0.6%) | $0 |
| 25 to 44 Years | 427 (32.1%) | $45,795 |
| 45 to 64 Years | 502 (37.7%) | $43,250 |
| 65+ Years | 395 (29.6%) | $35,511 |
| Total | 1,332 (100.0%) | $40,909 |
Poverty in Bishopville
Income Below Poverty by Sex and Age in Bishopville
With 27.6% poverty level for males and 30.0% for females among the residents of Bishopville, 15 year old males and 6 to 11 year old females are the most vulnerable to poverty, with 46 males (68.7%) and 35 females (60.3%) in their respective age groups living below the poverty level.
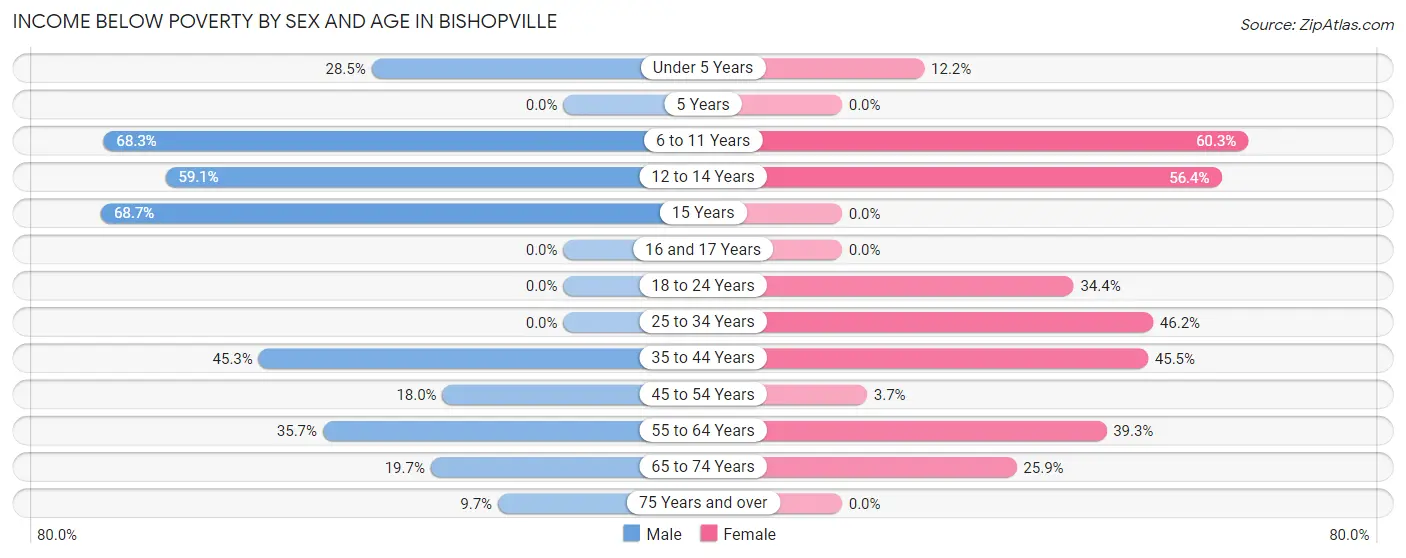
| Age Bracket | Male | Female |
| Under 5 Years | 45 (28.5%) | 11 (12.2%) |
| 5 Years | 0 (0.0%) | 0 (0.0%) |
| 6 to 11 Years | 56 (68.3%) | 35 (60.3%) |
| 12 to 14 Years | 13 (59.1%) | 71 (56.4%) |
| 15 Years | 46 (68.7%) | 0 (0.0%) |
| 16 and 17 Years | 0 (0.0%) | 0 (0.0%) |
| 18 to 24 Years | 0 (0.0%) | 43 (34.4%) |
| 25 to 34 Years | 0 (0.0%) | 79 (46.2%) |
| 35 to 44 Years | 81 (45.3%) | 60 (45.5%) |
| 45 to 54 Years | 35 (17.9%) | 8 (3.7%) |
| 55 to 64 Years | 65 (35.7%) | 64 (39.3%) |
| 65 to 74 Years | 51 (19.7%) | 42 (25.9%) |
| 75 Years and over | 10 (9.7%) | 0 (0.0%) |
| Total | 402 (27.6%) | 413 (30.0%) |
Income Above Poverty by Sex and Age in Bishopville
According to the poverty statistics in Bishopville, males aged 5 years and females aged 75 years and over are the age groups that are most secure financially, with 100.0% of males and 100.0% of females in these age groups living above the poverty line.
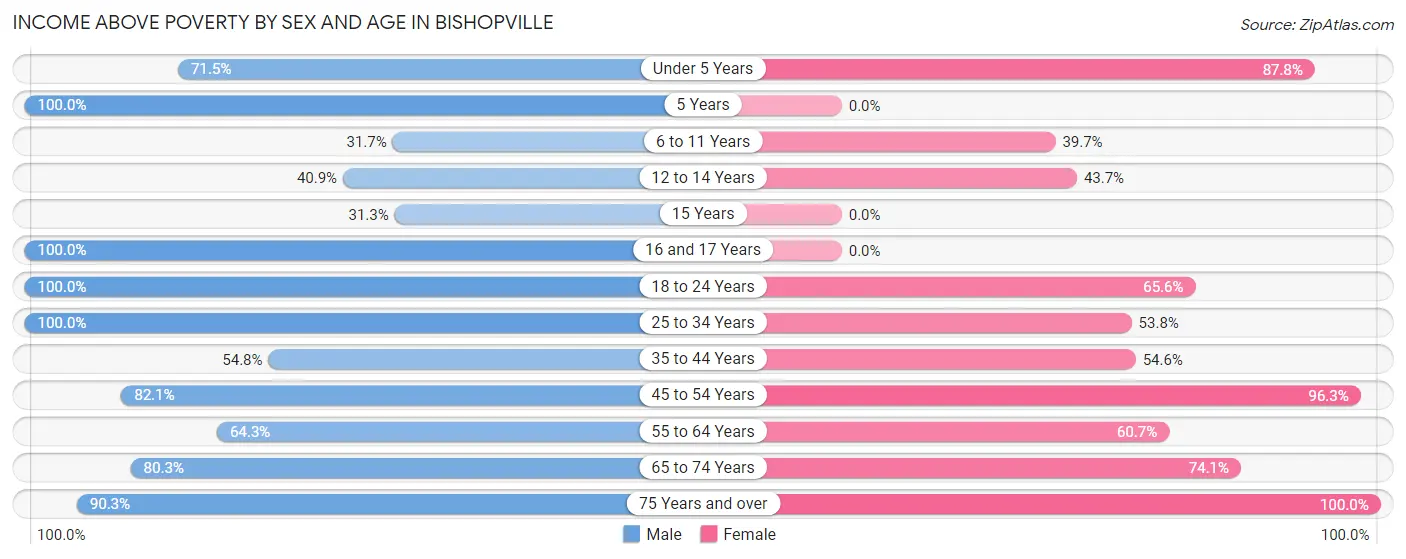
| Age Bracket | Male | Female |
| Under 5 Years | 113 (71.5%) | 79 (87.8%) |
| 5 Years | 19 (100.0%) | 0 (0.0%) |
| 6 to 11 Years | 26 (31.7%) | 23 (39.7%) |
| 12 to 14 Years | 9 (40.9%) | 55 (43.6%) |
| 15 Years | 21 (31.3%) | 0 (0.0%) |
| 16 and 17 Years | 10 (100.0%) | 0 (0.0%) |
| 18 to 24 Years | 34 (100.0%) | 82 (65.6%) |
| 25 to 34 Years | 149 (100.0%) | 92 (53.8%) |
| 35 to 44 Years | 98 (54.7%) | 72 (54.5%) |
| 45 to 54 Years | 160 (82.1%) | 207 (96.3%) |
| 55 to 64 Years | 117 (64.3%) | 99 (60.7%) |
| 65 to 74 Years | 208 (80.3%) | 120 (74.1%) |
| 75 Years and over | 93 (90.3%) | 133 (100.0%) |
| Total | 1,057 (72.5%) | 962 (70.0%) |
Income Below Poverty Among Married-Couple Families in Bishopville
The poverty statistics for married-couple families in Bishopville show that 4.2% or 14 of the total 336 families live below the poverty line. Families with 1 or 2 children have the highest poverty rate of 15.3%, comprising of 11 families. On the other hand, families with no children have the lowest poverty rate of 1.1%, which includes 3 families.
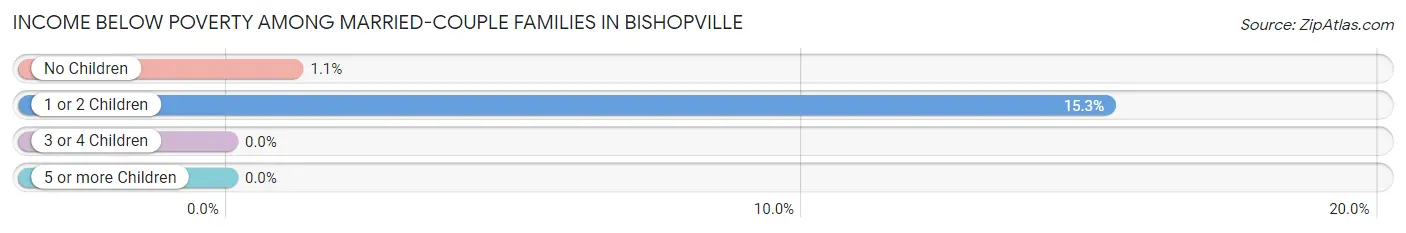
| Children | Above Poverty | Below Poverty |
| No Children | 261 (98.9%) | 3 (1.1%) |
| 1 or 2 Children | 61 (84.7%) | 11 (15.3%) |
| 3 or 4 Children | 0 (0.0%) | 0 (0.0%) |
| 5 or more Children | 0 (0.0%) | 0 (0.0%) |
| Total | 322 (95.8%) | 14 (4.2%) |
Income Below Poverty Among Single-Parent Households in Bishopville
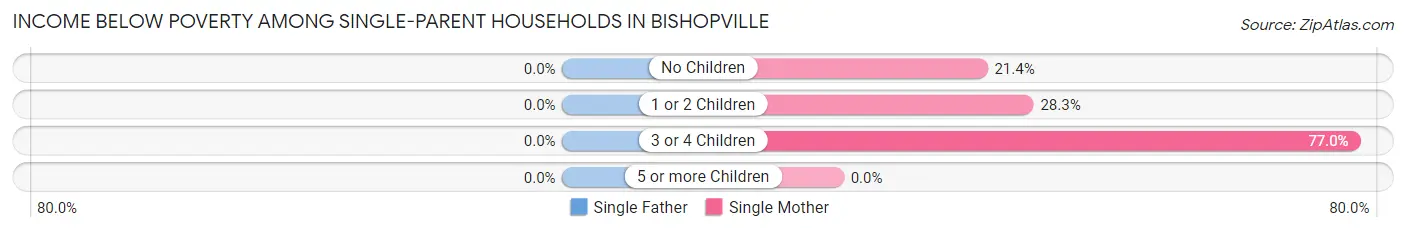
| Children | Single Father | Single Mother |
| No Children | 0 (0.0%) | 24 (21.4%) |
| 1 or 2 Children | 0 (0.0%) | 28 (28.3%) |
| 3 or 4 Children | 0 (0.0%) | 77 (77.0%) |
| 5 or more Children | 0 (0.0%) | 0 (0.0%) |
| Total | 0 (0.0%) | 129 (41.5%) |
Income Below Poverty Among Married-Couple vs Single-Parent Households in Bishopville
The poverty data for Bishopville shows that 14 of the married-couple family households (4.2%) and 129 of the single-parent households (33.9%) are living below the poverty level. Within the married-couple family households, those with 1 or 2 children have the highest poverty rate, with 11 households (15.3%) falling below the poverty line. Among the single-parent households, those with 3 or 4 children have the highest poverty rate, with 77 household (58.8%) living below poverty.
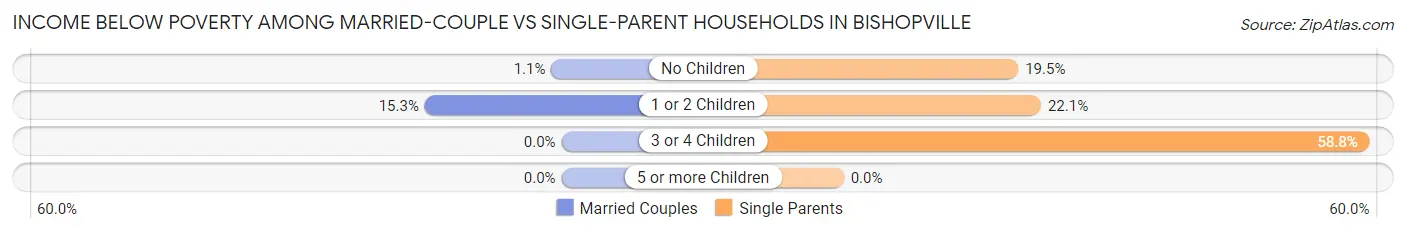
| Children | Married-Couple Families | Single-Parent Households |
| No Children | 3 (1.1%) | 24 (19.5%) |
| 1 or 2 Children | 11 (15.3%) | 28 (22.1%) |
| 3 or 4 Children | 0 (0.0%) | 77 (58.8%) |
| 5 or more Children | 0 (0.0%) | 0 (0.0%) |
| Total | 14 (4.2%) | 129 (33.9%) |
Race in Bishopville
The most populous races in Bishopville are Black / African American (2,124 | 71.1%), White / Caucasian (810 | 27.1%), and Two or more Races (52 | 1.7%).
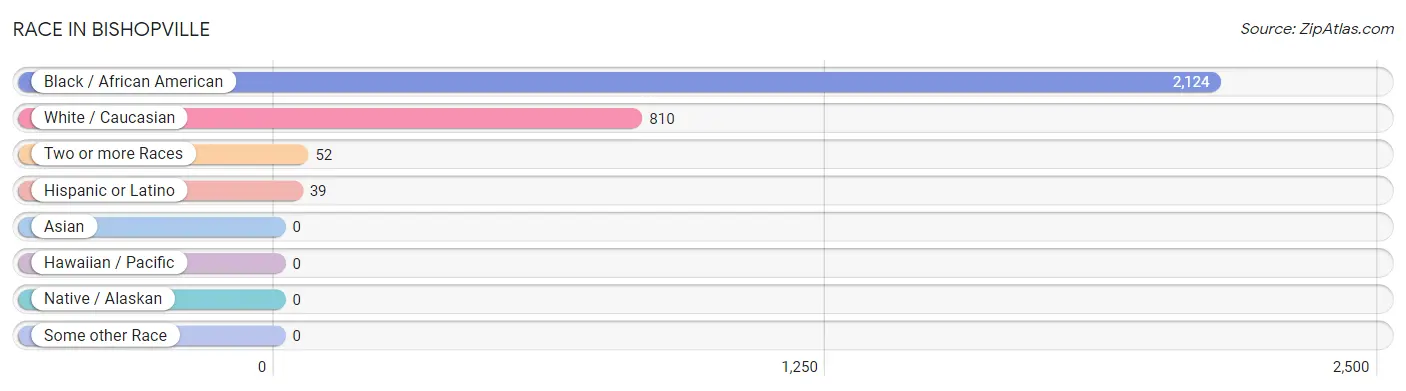
| Race | # Population | % Population |
| Asian | 0 | 0.0% |
| Black / African American | 2,124 | 71.1% |
| Hawaiian / Pacific | 0 | 0.0% |
| Hispanic or Latino | 39 | 1.3% |
| Native / Alaskan | 0 | 0.0% |
| White / Caucasian | 810 | 27.1% |
| Two or more Races | 52 | 1.7% |
| Some other Race | 0 | 0.0% |
| Total | 2,986 | 100.0% |
Ancestry in Bishopville
The most populous ancestries reported in Bishopville are Jamaican (232 | 7.8%), American (147 | 4.9%), English (76 | 2.5%), German (71 | 2.4%), and Scotch-Irish (63 | 2.1%), together accounting for 19.7% of all Bishopville residents.
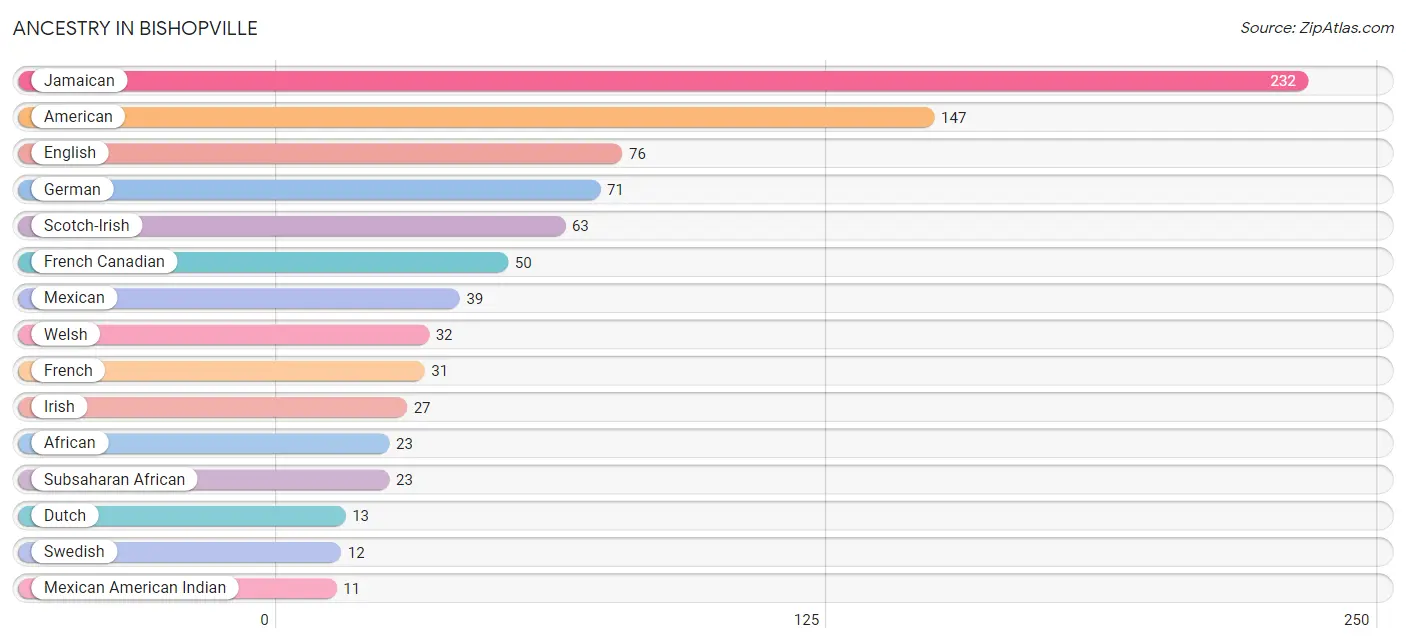
| Ancestry | # Population | % Population |
| African | 23 | 0.8% |
| American | 147 | 4.9% |
| Cherokee | 4 | 0.1% |
| Dutch | 13 | 0.4% |
| Eastern European | 5 | 0.2% |
| English | 76 | 2.5% |
| French | 31 | 1.0% |
| French Canadian | 50 | 1.7% |
| German | 71 | 2.4% |
| Irish | 27 | 0.9% |
| Jamaican | 232 | 7.8% |
| Mexican | 39 | 1.3% |
| Mexican American Indian | 11 | 0.4% |
| Scotch-Irish | 63 | 2.1% |
| Scottish | 11 | 0.4% |
| Subsaharan African | 23 | 0.8% |
| Swedish | 12 | 0.4% |
| Turkish | 5 | 0.2% |
| Welsh | 32 | 1.1% | View All 19 Rows |
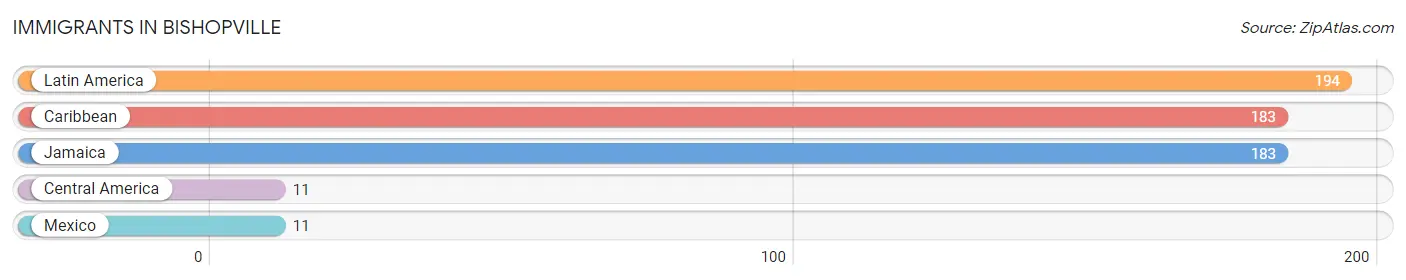
Immigrants in Bishopville
The most numerous immigrant groups reported in Bishopville came from Latin America (194 | 6.5%), Caribbean (183 | 6.1%), Jamaica (183 | 6.1%), Central America (11 | 0.4%), and Mexico (11 | 0.4%), together accounting for 19.5% of all Bishopville residents.
| Immigration Origin | # Population | % Population |
| Caribbean | 183 | 6.1% |
| Central America | 11 | 0.4% |
| Jamaica | 183 | 6.1% |
| Latin America | 194 | 6.5% |
| Mexico | 11 | 0.4% | View All 5 Rows |
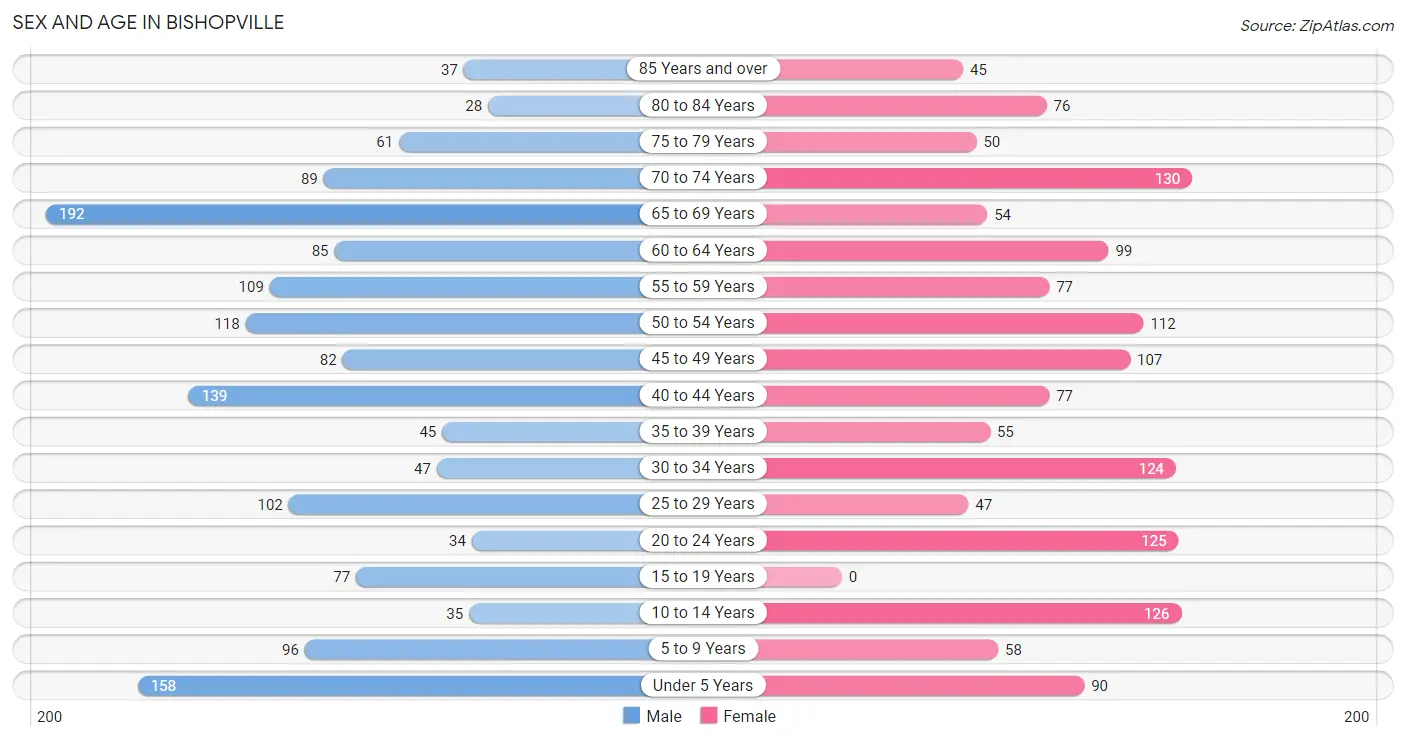
Sex and Age in Bishopville
Sex and Age in Bishopville
The most populous age groups in Bishopville are 65 to 69 Years (192 | 12.5%) for men and 70 to 74 Years (130 | 8.9%) for women.
| Age Bracket | Male | Female |
| Under 5 Years | 158 (10.3%) | 90 (6.2%) |
| 5 to 9 Years | 96 (6.3%) | 58 (4.0%) |
| 10 to 14 Years | 35 (2.3%) | 126 (8.7%) |
| 15 to 19 Years | 77 (5.0%) | 0 (0.0%) |
| 20 to 24 Years | 34 (2.2%) | 125 (8.6%) |
| 25 to 29 Years | 102 (6.7%) | 47 (3.2%) |
| 30 to 34 Years | 47 (3.1%) | 124 (8.5%) |
| 35 to 39 Years | 45 (2.9%) | 55 (3.8%) |
| 40 to 44 Years | 139 (9.1%) | 77 (5.3%) |
| 45 to 49 Years | 82 (5.3%) | 107 (7.4%) |
| 50 to 54 Years | 118 (7.7%) | 112 (7.7%) |
| 55 to 59 Years | 109 (7.1%) | 77 (5.3%) |
| 60 to 64 Years | 85 (5.5%) | 99 (6.8%) |
| 65 to 69 Years | 192 (12.5%) | 54 (3.7%) |
| 70 to 74 Years | 89 (5.8%) | 130 (8.9%) |
| 75 to 79 Years | 61 (4.0%) | 50 (3.4%) |
| 80 to 84 Years | 28 (1.8%) | 76 (5.2%) |
| 85 Years and over | 37 (2.4%) | 45 (3.1%) |
| Total | 1,534 (100.0%) | 1,452 (100.0%) |
Families and Households in Bishopville
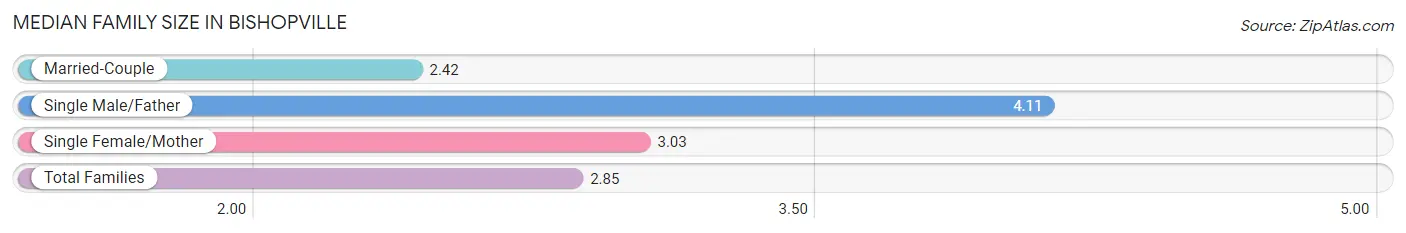
Median Family Size in Bishopville
The median family size in Bishopville is 2.85 persons per family, with single male/father families (70 | 9.8%) accounting for the largest median family size of 4.11 persons per family. On the other hand, married-couple families (336 | 46.9%) represent the smallest median family size with 2.42 persons per family.
| Family Type | # Families | Family Size |
| Married-Couple | 336 (46.9%) | 2.42 |
| Single Male/Father | 70 (9.8%) | 4.11 |
| Single Female/Mother | 311 (43.4%) | 3.03 |
| Total Families | 717 (100.0%) | 2.85 |
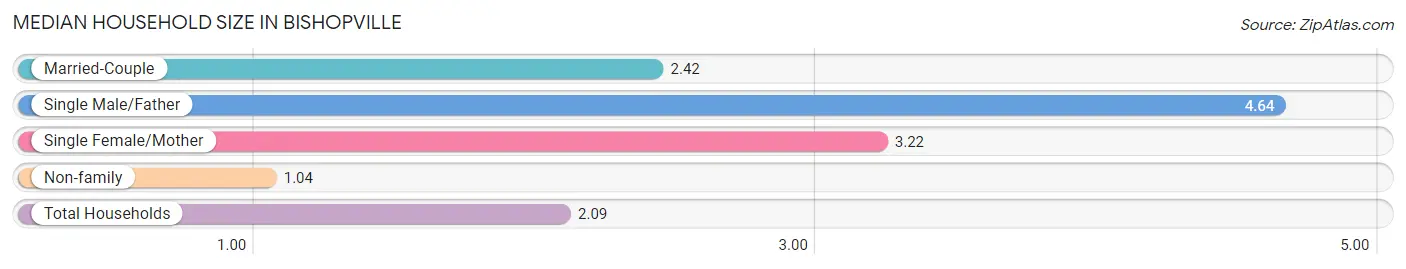
Median Household Size in Bishopville
The median household size in Bishopville is 2.09 persons per household, with single male/father households (70 | 5.3%) accounting for the largest median household size of 4.64 persons per household. non-family households (615 | 46.2%) represent the smallest median household size with 1.04 persons per household.
| Household Type | # Households | Household Size |
| Married-Couple | 336 (25.2%) | 2.42 |
| Single Male/Father | 70 (5.3%) | 4.64 |
| Single Female/Mother | 311 (23.4%) | 3.22 |
| Non-family | 615 (46.2%) | 1.04 |
| Total Households | 1,332 (100.0%) | 2.09 |
Household Size by Marriage Status in Bishopville
Out of a total of 1,332 households in Bishopville, 717 (53.8%) are family households, while 615 (46.2%) are nonfamily households. The most numerous type of family households are 2-person households, comprising 403, and the most common type of nonfamily households are 1-person households, comprising 606.
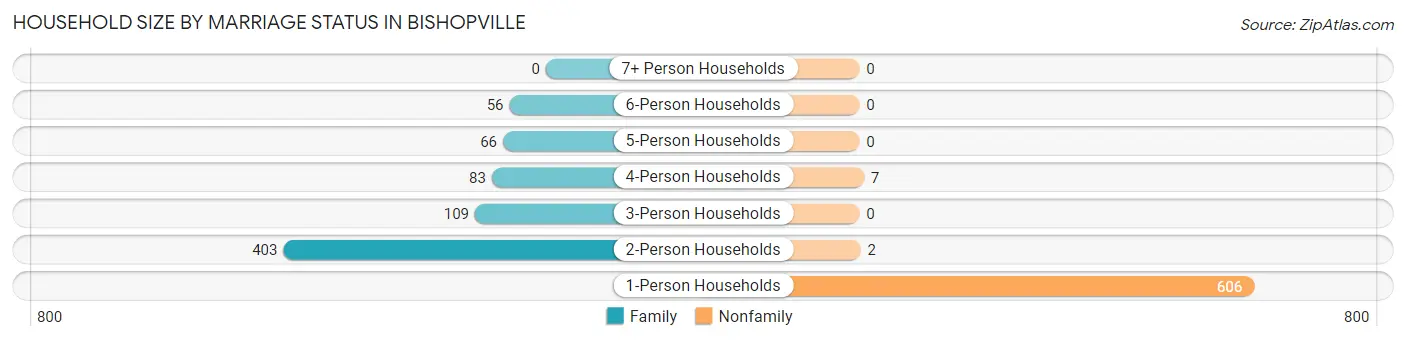
| Household Size | Family Households | Nonfamily Households |
| 1-Person Households | - | 606 (45.5%) |
| 2-Person Households | 403 (30.3%) | 2 (0.2%) |
| 3-Person Households | 109 (8.2%) | 0 (0.0%) |
| 4-Person Households | 83 (6.2%) | 7 (0.5%) |
| 5-Person Households | 66 (5.0%) | 0 (0.0%) |
| 6-Person Households | 56 (4.2%) | 0 (0.0%) |
| 7+ Person Households | 0 (0.0%) | 0 (0.0%) |
| Total | 717 (53.8%) | 615 (46.2%) |
Female Fertility in Bishopville
Fertility by Age in Bishopville
Average fertility rate in Bishopville is 208.0 births per 1,000 women. Women in the age bracket of 20 to 34 years have the highest fertility rate with 311.0 births per 1,000 women. Women in the age bracket of 20 to 34 years acount for 79.3% of all women with births.
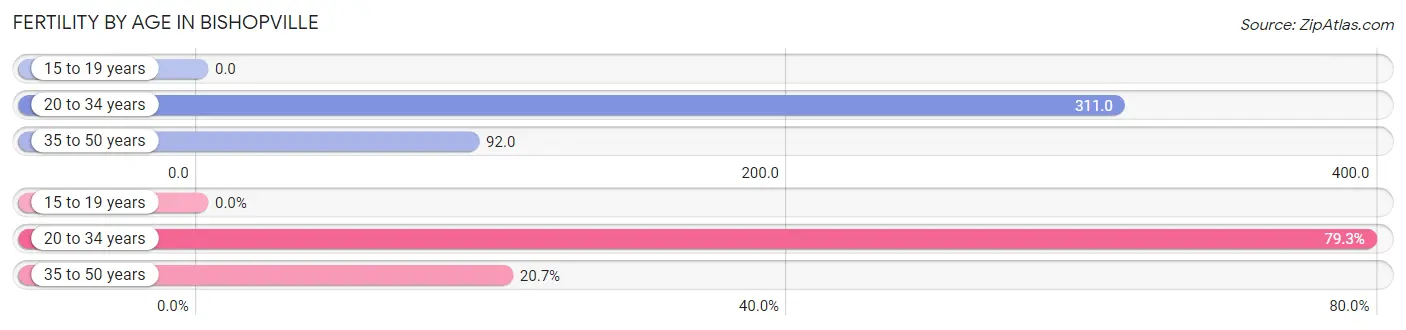
| Age Bracket | Women with Births | Births / 1,000 Women |
| 15 to 19 years | 0 (0.0%) | 0.0 |
| 20 to 34 years | 92 (79.3%) | 311.0 |
| 35 to 50 years | 24 (20.7%) | 92.0 |
| Total | 116 (100.0%) | 208.0 |
Fertility by Age by Marriage Status in Bishopville
19.8% of women with births (116) in Bishopville are married. The highest percentage of unmarried women with births falls into 35 to 50 years age bracket with 100.0% of them unmarried at the time of birth, while the lowest percentage of unmarried women with births belong to 20 to 34 years age bracket with 75.0% of them unmarried.
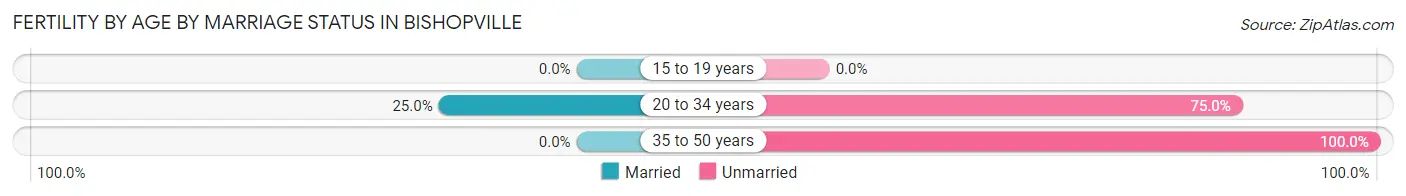
| Age Bracket | Married | Unmarried |
| 15 to 19 years | 0 (0.0%) | 0 (0.0%) |
| 20 to 34 years | 23 (25.0%) | 69 (75.0%) |
| 35 to 50 years | 0 (0.0%) | 24 (100.0%) |
| Total | 23 (19.8%) | 93 (80.2%) |
Fertility by Education in Bishopville
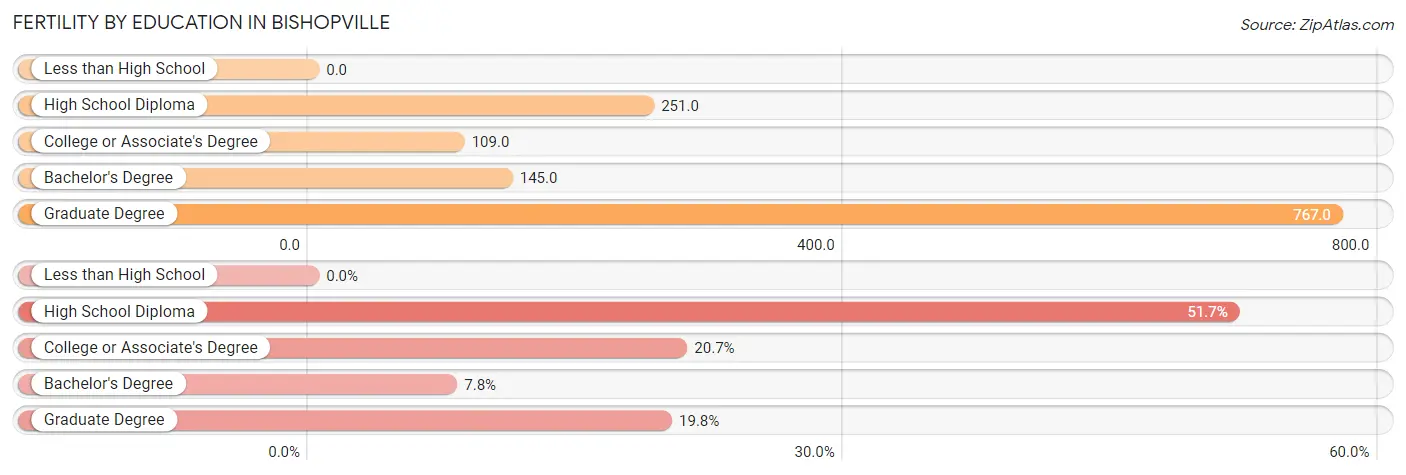
| Educational Attainment | Women with Births | Births / 1,000 Women |
| Less than High School | 0 (0.0%) | 0.0 |
| High School Diploma | 60 (51.7%) | 251.0 |
| College or Associate's Degree | 24 (20.7%) | 109.0 |
| Bachelor's Degree | 9 (7.8%) | 145.0 |
| Graduate Degree | 23 (19.8%) | 767.0 |
| Total | 116 (100.0%) | 208.0 |
Fertility by Education by Marriage Status in Bishopville
80.2% of women with births in Bishopville are unmarried. Women with the educational attainment of graduate degree are most likely to be married with 100.0% of them married at childbirth, while women with the educational attainment of high school diploma are least likely to be married with 100.0% of them unmarried at childbirth.
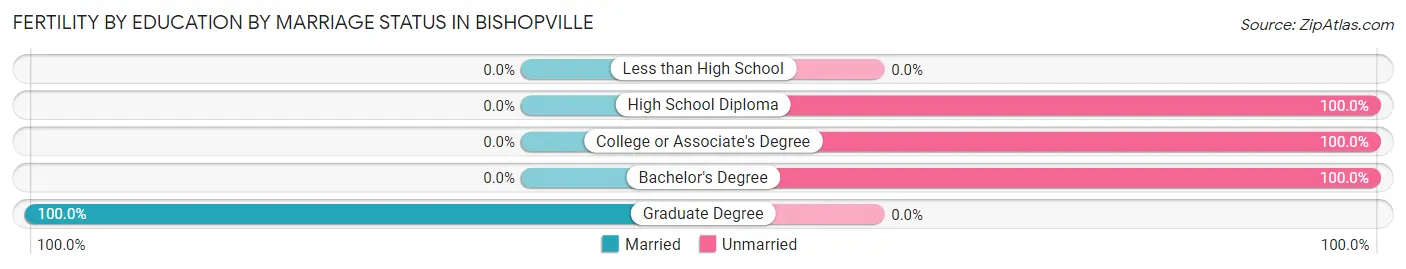
| Educational Attainment | Married | Unmarried |
| Less than High School | 0 (0.0%) | 0 (0.0%) |
| High School Diploma | 0 (0.0%) | 60 (100.0%) |
| College or Associate's Degree | 0 (0.0%) | 24 (100.0%) |
| Bachelor's Degree | 0 (0.0%) | 9 (100.0%) |
| Graduate Degree | 23 (100.0%) | 0 (0.0%) |
| Total | 23 (19.8%) | 93 (80.2%) |
Employment Characteristics in Bishopville
Employment by Class of Employer in Bishopville
Among the 1,065 employed individuals in Bishopville, private company employees (703 | 66.0%), state government employees (131 | 12.3%), and not-for-profit organizations (87 | 8.2%) make up the most common classes of employment.
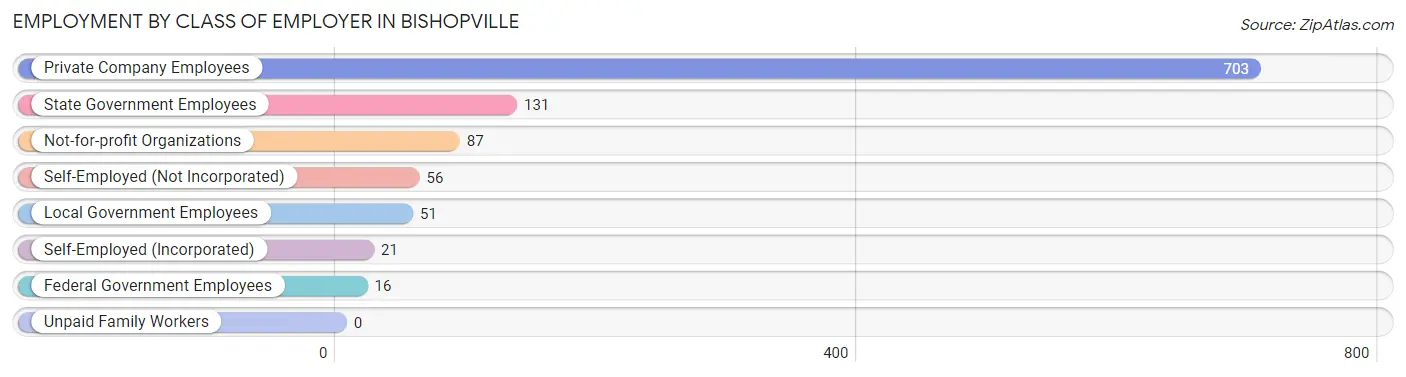
| Employer Class | # Employees | % Employees |
| Private Company Employees | 703 | 66.0% |
| Self-Employed (Incorporated) | 21 | 2.0% |
| Self-Employed (Not Incorporated) | 56 | 5.3% |
| Not-for-profit Organizations | 87 | 8.2% |
| Local Government Employees | 51 | 4.8% |
| State Government Employees | 131 | 12.3% |
| Federal Government Employees | 16 | 1.5% |
| Unpaid Family Workers | 0 | 0.0% |
| Total | 1,065 | 100.0% |
Employment Status by Age in Bishopville
According to the labor force statistics for Bishopville, out of the total population over 16 years of age (2,356), 49.6% or 1,169 individuals are in the labor force, with 4.0% or 47 of them unemployed. The age group with the highest labor force participation rate is 16 to 19 years, with 100.0% or 10 individuals in the labor force. Within the labor force, the 60 to 64 years age range has the highest percentage of unemployed individuals, with 20.7% or 17 of them being unemployed.
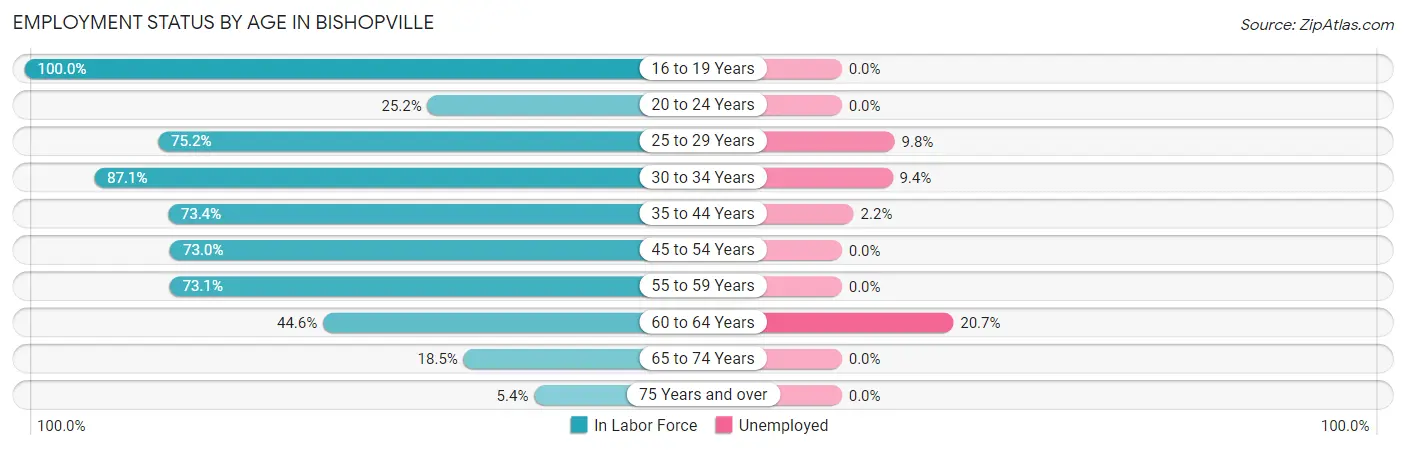
| Age Bracket | In Labor Force | Unemployed |
| 16 to 19 Years | 10 (100.0%) | 0 (0.0%) |
| 20 to 24 Years | 40 (25.2%) | 0 (0.0%) |
| 25 to 29 Years | 112 (75.2%) | 11 (9.8%) |
| 30 to 34 Years | 149 (87.1%) | 14 (9.4%) |
| 35 to 44 Years | 232 (73.4%) | 5 (2.2%) |
| 45 to 54 Years | 306 (73.0%) | 0 (0.0%) |
| 55 to 59 Years | 136 (73.1%) | 0 (0.0%) |
| 60 to 64 Years | 82 (44.6%) | 17 (20.7%) |
| 65 to 74 Years | 86 (18.5%) | 0 (0.0%) |
| 75 Years and over | 16 (5.4%) | 0 (0.0%) |
| Total | 1,169 (49.6%) | 47 (4.0%) |
Employment Status by Educational Attainment in Bishopville
According to labor force statistics for Bishopville, 71.4% of individuals (1,017) out of the total population between 25 and 64 years of age (1,425) are in the labor force, with 4.6% or 47 of them being unemployed. The group with the highest labor force participation rate are those with the educational attainment of college / associate degree, with 87.8% or 381 individuals in the labor force. Within the labor force, individuals with bachelor's degree or higher education have the highest percentage of unemployment, with 5.9% or 11 of them being unemployed.
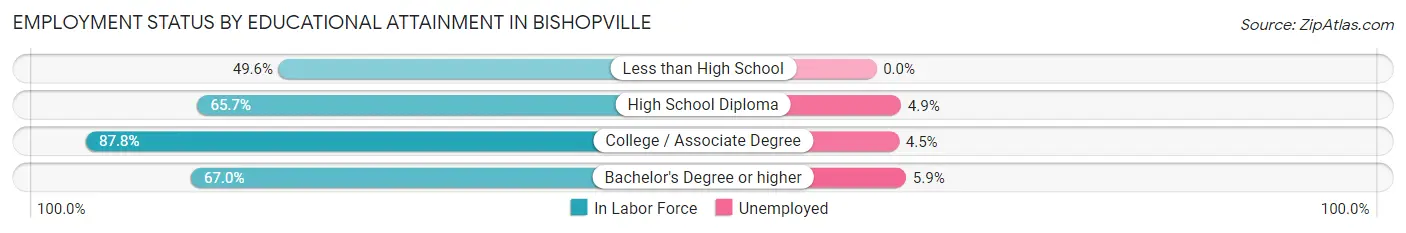
| Educational Attainment | In Labor Force | Unemployed |
| Less than High School | 58 (49.6%) | 0 (0.0%) |
| High School Diploma | 391 (65.7%) | 29 (4.9%) |
| College / Associate Degree | 381 (87.8%) | 20 (4.5%) |
| Bachelor's Degree or higher | 187 (67.0%) | 16 (5.9%) |
| Total | 1,017 (71.4%) | 66 (4.6%) |
Employment Occupations by Sex in Bishopville
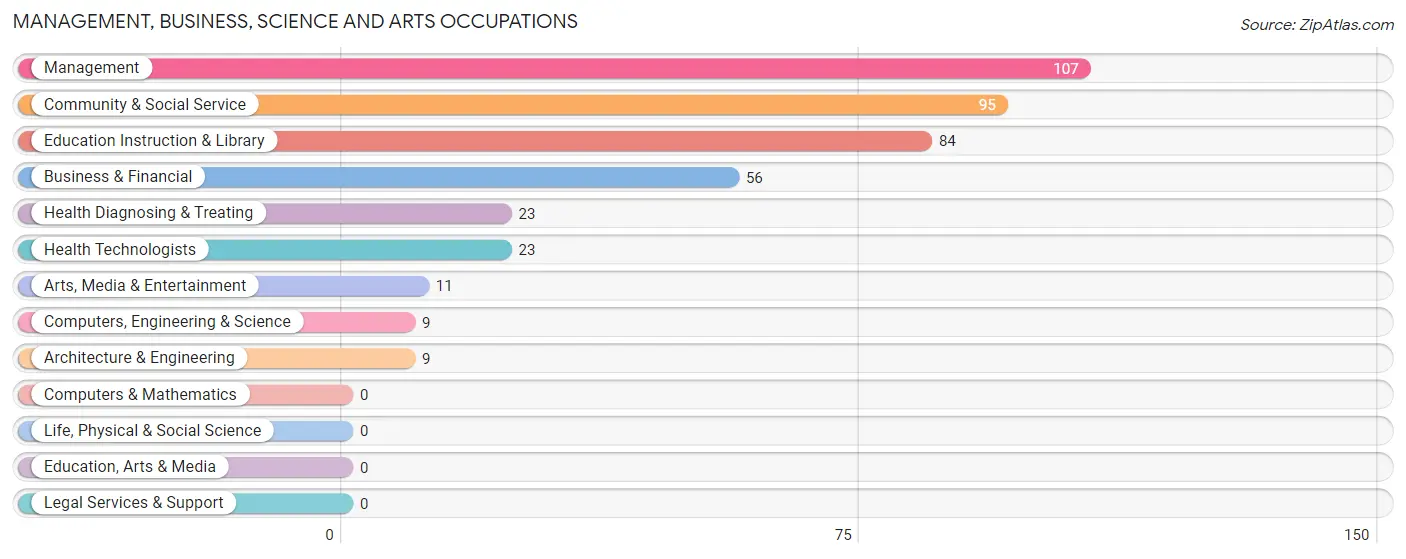
Management, Business, Science and Arts Occupations
The most common Management, Business, Science and Arts occupations in Bishopville are Management (107 | 9.5%), Community & Social Service (95 | 8.5%), Education Instruction & Library (84 | 7.5%), Business & Financial (56 | 5.0%), and Health Diagnosing & Treating (23 | 2.1%).
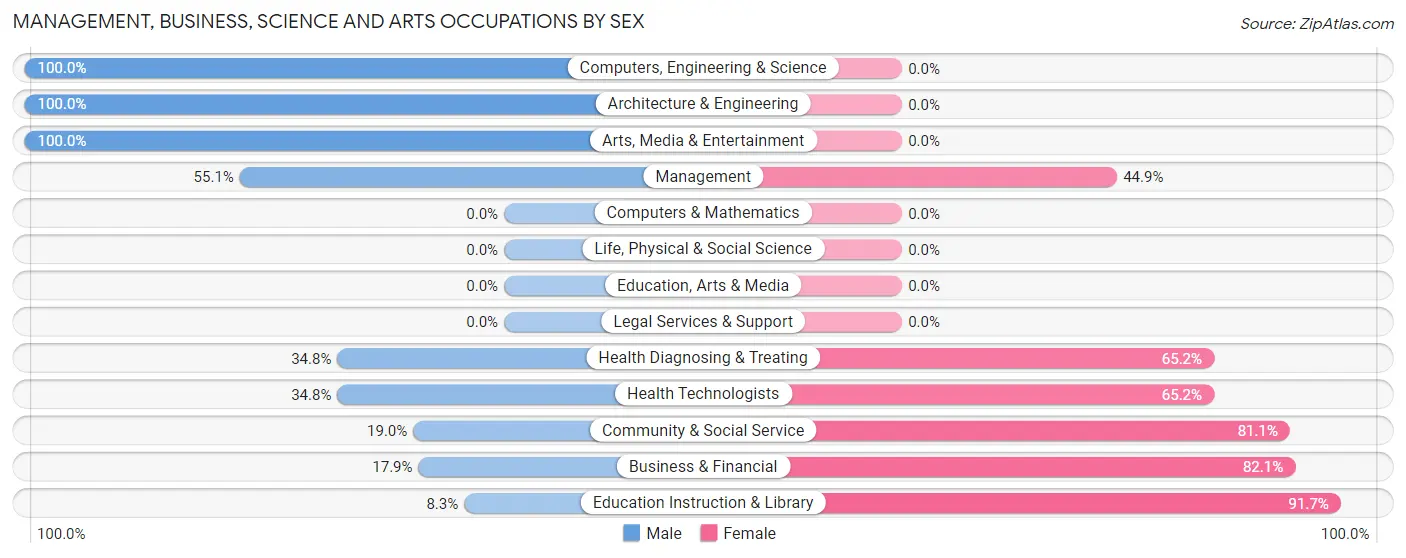
Management, Business, Science and Arts Occupations by Sex
Within the Management, Business, Science and Arts occupations in Bishopville, the most male-oriented occupations are Computers, Engineering & Science (100.0%), Architecture & Engineering (100.0%), and Arts, Media & Entertainment (100.0%), while the most female-oriented occupations are Education Instruction & Library (91.7%), Business & Financial (82.1%), and Community & Social Service (81.0%).
| Occupation | Male | Female |
| Management | 59 (55.1%) | 48 (44.9%) |
| Business & Financial | 10 (17.9%) | 46 (82.1%) |
| Computers, Engineering & Science | 9 (100.0%) | 0 (0.0%) |
| Computers & Mathematics | 0 (0.0%) | 0 (0.0%) |
| Architecture & Engineering | 9 (100.0%) | 0 (0.0%) |
| Life, Physical & Social Science | 0 (0.0%) | 0 (0.0%) |
| Community & Social Service | 18 (19.0%) | 77 (81.0%) |
| Education, Arts & Media | 0 (0.0%) | 0 (0.0%) |
| Legal Services & Support | 0 (0.0%) | 0 (0.0%) |
| Education Instruction & Library | 7 (8.3%) | 77 (91.7%) |
| Arts, Media & Entertainment | 11 (100.0%) | 0 (0.0%) |
| Health Diagnosing & Treating | 8 (34.8%) | 15 (65.2%) |
| Health Technologists | 8 (34.8%) | 15 (65.2%) |
| Total (Category) | 104 (35.9%) | 186 (64.1%) |
| Total (Overall) | 589 (52.5%) | 533 (47.5%) |
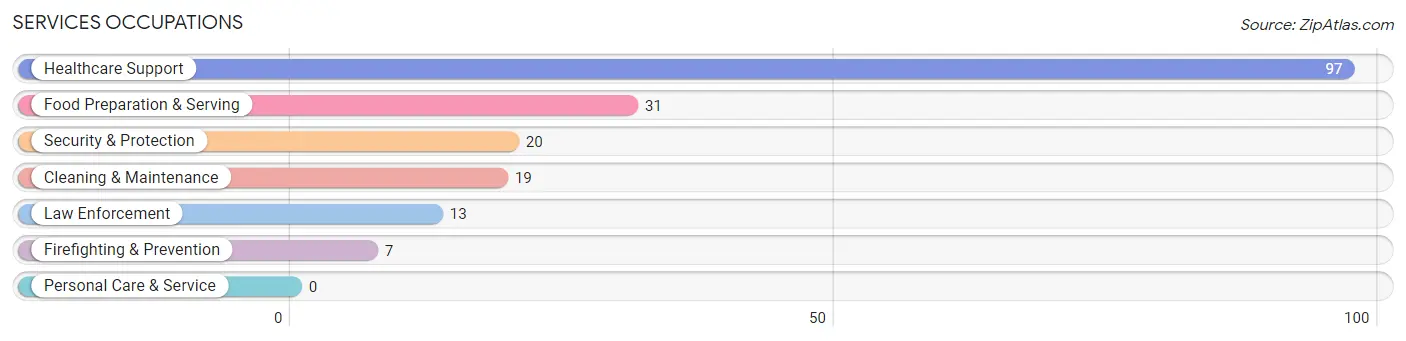
Services Occupations
The most common Services occupations in Bishopville are Healthcare Support (97 | 8.6%), Food Preparation & Serving (31 | 2.8%), Security & Protection (20 | 1.8%), Cleaning & Maintenance (19 | 1.7%), and Law Enforcement (13 | 1.2%).
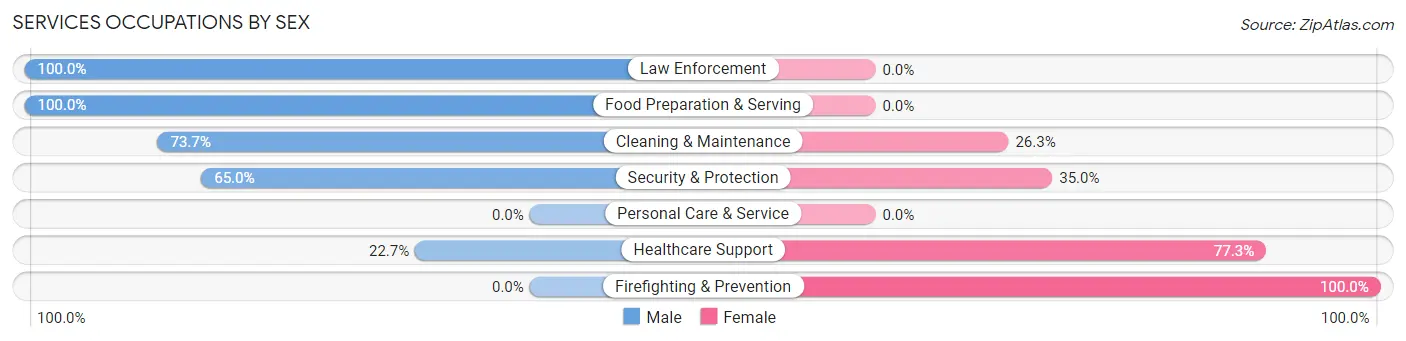
Services Occupations by Sex
Within the Services occupations in Bishopville, the most male-oriented occupations are Law Enforcement (100.0%), Food Preparation & Serving (100.0%), and Cleaning & Maintenance (73.7%), while the most female-oriented occupations are Firefighting & Prevention (100.0%), Healthcare Support (77.3%), and Security & Protection (35.0%).
| Occupation | Male | Female |
| Healthcare Support | 22 (22.7%) | 75 (77.3%) |
| Security & Protection | 13 (65.0%) | 7 (35.0%) |
| Firefighting & Prevention | 0 (0.0%) | 7 (100.0%) |
| Law Enforcement | 13 (100.0%) | 0 (0.0%) |
| Food Preparation & Serving | 31 (100.0%) | 0 (0.0%) |
| Cleaning & Maintenance | 14 (73.7%) | 5 (26.3%) |
| Personal Care & Service | 0 (0.0%) | 0 (0.0%) |
| Total (Category) | 80 (47.9%) | 87 (52.1%) |
| Total (Overall) | 589 (52.5%) | 533 (47.5%) |
Sales and Office Occupations
The most common Sales and Office occupations in Bishopville are Sales & Related (171 | 15.2%), and Office & Administration (85 | 7.6%).
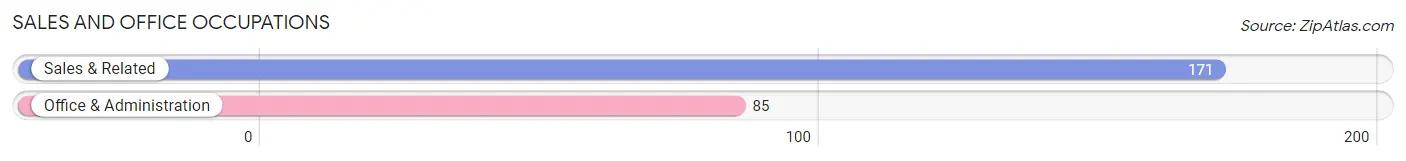
Sales and Office Occupations by Sex

| Occupation | Male | Female |
| Sales & Related | 111 (64.9%) | 60 (35.1%) |
| Office & Administration | 0 (0.0%) | 85 (100.0%) |
| Total (Category) | 111 (43.4%) | 145 (56.6%) |
| Total (Overall) | 589 (52.5%) | 533 (47.5%) |
Natural Resources, Construction and Maintenance Occupations
The most common Natural Resources, Construction and Maintenance occupations in Bishopville are Installation, Maintenance & Repair (48 | 4.3%), and Construction & Extraction (31 | 2.8%).
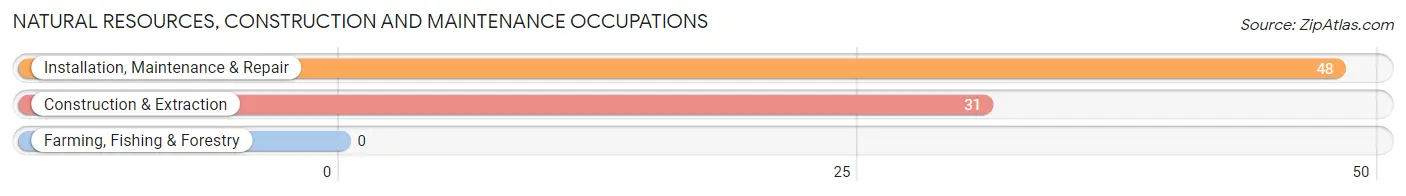
Natural Resources, Construction and Maintenance Occupations by Sex

| Occupation | Male | Female |
| Farming, Fishing & Forestry | 0 (0.0%) | 0 (0.0%) |
| Construction & Extraction | 31 (100.0%) | 0 (0.0%) |
| Installation, Maintenance & Repair | 48 (100.0%) | 0 (0.0%) |
| Total (Category) | 79 (100.0%) | 0 (0.0%) |
| Total (Overall) | 589 (52.5%) | 533 (47.5%) |
Production, Transportation and Moving Occupations
The most common Production, Transportation and Moving occupations in Bishopville are Production (202 | 18.0%), Material Moving (120 | 10.7%), and Transportation (8 | 0.7%).
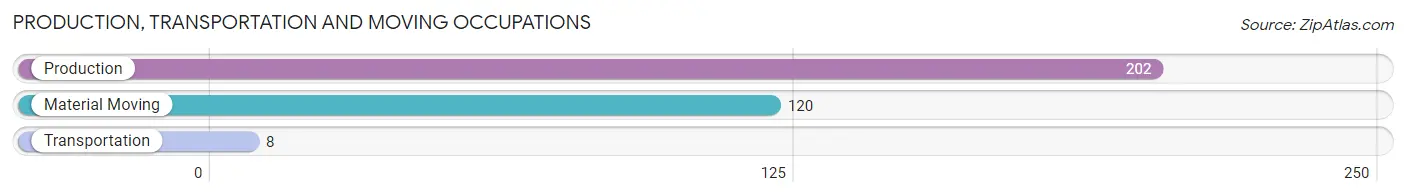
Production, Transportation and Moving Occupations by Sex
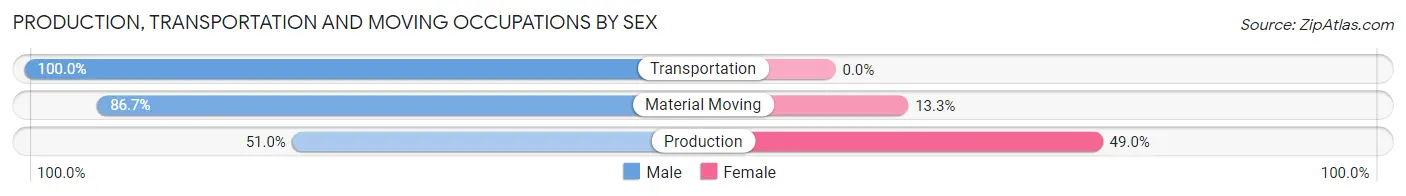
| Occupation | Male | Female |
| Production | 103 (51.0%) | 99 (49.0%) |
| Transportation | 8 (100.0%) | 0 (0.0%) |
| Material Moving | 104 (86.7%) | 16 (13.3%) |
| Total (Category) | 215 (65.1%) | 115 (34.8%) |
| Total (Overall) | 589 (52.5%) | 533 (47.5%) |
Employment Industries by Sex in Bishopville
Employment Industries in Bishopville
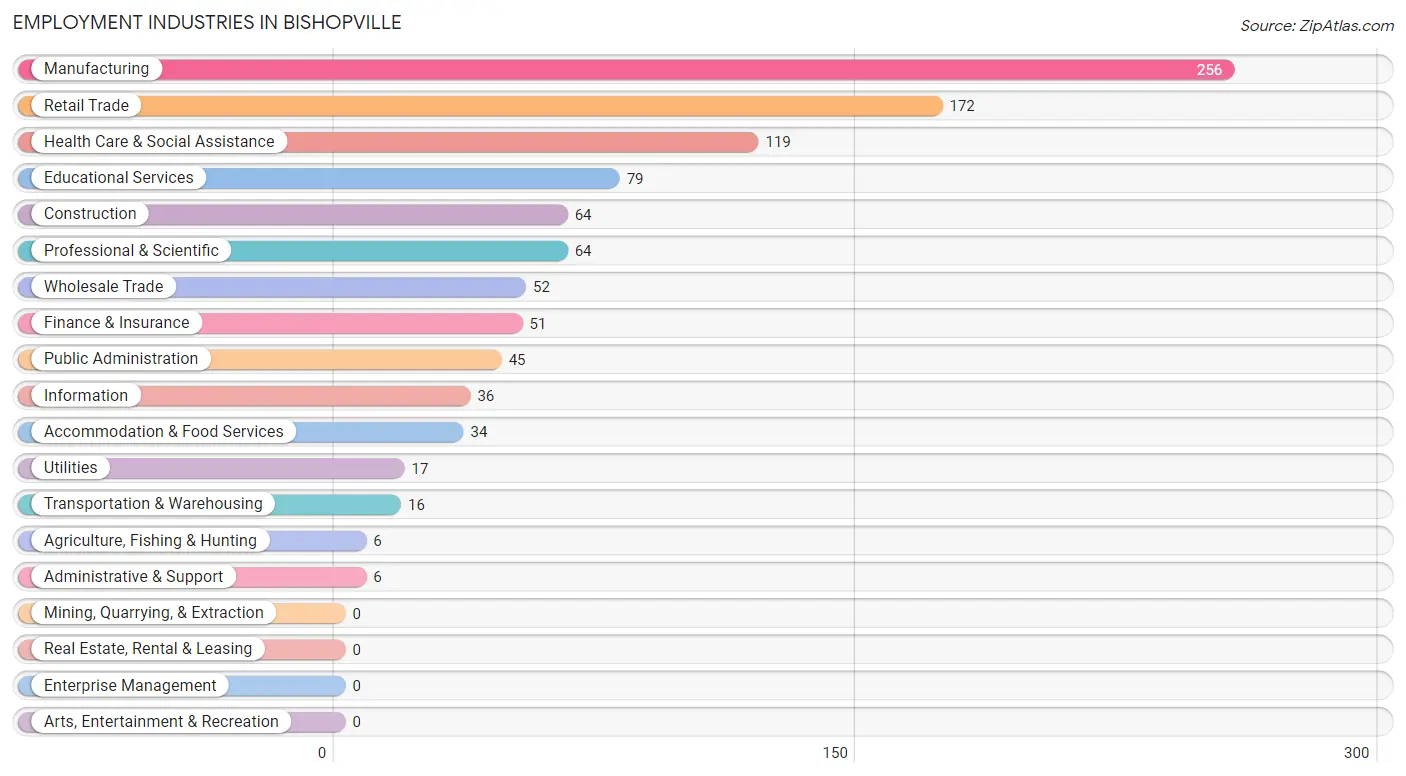
The major employment industries in Bishopville include Manufacturing (256 | 22.8%), Retail Trade (172 | 15.3%), Health Care & Social Assistance (119 | 10.6%), Educational Services (79 | 7.0%), and Construction (64 | 5.7%).
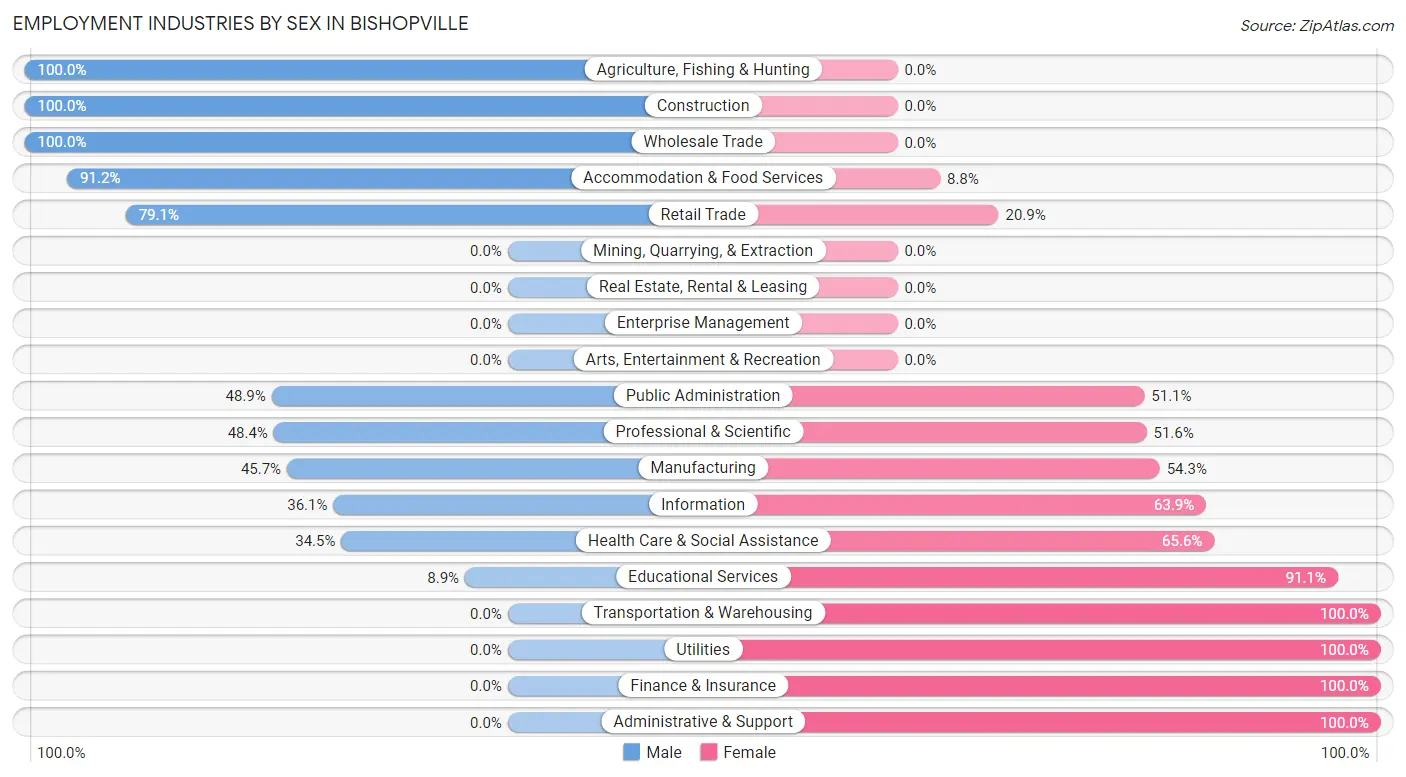
Employment Industries by Sex in Bishopville
The Bishopville industries that see more men than women are Agriculture, Fishing & Hunting (100.0%), Construction (100.0%), and Wholesale Trade (100.0%), whereas the industries that tend to have a higher number of women are Transportation & Warehousing (100.0%), Utilities (100.0%), and Finance & Insurance (100.0%).
| Industry | Male | Female |
| Agriculture, Fishing & Hunting | 6 (100.0%) | 0 (0.0%) |
| Mining, Quarrying, & Extraction | 0 (0.0%) | 0 (0.0%) |
| Construction | 64 (100.0%) | 0 (0.0%) |
| Manufacturing | 117 (45.7%) | 139 (54.3%) |
| Wholesale Trade | 52 (100.0%) | 0 (0.0%) |
| Retail Trade | 136 (79.1%) | 36 (20.9%) |
| Transportation & Warehousing | 0 (0.0%) | 16 (100.0%) |
| Utilities | 0 (0.0%) | 17 (100.0%) |
| Information | 13 (36.1%) | 23 (63.9%) |
| Finance & Insurance | 0 (0.0%) | 51 (100.0%) |
| Real Estate, Rental & Leasing | 0 (0.0%) | 0 (0.0%) |
| Professional & Scientific | 31 (48.4%) | 33 (51.6%) |
| Enterprise Management | 0 (0.0%) | 0 (0.0%) |
| Administrative & Support | 0 (0.0%) | 6 (100.0%) |
| Educational Services | 7 (8.9%) | 72 (91.1%) |
| Health Care & Social Assistance | 41 (34.4%) | 78 (65.5%) |
| Arts, Entertainment & Recreation | 0 (0.0%) | 0 (0.0%) |
| Accommodation & Food Services | 31 (91.2%) | 3 (8.8%) |
| Public Administration | 22 (48.9%) | 23 (51.1%) |
| Total | 589 (52.5%) | 533 (47.5%) |
Education in Bishopville
School Enrollment in Bishopville
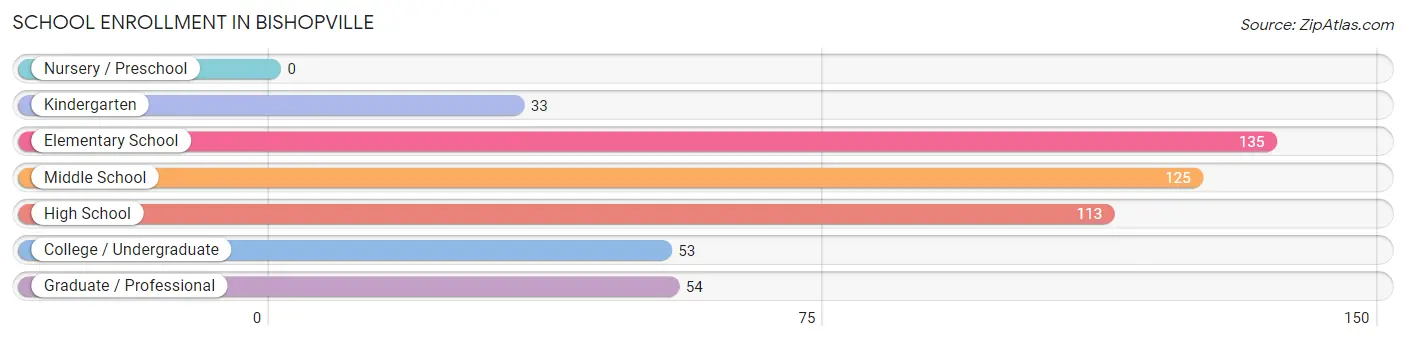
The most common levels of schooling among the 513 students in Bishopville are elementary school (135 | 26.3%), middle school (125 | 24.4%), and high school (113 | 22.0%).
| School Level | # Students | % Students |
| Nursery / Preschool | 0 | 0.0% |
| Kindergarten | 33 | 6.4% |
| Elementary School | 135 | 26.3% |
| Middle School | 125 | 24.4% |
| High School | 113 | 22.0% |
| College / Undergraduate | 53 | 10.3% |
| Graduate / Professional | 54 | 10.5% |
| Total | 513 | 100.0% |
School Enrollment by Age by Funding Source in Bishopville
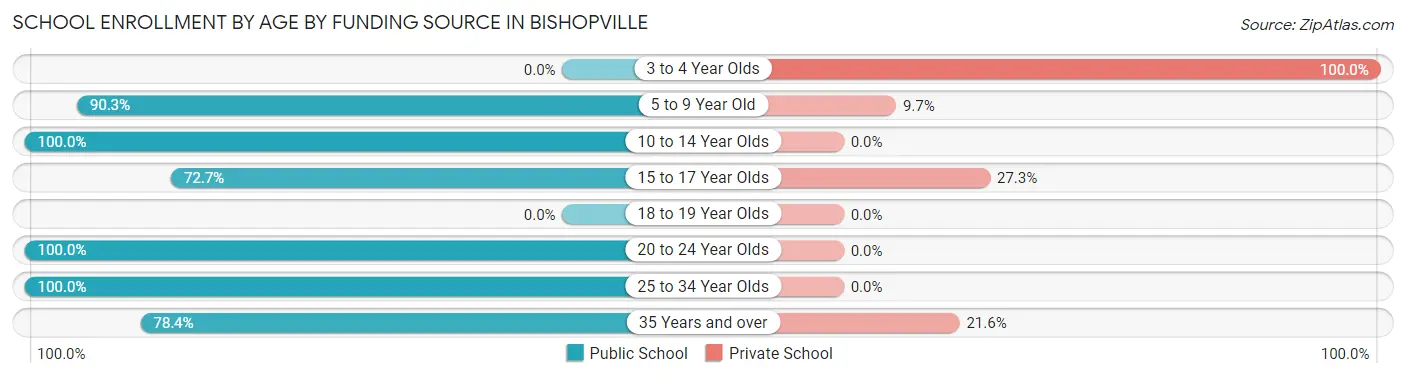
Out of a total of 513 students who are enrolled in schools in Bishopville, 61 (11.9%) attend a private institution, while the remaining 452 (88.1%) are enrolled in public schools. The age group of 3 to 4 year olds has the highest likelihood of being enrolled in private schools, with 14 (100.0% in the age bracket) enrolled. Conversely, the age group of 10 to 14 year olds has the lowest likelihood of being enrolled in a private school, with 161 (100.0% in the age bracket) attending a public institution.
| Age Bracket | Public School | Private School |
| 3 to 4 Year Olds | 0 (0.0%) | 14 (100.0%) |
| 5 to 9 Year Old | 139 (90.3%) | 15 (9.7%) |
| 10 to 14 Year Olds | 161 (100.0%) | 0 (0.0%) |
| 15 to 17 Year Olds | 56 (72.7%) | 21 (27.3%) |
| 18 to 19 Year Olds | 0 (0.0%) | 0 (0.0%) |
| 20 to 24 Year Olds | 8 (100.0%) | 0 (0.0%) |
| 25 to 34 Year Olds | 48 (100.0%) | 0 (0.0%) |
| 35 Years and over | 40 (78.4%) | 11 (21.6%) |
| Total | 452 (88.1%) | 61 (11.9%) |
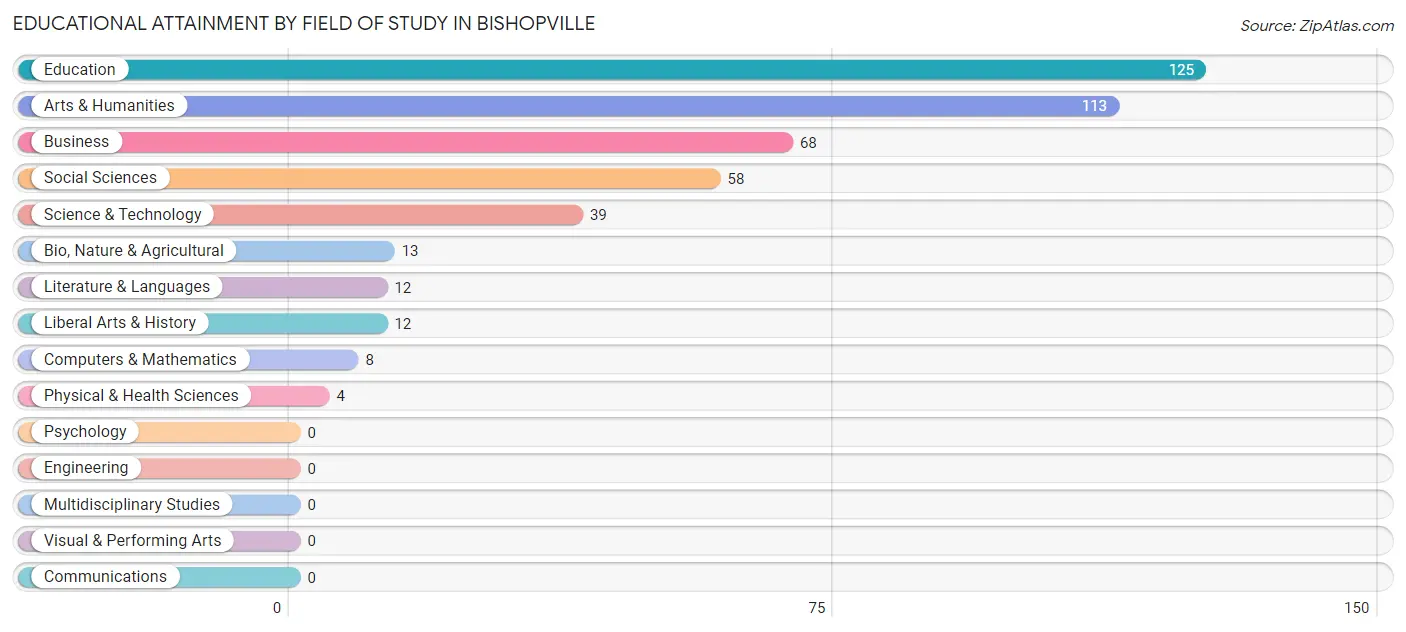
Educational Attainment by Field of Study in Bishopville
Education (125 | 27.7%), arts & humanities (113 | 25.0%), business (68 | 15.0%), social sciences (58 | 12.8%), and science & technology (39 | 8.6%) are the most common fields of study among 452 individuals in Bishopville who have obtained a bachelor's degree or higher.
| Field of Study | # Graduates | % Graduates |
| Computers & Mathematics | 8 | 1.8% |
| Bio, Nature & Agricultural | 13 | 2.9% |
| Physical & Health Sciences | 4 | 0.9% |
| Psychology | 0 | 0.0% |
| Social Sciences | 58 | 12.8% |
| Engineering | 0 | 0.0% |
| Multidisciplinary Studies | 0 | 0.0% |
| Science & Technology | 39 | 8.6% |
| Business | 68 | 15.0% |
| Education | 125 | 27.7% |
| Literature & Languages | 12 | 2.6% |
| Liberal Arts & History | 12 | 2.6% |
| Visual & Performing Arts | 0 | 0.0% |
| Communications | 0 | 0.0% |
| Arts & Humanities | 113 | 25.0% |
| Total | 452 | 100.0% |
Transportation & Commute in Bishopville
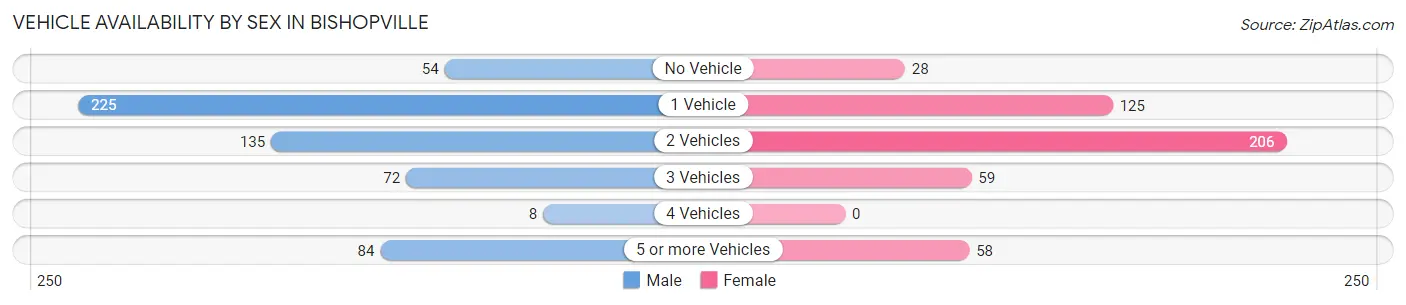
Vehicle Availability by Sex in Bishopville
The most prevalent vehicle ownership categories in Bishopville are males with 1 vehicle (225, accounting for 38.9%) and females with 1 vehicle (125, making up 47.3%).
| Vehicles Available | Male | Female |
| No Vehicle | 54 (9.3%) | 28 (5.9%) |
| 1 Vehicle | 225 (38.9%) | 125 (26.3%) |
| 2 Vehicles | 135 (23.4%) | 206 (43.3%) |
| 3 Vehicles | 72 (12.5%) | 59 (12.4%) |
| 4 Vehicles | 8 (1.4%) | 0 (0.0%) |
| 5 or more Vehicles | 84 (14.5%) | 58 (12.2%) |
| Total | 578 (100.0%) | 476 (100.0%) |
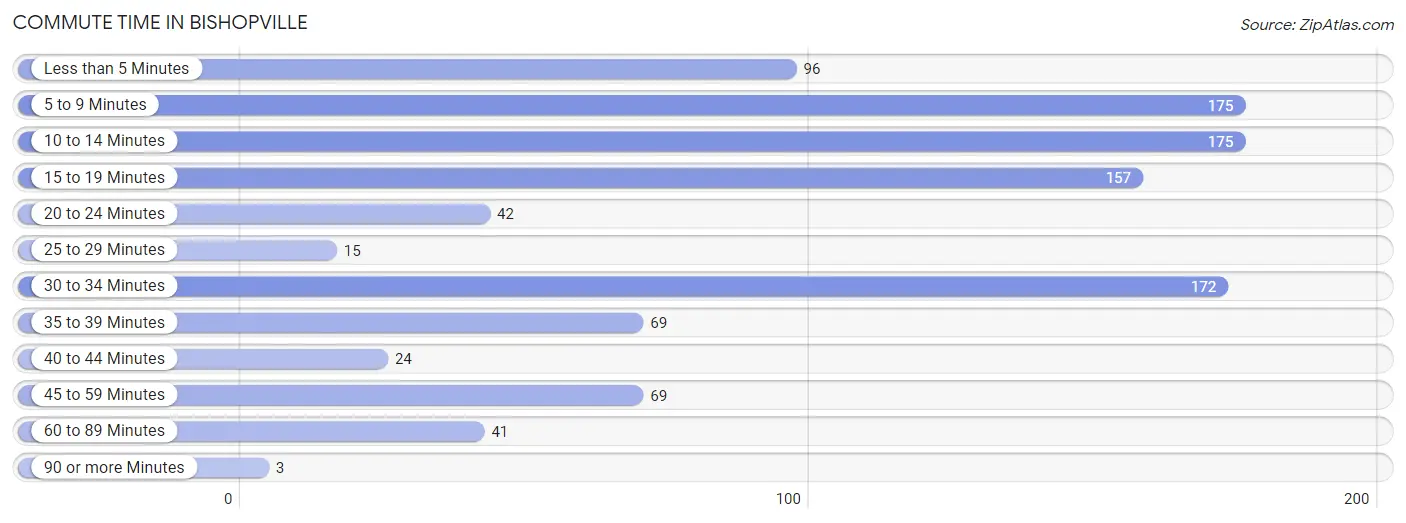
Commute Time in Bishopville
The most frequently occuring commute durations in Bishopville are 5 to 9 minutes (175 commuters, 16.9%), 10 to 14 minutes (175 commuters, 16.9%), and 30 to 34 minutes (172 commuters, 16.6%).
| Commute Time | # Commuters | % Commuters |
| Less than 5 Minutes | 96 | 9.2% |
| 5 to 9 Minutes | 175 | 16.9% |
| 10 to 14 Minutes | 175 | 16.9% |
| 15 to 19 Minutes | 157 | 15.1% |
| 20 to 24 Minutes | 42 | 4.1% |
| 25 to 29 Minutes | 15 | 1.5% |
| 30 to 34 Minutes | 172 | 16.6% |
| 35 to 39 Minutes | 69 | 6.7% |
| 40 to 44 Minutes | 24 | 2.3% |
| 45 to 59 Minutes | 69 | 6.7% |
| 60 to 89 Minutes | 41 | 4.0% |
| 90 or more Minutes | 3 | 0.3% |
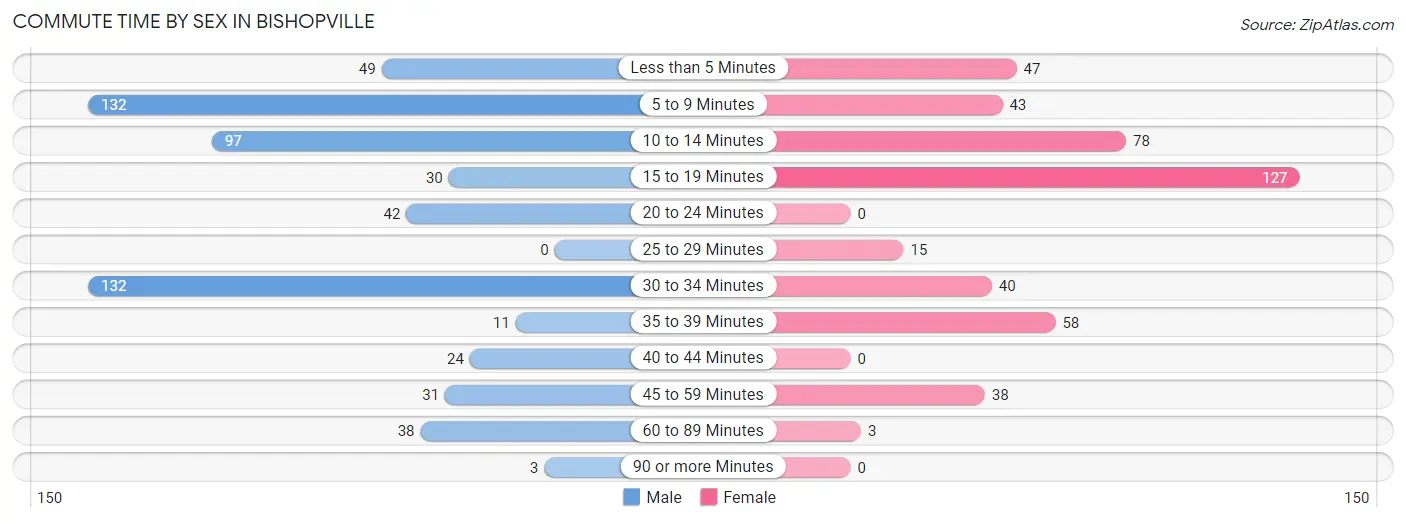
Commute Time by Sex in Bishopville
The most common commute times in Bishopville are 5 to 9 minutes (132 commuters, 22.4%) for males and 15 to 19 minutes (127 commuters, 28.3%) for females.
| Commute Time | Male | Female |
| Less than 5 Minutes | 49 (8.3%) | 47 (10.5%) |
| 5 to 9 Minutes | 132 (22.4%) | 43 (9.6%) |
| 10 to 14 Minutes | 97 (16.5%) | 78 (17.4%) |
| 15 to 19 Minutes | 30 (5.1%) | 127 (28.3%) |
| 20 to 24 Minutes | 42 (7.1%) | 0 (0.0%) |
| 25 to 29 Minutes | 0 (0.0%) | 15 (3.3%) |
| 30 to 34 Minutes | 132 (22.4%) | 40 (8.9%) |
| 35 to 39 Minutes | 11 (1.9%) | 58 (12.9%) |
| 40 to 44 Minutes | 24 (4.1%) | 0 (0.0%) |
| 45 to 59 Minutes | 31 (5.3%) | 38 (8.5%) |
| 60 to 89 Minutes | 38 (6.5%) | 3 (0.7%) |
| 90 or more Minutes | 3 (0.5%) | 0 (0.0%) |
Time of Departure to Work by Sex in Bishopville
The most frequent times of departure to work in Bishopville are 7:00 AM to 7:29 AM (151, 25.6%) for males and 7:00 AM to 7:29 AM (118, 26.3%) for females.
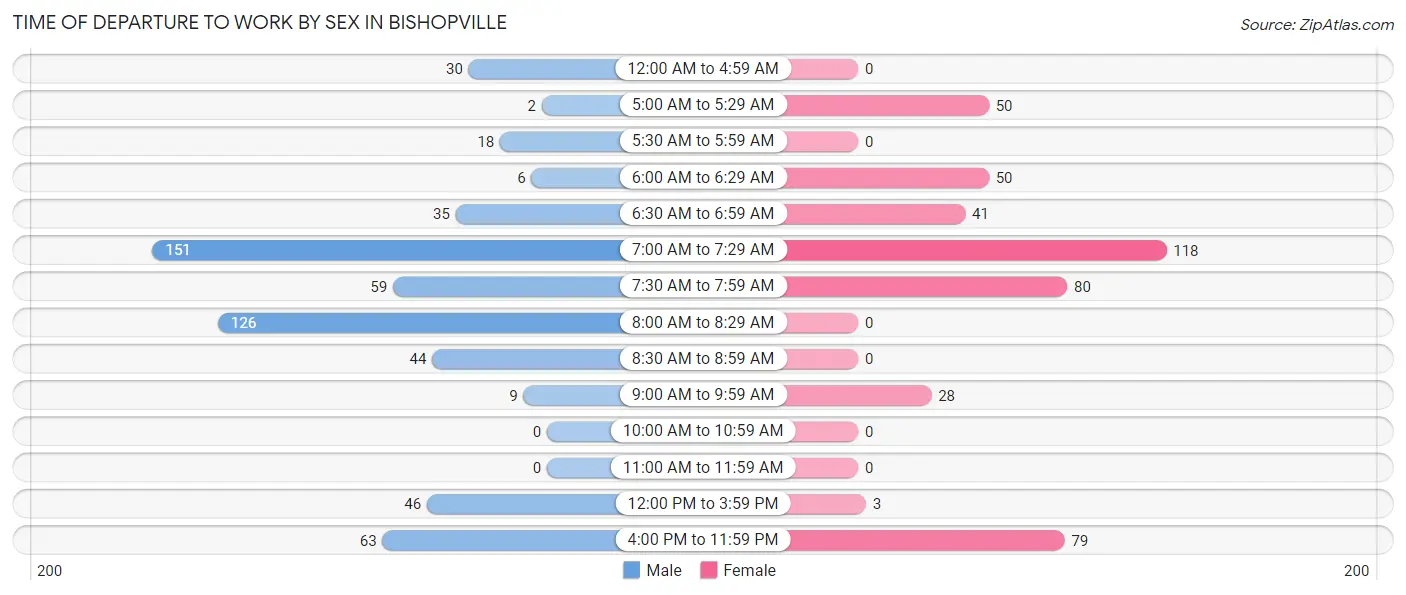
| Time of Departure | Male | Female |
| 12:00 AM to 4:59 AM | 30 (5.1%) | 0 (0.0%) |
| 5:00 AM to 5:29 AM | 2 (0.3%) | 50 (11.1%) |
| 5:30 AM to 5:59 AM | 18 (3.1%) | 0 (0.0%) |
| 6:00 AM to 6:29 AM | 6 (1.0%) | 50 (11.1%) |
| 6:30 AM to 6:59 AM | 35 (5.9%) | 41 (9.1%) |
| 7:00 AM to 7:29 AM | 151 (25.6%) | 118 (26.3%) |
| 7:30 AM to 7:59 AM | 59 (10.0%) | 80 (17.8%) |
| 8:00 AM to 8:29 AM | 126 (21.4%) | 0 (0.0%) |
| 8:30 AM to 8:59 AM | 44 (7.5%) | 0 (0.0%) |
| 9:00 AM to 9:59 AM | 9 (1.5%) | 28 (6.2%) |
| 10:00 AM to 10:59 AM | 0 (0.0%) | 0 (0.0%) |
| 11:00 AM to 11:59 AM | 0 (0.0%) | 0 (0.0%) |
| 12:00 PM to 3:59 PM | 46 (7.8%) | 3 (0.7%) |
| 4:00 PM to 11:59 PM | 63 (10.7%) | 79 (17.6%) |
| Total | 589 (100.0%) | 449 (100.0%) |
Housing Occupancy in Bishopville
Occupancy by Ownership in Bishopville
Of the total 1,332 dwellings in Bishopville, owner-occupied units account for 658 (49.4%), while renter-occupied units make up 674 (50.6%).
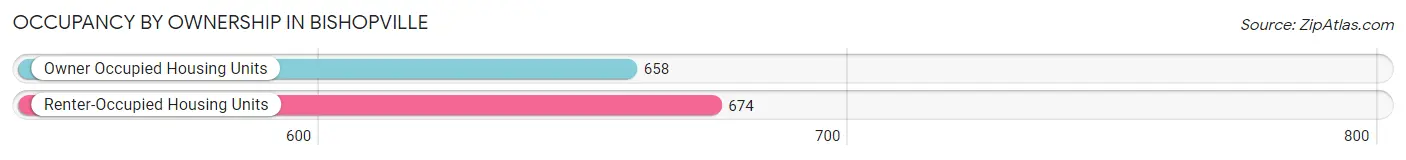
| Occupancy | # Housing Units | % Housing Units |
| Owner Occupied Housing Units | 658 | 49.4% |
| Renter-Occupied Housing Units | 674 | 50.6% |
| Total Occupied Housing Units | 1,332 | 100.0% |
Occupancy by Household Size in Bishopville
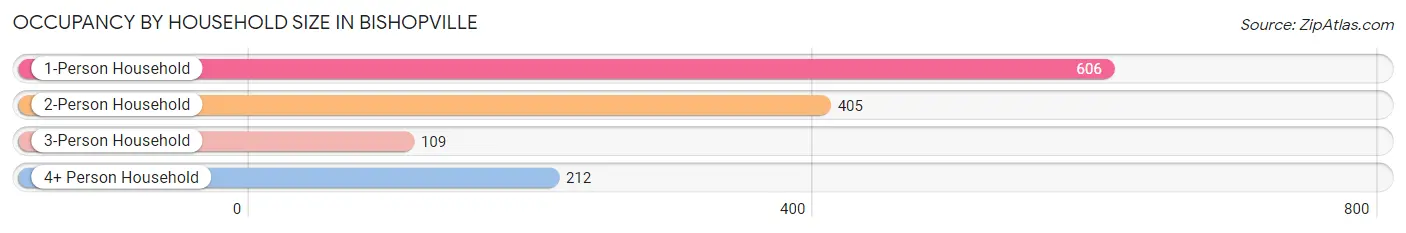
| Household Size | # Housing Units | % Housing Units |
| 1-Person Household | 606 | 45.5% |
| 2-Person Household | 405 | 30.4% |
| 3-Person Household | 109 | 8.2% |
| 4+ Person Household | 212 | 15.9% |
| Total Housing Units | 1,332 | 100.0% |
Occupancy by Ownership by Household Size in Bishopville
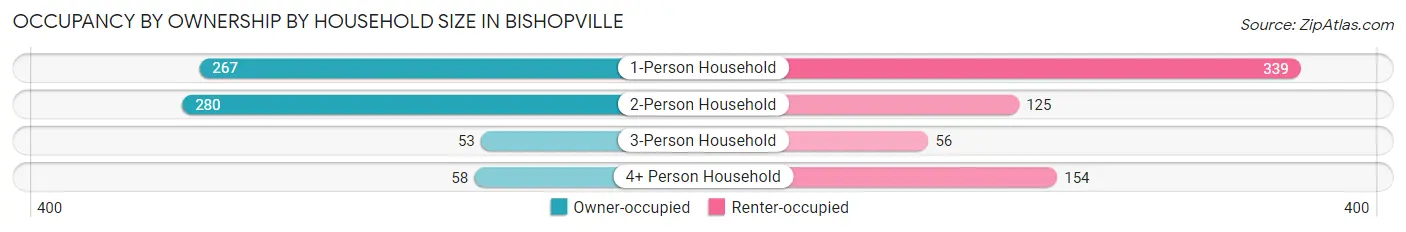
| Household Size | Owner-occupied | Renter-occupied |
| 1-Person Household | 267 (44.1%) | 339 (55.9%) |
| 2-Person Household | 280 (69.1%) | 125 (30.9%) |
| 3-Person Household | 53 (48.6%) | 56 (51.4%) |
| 4+ Person Household | 58 (27.4%) | 154 (72.6%) |
| Total Housing Units | 658 (49.4%) | 674 (50.6%) |
Occupancy by Educational Attainment in Bishopville
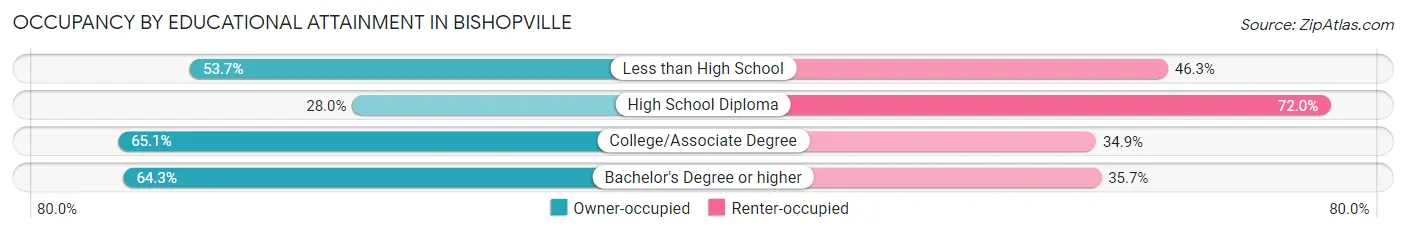
| Household Size | Owner-occupied | Renter-occupied |
| Less than High School | 79 (53.7%) | 68 (46.3%) |
| High School Diploma | 144 (28.0%) | 370 (72.0%) |
| College/Associate Degree | 271 (65.1%) | 145 (34.9%) |
| Bachelor's Degree or higher | 164 (64.3%) | 91 (35.7%) |
Occupancy by Age of Householder in Bishopville
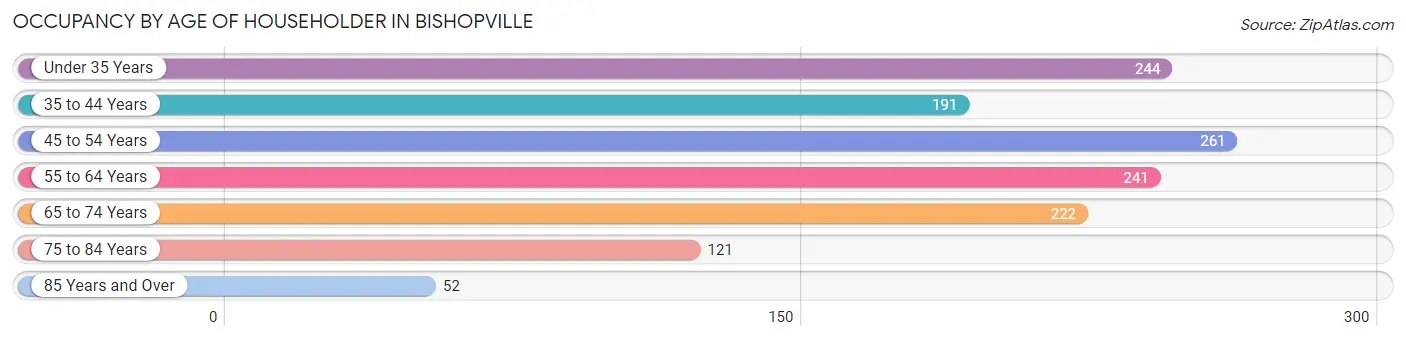
| Age Bracket | # Households | % Households |
| Under 35 Years | 244 | 18.3% |
| 35 to 44 Years | 191 | 14.3% |
| 45 to 54 Years | 261 | 19.6% |
| 55 to 64 Years | 241 | 18.1% |
| 65 to 74 Years | 222 | 16.7% |
| 75 to 84 Years | 121 | 9.1% |
| 85 Years and Over | 52 | 3.9% |
| Total | 1,332 | 100.0% |
Housing Finances in Bishopville
Median Income by Occupancy in Bishopville
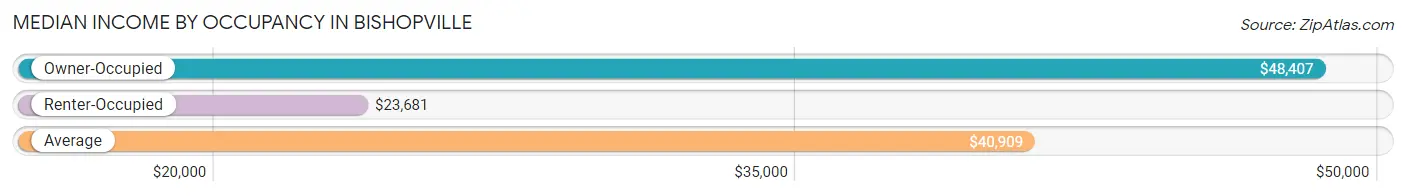
| Occupancy Type | # Households | Median Income |
| Owner-Occupied | 658 (49.4%) | $48,407 |
| Renter-Occupied | 674 (50.6%) | $23,681 |
| Average | 1,332 (100.0%) | $40,909 |
Occupancy by Householder Income Bracket in Bishopville
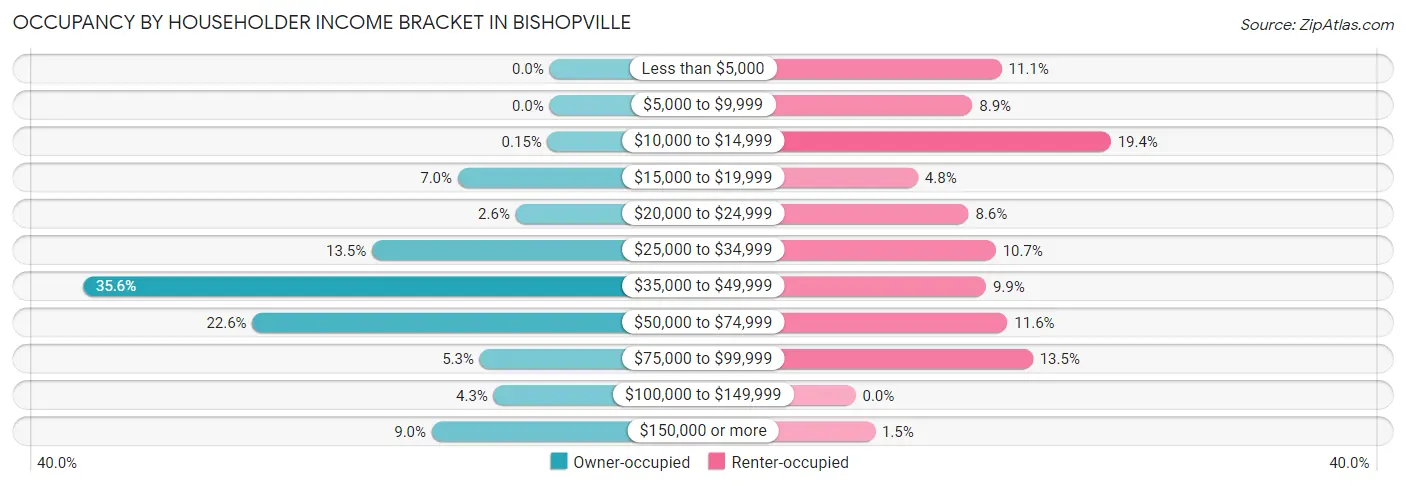
| Income Bracket | Owner-occupied | Renter-occupied |
| Less than $5,000 | 0 (0.0%) | 75 (11.1%) |
| $5,000 to $9,999 | 0 (0.0%) | 60 (8.9%) |
| $10,000 to $14,999 | 1 (0.2%) | 131 (19.4%) |
| $15,000 to $19,999 | 46 (7.0%) | 32 (4.8%) |
| $20,000 to $24,999 | 17 (2.6%) | 58 (8.6%) |
| $25,000 to $34,999 | 89 (13.5%) | 72 (10.7%) |
| $35,000 to $49,999 | 234 (35.6%) | 67 (9.9%) |
| $50,000 to $74,999 | 149 (22.6%) | 78 (11.6%) |
| $75,000 to $99,999 | 35 (5.3%) | 91 (13.5%) |
| $100,000 to $149,999 | 28 (4.3%) | 0 (0.0%) |
| $150,000 or more | 59 (9.0%) | 10 (1.5%) |
| Total | 658 (100.0%) | 674 (100.0%) |
Monthly Housing Cost Tiers in Bishopville
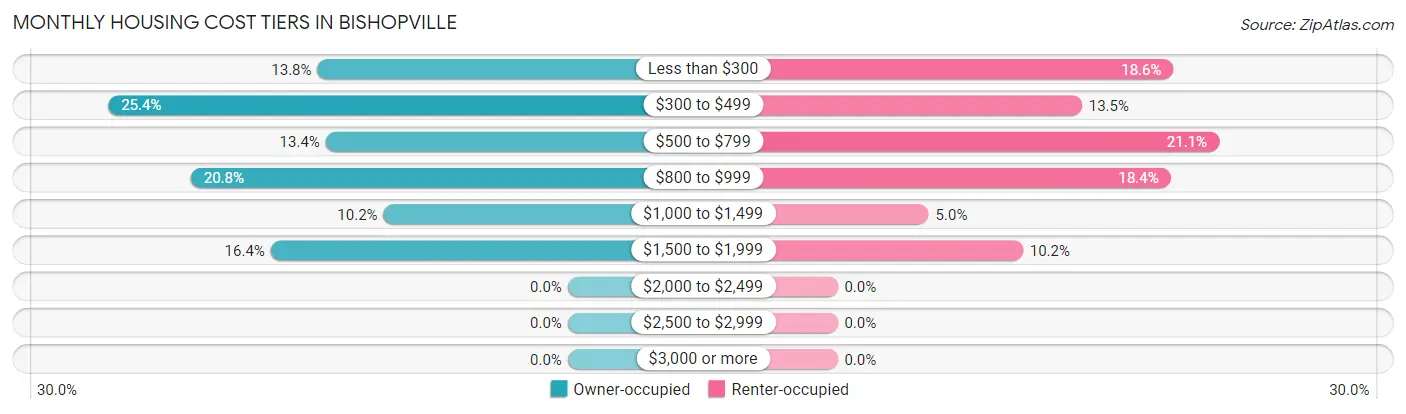
| Monthly Cost | Owner-occupied | Renter-occupied |
| Less than $300 | 91 (13.8%) | 125 (18.5%) |
| $300 to $499 | 167 (25.4%) | 91 (13.5%) |
| $500 to $799 | 88 (13.4%) | 142 (21.1%) |
| $800 to $999 | 137 (20.8%) | 124 (18.4%) |
| $1,000 to $1,499 | 67 (10.2%) | 34 (5.0%) |
| $1,500 to $1,999 | 108 (16.4%) | 69 (10.2%) |
| $2,000 to $2,499 | 0 (0.0%) | 0 (0.0%) |
| $2,500 to $2,999 | 0 (0.0%) | 0 (0.0%) |
| $3,000 or more | 0 (0.0%) | 0 (0.0%) |
| Total | 658 (100.0%) | 674 (100.0%) |
Physical Housing Characteristics in Bishopville
Housing Structures in Bishopville
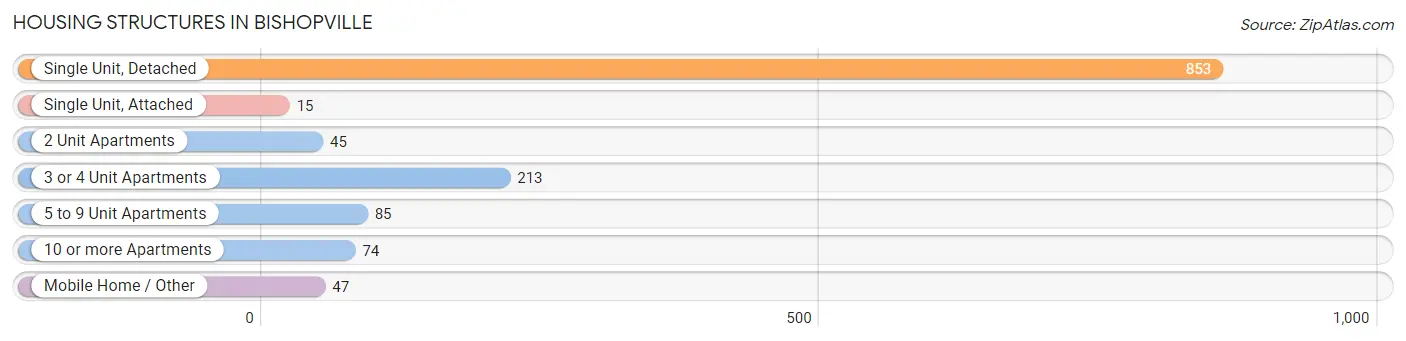
| Structure Type | # Housing Units | % Housing Units |
| Single Unit, Detached | 853 | 64.0% |
| Single Unit, Attached | 15 | 1.1% |
| 2 Unit Apartments | 45 | 3.4% |
| 3 or 4 Unit Apartments | 213 | 16.0% |
| 5 to 9 Unit Apartments | 85 | 6.4% |
| 10 or more Apartments | 74 | 5.6% |
| Mobile Home / Other | 47 | 3.5% |
| Total | 1,332 | 100.0% |
Housing Structures by Occupancy in Bishopville
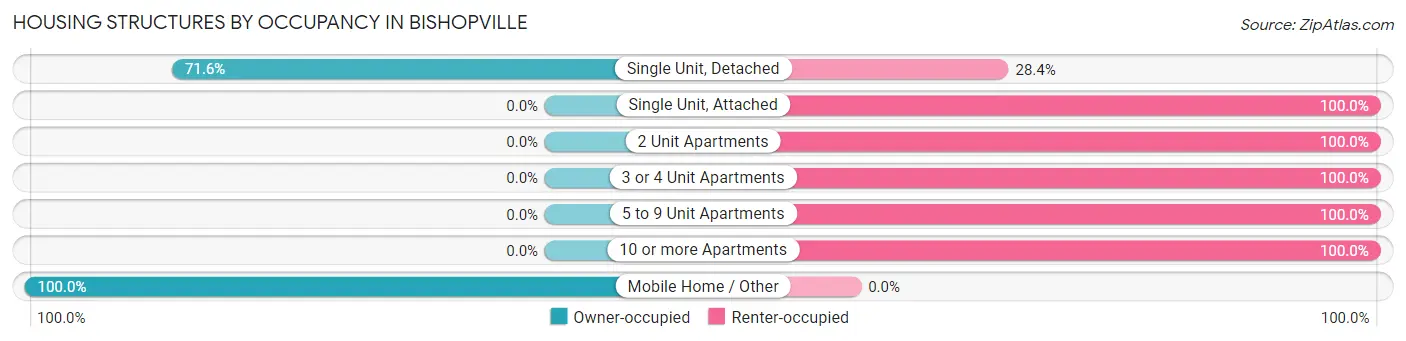
| Structure Type | Owner-occupied | Renter-occupied |
| Single Unit, Detached | 611 (71.6%) | 242 (28.4%) |
| Single Unit, Attached | 0 (0.0%) | 15 (100.0%) |
| 2 Unit Apartments | 0 (0.0%) | 45 (100.0%) |
| 3 or 4 Unit Apartments | 0 (0.0%) | 213 (100.0%) |
| 5 to 9 Unit Apartments | 0 (0.0%) | 85 (100.0%) |
| 10 or more Apartments | 0 (0.0%) | 74 (100.0%) |
| Mobile Home / Other | 47 (100.0%) | 0 (0.0%) |
| Total | 658 (49.4%) | 674 (50.6%) |
Housing Structures by Number of Rooms in Bishopville
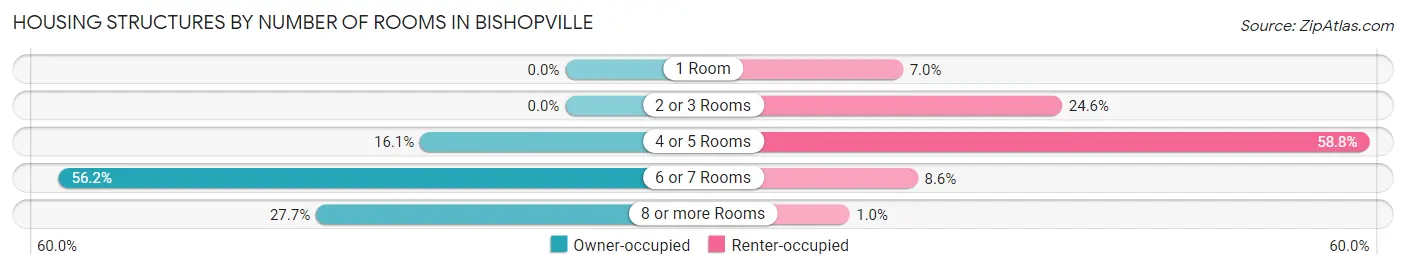
| Number of Rooms | Owner-occupied | Renter-occupied |
| 1 Room | 0 (0.0%) | 47 (7.0%) |
| 2 or 3 Rooms | 0 (0.0%) | 166 (24.6%) |
| 4 or 5 Rooms | 106 (16.1%) | 396 (58.8%) |
| 6 or 7 Rooms | 370 (56.2%) | 58 (8.6%) |
| 8 or more Rooms | 182 (27.7%) | 7 (1.0%) |
| Total | 658 (100.0%) | 674 (100.0%) |
Housing Structure by Heating Type in Bishopville
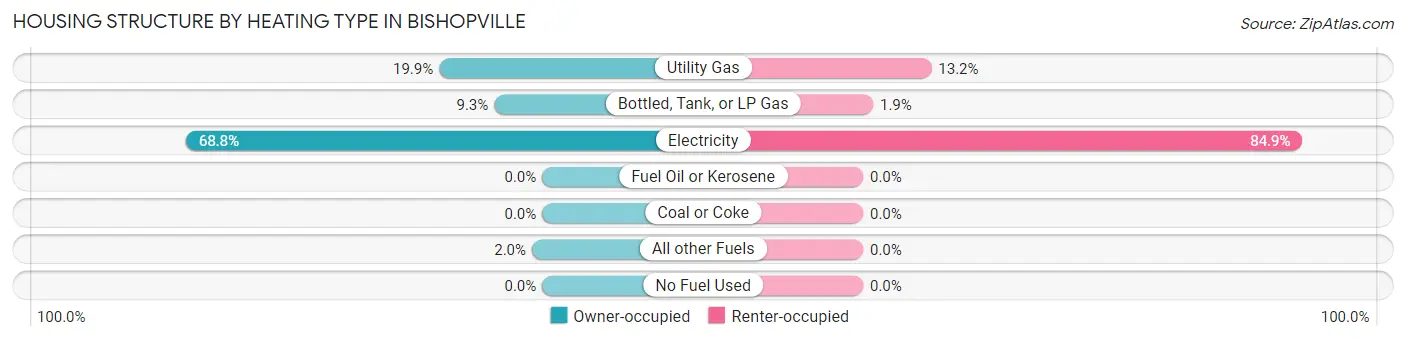
| Heating Type | Owner-occupied | Renter-occupied |
| Utility Gas | 131 (19.9%) | 89 (13.2%) |
| Bottled, Tank, or LP Gas | 61 (9.3%) | 13 (1.9%) |
| Electricity | 453 (68.8%) | 572 (84.9%) |
| Fuel Oil or Kerosene | 0 (0.0%) | 0 (0.0%) |
| Coal or Coke | 0 (0.0%) | 0 (0.0%) |
| All other Fuels | 13 (2.0%) | 0 (0.0%) |
| No Fuel Used | 0 (0.0%) | 0 (0.0%) |
| Total | 658 (100.0%) | 674 (100.0%) |
Household Vehicle Usage in Bishopville
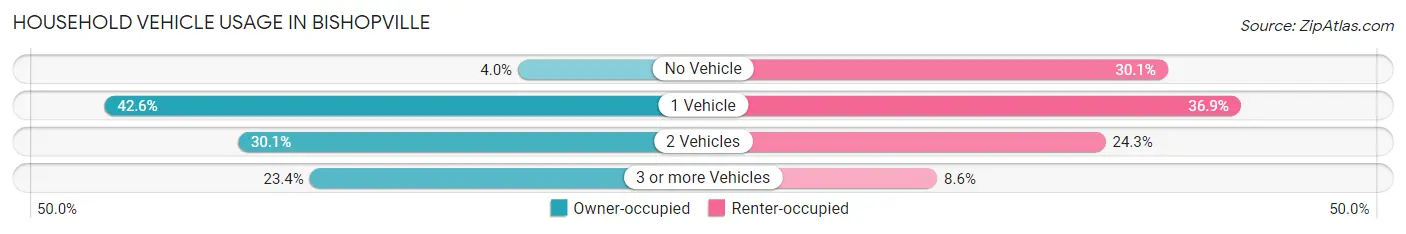
| Vehicles per Household | Owner-occupied | Renter-occupied |
| No Vehicle | 26 (4.0%) | 203 (30.1%) |
| 1 Vehicle | 280 (42.5%) | 249 (36.9%) |
| 2 Vehicles | 198 (30.1%) | 164 (24.3%) |
| 3 or more Vehicles | 154 (23.4%) | 58 (8.6%) |
| Total | 658 (100.0%) | 674 (100.0%) |
Real Estate & Mortgages in Bishopville
Real Estate and Mortgage Overview in Bishopville
| Characteristic | Without Mortgage | With Mortgage |
| Housing Units | 331 | 327 |
| Median Property Value | $133,700 | $109,200 |
| Median Household Income | $49,779 | $8 |
| Monthly Housing Costs | $351 | $0 |
| Real Estate Taxes | $873 | $0 |
Property Value by Mortgage Status in Bishopville
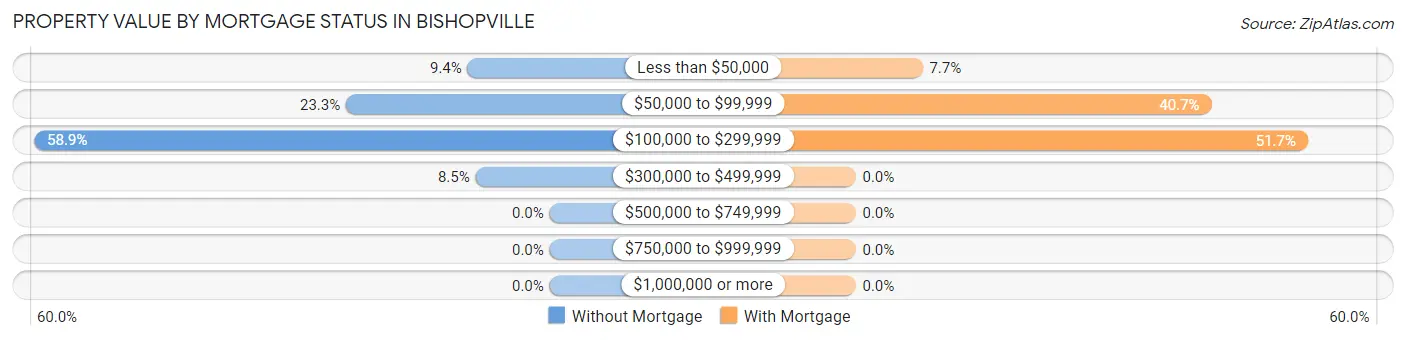
| Property Value | Without Mortgage | With Mortgage |
| Less than $50,000 | 31 (9.4%) | 25 (7.6%) |
| $50,000 to $99,999 | 77 (23.3%) | 133 (40.7%) |
| $100,000 to $299,999 | 195 (58.9%) | 169 (51.7%) |
| $300,000 to $499,999 | 28 (8.5%) | 0 (0.0%) |
| $500,000 to $749,999 | 0 (0.0%) | 0 (0.0%) |
| $750,000 to $999,999 | 0 (0.0%) | 0 (0.0%) |
| $1,000,000 or more | 0 (0.0%) | 0 (0.0%) |
| Total | 331 (100.0%) | 327 (100.0%) |
Household Income by Mortgage Status in Bishopville
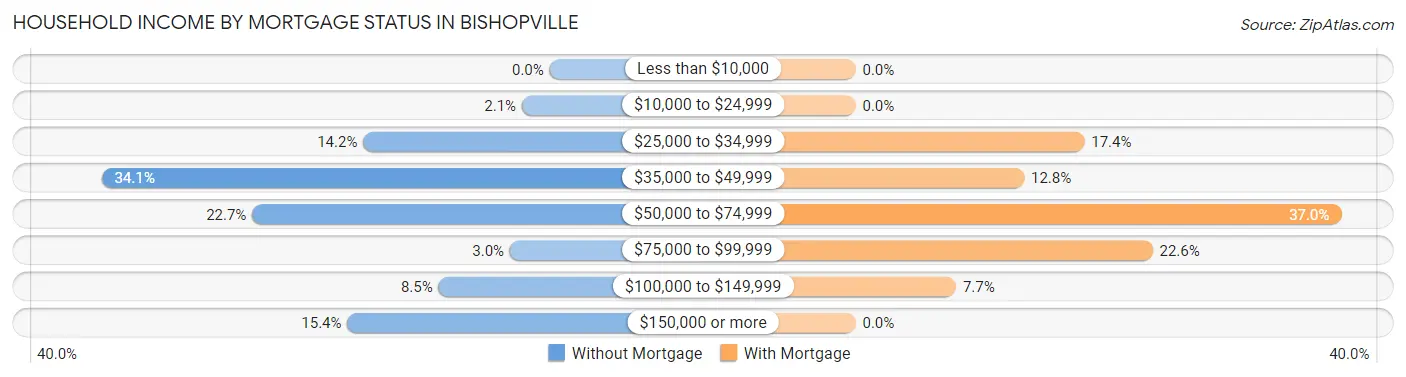
| Household Income | Without Mortgage | With Mortgage |
| Less than $10,000 | 0 (0.0%) | 0 (0.0%) |
| $10,000 to $24,999 | 7 (2.1%) | 0 (0.0%) |
| $25,000 to $34,999 | 47 (14.2%) | 57 (17.4%) |
| $35,000 to $49,999 | 113 (34.1%) | 42 (12.8%) |
| $50,000 to $74,999 | 75 (22.7%) | 121 (37.0%) |
| $75,000 to $99,999 | 10 (3.0%) | 74 (22.6%) |
| $100,000 to $149,999 | 28 (8.5%) | 25 (7.6%) |
| $150,000 or more | 51 (15.4%) | 0 (0.0%) |
| Total | 331 (100.0%) | 327 (100.0%) |
Property Value to Household Income Ratio in Bishopville
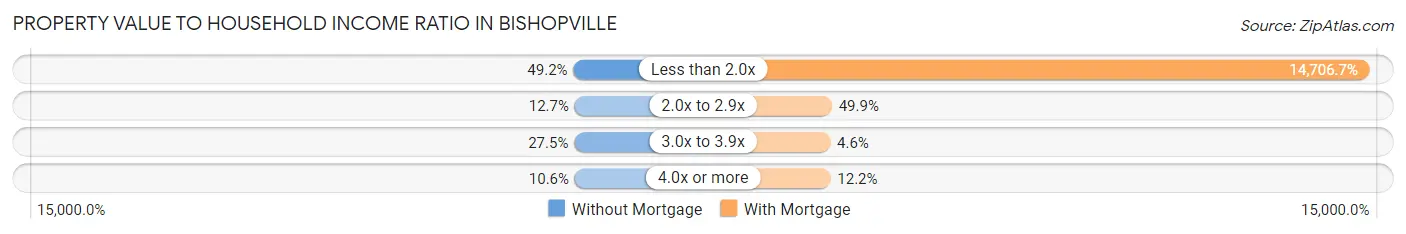
| Value-to-Income Ratio | Without Mortgage | With Mortgage |
| Less than 2.0x | 163 (49.2%) | 48,091 (14,706.7%) |
| 2.0x to 2.9x | 42 (12.7%) | 163 (49.8%) |
| 3.0x to 3.9x | 91 (27.5%) | 15 (4.6%) |
| 4.0x or more | 35 (10.6%) | 40 (12.2%) |
| Total | 331 (100.0%) | 327 (100.0%) |
Real Estate Taxes by Mortgage Status in Bishopville
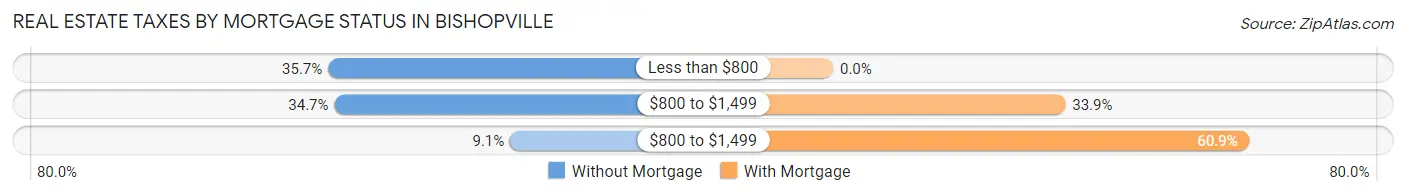
| Property Taxes | Without Mortgage | With Mortgage |
| Less than $800 | 118 (35.6%) | 0 (0.0%) |
| $800 to $1,499 | 115 (34.7%) | 111 (33.9%) |
| $800 to $1,499 | 30 (9.1%) | 199 (60.9%) |
| Total | 331 (100.0%) | 327 (100.0%) |
Health & Disability in Bishopville
Health Insurance Coverage by Age in Bishopville
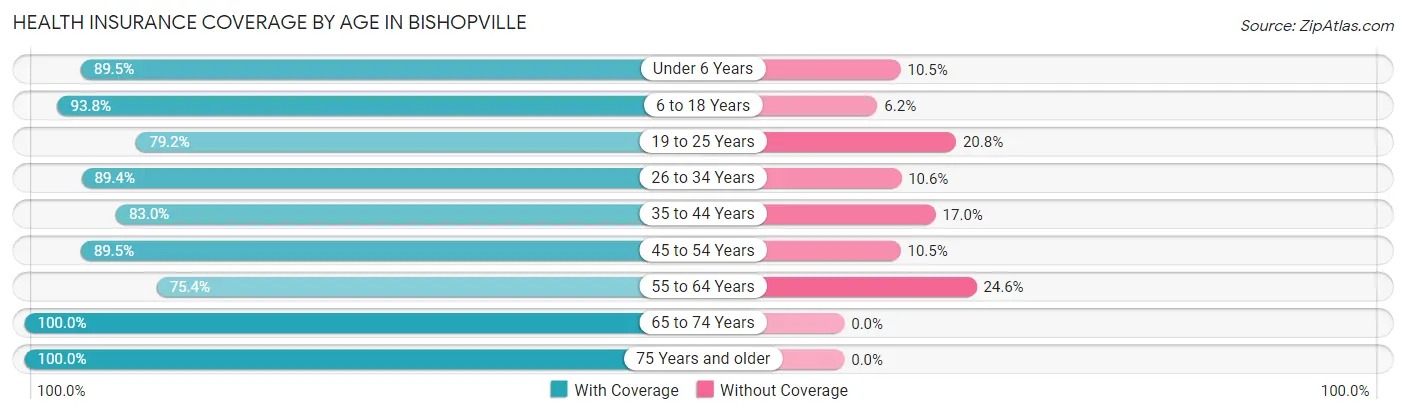
| Age Bracket | With Coverage | Without Coverage |
| Under 6 Years | 239 (89.5%) | 28 (10.5%) |
| 6 to 18 Years | 350 (93.8%) | 23 (6.2%) |
| 19 to 25 Years | 133 (79.2%) | 35 (20.8%) |
| 26 to 34 Years | 278 (89.4%) | 33 (10.6%) |
| 35 to 44 Years | 258 (83.0%) | 53 (17.0%) |
| 45 to 54 Years | 367 (89.5%) | 43 (10.5%) |
| 55 to 64 Years | 260 (75.4%) | 85 (24.6%) |
| 65 to 74 Years | 421 (100.0%) | 0 (0.0%) |
| 75 Years and older | 236 (100.0%) | 0 (0.0%) |
| Total | 2,542 (89.4%) | 300 (10.6%) |
Health Insurance Coverage by Citizenship Status in Bishopville
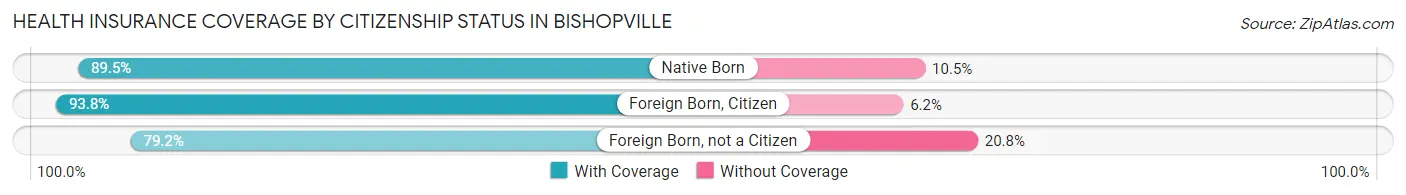
| Citizenship Status | With Coverage | Without Coverage |
| Native Born | 239 (89.5%) | 28 (10.5%) |
| Foreign Born, Citizen | 350 (93.8%) | 23 (6.2%) |
| Foreign Born, not a Citizen | 133 (79.2%) | 35 (20.8%) |
Health Insurance Coverage by Household Income in Bishopville
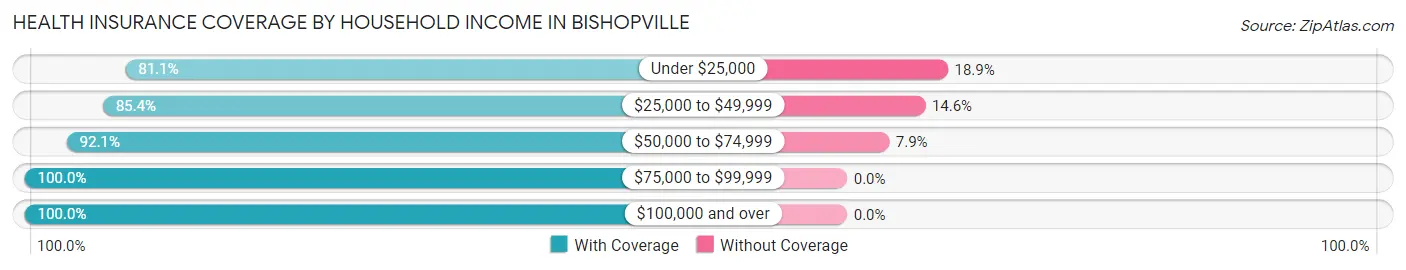
| Household Income | With Coverage | Without Coverage |
| Under $25,000 | 490 (81.1%) | 114 (18.9%) |
| $25,000 to $49,999 | 787 (85.4%) | 135 (14.6%) |
| $50,000 to $74,999 | 596 (92.1%) | 51 (7.9%) |
| $75,000 to $99,999 | 332 (100.0%) | 0 (0.0%) |
| $100,000 and over | 273 (100.0%) | 0 (0.0%) |
Public vs Private Health Insurance Coverage by Age in Bishopville
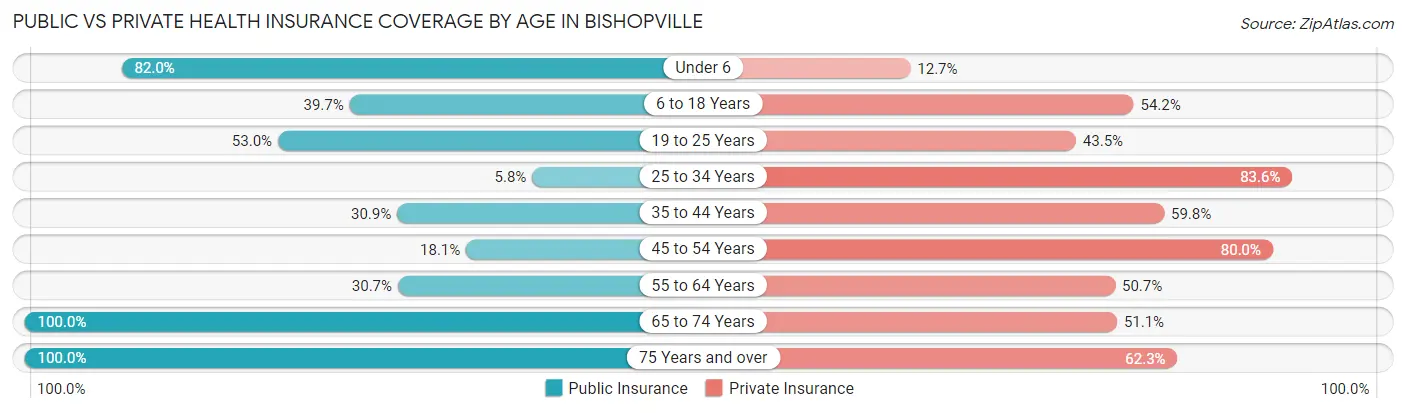
| Age Bracket | Public Insurance | Private Insurance |
| Under 6 | 219 (82.0%) | 34 (12.7%) |
| 6 to 18 Years | 148 (39.7%) | 202 (54.2%) |
| 19 to 25 Years | 89 (53.0%) | 73 (43.4%) |
| 25 to 34 Years | 18 (5.8%) | 260 (83.6%) |
| 35 to 44 Years | 96 (30.9%) | 186 (59.8%) |
| 45 to 54 Years | 74 (18.0%) | 328 (80.0%) |
| 55 to 64 Years | 106 (30.7%) | 175 (50.7%) |
| 65 to 74 Years | 421 (100.0%) | 215 (51.1%) |
| 75 Years and over | 236 (100.0%) | 147 (62.3%) |
| Total | 1,407 (49.5%) | 1,620 (57.0%) |
Disability Status by Sex by Age in Bishopville
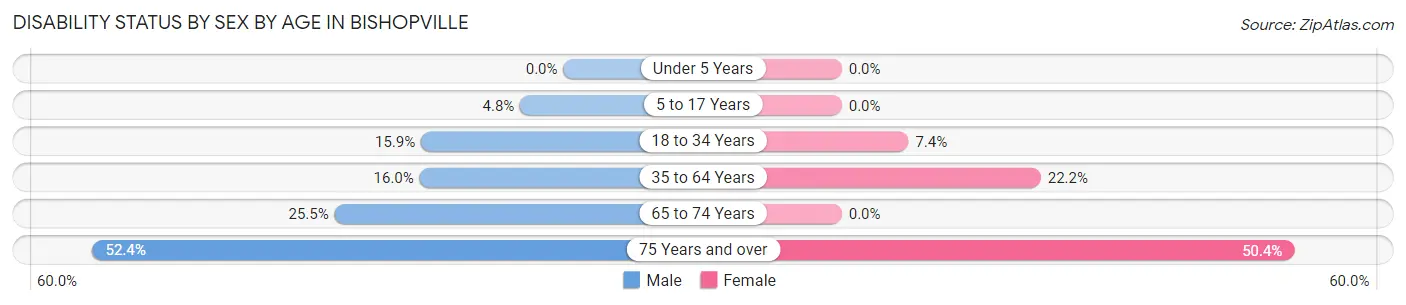
| Age Bracket | Male | Female |
| Under 5 Years | 0 (0.0%) | 0 (0.0%) |
| 5 to 17 Years | 10 (4.8%) | 0 (0.0%) |
| 18 to 34 Years | 29 (15.9%) | 22 (7.4%) |
| 35 to 64 Years | 89 (16.0%) | 113 (22.2%) |
| 65 to 74 Years | 66 (25.5%) | 0 (0.0%) |
| 75 Years and over | 54 (52.4%) | 67 (50.4%) |
Disability Class by Sex by Age in Bishopville
Disability Class: Hearing Difficulty
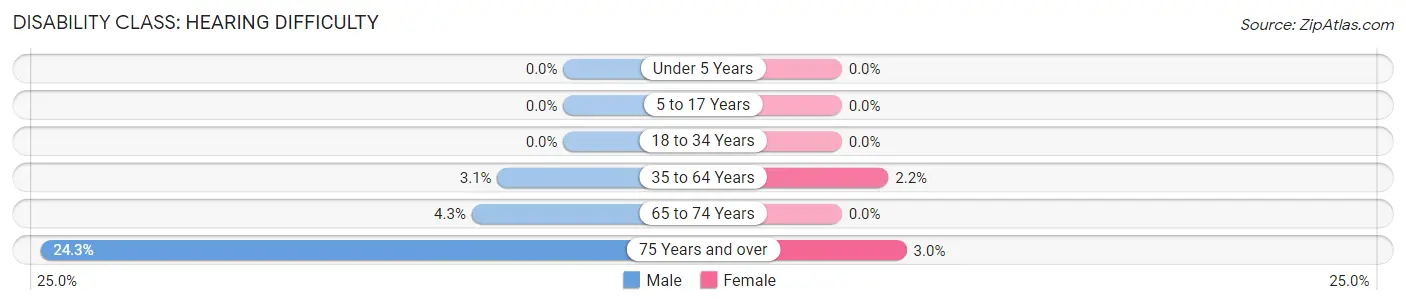
| Age Bracket | Male | Female |
| Under 5 Years | 0 (0.0%) | 0 (0.0%) |
| 5 to 17 Years | 0 (0.0%) | 0 (0.0%) |
| 18 to 34 Years | 0 (0.0%) | 0 (0.0%) |
| 35 to 64 Years | 17 (3.1%) | 11 (2.2%) |
| 65 to 74 Years | 11 (4.3%) | 0 (0.0%) |
| 75 Years and over | 25 (24.3%) | 4 (3.0%) |
Disability Class: Vision Difficulty
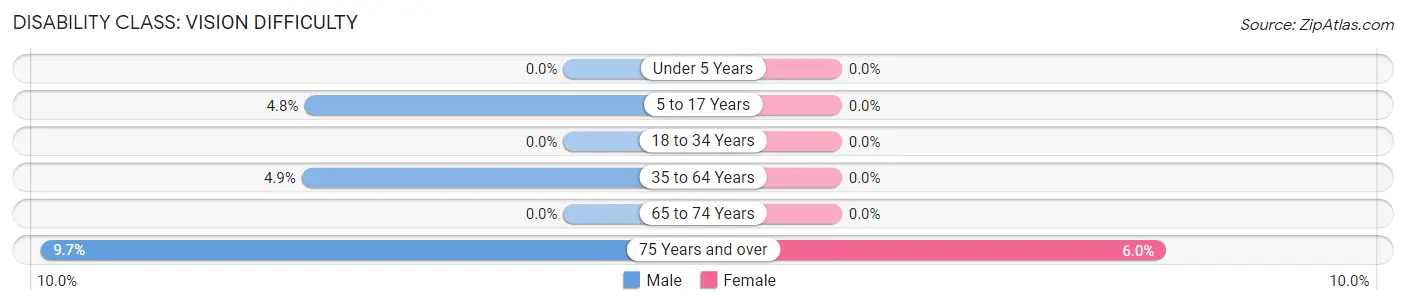
| Age Bracket | Male | Female |
| Under 5 Years | 0 (0.0%) | 0 (0.0%) |
| 5 to 17 Years | 10 (4.8%) | 0 (0.0%) |
| 18 to 34 Years | 0 (0.0%) | 0 (0.0%) |
| 35 to 64 Years | 27 (4.9%) | 0 (0.0%) |
| 65 to 74 Years | 0 (0.0%) | 0 (0.0%) |
| 75 Years and over | 10 (9.7%) | 8 (6.0%) |
Disability Class: Cognitive Difficulty
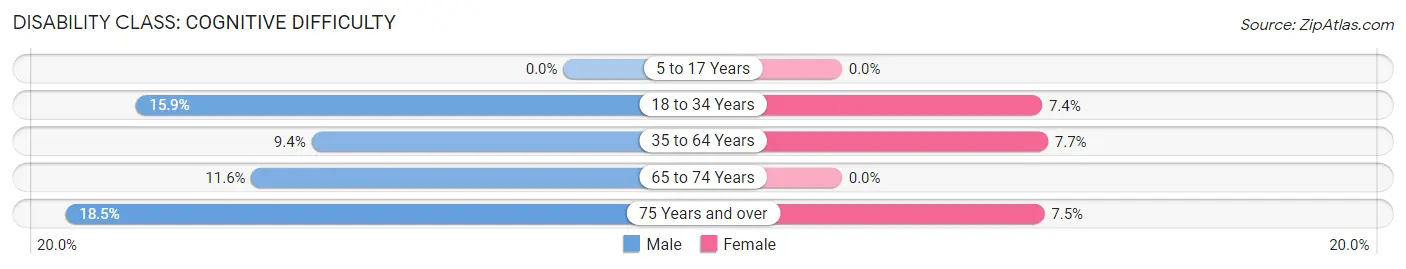
| Age Bracket | Male | Female |
| 5 to 17 Years | 0 (0.0%) | 0 (0.0%) |
| 18 to 34 Years | 29 (15.9%) | 22 (7.4%) |
| 35 to 64 Years | 52 (9.3%) | 39 (7.6%) |
| 65 to 74 Years | 30 (11.6%) | 0 (0.0%) |
| 75 Years and over | 19 (18.4%) | 10 (7.5%) |
Disability Class: Ambulatory Difficulty
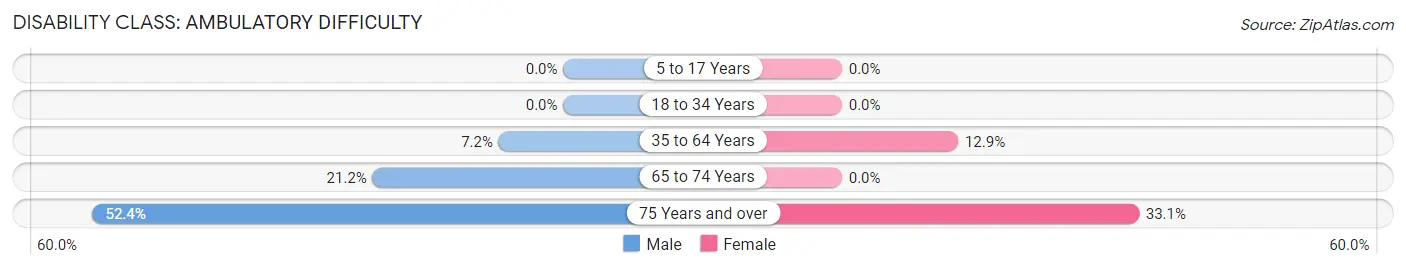
| Age Bracket | Male | Female |
| 5 to 17 Years | 0 (0.0%) | 0 (0.0%) |
| 18 to 34 Years | 0 (0.0%) | 0 (0.0%) |
| 35 to 64 Years | 40 (7.2%) | 66 (12.9%) |
| 65 to 74 Years | 55 (21.2%) | 0 (0.0%) |
| 75 Years and over | 54 (52.4%) | 44 (33.1%) |
Disability Class: Self-Care Difficulty
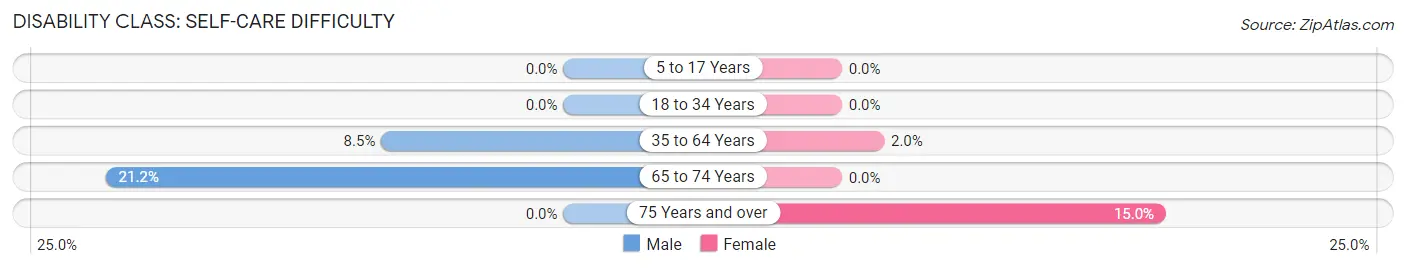
| Age Bracket | Male | Female |
| 5 to 17 Years | 0 (0.0%) | 0 (0.0%) |
| 18 to 34 Years | 0 (0.0%) | 0 (0.0%) |
| 35 to 64 Years | 47 (8.5%) | 10 (2.0%) |
| 65 to 74 Years | 55 (21.2%) | 0 (0.0%) |
| 75 Years and over | 0 (0.0%) | 20 (15.0%) |
Technology Access in Bishopville
Computing Device Access in Bishopville
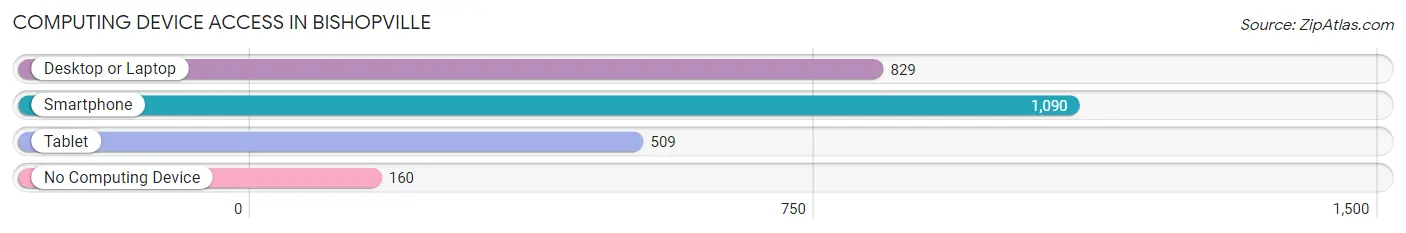
| Device Type | # Households | % Households |
| Desktop or Laptop | 829 | 62.2% |
| Smartphone | 1,090 | 81.8% |
| Tablet | 509 | 38.2% |
| No Computing Device | 160 | 12.0% |
| Total | 1,332 | 100.0% |
Internet Access in Bishopville
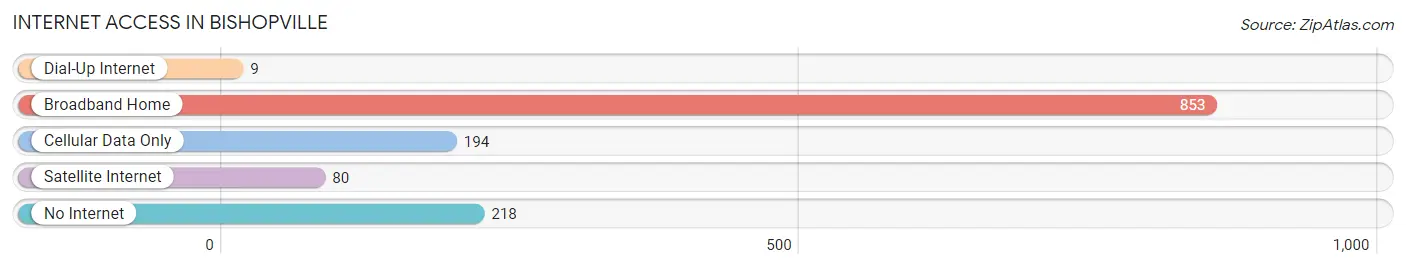
| Internet Type | # Households | % Households |
| Dial-Up Internet | 9 | 0.7% |
| Broadband Home | 853 | 64.0% |
| Cellular Data Only | 194 | 14.6% |
| Satellite Internet | 80 | 6.0% |
| No Internet | 218 | 16.4% |
| Total | 1,332 | 100.0% |
Bishopville Summary
Bishopville is a small town located in Lee County, South Carolina. It is the county seat of Lee County and is located in the Pee Dee region of the state. The town has a population of 3,077 as of the 2010 census.
Geography
Bishopville is located in the Pee Dee region of South Carolina, approximately halfway between Columbia and Florence. The town is situated on the banks of the Lynches River, which flows through the town. The town is located in the Sandhills region of the state, which is characterized by sandy soils and rolling hills. The town is located in the Atlantic Coastal Plain, which is characterized by flat terrain and sandy soils.
The town is located at an elevation of approximately 200 feet above sea level. The climate in Bishopville is humid subtropical, with hot, humid summers and mild winters. The average annual temperature is around 70 degrees Fahrenheit.
Economy
The economy of Bishopville is largely based on agriculture. The town is home to several large farms, including the Bishopville Cotton Mill, which is the largest cotton mill in the state. The town is also home to several small businesses, including restaurants, retail stores, and service providers.
The town is also home to several manufacturing companies, including the Bishopville Manufacturing Company, which produces furniture and other wood products. The town is also home to several food processing companies, including the Bishopville Poultry Processing Plant, which processes chicken for the local market.
Demographics
As of the 2010 census, the population of Bishopville was 3,077. The racial makeup of the town was 73.3% White, 22.2% African American, 0.3% Native American, 0.7% Asian, 0.1% Pacific Islander, and 3.4% from other races. Hispanic or Latino of any race were 2.2% of the population.
The median income for a household in Bishopville was $30,938, and the median income for a family was $37,917. The per capita income for the town was $15,945. About 17.2% of families and 20.3% of the population were below the poverty line, including 28.2% of those under age 18 and 16.2% of those age 65 or over.
Conclusion
Bishopville is a small town located in Lee County, South Carolina. It is the county seat of Lee County and is located in the Pee Dee region of the state. The town has a population of 3,077 as of the 2010 census. The economy of Bishopville is largely based on agriculture, with several large farms and manufacturing companies located in the town. The racial makeup of the town is 73.3% White, 22.2% African American, 0.3% Native American, 0.7% Asian, 0.1% Pacific Islander, and 3.4% from other races. The median income for a household in Bishopville was $30,938, and the median income for a family was $37,917. About 17.2% of families and 20.3% of the population were below the poverty line.
Common Questions
What is Per Capita Income in Bishopville?
Per Capita income in Bishopville is $23,701.
What is the Median Family Income in Bishopville?
Median Family Income in Bishopville is $43,194.
What is the Median Household income in Bishopville?
Median Household Income in Bishopville is $40,909.
What is Income or Wage Gap in Bishopville?
Income or Wage Gap in Bishopville is 36.4%.
Women in Bishopville earn 63.6 cents for every dollar earned by a man.
What is Inequality or Gini Index in Bishopville?
Inequality or Gini Index in Bishopville is 0.46.
What is the Total Population of Bishopville?
Total Population of Bishopville is 2,986.
What is the Total Male Population of Bishopville?
Total Male Population of Bishopville is 1,534.
What is the Total Female Population of Bishopville?
Total Female Population of Bishopville is 1,452.
What is the Ratio of Males per 100 Females in Bishopville?
There are 105.65 Males per 100 Females in Bishopville.
What is the Ratio of Females per 100 Males in Bishopville?
There are 94.65 Females per 100 Males in Bishopville.
What is the Median Population Age in Bishopville?
Median Population Age in Bishopville is 47.3 Years.
What is the Average Family Size in Bishopville
Average Family Size in Bishopville is 2.9 People.
What is the Average Household Size in Bishopville
Average Household Size in Bishopville is 2.1 People.
How Large is the Labor Force in Bishopville?
There are 1,169 People in the Labor Forcein in Bishopville.
What is the Percentage of People in the Labor Force in Bishopville?
49.6% of People are in the Labor Force in Bishopville.
What is the Unemployment Rate in Bishopville?
Unemployment Rate in Bishopville is 4.0%.