Manassas, GA Map & Demographics
Manassas Map
Manassas Overview
$36,357
PER CAPITA INCOME
$80,833
AVG FAMILY INCOME
$74,167
AVG HOUSEHOLD INCOME
0.26
INEQUALITY / GINI INDEX
82
TOTAL POPULATION
47
MALE POPULATION
35
FEMALE POPULATION
134.29
MALES / 100 FEMALES
74.47
FEMALES / 100 MALES
50.0
MEDIAN AGE
3.1
AVG FAMILY SIZE
2.6
AVG HOUSEHOLD SIZE
48
LABOR FORCE [ PEOPLE ]
65.8%
PERCENT IN LABOR FORCE
Manassas Area Codes
Income in Manassas
Income Overview in Manassas
Per Capita Income in Manassas is $36,357, while median incomes of families and households are $80,833 and $74,167 respectively.
| Characteristic | Number | Measure |
| Per Capita Income | 82 | $36,357 |
| Median Family Income | 24 | $80,833 |
| Mean Family Income | 24 | $101,125 |
| Median Household Income | 32 | $74,167 |
| Mean Household Income | 32 | $90,269 |
| Income Deficit | 24 | $0 |
| Wage / Income Gap (%) | 82 | 0.00% |
| Wage / Income Gap ($) | 82 | 100.00¢ per $1 |
| Gini / Inequality Index | 82 | 0.26 |
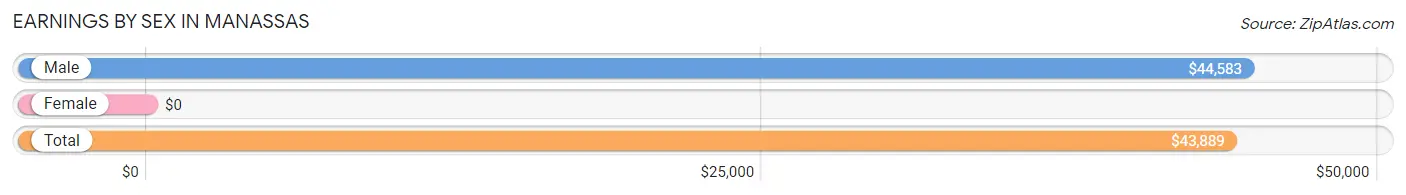
Earnings by Sex in Manassas
| Sex | Number | Average Earnings |
| Male | 35 (64.8%) | $44,583 |
| Female | 19 (35.2%) | $0 |
| Total | 54 (100.0%) | $43,889 |
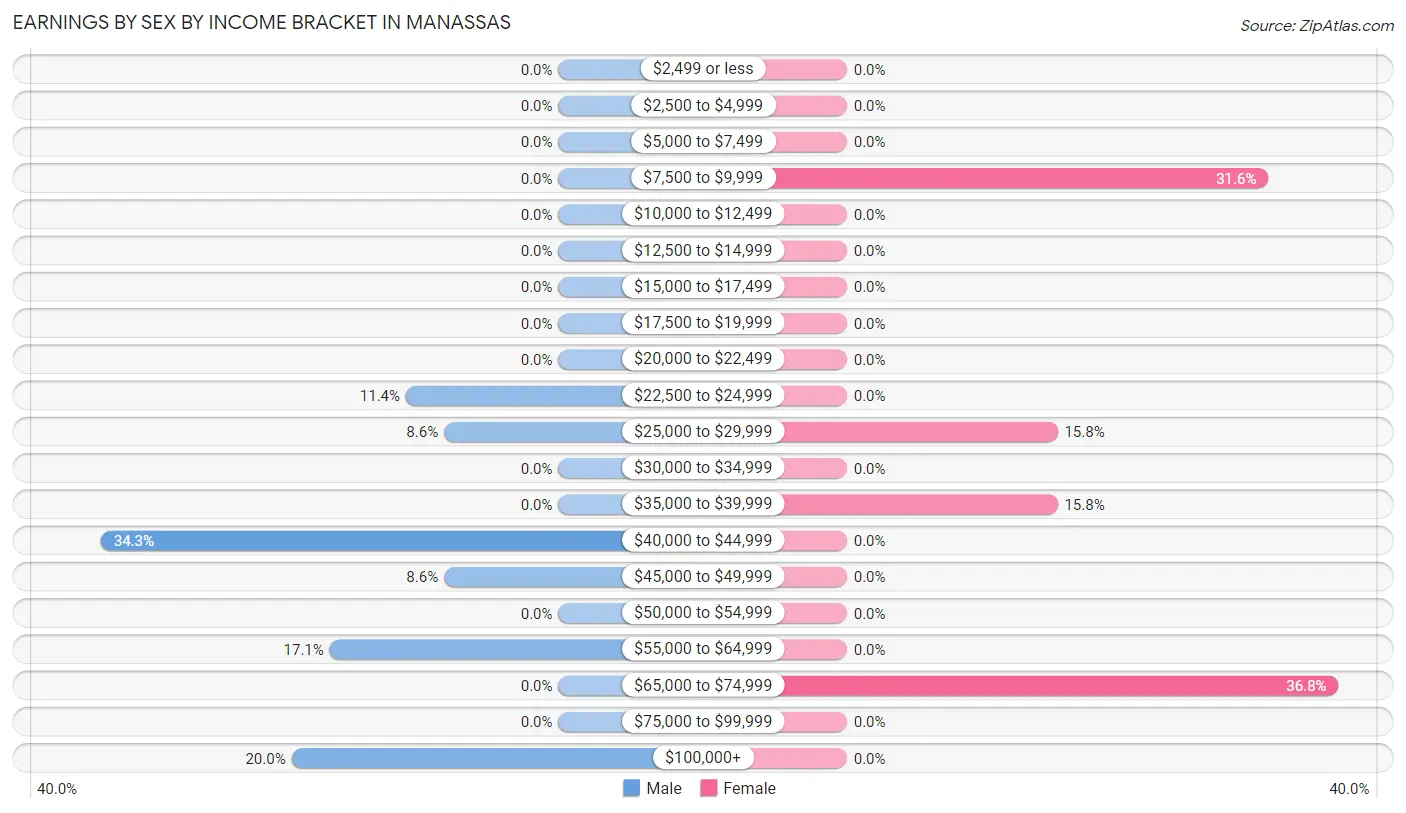
Earnings by Sex by Income Bracket in Manassas
The most common earnings brackets in Manassas are $40,000 to $44,999 for men (12 | 34.3%) and $65,000 to $74,999 for women (7 | 36.8%).
| Income | Male | Female |
| $2,499 or less | 0 (0.0%) | 0 (0.0%) |
| $2,500 to $4,999 | 0 (0.0%) | 0 (0.0%) |
| $5,000 to $7,499 | 0 (0.0%) | 0 (0.0%) |
| $7,500 to $9,999 | 0 (0.0%) | 6 (31.6%) |
| $10,000 to $12,499 | 0 (0.0%) | 0 (0.0%) |
| $12,500 to $14,999 | 0 (0.0%) | 0 (0.0%) |
| $15,000 to $17,499 | 0 (0.0%) | 0 (0.0%) |
| $17,500 to $19,999 | 0 (0.0%) | 0 (0.0%) |
| $20,000 to $22,499 | 0 (0.0%) | 0 (0.0%) |
| $22,500 to $24,999 | 4 (11.4%) | 0 (0.0%) |
| $25,000 to $29,999 | 3 (8.6%) | 3 (15.8%) |
| $30,000 to $34,999 | 0 (0.0%) | 0 (0.0%) |
| $35,000 to $39,999 | 0 (0.0%) | 3 (15.8%) |
| $40,000 to $44,999 | 12 (34.3%) | 0 (0.0%) |
| $45,000 to $49,999 | 3 (8.6%) | 0 (0.0%) |
| $50,000 to $54,999 | 0 (0.0%) | 0 (0.0%) |
| $55,000 to $64,999 | 6 (17.1%) | 0 (0.0%) |
| $65,000 to $74,999 | 0 (0.0%) | 7 (36.8%) |
| $75,000 to $99,999 | 0 (0.0%) | 0 (0.0%) |
| $100,000+ | 7 (20.0%) | 0 (0.0%) |
| Total | 35 (100.0%) | 19 (100.0%) |
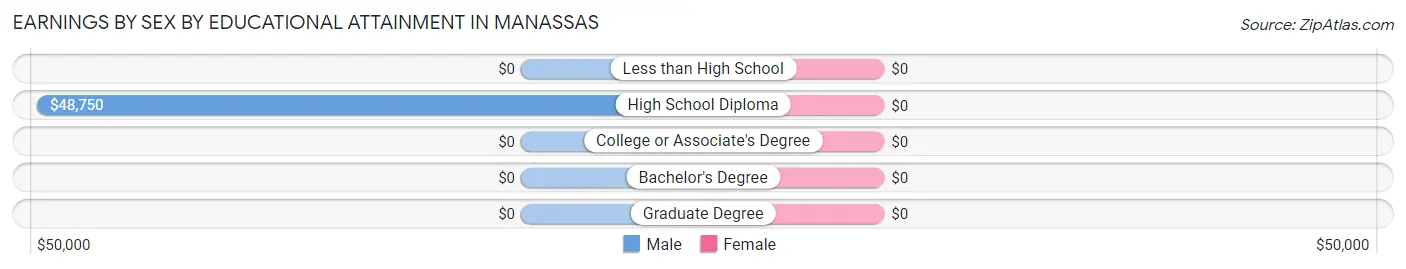
Earnings by Sex by Educational Attainment in Manassas
| Educational Attainment | Male Income | Female Income |
| Less than High School | - | - |
| High School Diploma | $48,750 | $0 |
| College or Associate's Degree | - | - |
| Bachelor's Degree | - | - |
| Graduate Degree | - | - |
| Total | $44,583 | $0 |
Family Income in Manassas
Family Income Brackets in Manassas
According to the Manassas family income data, there are 9 families falling into the $50,000 to $74,999 income range, which is the most common income bracket and makes up 37.5% of all families.
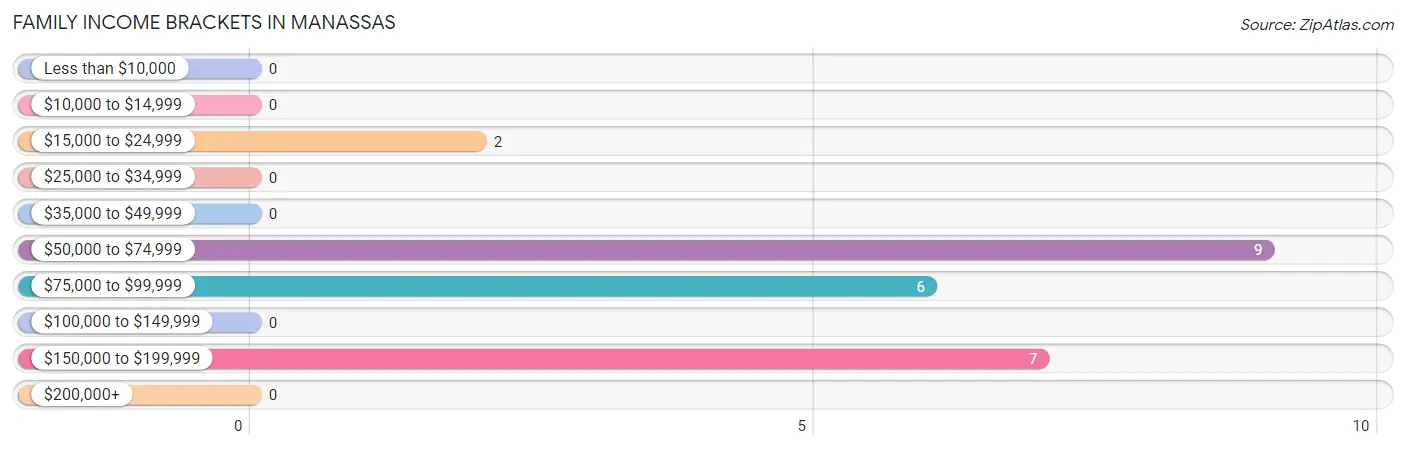
| Income Bracket | # Families | % Families |
| Less than $10,000 | 0 | 0.0% |
| $10,000 to $14,999 | 0 | 0.0% |
| $15,000 to $24,999 | 2 | 8.3% |
| $25,000 to $34,999 | 0 | 0.0% |
| $35,000 to $49,999 | 0 | 0.0% |
| $50,000 to $74,999 | 9 | 37.5% |
| $75,000 to $99,999 | 6 | 25.0% |
| $100,000 to $149,999 | 0 | 0.0% |
| $150,000 to $199,999 | 7 | 29.2% |
| $200,000+ | 0 | 0.0% |
Family Income by Famaliy Size in Manassas
| Income Bracket | # Families | Median Income |
| 2-Person Families | 16 (66.7%) | $0 |
| 3-Person Families | 5 (20.8%) | $0 |
| 4-Person Families | 0 (0.0%) | $0 |
| 5-Person Families | 0 (0.0%) | $0 |
| 6-Person Families | 3 (12.5%) | $0 |
| 7+ Person Families | 0 (0.0%) | $0 |
| Total | 24 (100.0%) | $80,833 |
Family Income by Number of Earners in Manassas
| Number of Earners | # Families | Median Income |
| No Earners | 2 (8.3%) | $0 |
| 1 Earner | 9 (37.5%) | $0 |
| 2 Earners | 7 (29.2%) | $0 |
| 3+ Earners | 6 (25.0%) | $0 |
| Total | 24 (100.0%) | $80,833 |
Household Income in Manassas
Household Income Brackets in Manassas
With 15 households falling in the category, the $50,000 to $74,999 income range is the most frequent in Manassas, accounting for 46.9% of all households.
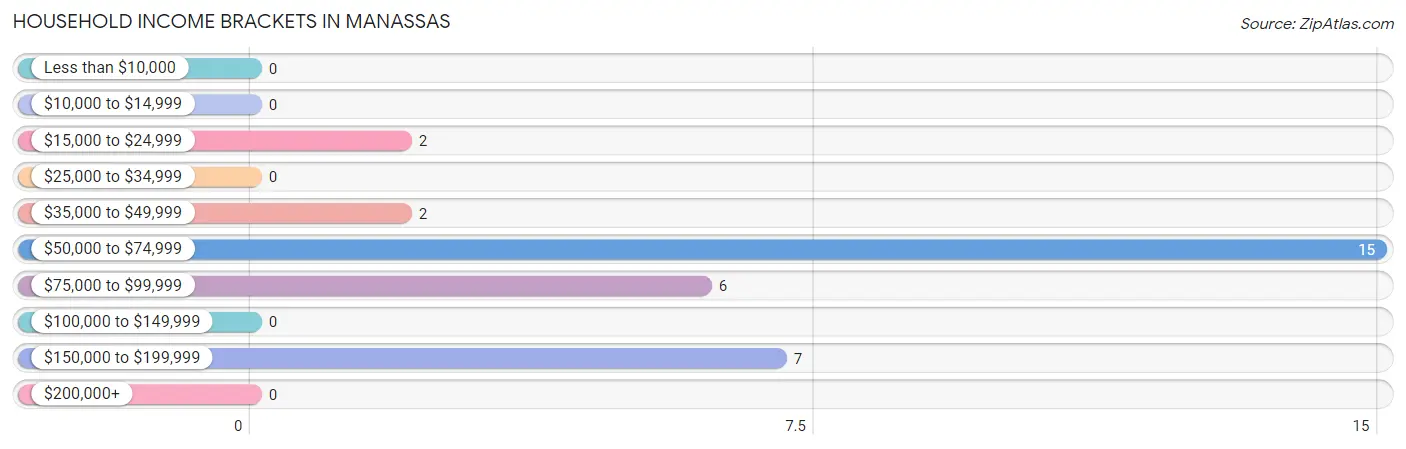
| Income Bracket | # Households | % Households |
| Less than $10,000 | 0 | 0.0% |
| $10,000 to $14,999 | 0 | 0.0% |
| $15,000 to $24,999 | 2 | 6.3% |
| $25,000 to $34,999 | 0 | 0.0% |
| $35,000 to $49,999 | 2 | 6.3% |
| $50,000 to $74,999 | 15 | 46.9% |
| $75,000 to $99,999 | 6 | 18.8% |
| $100,000 to $149,999 | 0 | 0.0% |
| $150,000 to $199,999 | 7 | 21.9% |
| $200,000+ | 0 | 0.0% |
Household Income by Householder Age in Manassas
The median household income in Manassas is $74,167, with the highest median household income of $167,857 found in the 25 to 44 years age bracket for the primary householder. A total of 12 households (37.5%) fall into this category.
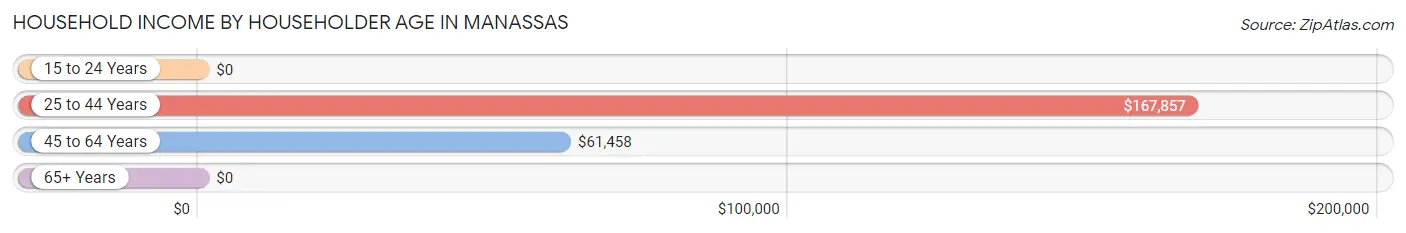
| Income Bracket | # Households | Median Income |
| 15 to 24 Years | 0 (0.0%) | $0 |
| 25 to 44 Years | 12 (37.5%) | $167,857 |
| 45 to 64 Years | 11 (34.4%) | $61,458 |
| 65+ Years | 9 (28.1%) | $0 |
| Total | 32 (100.0%) | $74,167 |
Poverty in Manassas
Income Below Poverty by Sex and Age in Manassas
With 6.4% poverty level for males and 5.7% for females among the residents of Manassas, 25 to 34 year old males and 65 to 74 year old females are the most vulnerable to poverty, with 3 males (100.0%) and 2 females (20.0%) in their respective age groups living below the poverty level.
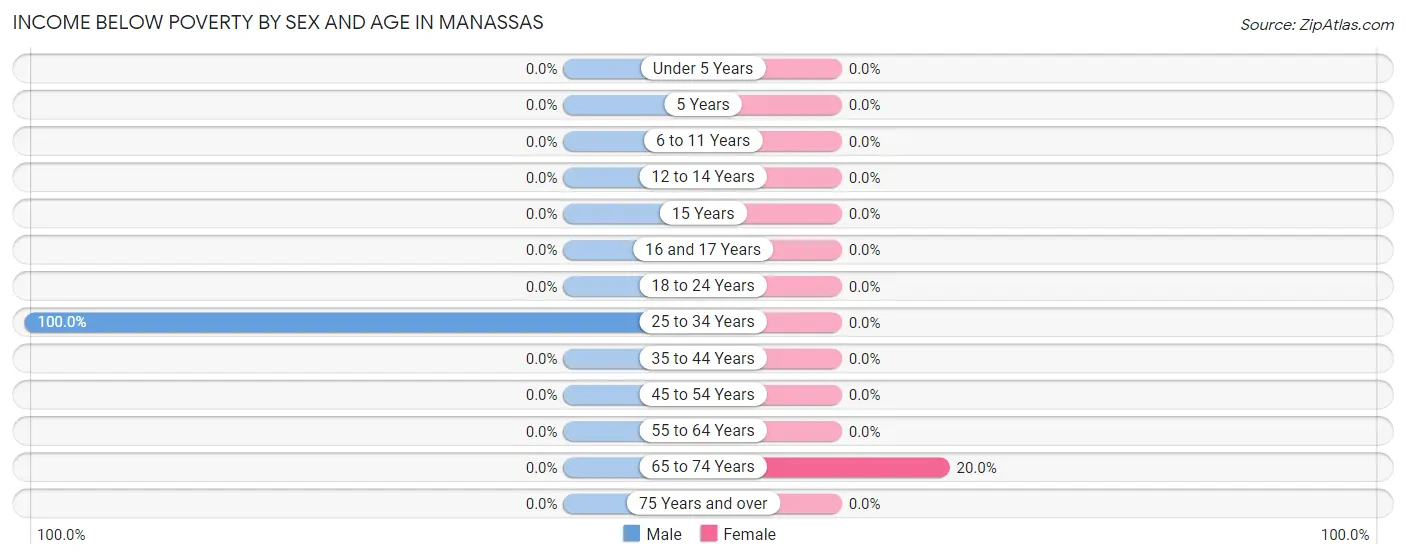
| Age Bracket | Male | Female |
| Under 5 Years | 0 (0.0%) | 0 (0.0%) |
| 5 Years | 0 (0.0%) | 0 (0.0%) |
| 6 to 11 Years | 0 (0.0%) | 0 (0.0%) |
| 12 to 14 Years | 0 (0.0%) | 0 (0.0%) |
| 15 Years | 0 (0.0%) | 0 (0.0%) |
| 16 and 17 Years | 0 (0.0%) | 0 (0.0%) |
| 18 to 24 Years | 0 (0.0%) | 0 (0.0%) |
| 25 to 34 Years | 3 (100.0%) | 0 (0.0%) |
| 35 to 44 Years | 0 (0.0%) | 0 (0.0%) |
| 45 to 54 Years | 0 (0.0%) | 0 (0.0%) |
| 55 to 64 Years | 0 (0.0%) | 0 (0.0%) |
| 65 to 74 Years | 0 (0.0%) | 2 (20.0%) |
| 75 Years and over | 0 (0.0%) | 0 (0.0%) |
| Total | 3 (6.4%) | 2 (5.7%) |
Income Above Poverty by Sex and Age in Manassas
According to the poverty statistics in Manassas, males aged 12 to 14 years and females aged 6 to 11 years are the age groups that are most secure financially, with 100.0% of males and 100.0% of females in these age groups living above the poverty line.
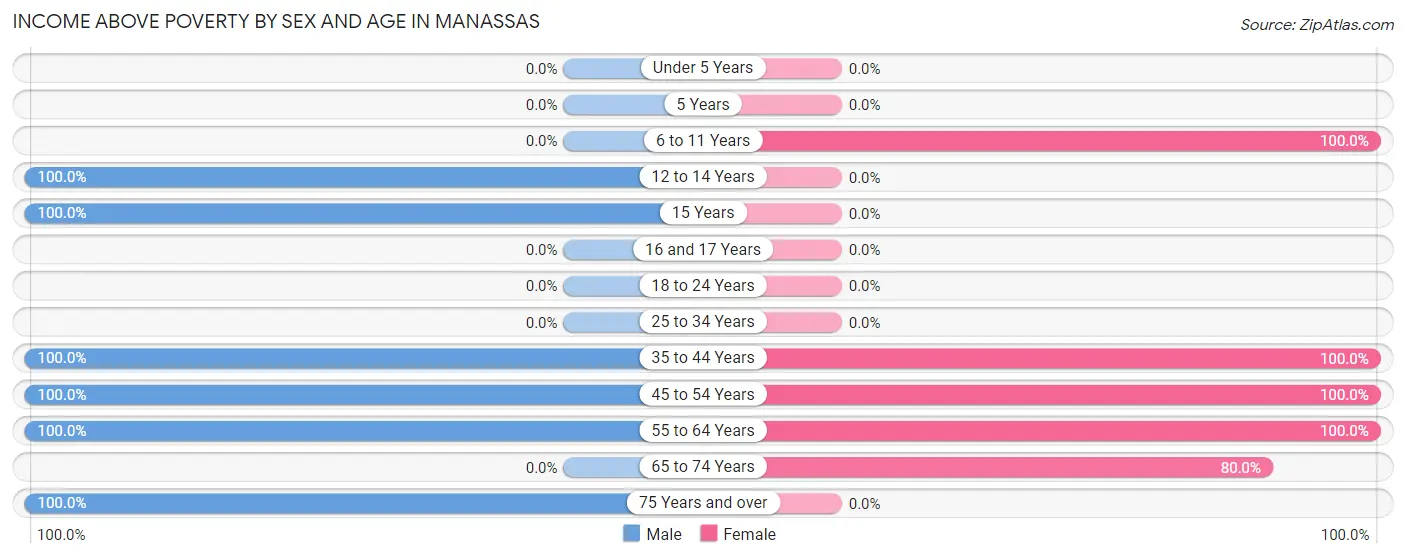
| Age Bracket | Male | Female |
| Under 5 Years | 0 (0.0%) | 0 (0.0%) |
| 5 Years | 0 (0.0%) | 0 (0.0%) |
| 6 to 11 Years | 0 (0.0%) | 2 (100.0%) |
| 12 to 14 Years | 3 (100.0%) | 0 (0.0%) |
| 15 Years | 4 (100.0%) | 0 (0.0%) |
| 16 and 17 Years | 0 (0.0%) | 0 (0.0%) |
| 18 to 24 Years | 0 (0.0%) | 0 (0.0%) |
| 25 to 34 Years | 0 (0.0%) | 0 (0.0%) |
| 35 to 44 Years | 9 (100.0%) | 13 (100.0%) |
| 45 to 54 Years | 7 (100.0%) | 6 (100.0%) |
| 55 to 64 Years | 14 (100.0%) | 4 (100.0%) |
| 65 to 74 Years | 0 (0.0%) | 8 (80.0%) |
| 75 Years and over | 7 (100.0%) | 0 (0.0%) |
| Total | 44 (93.6%) | 33 (94.3%) |
Income Below Poverty Among Married-Couple Families in Manassas
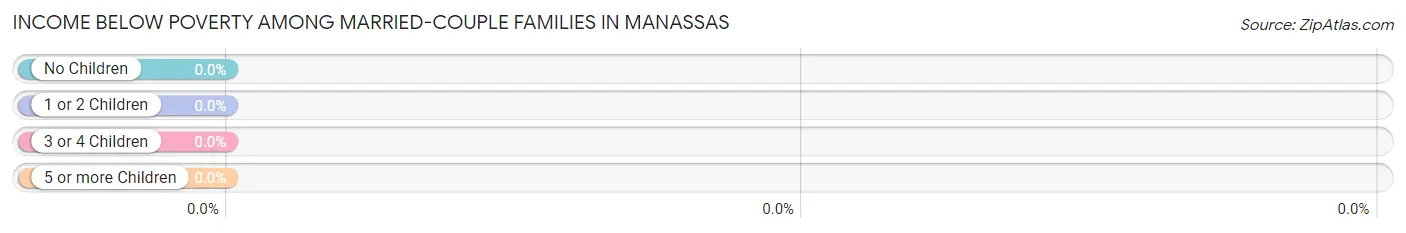
| Children | Above Poverty | Below Poverty |
| No Children | 17 (100.0%) | 0 (0.0%) |
| 1 or 2 Children | 5 (100.0%) | 0 (0.0%) |
| 3 or 4 Children | 0 (0.0%) | 0 (0.0%) |
| 5 or more Children | 0 (0.0%) | 0 (0.0%) |
| Total | 22 (100.0%) | 0 (0.0%) |
Income Below Poverty Among Single-Parent Households in Manassas
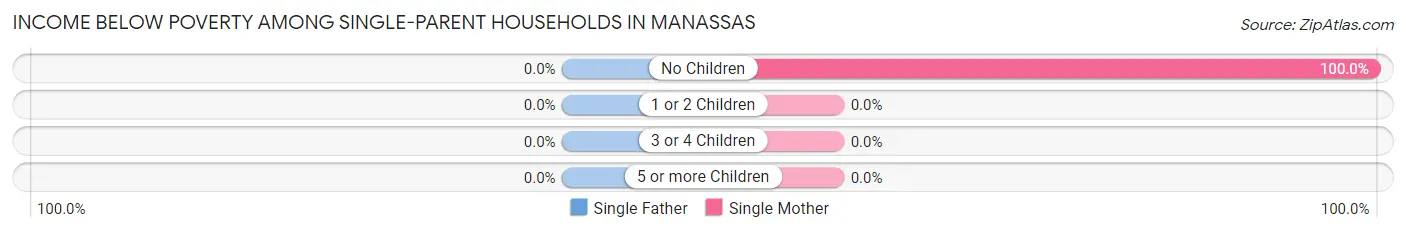
| Children | Single Father | Single Mother |
| No Children | 0 (0.0%) | 2 (100.0%) |
| 1 or 2 Children | 0 (0.0%) | 0 (0.0%) |
| 3 or 4 Children | 0 (0.0%) | 0 (0.0%) |
| 5 or more Children | 0 (0.0%) | 0 (0.0%) |
| Total | 0 (0.0%) | 2 (100.0%) |
Income Below Poverty Among Married-Couple vs Single-Parent Households in Manassas
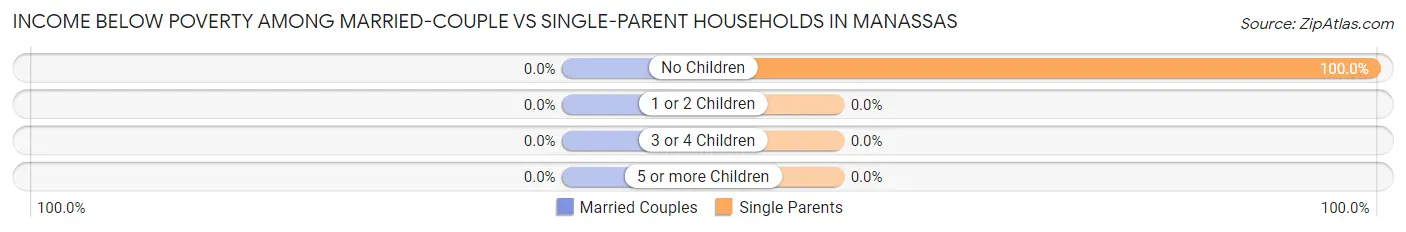
| Children | Married-Couple Families | Single-Parent Households |
| No Children | 0 (0.0%) | 2 (100.0%) |
| 1 or 2 Children | 0 (0.0%) | 0 (0.0%) |
| 3 or 4 Children | 0 (0.0%) | 0 (0.0%) |
| 5 or more Children | 0 (0.0%) | 0 (0.0%) |
| Total | 0 (0.0%) | 2 (100.0%) |
Race in Manassas
The most populous races in Manassas are White / Caucasian (51 | 62.2%), and Black / African American (31 | 37.8%).
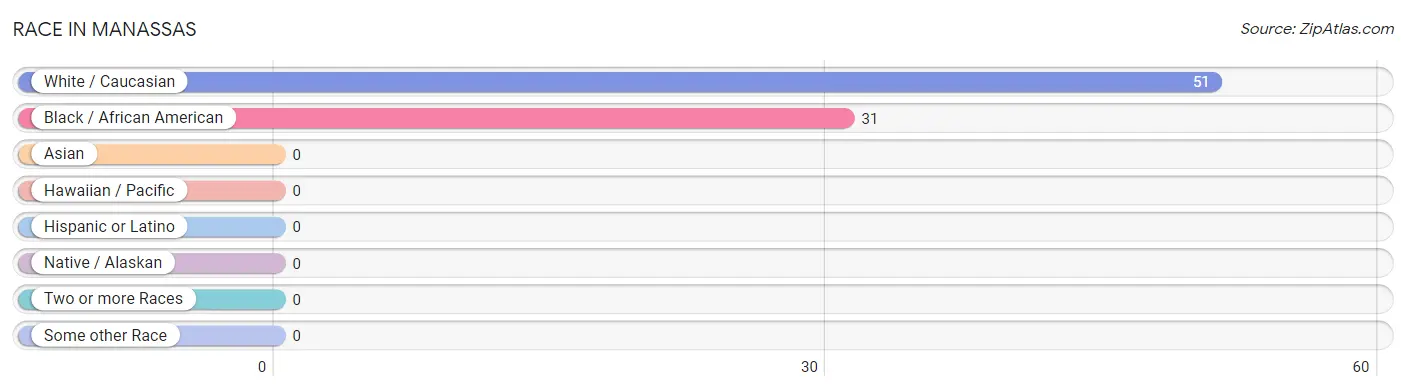
| Race | # Population | % Population |
| Asian | 0 | 0.0% |
| Black / African American | 31 | 37.8% |
| Hawaiian / Pacific | 0 | 0.0% |
| Hispanic or Latino | 0 | 0.0% |
| Native / Alaskan | 0 | 0.0% |
| White / Caucasian | 51 | 62.2% |
| Two or more Races | 0 | 0.0% |
| Some other Race | 0 | 0.0% |
| Total | 82 | 100.0% |
Ancestry in Manassas
The most populous ancestries reported in Manassas are English (24 | 29.3%), American (18 | 22.0%), Scottish (4 | 4.9%), German (3 | 3.7%), and Irish (3 | 3.7%), together accounting for 63.4% of all Manassas residents.
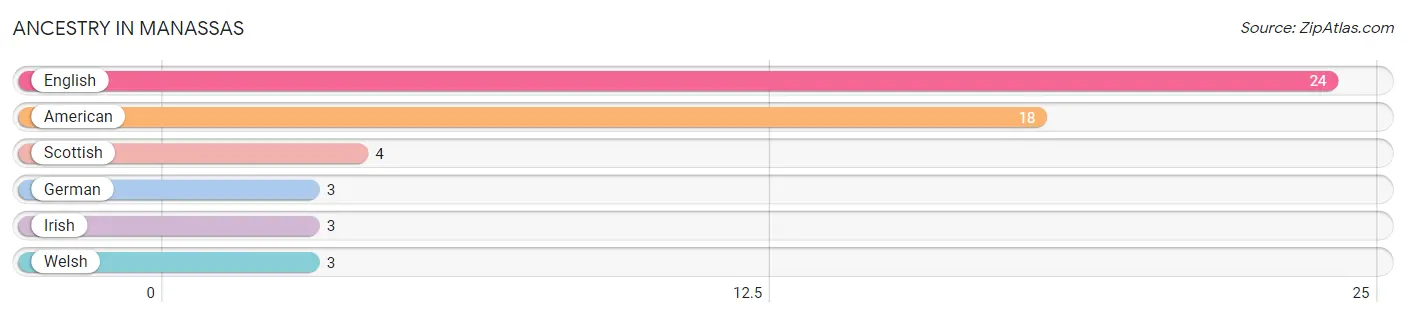
| Ancestry | # Population | % Population |
| American | 18 | 22.0% |
| English | 24 | 29.3% |
| German | 3 | 3.7% |
| Irish | 3 | 3.7% |
| Scottish | 4 | 4.9% |
| Welsh | 3 | 3.7% | View All 6 Rows |
Immigrants in Manassas
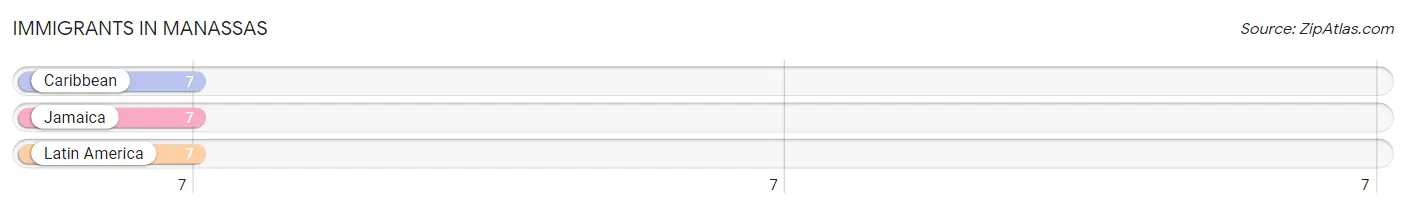
The most numerous immigrant groups reported in Manassas came from Caribbean (7 | 8.5%), Jamaica (7 | 8.5%), and Latin America (7 | 8.5%), together accounting for 25.6% of all Manassas residents.
| Immigration Origin | # Population | % Population |
| Caribbean | 7 | 8.5% |
| Jamaica | 7 | 8.5% |
| Latin America | 7 | 8.5% | View All 3 Rows |
Sex and Age in Manassas
Sex and Age in Manassas
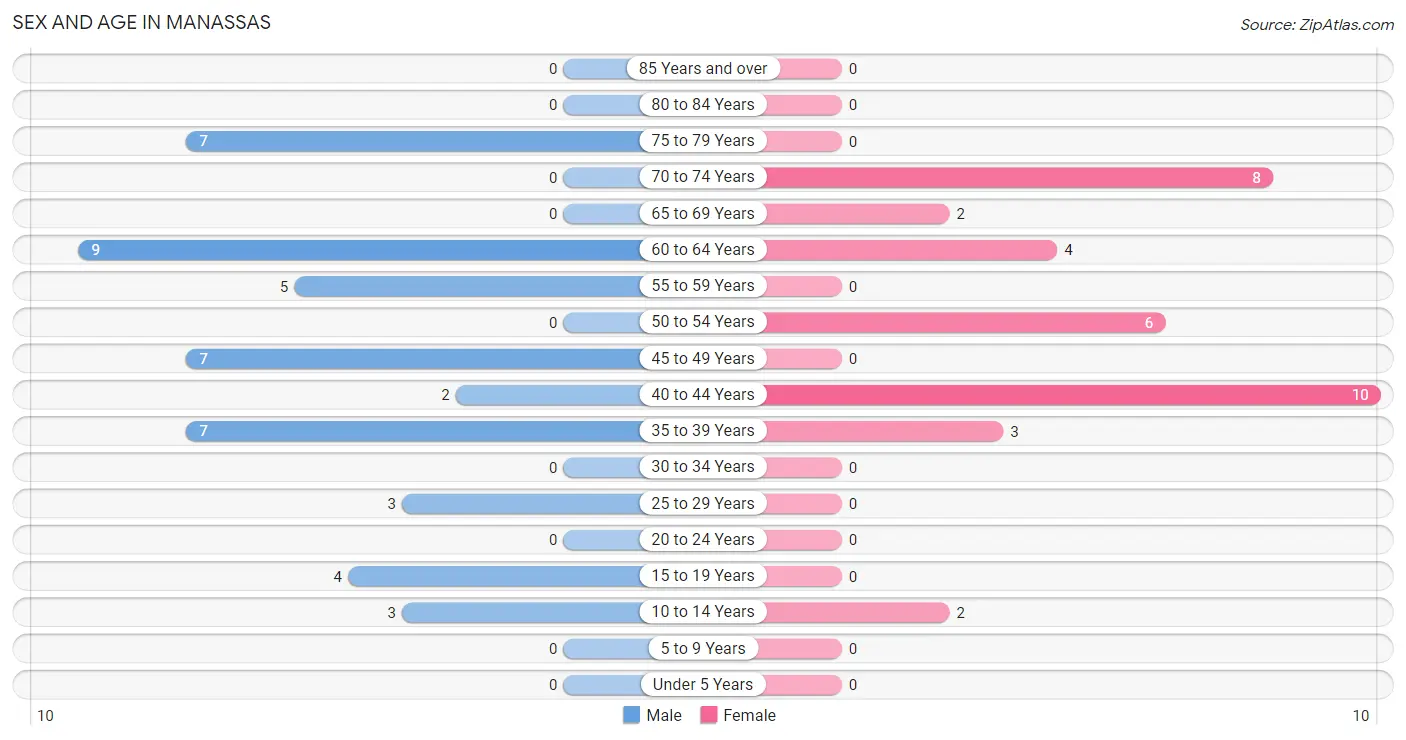
The most populous age groups in Manassas are 60 to 64 Years (9 | 19.2%) for men and 40 to 44 Years (10 | 28.6%) for women.
| Age Bracket | Male | Female |
| Under 5 Years | 0 (0.0%) | 0 (0.0%) |
| 5 to 9 Years | 0 (0.0%) | 0 (0.0%) |
| 10 to 14 Years | 3 (6.4%) | 2 (5.7%) |
| 15 to 19 Years | 4 (8.5%) | 0 (0.0%) |
| 20 to 24 Years | 0 (0.0%) | 0 (0.0%) |
| 25 to 29 Years | 3 (6.4%) | 0 (0.0%) |
| 30 to 34 Years | 0 (0.0%) | 0 (0.0%) |
| 35 to 39 Years | 7 (14.9%) | 3 (8.6%) |
| 40 to 44 Years | 2 (4.3%) | 10 (28.6%) |
| 45 to 49 Years | 7 (14.9%) | 0 (0.0%) |
| 50 to 54 Years | 0 (0.0%) | 6 (17.1%) |
| 55 to 59 Years | 5 (10.6%) | 0 (0.0%) |
| 60 to 64 Years | 9 (19.2%) | 4 (11.4%) |
| 65 to 69 Years | 0 (0.0%) | 2 (5.7%) |
| 70 to 74 Years | 0 (0.0%) | 8 (22.9%) |
| 75 to 79 Years | 7 (14.9%) | 0 (0.0%) |
| 80 to 84 Years | 0 (0.0%) | 0 (0.0%) |
| 85 Years and over | 0 (0.0%) | 0 (0.0%) |
| Total | 47 (100.0%) | 35 (100.0%) |
Families and Households in Manassas
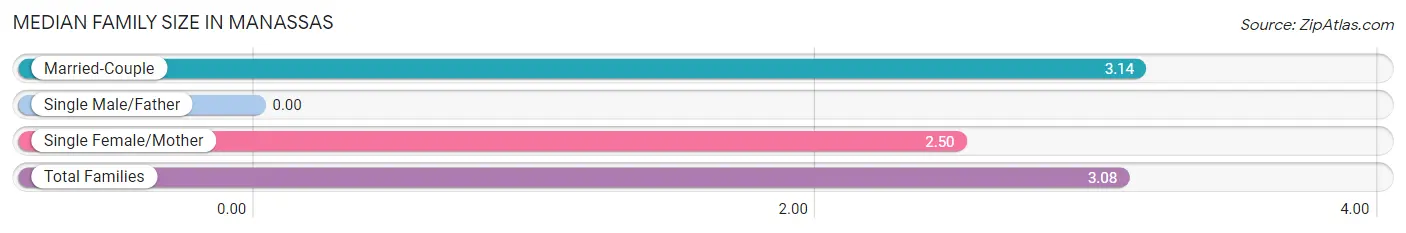
Median Family Size in Manassas
| Family Type | # Families | Family Size |
| Married-Couple | 22 (91.7%) | 3.14 |
| Single Male/Father | 0 (0.0%) | - |
| Single Female/Mother | 2 (8.3%) | 2.50 |
| Total Families | 24 (100.0%) | 3.08 |
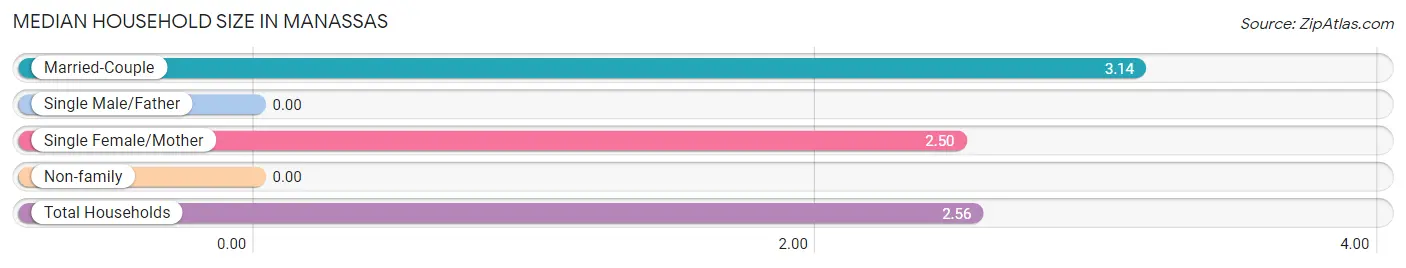
Median Household Size in Manassas
| Household Type | # Households | Household Size |
| Married-Couple | 22 (68.8%) | 3.14 |
| Single Male/Father | 0 (0.0%) | - |
| Single Female/Mother | 2 (6.2%) | 2.50 |
| Non-family | 8 (25.0%) | - |
| Total Households | 32 (100.0%) | 2.56 |
Household Size by Marriage Status in Manassas
Out of a total of 32 households in Manassas, 24 (75.0%) are family households, while 8 (25.0%) are nonfamily households. The most numerous type of family households are 2-person households, comprising 16, and the most common type of nonfamily households are 1-person households, comprising 8.
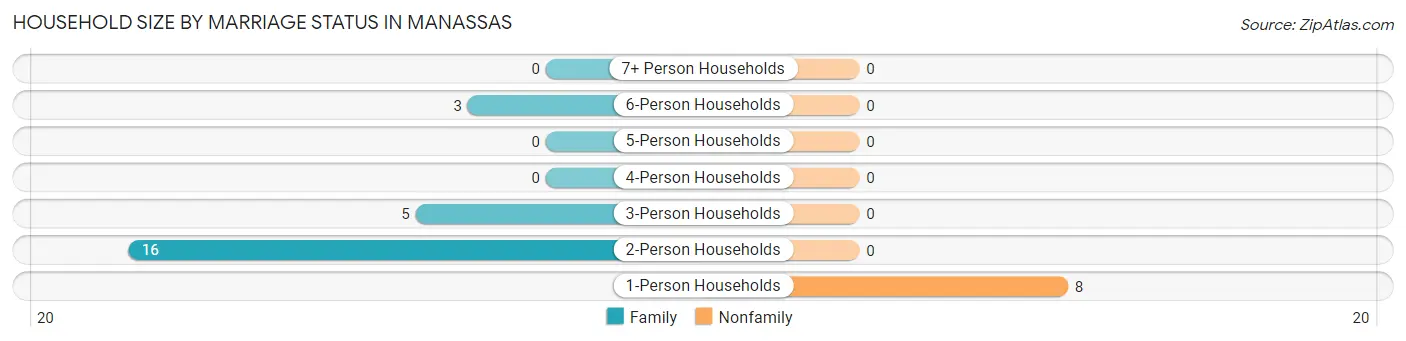
| Household Size | Family Households | Nonfamily Households |
| 1-Person Households | - | 8 (25.0%) |
| 2-Person Households | 16 (50.0%) | 0 (0.0%) |
| 3-Person Households | 5 (15.6%) | 0 (0.0%) |
| 4-Person Households | 0 (0.0%) | 0 (0.0%) |
| 5-Person Households | 0 (0.0%) | 0 (0.0%) |
| 6-Person Households | 3 (9.4%) | 0 (0.0%) |
| 7+ Person Households | 0 (0.0%) | 0 (0.0%) |
| Total | 24 (75.0%) | 8 (25.0%) |
Female Fertility in Manassas
Fertility by Age in Manassas
| Age Bracket | Women with Births | Births / 1,000 Women |
| 15 to 19 years | 0 (0.0%) | 0.0 |
| 20 to 34 years | 0 (0.0%) | 0.0 |
| 35 to 50 years | 0 (0.0%) | 0.0 |
| Total | 0 (0.0%) | 0.0 |
Fertility by Age by Marriage Status in Manassas
| Age Bracket | Married | Unmarried |
| 15 to 19 years | 0 (0.0%) | 0 (0.0%) |
| 20 to 34 years | 0 (0.0%) | 0 (0.0%) |
| 35 to 50 years | 0 (0.0%) | 0 (0.0%) |
| Total | 0 (0.0%) | 0 (0.0%) |
Fertility by Education in Manassas
| Educational Attainment | Women with Births | Births / 1,000 Women |
| Less than High School | 0 (0.0%) | 0.0 |
| High School Diploma | 0 (0.0%) | 0.0 |
| College or Associate's Degree | 0 (0.0%) | 0.0 |
| Bachelor's Degree | 0 (0.0%) | 0.0 |
| Graduate Degree | 0 (0.0%) | 0.0 |
| Total | 0 (0.0%) | 0.0 |
Fertility by Education by Marriage Status in Manassas
| Educational Attainment | Married | Unmarried |
| Less than High School | 0 (0.0%) | 0 (0.0%) |
| High School Diploma | 0 (0.0%) | 0 (0.0%) |
| College or Associate's Degree | 0 (0.0%) | 0 (0.0%) |
| Bachelor's Degree | 0 (0.0%) | 0 (0.0%) |
| Graduate Degree | 0 (0.0%) | 0 (0.0%) |
| Total | 0 (0.0%) | 0 (0.0%) |
Employment Characteristics in Manassas
Employment by Class of Employer in Manassas
Among the 46 employed individuals in Manassas, private company employees (30 | 65.2%), not-for-profit organizations (7 | 15.2%), and self-employed (not incorporated) (6 | 13.0%) make up the most common classes of employment.
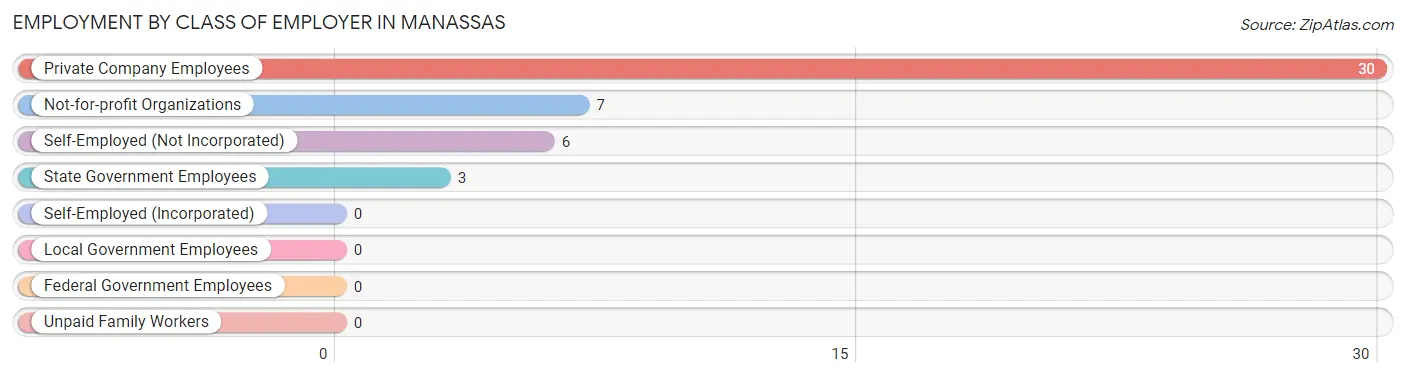
| Employer Class | # Employees | % Employees |
| Private Company Employees | 30 | 65.2% |
| Self-Employed (Incorporated) | 0 | 0.0% |
| Self-Employed (Not Incorporated) | 6 | 13.0% |
| Not-for-profit Organizations | 7 | 15.2% |
| Local Government Employees | 0 | 0.0% |
| State Government Employees | 3 | 6.5% |
| Federal Government Employees | 0 | 0.0% |
| Unpaid Family Workers | 0 | 0.0% |
| Total | 46 | 100.0% |
Employment Status by Age in Manassas
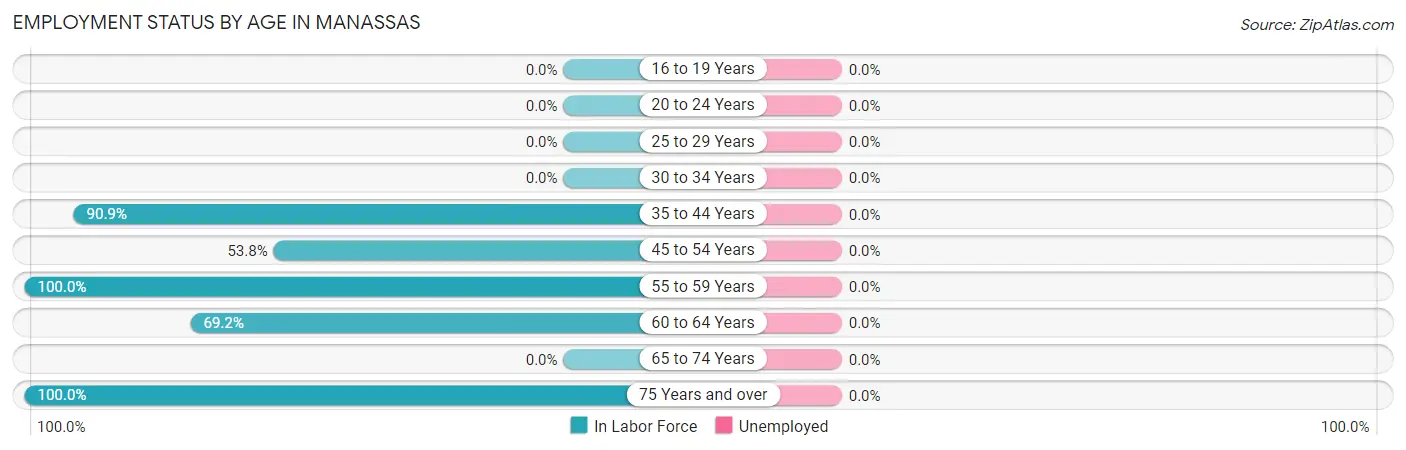
| Age Bracket | In Labor Force | Unemployed |
| 16 to 19 Years | 0 (0.0%) | 0 (0.0%) |
| 20 to 24 Years | 0 (0.0%) | 0 (0.0%) |
| 25 to 29 Years | 0 (0.0%) | 0 (0.0%) |
| 30 to 34 Years | 0 (0.0%) | 0 (0.0%) |
| 35 to 44 Years | 20 (90.9%) | 0 (0.0%) |
| 45 to 54 Years | 7 (53.8%) | 0 (0.0%) |
| 55 to 59 Years | 5 (100.0%) | 0 (0.0%) |
| 60 to 64 Years | 9 (69.2%) | 0 (0.0%) |
| 65 to 74 Years | 0 (0.0%) | 0 (0.0%) |
| 75 Years and over | 7 (100.0%) | 0 (0.0%) |
| Total | 48 (65.8%) | 0 (0.0%) |
Employment Status by Educational Attainment in Manassas
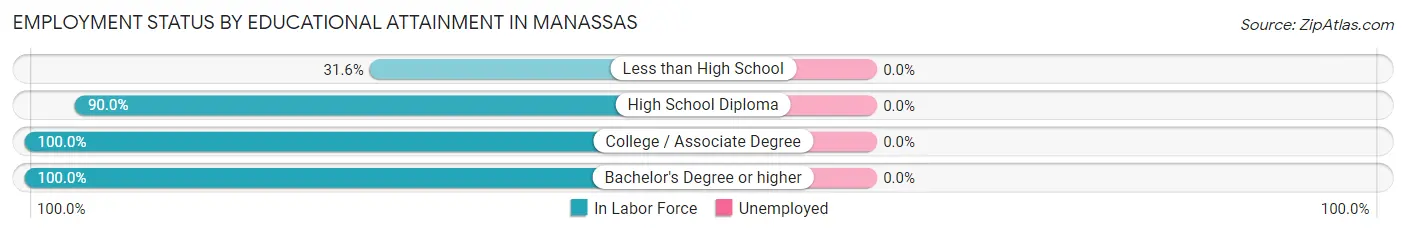
| Educational Attainment | In Labor Force | Unemployed |
| Less than High School | 6 (31.6%) | 0 (0.0%) |
| High School Diploma | 18 (90.0%) | 0 (0.0%) |
| College / Associate Degree | 7 (100.0%) | 0 (0.0%) |
| Bachelor's Degree or higher | 10 (100.0%) | 0 (0.0%) |
| Total | 41 (73.2%) | 0 (0.0%) |
Employment Occupations by Sex in Manassas
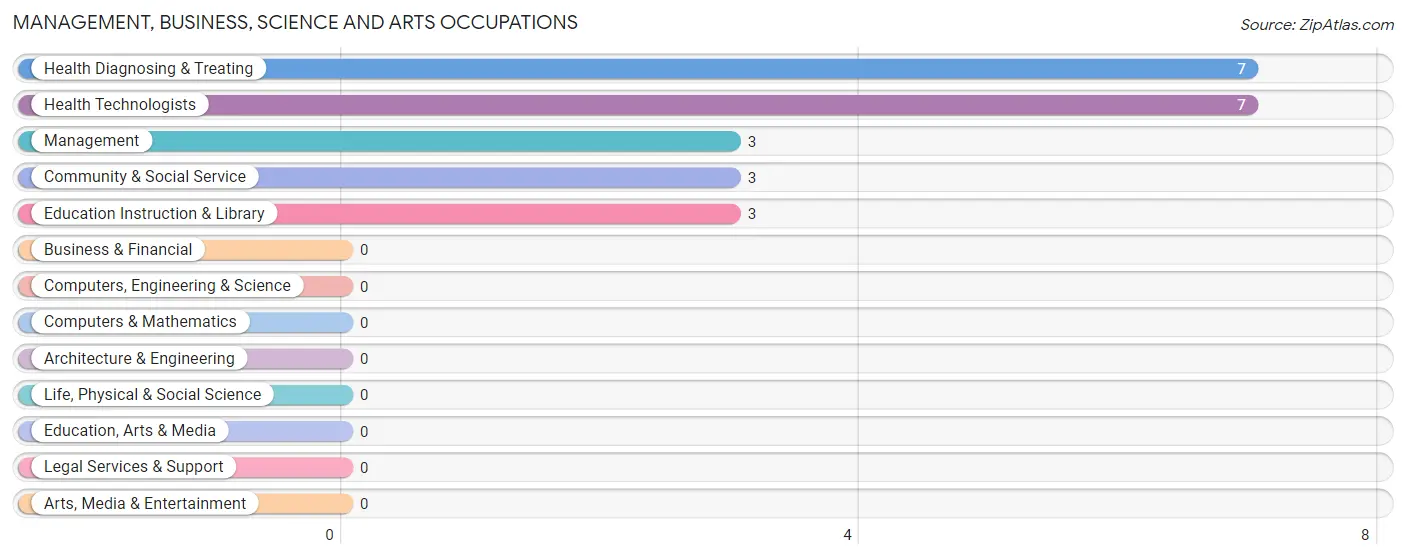
Management, Business, Science and Arts Occupations
The most common Management, Business, Science and Arts occupations in Manassas are Health Diagnosing & Treating (7 | 14.6%), Health Technologists (7 | 14.6%), Management (3 | 6.2%), Community & Social Service (3 | 6.2%), and Education Instruction & Library (3 | 6.2%).
Management, Business, Science and Arts Occupations by Sex
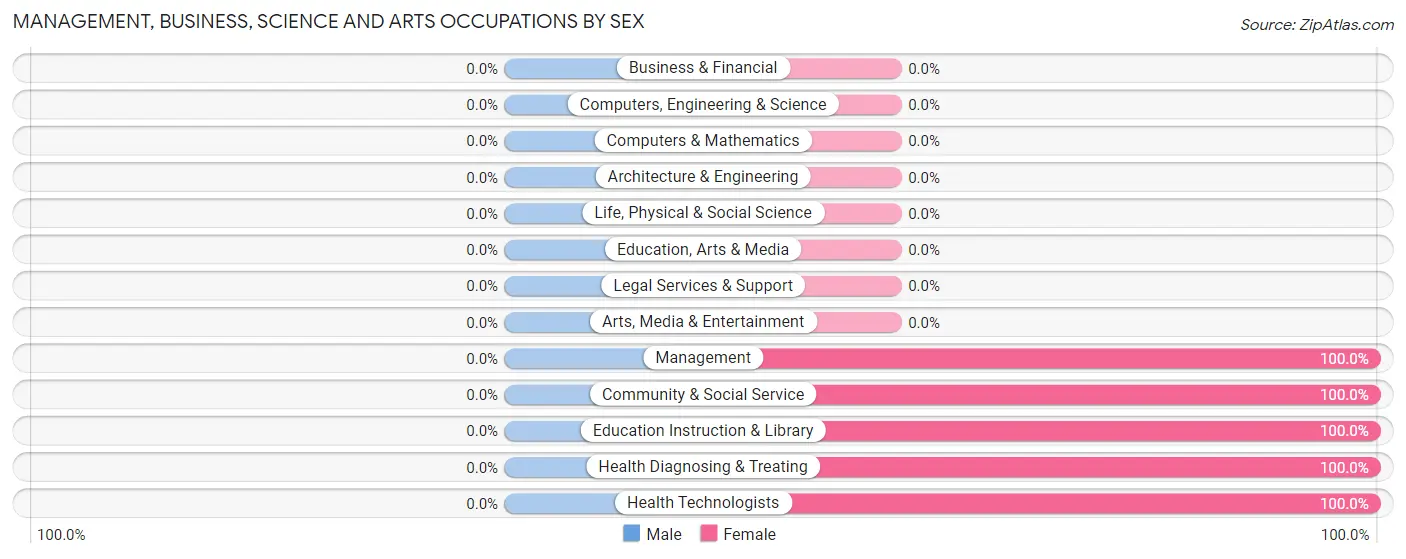
| Occupation | Male | Female |
| Management | 0 (0.0%) | 3 (100.0%) |
| Business & Financial | 0 (0.0%) | 0 (0.0%) |
| Computers, Engineering & Science | 0 (0.0%) | 0 (0.0%) |
| Computers & Mathematics | 0 (0.0%) | 0 (0.0%) |
| Architecture & Engineering | 0 (0.0%) | 0 (0.0%) |
| Life, Physical & Social Science | 0 (0.0%) | 0 (0.0%) |
| Community & Social Service | 0 (0.0%) | 3 (100.0%) |
| Education, Arts & Media | 0 (0.0%) | 0 (0.0%) |
| Legal Services & Support | 0 (0.0%) | 0 (0.0%) |
| Education Instruction & Library | 0 (0.0%) | 3 (100.0%) |
| Arts, Media & Entertainment | 0 (0.0%) | 0 (0.0%) |
| Health Diagnosing & Treating | 0 (0.0%) | 7 (100.0%) |
| Health Technologists | 0 (0.0%) | 7 (100.0%) |
| Total (Category) | 0 (0.0%) | 13 (100.0%) |
| Total (Overall) | 35 (72.9%) | 13 (27.1%) |
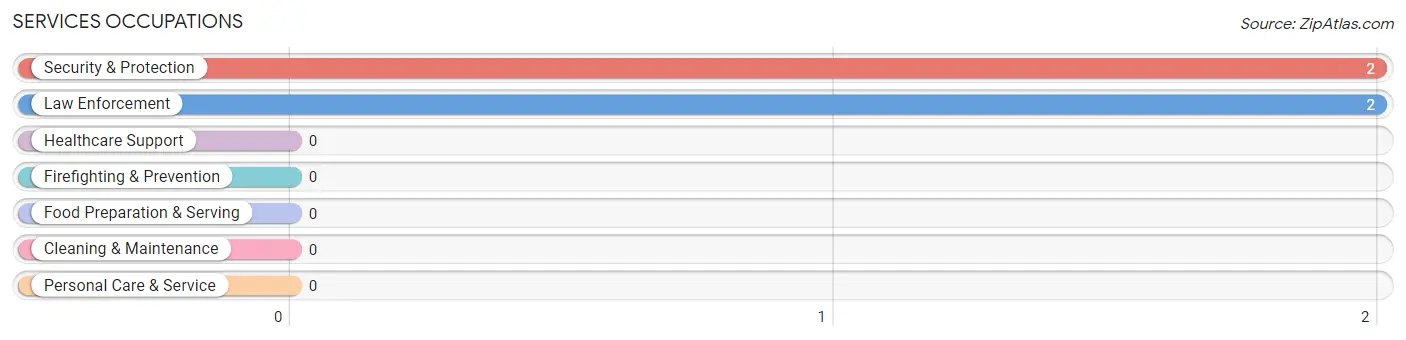
Services Occupations
The most common Services occupations in Manassas are Security & Protection (2 | 4.2%), and Law Enforcement (2 | 4.2%).
Services Occupations by Sex
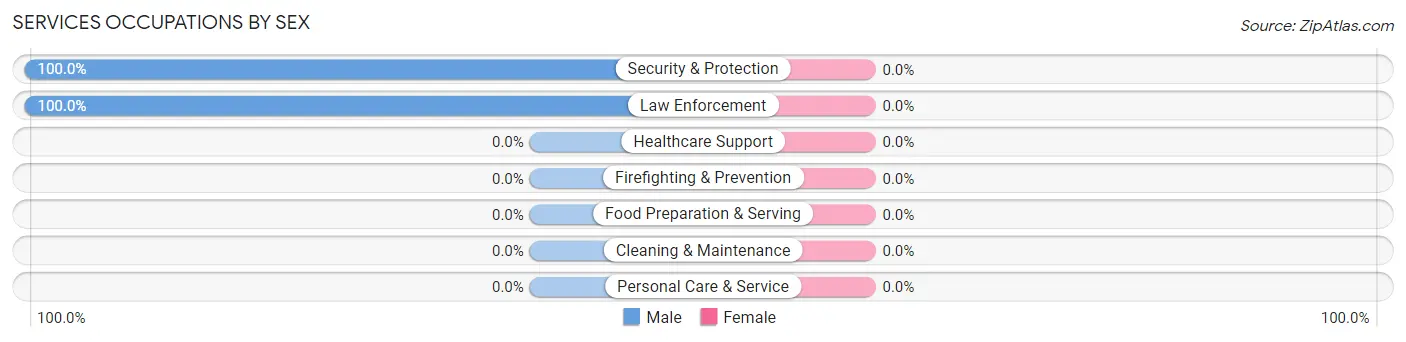
| Occupation | Male | Female |
| Healthcare Support | 0 (0.0%) | 0 (0.0%) |
| Security & Protection | 2 (100.0%) | 0 (0.0%) |
| Firefighting & Prevention | 0 (0.0%) | 0 (0.0%) |
| Law Enforcement | 2 (100.0%) | 0 (0.0%) |
| Food Preparation & Serving | 0 (0.0%) | 0 (0.0%) |
| Cleaning & Maintenance | 0 (0.0%) | 0 (0.0%) |
| Personal Care & Service | 0 (0.0%) | 0 (0.0%) |
| Total (Category) | 2 (100.0%) | 0 (0.0%) |
| Total (Overall) | 35 (72.9%) | 13 (27.1%) |
Sales and Office Occupations
Sales and Office Occupations by Sex
| Occupation | Male | Female |
| Sales & Related | 0 (0.0%) | 0 (0.0%) |
| Office & Administration | 0 (0.0%) | 0 (0.0%) |
| Total (Category) | 0 (0.0%) | 0 (0.0%) |
| Total (Overall) | 35 (72.9%) | 13 (27.1%) |
Natural Resources, Construction and Maintenance Occupations
The most common Natural Resources, Construction and Maintenance occupations in Manassas are , and Construction & Extraction (9 | 18.8%).
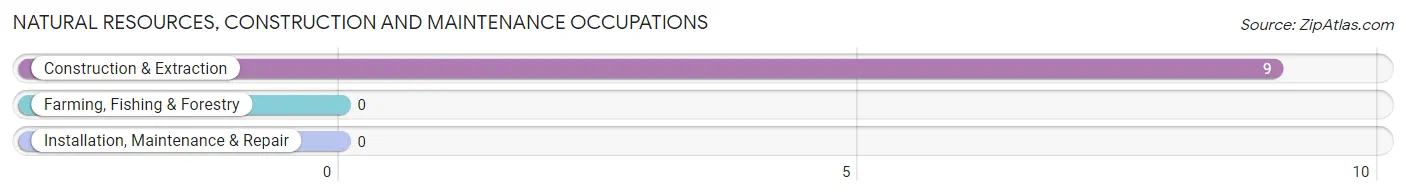
Natural Resources, Construction and Maintenance Occupations by Sex
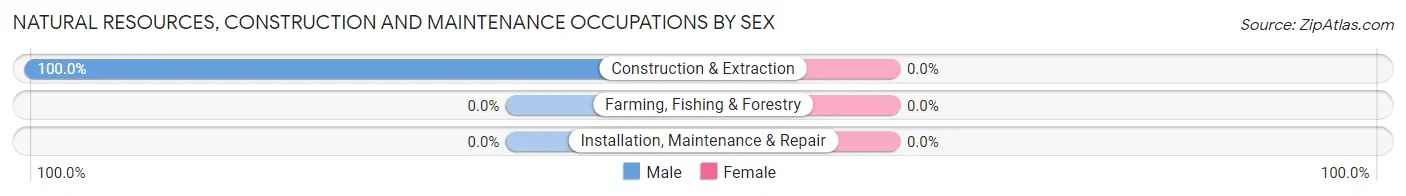
| Occupation | Male | Female |
| Farming, Fishing & Forestry | 0 (0.0%) | 0 (0.0%) |
| Construction & Extraction | 9 (100.0%) | 0 (0.0%) |
| Installation, Maintenance & Repair | 0 (0.0%) | 0 (0.0%) |
| Total (Category) | 9 (100.0%) | 0 (0.0%) |
| Total (Overall) | 35 (72.9%) | 13 (27.1%) |
Production, Transportation and Moving Occupations
The most common Production, Transportation and Moving occupations in Manassas are Transportation (10 | 20.8%), Production (7 | 14.6%), and Material Moving (7 | 14.6%).
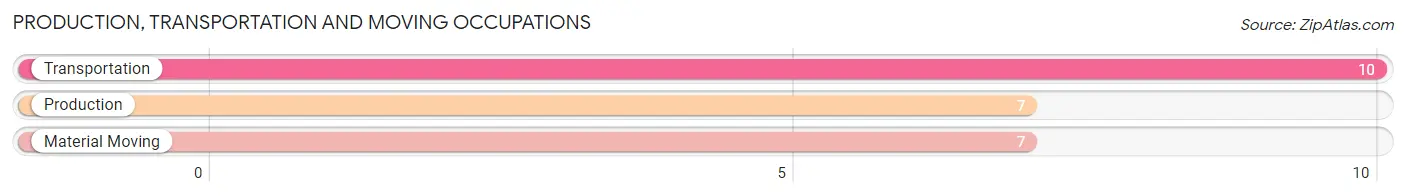
Production, Transportation and Moving Occupations by Sex
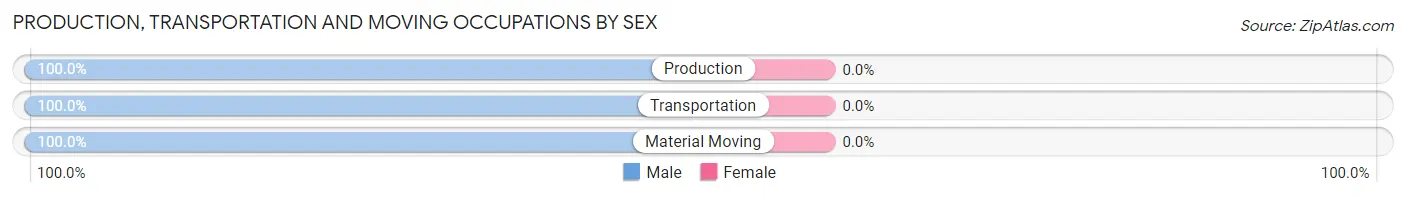
| Occupation | Male | Female |
| Production | 7 (100.0%) | 0 (0.0%) |
| Transportation | 10 (100.0%) | 0 (0.0%) |
| Material Moving | 7 (100.0%) | 0 (0.0%) |
| Total (Category) | 24 (100.0%) | 0 (0.0%) |
| Total (Overall) | 35 (72.9%) | 13 (27.1%) |
Employment Industries by Sex in Manassas
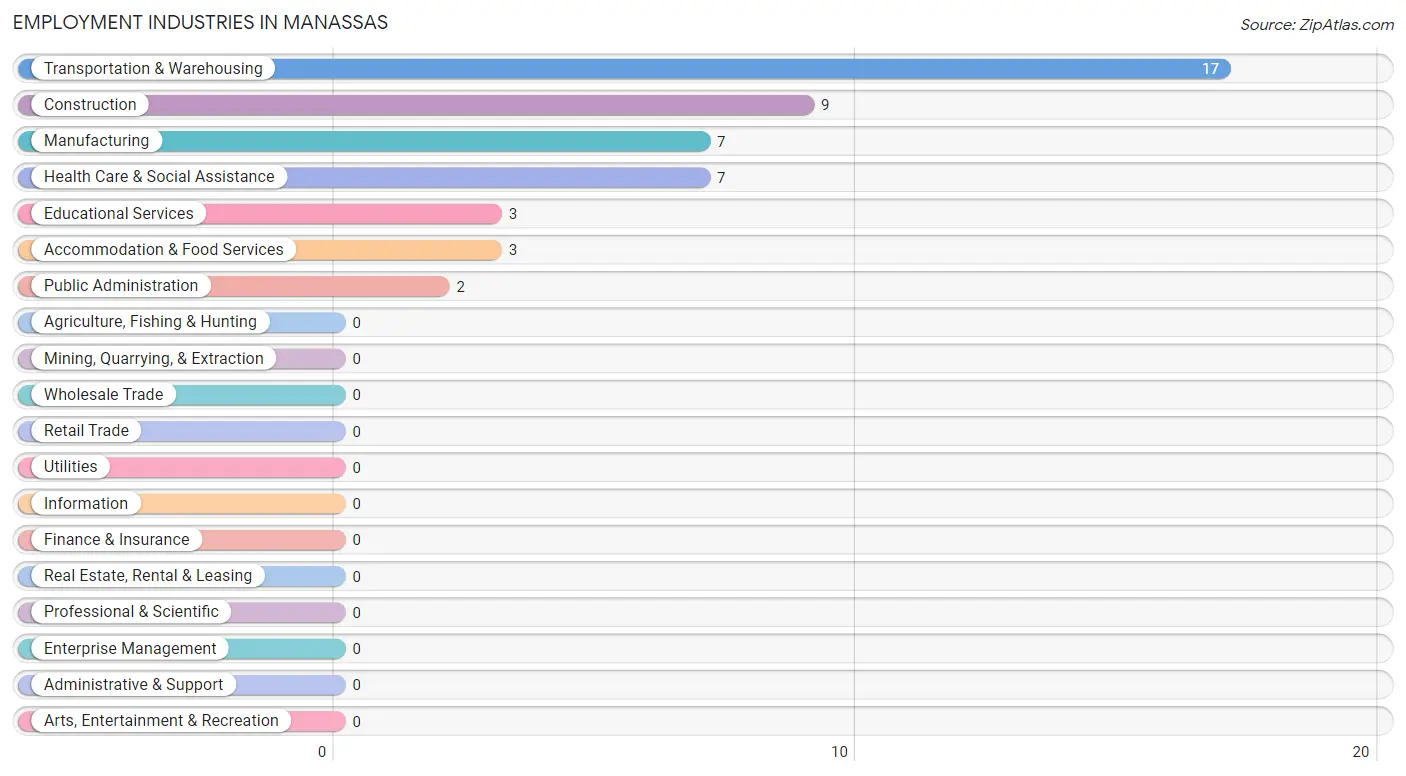
Employment Industries in Manassas
The major employment industries in Manassas include Transportation & Warehousing (17 | 35.4%), Construction (9 | 18.8%), Manufacturing (7 | 14.6%), Health Care & Social Assistance (7 | 14.6%), and Educational Services (3 | 6.2%).
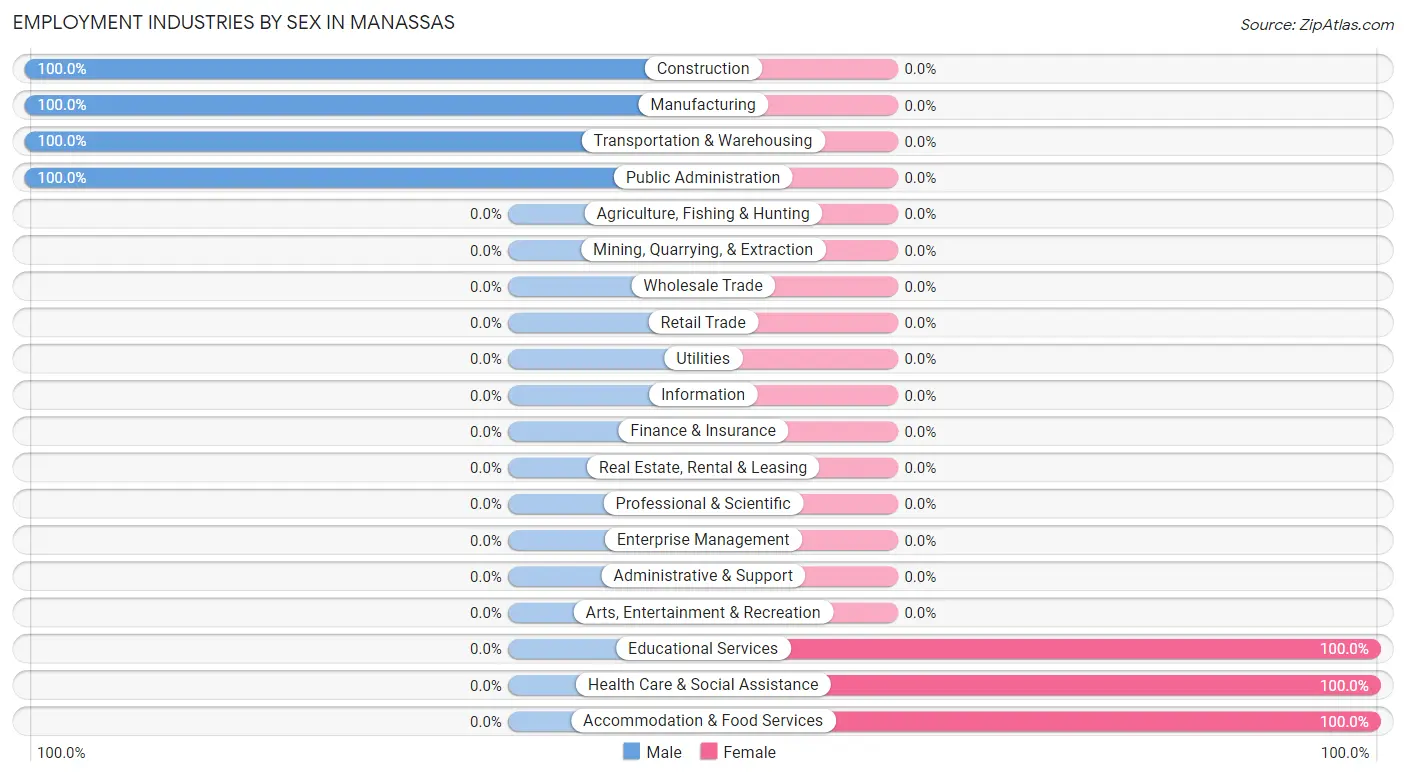
Employment Industries by Sex in Manassas
The Manassas industries that see more men than women are Construction (100.0%), Manufacturing (100.0%), and Transportation & Warehousing (100.0%), whereas the industries that tend to have a higher number of women are Educational Services (100.0%), Health Care & Social Assistance (100.0%), and Accommodation & Food Services (100.0%).
| Industry | Male | Female |
| Agriculture, Fishing & Hunting | 0 (0.0%) | 0 (0.0%) |
| Mining, Quarrying, & Extraction | 0 (0.0%) | 0 (0.0%) |
| Construction | 9 (100.0%) | 0 (0.0%) |
| Manufacturing | 7 (100.0%) | 0 (0.0%) |
| Wholesale Trade | 0 (0.0%) | 0 (0.0%) |
| Retail Trade | 0 (0.0%) | 0 (0.0%) |
| Transportation & Warehousing | 17 (100.0%) | 0 (0.0%) |
| Utilities | 0 (0.0%) | 0 (0.0%) |
| Information | 0 (0.0%) | 0 (0.0%) |
| Finance & Insurance | 0 (0.0%) | 0 (0.0%) |
| Real Estate, Rental & Leasing | 0 (0.0%) | 0 (0.0%) |
| Professional & Scientific | 0 (0.0%) | 0 (0.0%) |
| Enterprise Management | 0 (0.0%) | 0 (0.0%) |
| Administrative & Support | 0 (0.0%) | 0 (0.0%) |
| Educational Services | 0 (0.0%) | 3 (100.0%) |
| Health Care & Social Assistance | 0 (0.0%) | 7 (100.0%) |
| Arts, Entertainment & Recreation | 0 (0.0%) | 0 (0.0%) |
| Accommodation & Food Services | 0 (0.0%) | 3 (100.0%) |
| Public Administration | 2 (100.0%) | 0 (0.0%) |
| Total | 35 (72.9%) | 13 (27.1%) |
Education in Manassas
School Enrollment in Manassas
The most common levels of schooling among the 9 students in Manassas are middle school (5 | 55.6%), and high school (4 | 44.4%).
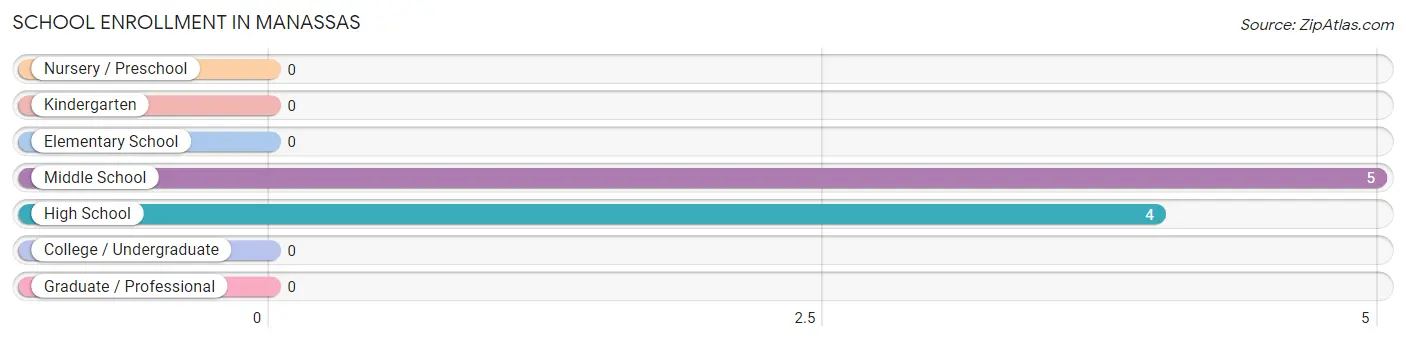
| School Level | # Students | % Students |
| Nursery / Preschool | 0 | 0.0% |
| Kindergarten | 0 | 0.0% |
| Elementary School | 0 | 0.0% |
| Middle School | 5 | 55.6% |
| High School | 4 | 44.4% |
| College / Undergraduate | 0 | 0.0% |
| Graduate / Professional | 0 | 0.0% |
| Total | 9 | 100.0% |
School Enrollment by Age by Funding Source in Manassas
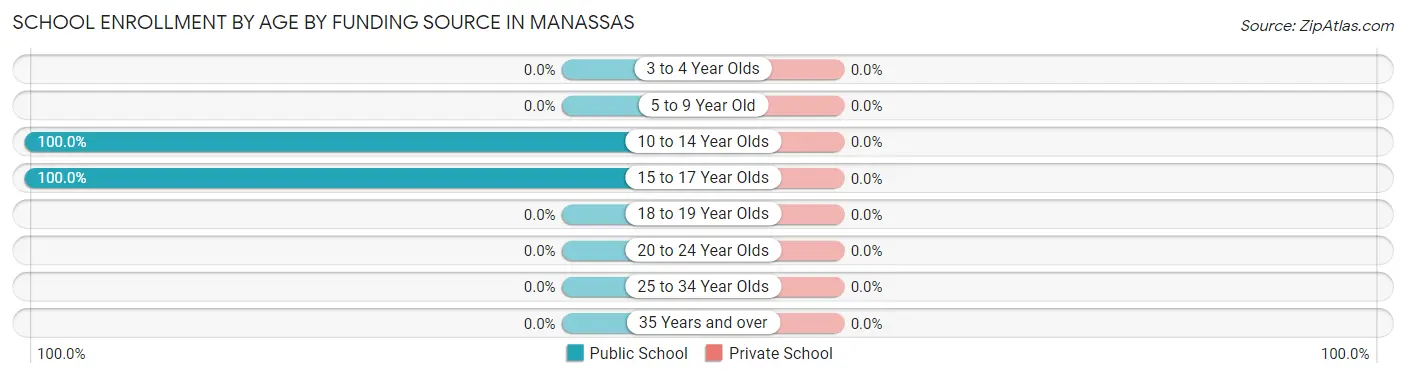
| Age Bracket | Public School | Private School |
| 3 to 4 Year Olds | 0 (0.0%) | 0 (0.0%) |
| 5 to 9 Year Old | 0 (0.0%) | 0 (0.0%) |
| 10 to 14 Year Olds | 5 (100.0%) | 0 (0.0%) |
| 15 to 17 Year Olds | 4 (100.0%) | 0 (0.0%) |
| 18 to 19 Year Olds | 0 (0.0%) | 0 (0.0%) |
| 20 to 24 Year Olds | 0 (0.0%) | 0 (0.0%) |
| 25 to 34 Year Olds | 0 (0.0%) | 0 (0.0%) |
| 35 Years and over | 0 (0.0%) | 0 (0.0%) |
| Total | 9 (100.0%) | 0 (0.0%) |
Educational Attainment by Field of Study in Manassas
Science & technology (7 | 70.0%), and education (3 | 30.0%) are the most common fields of study among 10 individuals in Manassas who have obtained a bachelor's degree or higher.
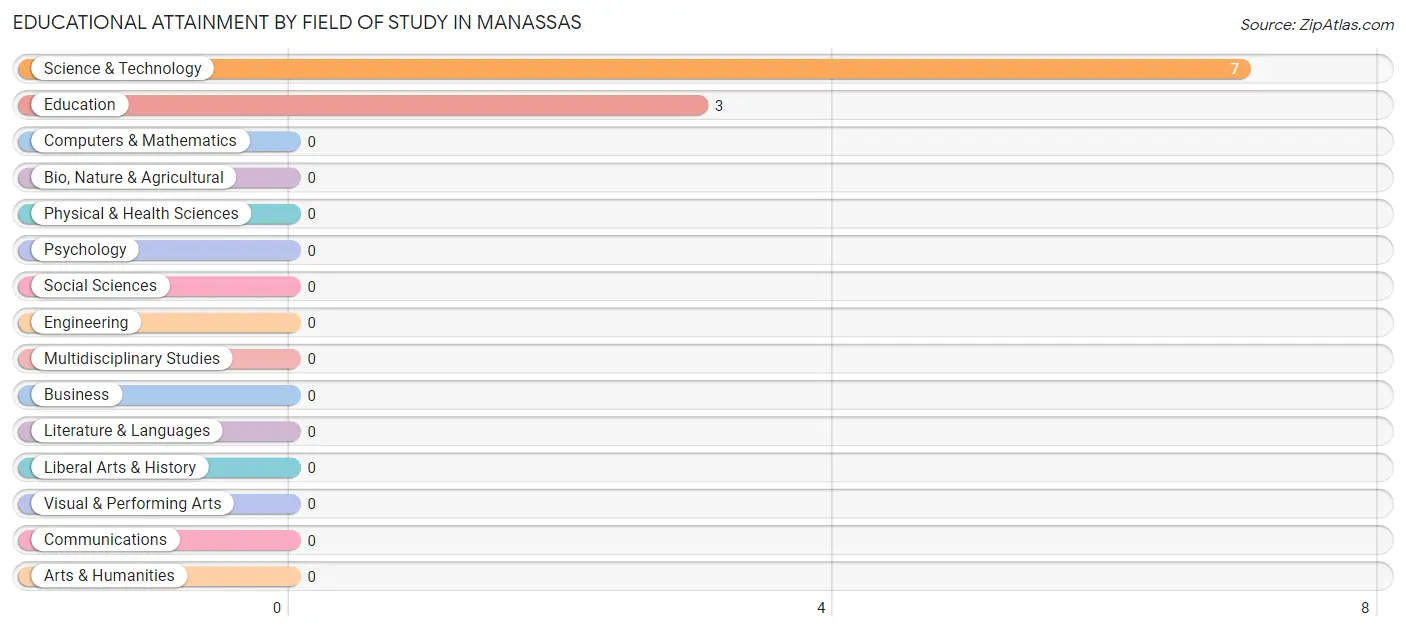
| Field of Study | # Graduates | % Graduates |
| Computers & Mathematics | 0 | 0.0% |
| Bio, Nature & Agricultural | 0 | 0.0% |
| Physical & Health Sciences | 0 | 0.0% |
| Psychology | 0 | 0.0% |
| Social Sciences | 0 | 0.0% |
| Engineering | 0 | 0.0% |
| Multidisciplinary Studies | 0 | 0.0% |
| Science & Technology | 7 | 70.0% |
| Business | 0 | 0.0% |
| Education | 3 | 30.0% |
| Literature & Languages | 0 | 0.0% |
| Liberal Arts & History | 0 | 0.0% |
| Visual & Performing Arts | 0 | 0.0% |
| Communications | 0 | 0.0% |
| Arts & Humanities | 0 | 0.0% |
| Total | 10 | 100.0% |
Transportation & Commute in Manassas
Vehicle Availability by Sex in Manassas
The most prevalent vehicle ownership categories in Manassas are males with 3 vehicles (13, accounting for 39.4%) and females with 3 vehicles (7, making up 100.0%).
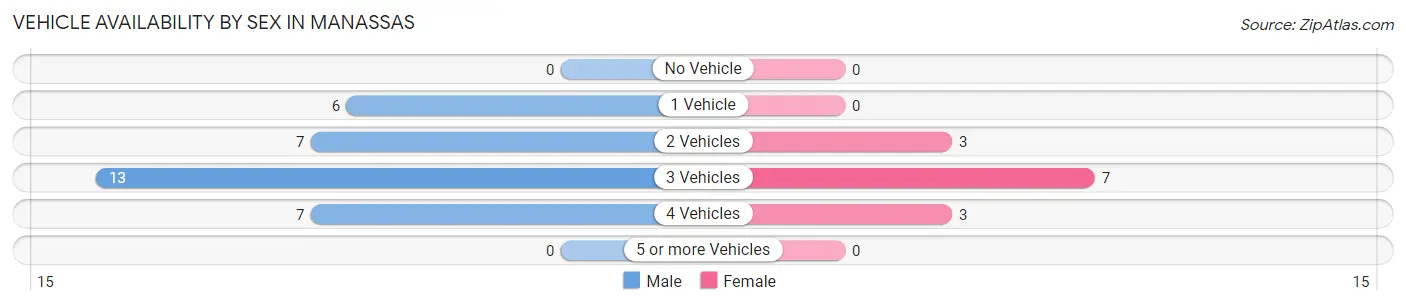
| Vehicles Available | Male | Female |
| No Vehicle | 0 (0.0%) | 0 (0.0%) |
| 1 Vehicle | 6 (18.2%) | 0 (0.0%) |
| 2 Vehicles | 7 (21.2%) | 3 (23.1%) |
| 3 Vehicles | 13 (39.4%) | 7 (53.8%) |
| 4 Vehicles | 7 (21.2%) | 3 (23.1%) |
| 5 or more Vehicles | 0 (0.0%) | 0 (0.0%) |
| Total | 33 (100.0%) | 13 (100.0%) |
Commute Time in Manassas
The most frequently occuring commute durations in Manassas are 10 to 14 minutes (17 commuters, 37.0%), 90 or more minutes (9 commuters, 19.6%), and 25 to 29 minutes (7 commuters, 15.2%).
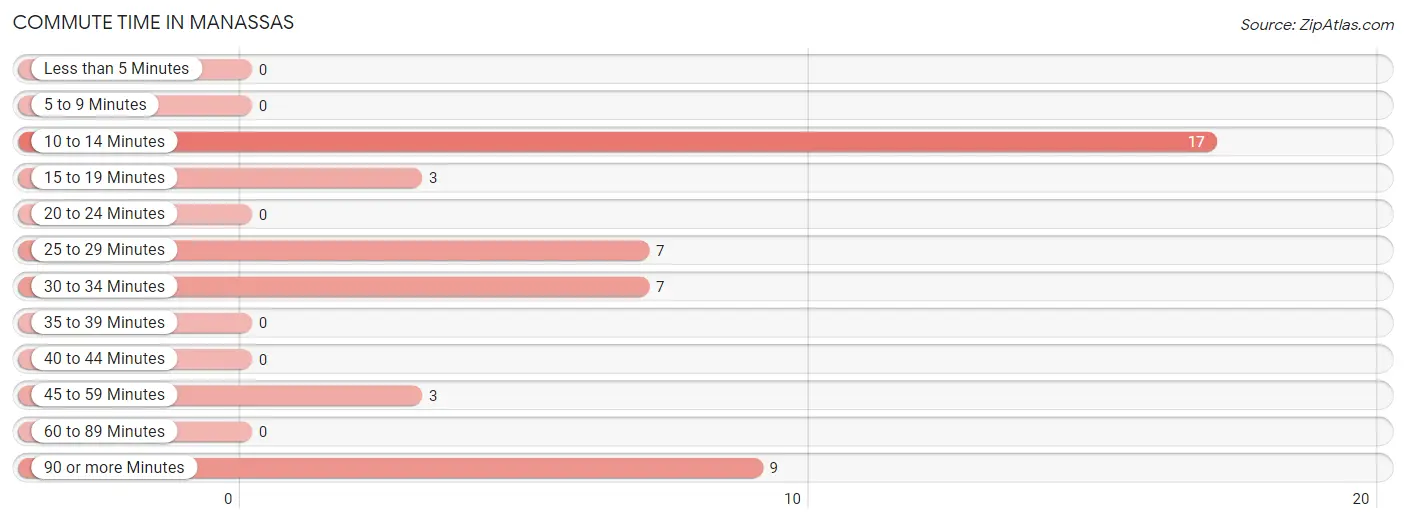
| Commute Time | # Commuters | % Commuters |
| Less than 5 Minutes | 0 | 0.0% |
| 5 to 9 Minutes | 0 | 0.0% |
| 10 to 14 Minutes | 17 | 37.0% |
| 15 to 19 Minutes | 3 | 6.5% |
| 20 to 24 Minutes | 0 | 0.0% |
| 25 to 29 Minutes | 7 | 15.2% |
| 30 to 34 Minutes | 7 | 15.2% |
| 35 to 39 Minutes | 0 | 0.0% |
| 40 to 44 Minutes | 0 | 0.0% |
| 45 to 59 Minutes | 3 | 6.5% |
| 60 to 89 Minutes | 0 | 0.0% |
| 90 or more Minutes | 9 | 19.6% |
Commute Time by Sex in Manassas
The most common commute times in Manassas are 10 to 14 minutes (14 commuters, 42.4%) for males and 25 to 29 minutes (7 commuters, 53.8%) for females.
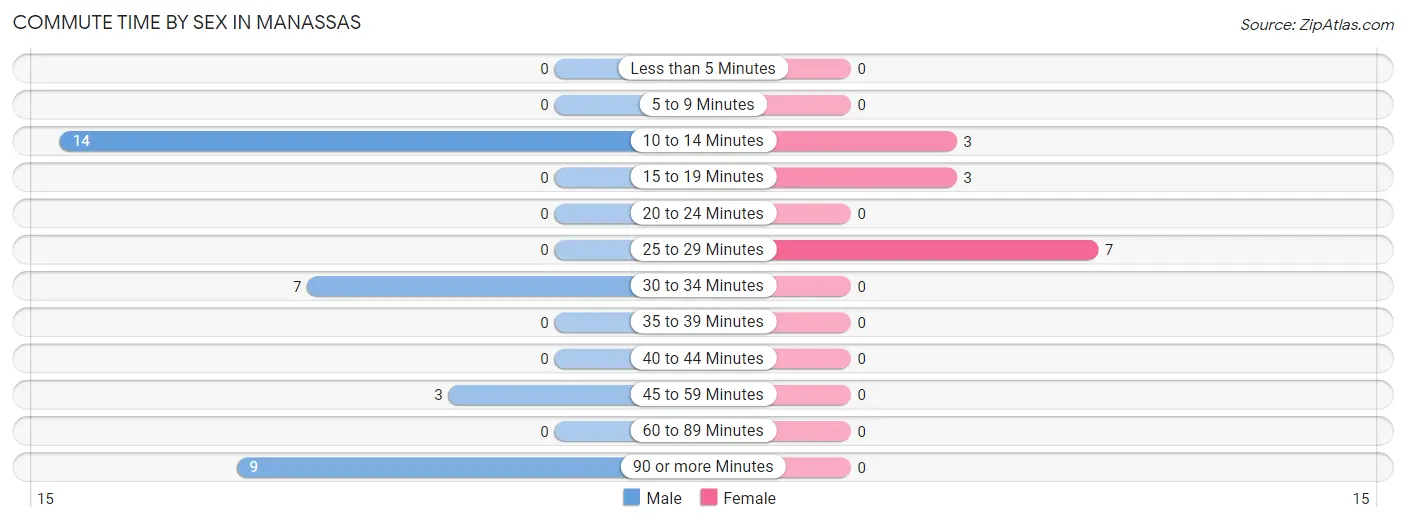
| Commute Time | Male | Female |
| Less than 5 Minutes | 0 (0.0%) | 0 (0.0%) |
| 5 to 9 Minutes | 0 (0.0%) | 0 (0.0%) |
| 10 to 14 Minutes | 14 (42.4%) | 3 (23.1%) |
| 15 to 19 Minutes | 0 (0.0%) | 3 (23.1%) |
| 20 to 24 Minutes | 0 (0.0%) | 0 (0.0%) |
| 25 to 29 Minutes | 0 (0.0%) | 7 (53.8%) |
| 30 to 34 Minutes | 7 (21.2%) | 0 (0.0%) |
| 35 to 39 Minutes | 0 (0.0%) | 0 (0.0%) |
| 40 to 44 Minutes | 0 (0.0%) | 0 (0.0%) |
| 45 to 59 Minutes | 3 (9.1%) | 0 (0.0%) |
| 60 to 89 Minutes | 0 (0.0%) | 0 (0.0%) |
| 90 or more Minutes | 9 (27.3%) | 0 (0.0%) |
Time of Departure to Work by Sex in Manassas
The most frequent times of departure to work in Manassas are 5:30 AM to 5:59 AM (9, 27.3%) for males and 5:30 AM to 5:59 AM (7, 53.8%) for females.
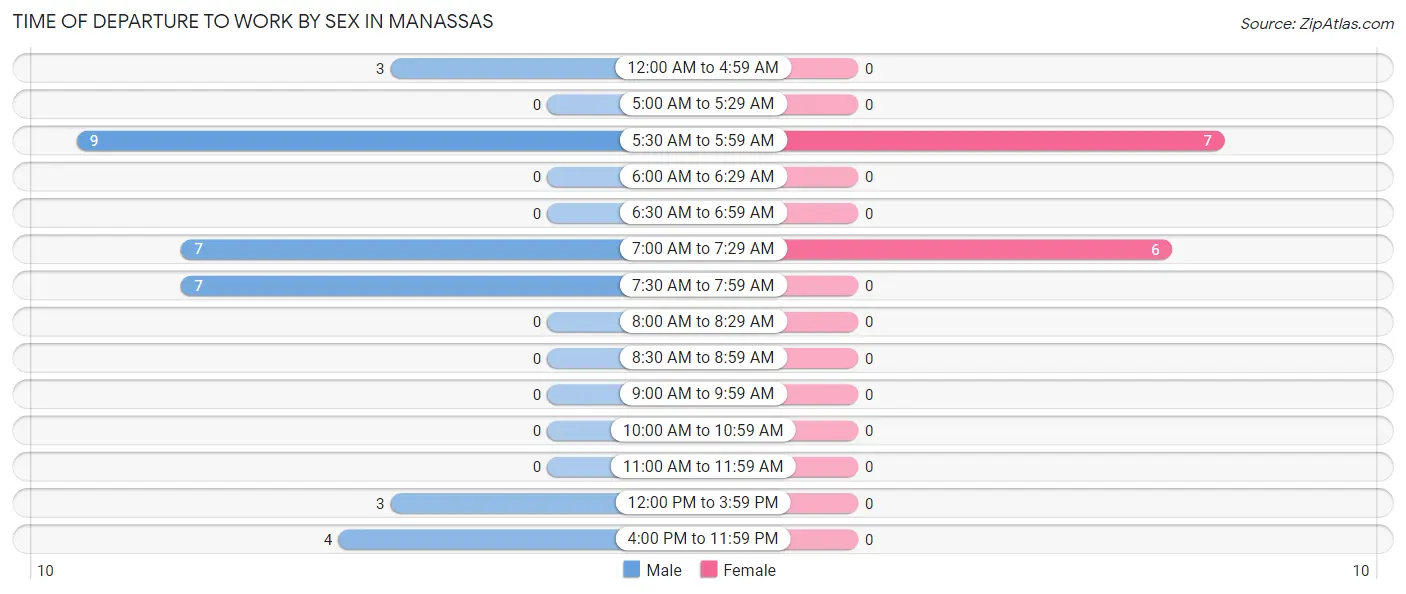
| Time of Departure | Male | Female |
| 12:00 AM to 4:59 AM | 3 (9.1%) | 0 (0.0%) |
| 5:00 AM to 5:29 AM | 0 (0.0%) | 0 (0.0%) |
| 5:30 AM to 5:59 AM | 9 (27.3%) | 7 (53.8%) |
| 6:00 AM to 6:29 AM | 0 (0.0%) | 0 (0.0%) |
| 6:30 AM to 6:59 AM | 0 (0.0%) | 0 (0.0%) |
| 7:00 AM to 7:29 AM | 7 (21.2%) | 6 (46.2%) |
| 7:30 AM to 7:59 AM | 7 (21.2%) | 0 (0.0%) |
| 8:00 AM to 8:29 AM | 0 (0.0%) | 0 (0.0%) |
| 8:30 AM to 8:59 AM | 0 (0.0%) | 0 (0.0%) |
| 9:00 AM to 9:59 AM | 0 (0.0%) | 0 (0.0%) |
| 10:00 AM to 10:59 AM | 0 (0.0%) | 0 (0.0%) |
| 11:00 AM to 11:59 AM | 0 (0.0%) | 0 (0.0%) |
| 12:00 PM to 3:59 PM | 3 (9.1%) | 0 (0.0%) |
| 4:00 PM to 11:59 PM | 4 (12.1%) | 0 (0.0%) |
| Total | 33 (100.0%) | 13 (100.0%) |
Housing Occupancy in Manassas
Occupancy by Ownership in Manassas
Of the total 32 dwellings in Manassas, owner-occupied units account for 23 (71.9%), while renter-occupied units make up 9 (28.1%).
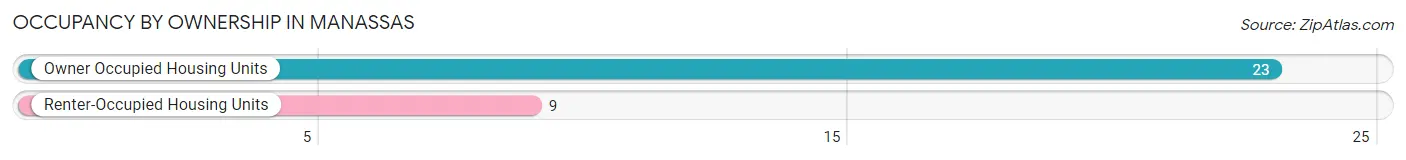
| Occupancy | # Housing Units | % Housing Units |
| Owner Occupied Housing Units | 23 | 71.9% |
| Renter-Occupied Housing Units | 9 | 28.1% |
| Total Occupied Housing Units | 32 | 100.0% |
Occupancy by Household Size in Manassas
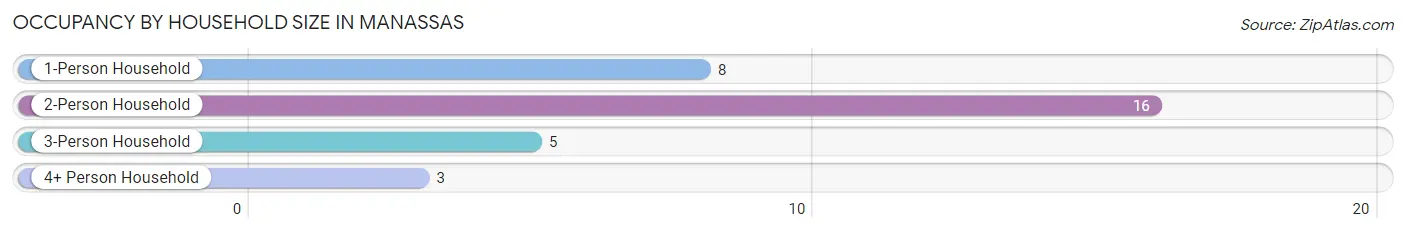
| Household Size | # Housing Units | % Housing Units |
| 1-Person Household | 8 | 25.0% |
| 2-Person Household | 16 | 50.0% |
| 3-Person Household | 5 | 15.6% |
| 4+ Person Household | 3 | 9.4% |
| Total Housing Units | 32 | 100.0% |
Occupancy by Ownership by Household Size in Manassas
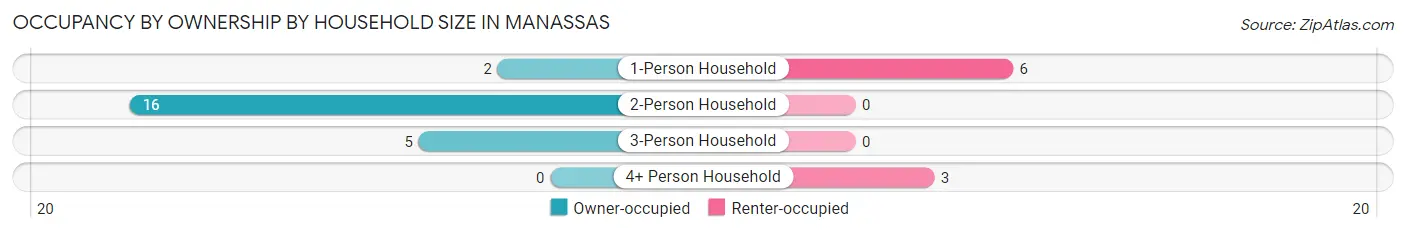
| Household Size | Owner-occupied | Renter-occupied |
| 1-Person Household | 2 (25.0%) | 6 (75.0%) |
| 2-Person Household | 16 (100.0%) | 0 (0.0%) |
| 3-Person Household | 5 (100.0%) | 0 (0.0%) |
| 4+ Person Household | 0 (0.0%) | 3 (100.0%) |
| Total Housing Units | 23 (71.9%) | 9 (28.1%) |
Occupancy by Educational Attainment in Manassas
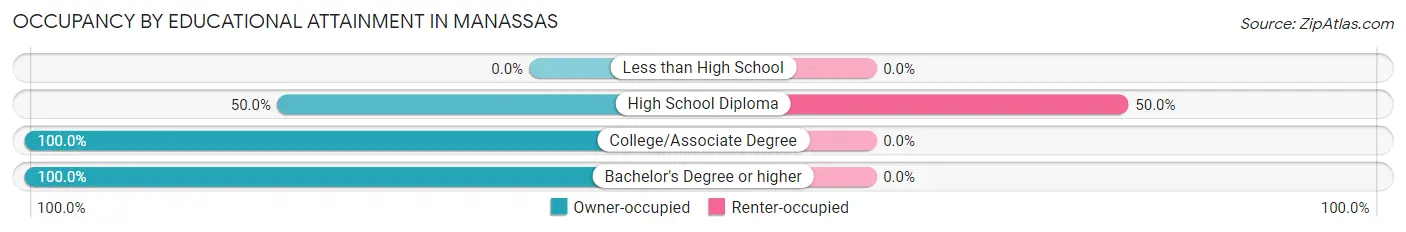
| Household Size | Owner-occupied | Renter-occupied |
| Less than High School | 0 (0.0%) | 0 (0.0%) |
| High School Diploma | 9 (50.0%) | 9 (50.0%) |
| College/Associate Degree | 7 (100.0%) | 0 (0.0%) |
| Bachelor's Degree or higher | 7 (100.0%) | 0 (0.0%) |
Occupancy by Age of Householder in Manassas
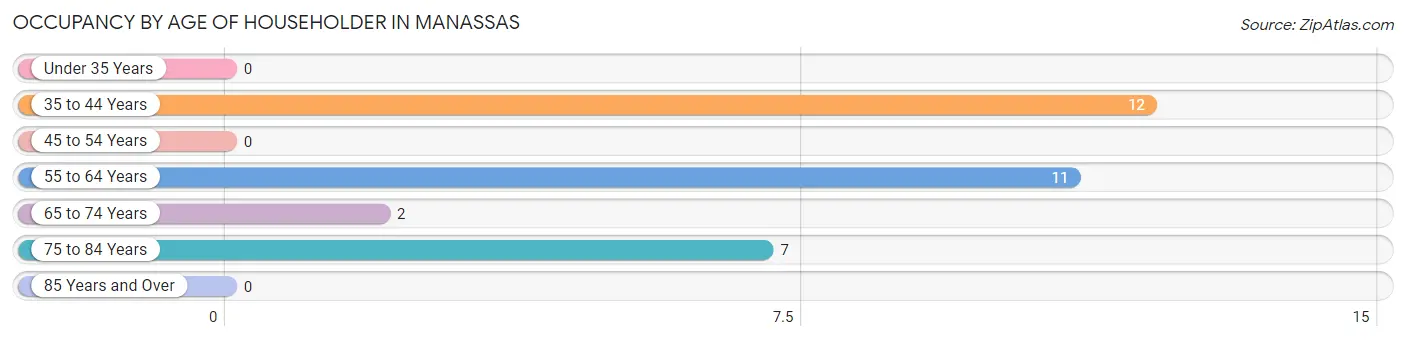
| Age Bracket | # Households | % Households |
| Under 35 Years | 0 | 0.0% |
| 35 to 44 Years | 12 | 37.5% |
| 45 to 54 Years | 0 | 0.0% |
| 55 to 64 Years | 11 | 34.4% |
| 65 to 74 Years | 2 | 6.2% |
| 75 to 84 Years | 7 | 21.9% |
| 85 Years and Over | 0 | 0.0% |
| Total | 32 | 100.0% |
Housing Finances in Manassas
Median Income by Occupancy in Manassas
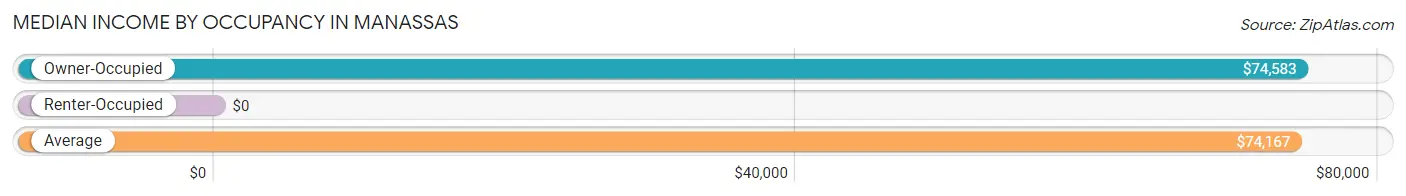
| Occupancy Type | # Households | Median Income |
| Owner-Occupied | 23 (71.9%) | $74,583 |
| Renter-Occupied | 9 (28.1%) | $0 |
| Average | 32 (100.0%) | $74,167 |
Occupancy by Householder Income Bracket in Manassas
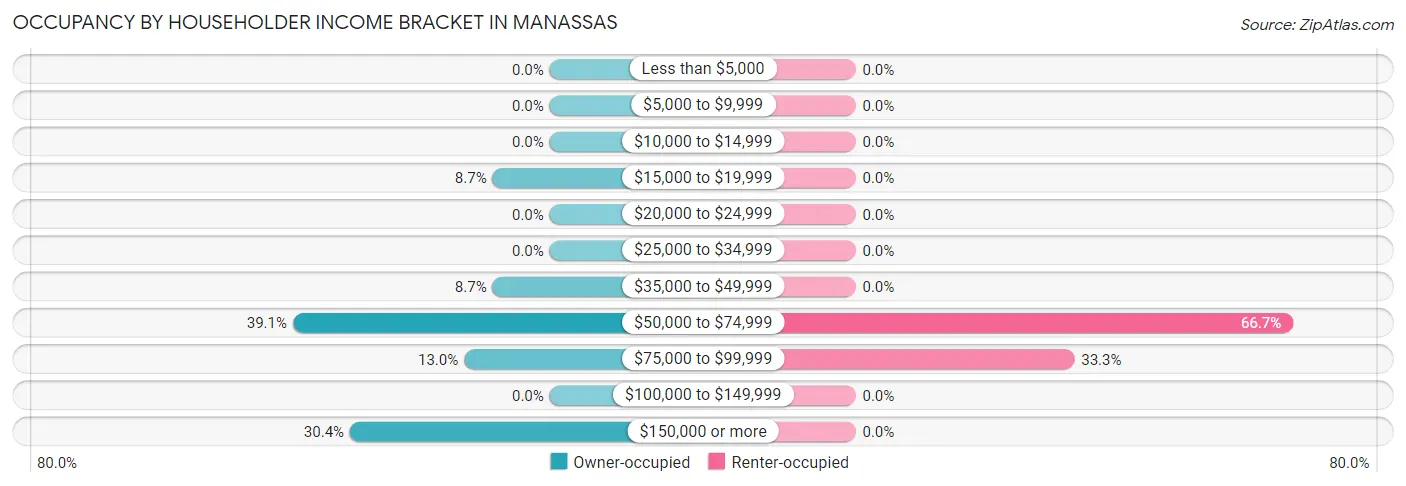
| Income Bracket | Owner-occupied | Renter-occupied |
| Less than $5,000 | 0 (0.0%) | 0 (0.0%) |
| $5,000 to $9,999 | 0 (0.0%) | 0 (0.0%) |
| $10,000 to $14,999 | 0 (0.0%) | 0 (0.0%) |
| $15,000 to $19,999 | 2 (8.7%) | 0 (0.0%) |
| $20,000 to $24,999 | 0 (0.0%) | 0 (0.0%) |
| $25,000 to $34,999 | 0 (0.0%) | 0 (0.0%) |
| $35,000 to $49,999 | 2 (8.7%) | 0 (0.0%) |
| $50,000 to $74,999 | 9 (39.1%) | 6 (66.7%) |
| $75,000 to $99,999 | 3 (13.0%) | 3 (33.3%) |
| $100,000 to $149,999 | 0 (0.0%) | 0 (0.0%) |
| $150,000 or more | 7 (30.4%) | 0 (0.0%) |
| Total | 23 (100.0%) | 9 (100.0%) |
Monthly Housing Cost Tiers in Manassas
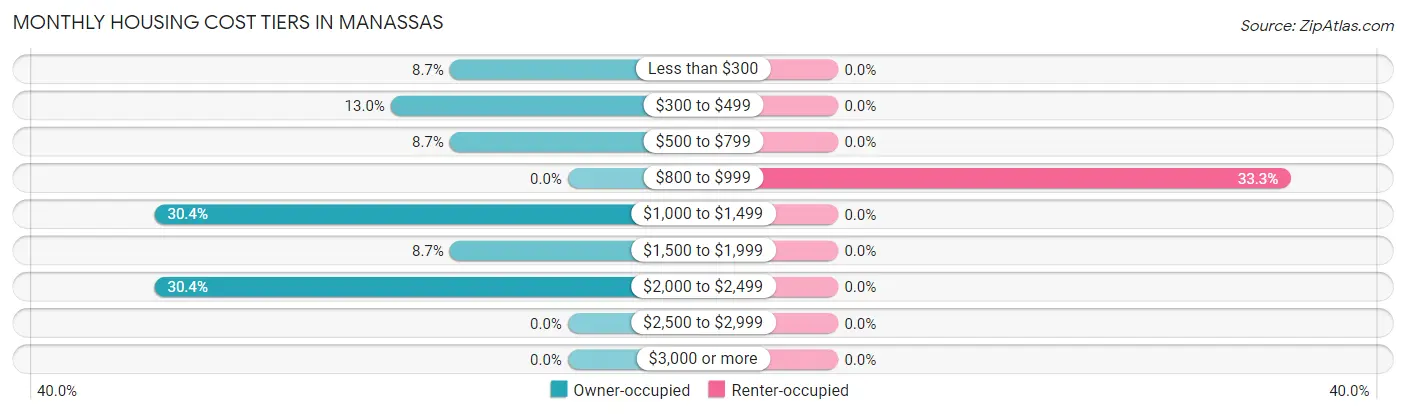
| Monthly Cost | Owner-occupied | Renter-occupied |
| Less than $300 | 2 (8.7%) | 0 (0.0%) |
| $300 to $499 | 3 (13.0%) | 0 (0.0%) |
| $500 to $799 | 2 (8.7%) | 0 (0.0%) |
| $800 to $999 | 0 (0.0%) | 3 (33.3%) |
| $1,000 to $1,499 | 7 (30.4%) | 0 (0.0%) |
| $1,500 to $1,999 | 2 (8.7%) | 0 (0.0%) |
| $2,000 to $2,499 | 7 (30.4%) | 0 (0.0%) |
| $2,500 to $2,999 | 0 (0.0%) | 0 (0.0%) |
| $3,000 or more | 0 (0.0%) | 0 (0.0%) |
| Total | 23 (100.0%) | 9 (100.0%) |
Physical Housing Characteristics in Manassas
Housing Structures in Manassas
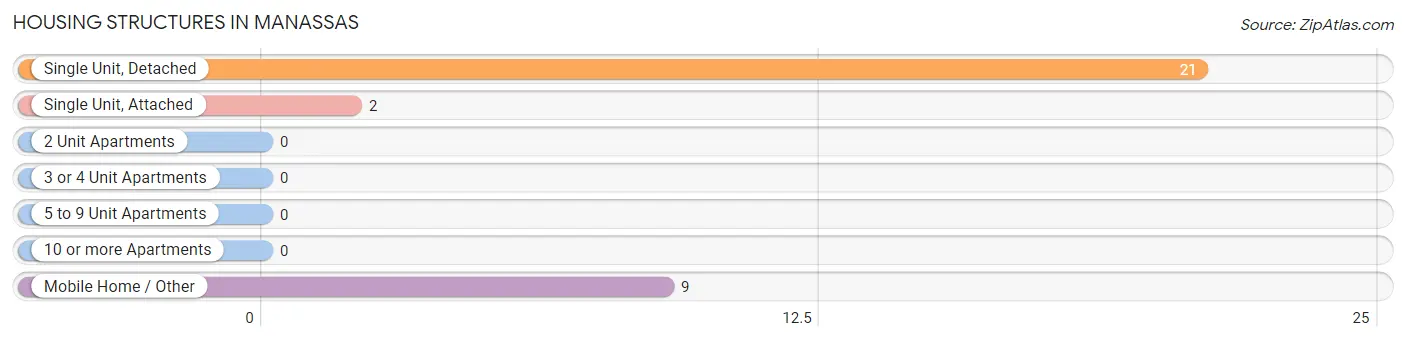
| Structure Type | # Housing Units | % Housing Units |
| Single Unit, Detached | 21 | 65.6% |
| Single Unit, Attached | 2 | 6.2% |
| 2 Unit Apartments | 0 | 0.0% |
| 3 or 4 Unit Apartments | 0 | 0.0% |
| 5 to 9 Unit Apartments | 0 | 0.0% |
| 10 or more Apartments | 0 | 0.0% |
| Mobile Home / Other | 9 | 28.1% |
| Total | 32 | 100.0% |
Housing Structures by Occupancy in Manassas
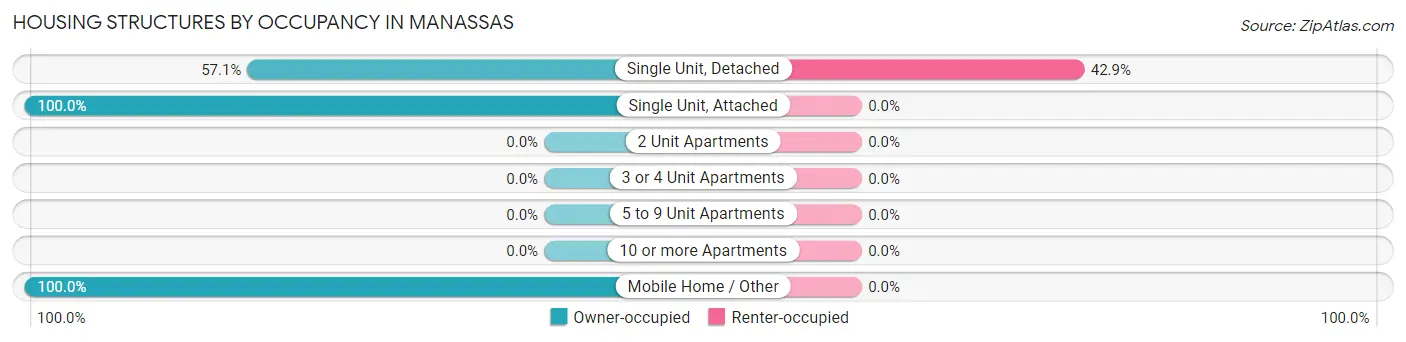
| Structure Type | Owner-occupied | Renter-occupied |
| Single Unit, Detached | 12 (57.1%) | 9 (42.9%) |
| Single Unit, Attached | 2 (100.0%) | 0 (0.0%) |
| 2 Unit Apartments | 0 (0.0%) | 0 (0.0%) |
| 3 or 4 Unit Apartments | 0 (0.0%) | 0 (0.0%) |
| 5 to 9 Unit Apartments | 0 (0.0%) | 0 (0.0%) |
| 10 or more Apartments | 0 (0.0%) | 0 (0.0%) |
| Mobile Home / Other | 9 (100.0%) | 0 (0.0%) |
| Total | 23 (71.9%) | 9 (28.1%) |
Housing Structures by Number of Rooms in Manassas
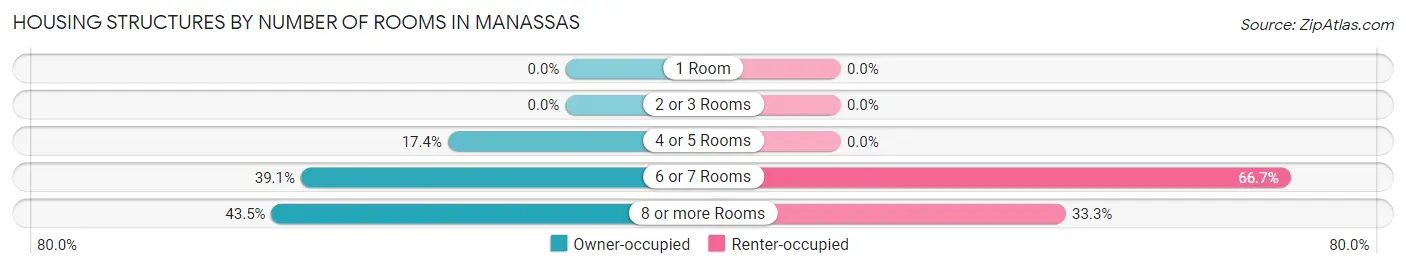
| Number of Rooms | Owner-occupied | Renter-occupied |
| 1 Room | 0 (0.0%) | 0 (0.0%) |
| 2 or 3 Rooms | 0 (0.0%) | 0 (0.0%) |
| 4 or 5 Rooms | 4 (17.4%) | 0 (0.0%) |
| 6 or 7 Rooms | 9 (39.1%) | 6 (66.7%) |
| 8 or more Rooms | 10 (43.5%) | 3 (33.3%) |
| Total | 23 (100.0%) | 9 (100.0%) |
Housing Structure by Heating Type in Manassas
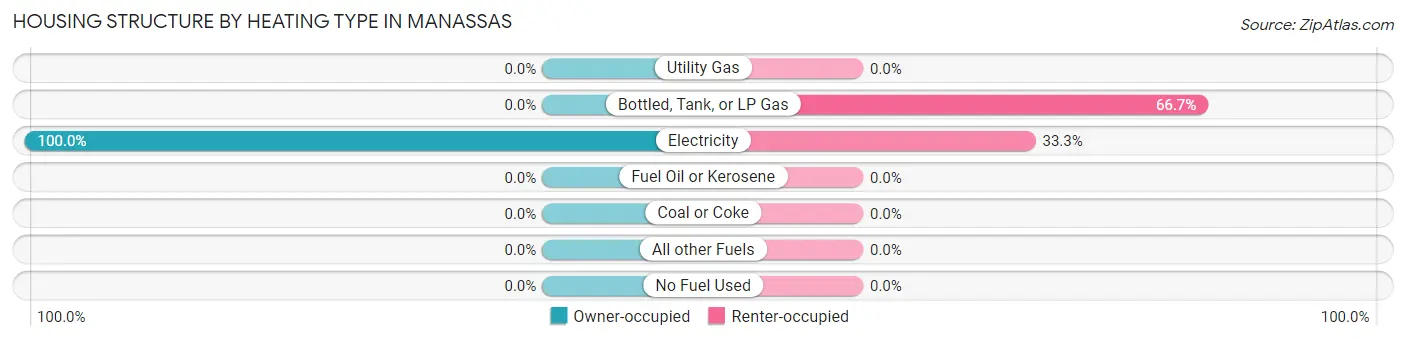
| Heating Type | Owner-occupied | Renter-occupied |
| Utility Gas | 0 (0.0%) | 0 (0.0%) |
| Bottled, Tank, or LP Gas | 0 (0.0%) | 6 (66.7%) |
| Electricity | 23 (100.0%) | 3 (33.3%) |
| Fuel Oil or Kerosene | 0 (0.0%) | 0 (0.0%) |
| Coal or Coke | 0 (0.0%) | 0 (0.0%) |
| All other Fuels | 0 (0.0%) | 0 (0.0%) |
| No Fuel Used | 0 (0.0%) | 0 (0.0%) |
| Total | 23 (100.0%) | 9 (100.0%) |
Household Vehicle Usage in Manassas
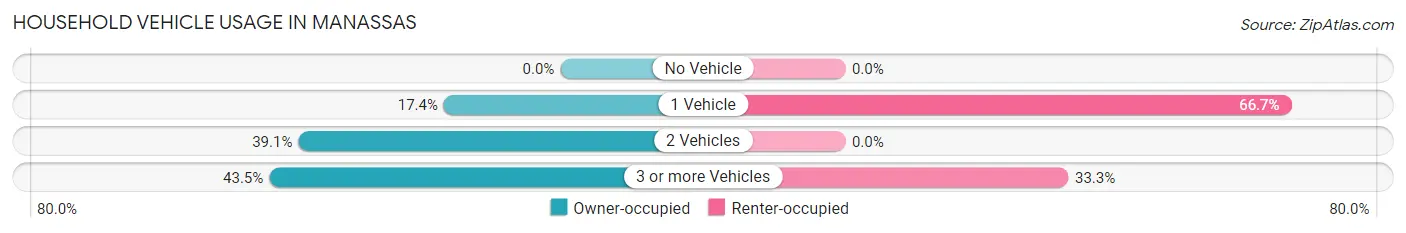
| Vehicles per Household | Owner-occupied | Renter-occupied |
| No Vehicle | 0 (0.0%) | 0 (0.0%) |
| 1 Vehicle | 4 (17.4%) | 6 (66.7%) |
| 2 Vehicles | 9 (39.1%) | 0 (0.0%) |
| 3 or more Vehicles | 10 (43.5%) | 3 (33.3%) |
| Total | 23 (100.0%) | 9 (100.0%) |
Real Estate & Mortgages in Manassas
Real Estate and Mortgage Overview in Manassas
| Characteristic | Without Mortgage | With Mortgage |
| Housing Units | 7 | 16 |
| Median Property Value | - | - |
| Median Household Income | - | - |
| Monthly Housing Costs | - | - |
| Real Estate Taxes | - | - |
Property Value by Mortgage Status in Manassas
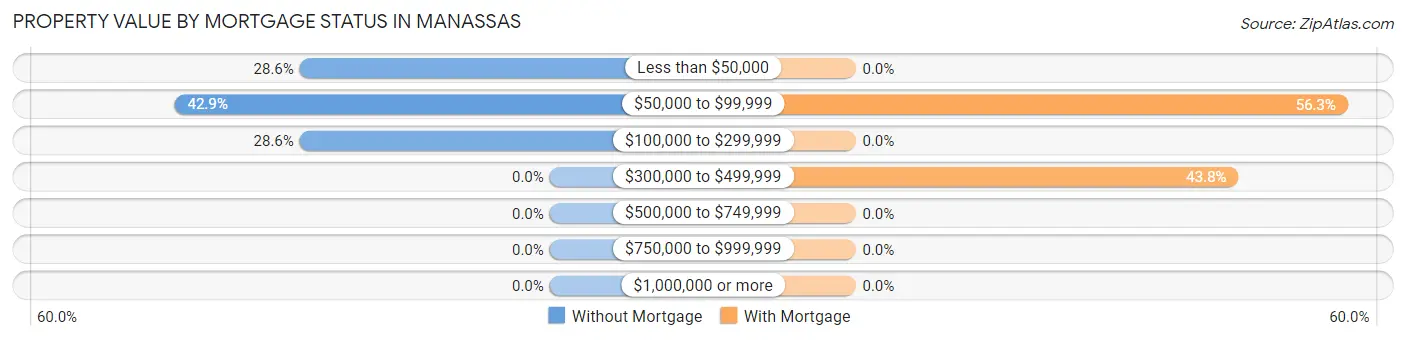
| Property Value | Without Mortgage | With Mortgage |
| Less than $50,000 | 2 (28.6%) | 0 (0.0%) |
| $50,000 to $99,999 | 3 (42.9%) | 9 (56.2%) |
| $100,000 to $299,999 | 2 (28.6%) | 0 (0.0%) |
| $300,000 to $499,999 | 0 (0.0%) | 7 (43.8%) |
| $500,000 to $749,999 | 0 (0.0%) | 0 (0.0%) |
| $750,000 to $999,999 | 0 (0.0%) | 0 (0.0%) |
| $1,000,000 or more | 0 (0.0%) | 0 (0.0%) |
| Total | 7 (100.0%) | 16 (100.0%) |
Household Income by Mortgage Status in Manassas
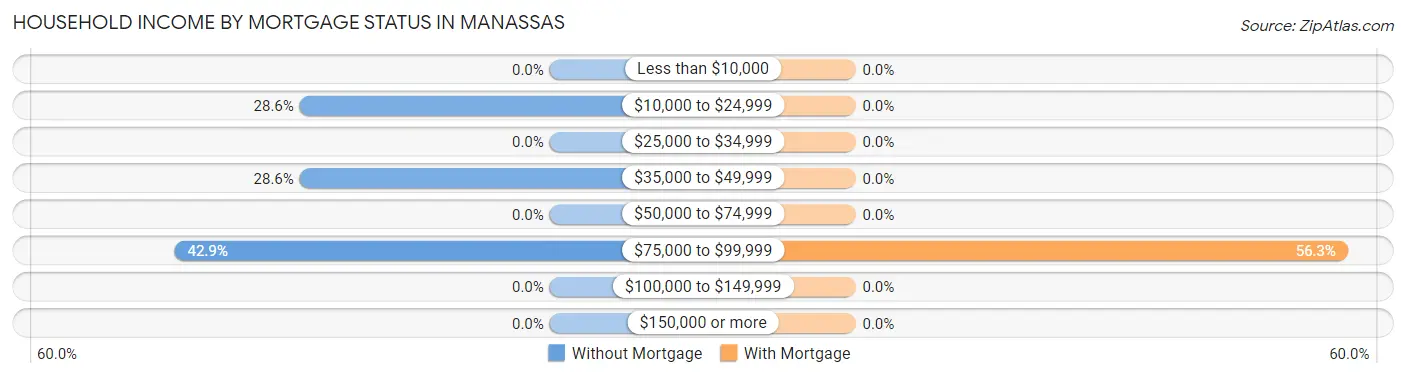
| Household Income | Without Mortgage | With Mortgage |
| Less than $10,000 | 0 (0.0%) | 0 (0.0%) |
| $10,000 to $24,999 | 2 (28.6%) | 0 (0.0%) |
| $25,000 to $34,999 | 0 (0.0%) | 0 (0.0%) |
| $35,000 to $49,999 | 2 (28.6%) | 0 (0.0%) |
| $50,000 to $74,999 | 0 (0.0%) | 0 (0.0%) |
| $75,000 to $99,999 | 3 (42.9%) | 9 (56.2%) |
| $100,000 to $149,999 | 0 (0.0%) | 0 (0.0%) |
| $150,000 or more | 0 (0.0%) | 0 (0.0%) |
| Total | 7 (100.0%) | 16 (100.0%) |
Property Value to Household Income Ratio in Manassas
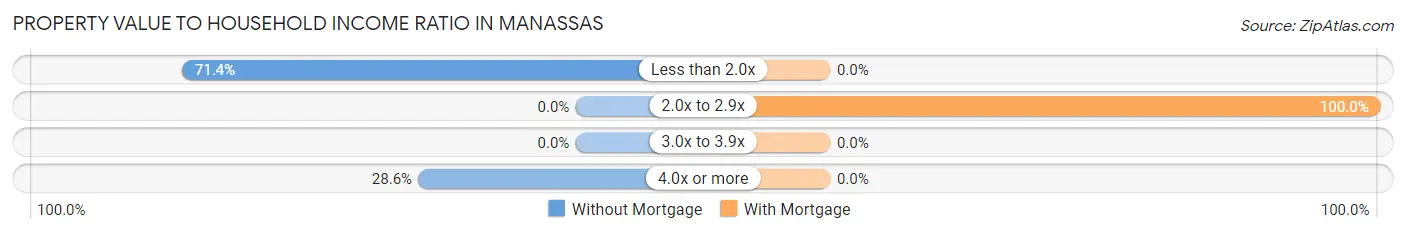
| Value-to-Income Ratio | Without Mortgage | With Mortgage |
| Less than 2.0x | 5 (71.4%) | 0 (0.0%) |
| 2.0x to 2.9x | 0 (0.0%) | 16 (100.0%) |
| 3.0x to 3.9x | 0 (0.0%) | 0 (0.0%) |
| 4.0x or more | 2 (28.6%) | 0 (0.0%) |
| Total | 7 (100.0%) | 16 (100.0%) |
Real Estate Taxes by Mortgage Status in Manassas
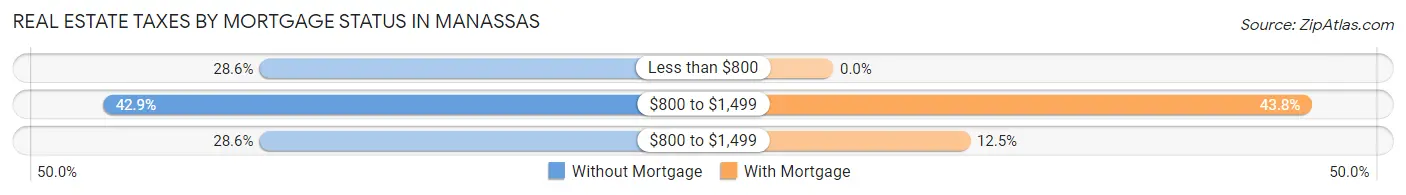
| Property Taxes | Without Mortgage | With Mortgage |
| Less than $800 | 2 (28.6%) | 0 (0.0%) |
| $800 to $1,499 | 3 (42.9%) | 7 (43.8%) |
| $800 to $1,499 | 2 (28.6%) | 2 (12.5%) |
| Total | 7 (100.0%) | 16 (100.0%) |
Health & Disability in Manassas
Health Insurance Coverage by Age in Manassas
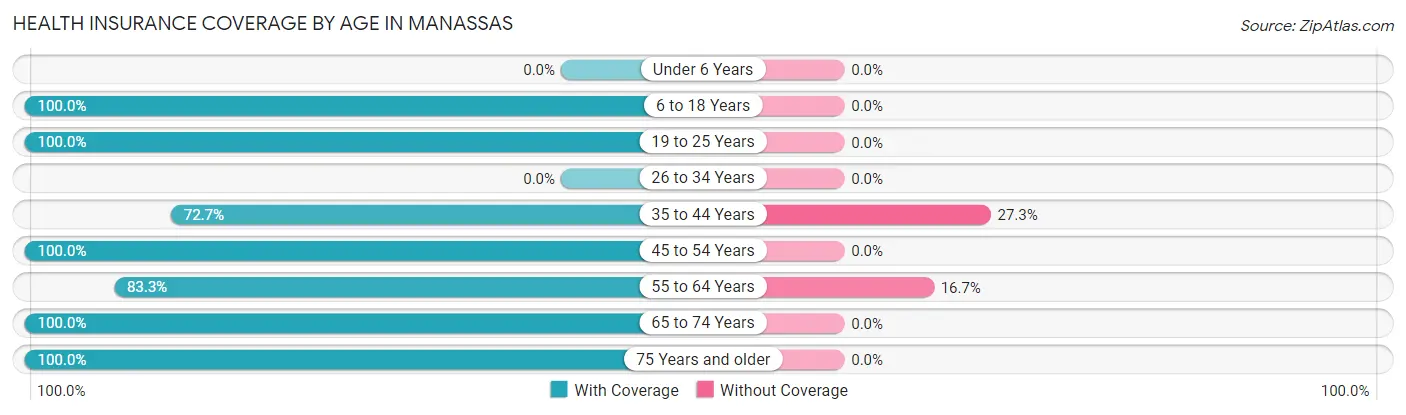
| Age Bracket | With Coverage | Without Coverage |
| Under 6 Years | 0 (0.0%) | 0 (0.0%) |
| 6 to 18 Years | 9 (100.0%) | 0 (0.0%) |
| 19 to 25 Years | 3 (100.0%) | 0 (0.0%) |
| 26 to 34 Years | 0 (0.0%) | 0 (0.0%) |
| 35 to 44 Years | 16 (72.7%) | 6 (27.3%) |
| 45 to 54 Years | 13 (100.0%) | 0 (0.0%) |
| 55 to 64 Years | 15 (83.3%) | 3 (16.7%) |
| 65 to 74 Years | 10 (100.0%) | 0 (0.0%) |
| 75 Years and older | 7 (100.0%) | 0 (0.0%) |
| Total | 73 (89.0%) | 9 (11.0%) |
Health Insurance Coverage by Citizenship Status in Manassas
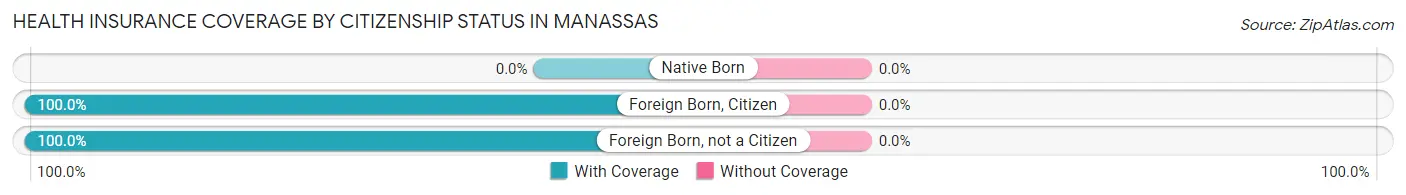
| Citizenship Status | With Coverage | Without Coverage |
| Native Born | 0 (0.0%) | 0 (0.0%) |
| Foreign Born, Citizen | 9 (100.0%) | 0 (0.0%) |
| Foreign Born, not a Citizen | 3 (100.0%) | 0 (0.0%) |
Health Insurance Coverage by Household Income in Manassas
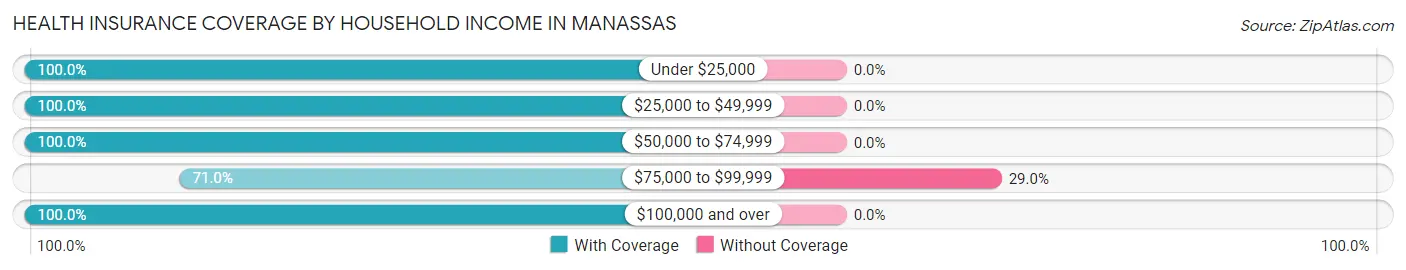
| Household Income | With Coverage | Without Coverage |
| Under $25,000 | 5 (100.0%) | 0 (0.0%) |
| $25,000 to $49,999 | 2 (100.0%) | 0 (0.0%) |
| $50,000 to $74,999 | 30 (100.0%) | 0 (0.0%) |
| $75,000 to $99,999 | 22 (71.0%) | 9 (29.0%) |
| $100,000 and over | 14 (100.0%) | 0 (0.0%) |
Public vs Private Health Insurance Coverage by Age in Manassas
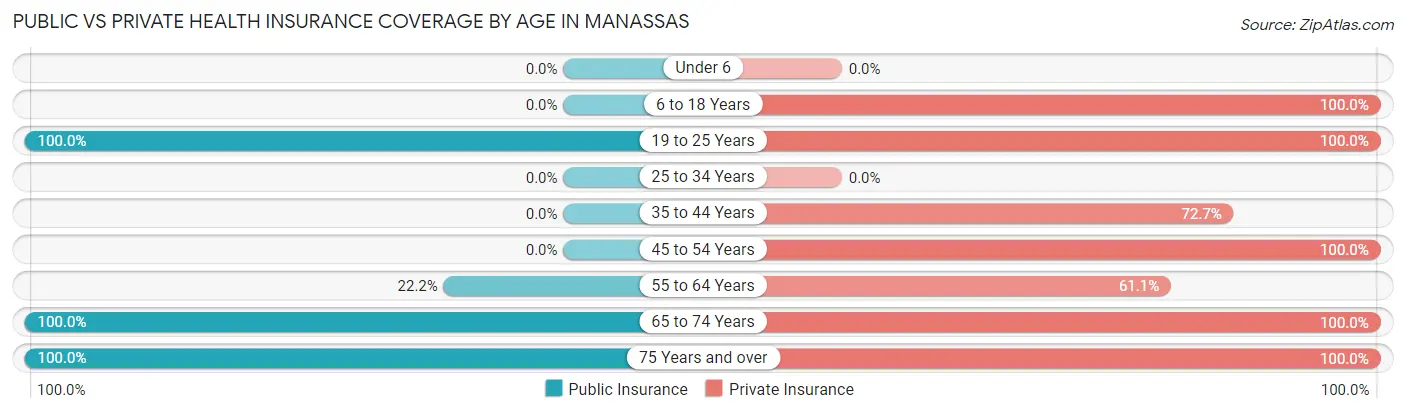
| Age Bracket | Public Insurance | Private Insurance |
| Under 6 | 0 (0.0%) | 0 (0.0%) |
| 6 to 18 Years | 0 (0.0%) | 9 (100.0%) |
| 19 to 25 Years | 3 (100.0%) | 3 (100.0%) |
| 25 to 34 Years | 0 (0.0%) | 0 (0.0%) |
| 35 to 44 Years | 0 (0.0%) | 16 (72.7%) |
| 45 to 54 Years | 0 (0.0%) | 13 (100.0%) |
| 55 to 64 Years | 4 (22.2%) | 11 (61.1%) |
| 65 to 74 Years | 10 (100.0%) | 10 (100.0%) |
| 75 Years and over | 7 (100.0%) | 7 (100.0%) |
| Total | 24 (29.3%) | 69 (84.2%) |
Disability Status by Sex by Age in Manassas
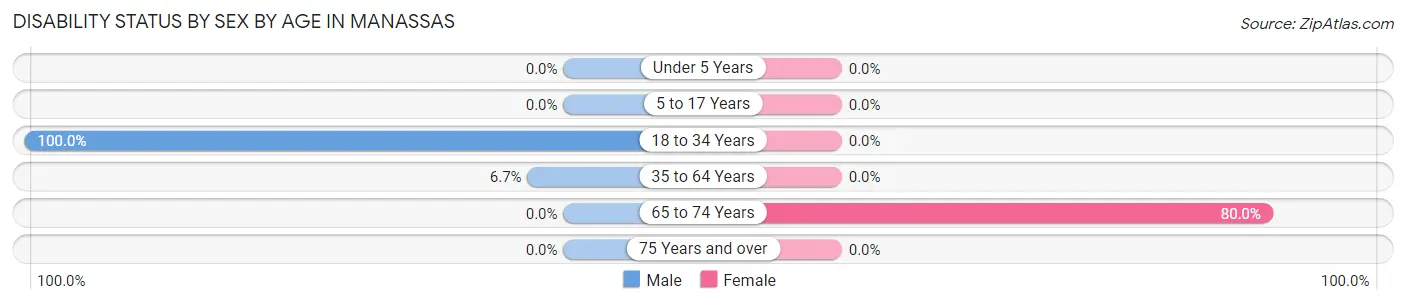
| Age Bracket | Male | Female |
| Under 5 Years | 0 (0.0%) | 0 (0.0%) |
| 5 to 17 Years | 0 (0.0%) | 0 (0.0%) |
| 18 to 34 Years | 3 (100.0%) | 0 (0.0%) |
| 35 to 64 Years | 2 (6.7%) | 0 (0.0%) |
| 65 to 74 Years | 0 (0.0%) | 8 (80.0%) |
| 75 Years and over | 0 (0.0%) | 0 (0.0%) |
Disability Class by Sex by Age in Manassas
Disability Class: Hearing Difficulty
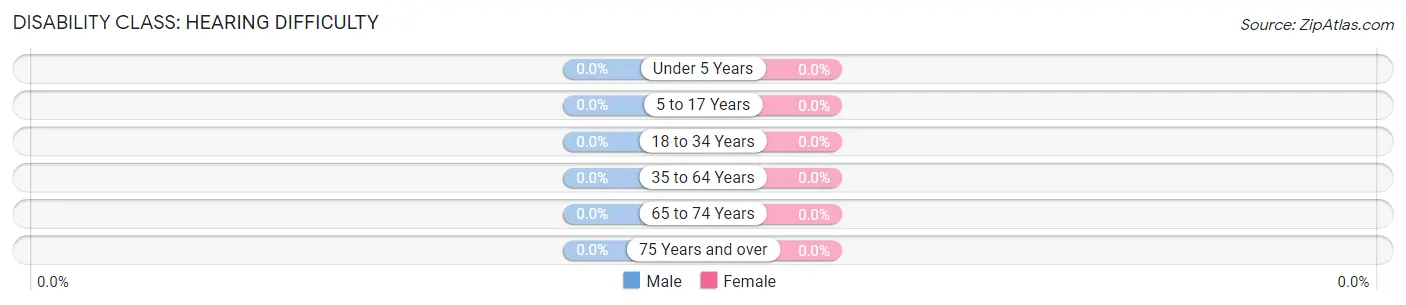
| Age Bracket | Male | Female |
| Under 5 Years | 0 (0.0%) | 0 (0.0%) |
| 5 to 17 Years | 0 (0.0%) | 0 (0.0%) |
| 18 to 34 Years | 0 (0.0%) | 0 (0.0%) |
| 35 to 64 Years | 0 (0.0%) | 0 (0.0%) |
| 65 to 74 Years | 0 (0.0%) | 0 (0.0%) |
| 75 Years and over | 0 (0.0%) | 0 (0.0%) |
Disability Class: Vision Difficulty
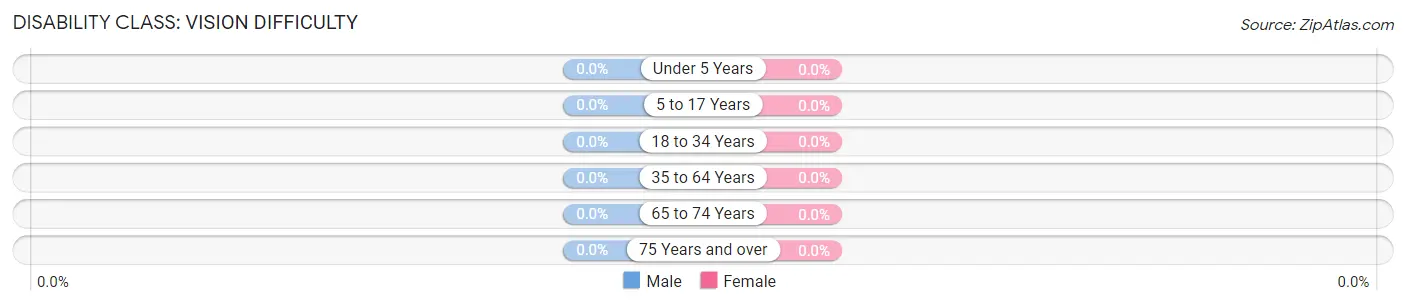
| Age Bracket | Male | Female |
| Under 5 Years | 0 (0.0%) | 0 (0.0%) |
| 5 to 17 Years | 0 (0.0%) | 0 (0.0%) |
| 18 to 34 Years | 0 (0.0%) | 0 (0.0%) |
| 35 to 64 Years | 0 (0.0%) | 0 (0.0%) |
| 65 to 74 Years | 0 (0.0%) | 0 (0.0%) |
| 75 Years and over | 0 (0.0%) | 0 (0.0%) |
Disability Class: Cognitive Difficulty
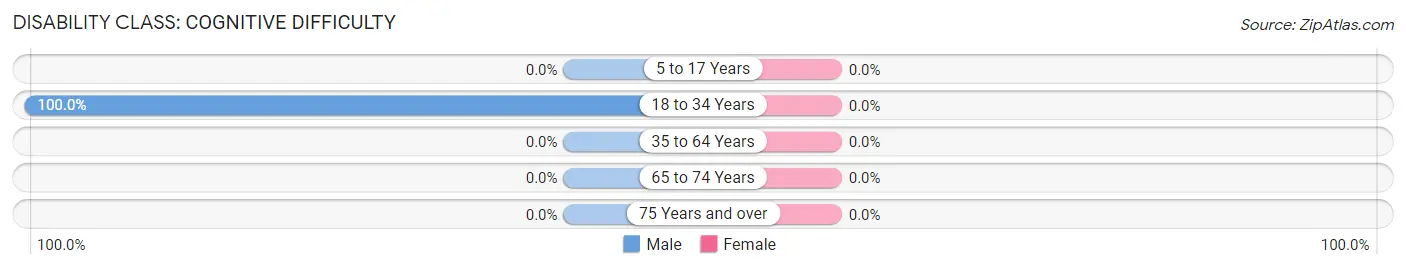
| Age Bracket | Male | Female |
| 5 to 17 Years | 0 (0.0%) | 0 (0.0%) |
| 18 to 34 Years | 3 (100.0%) | 0 (0.0%) |
| 35 to 64 Years | 0 (0.0%) | 0 (0.0%) |
| 65 to 74 Years | 0 (0.0%) | 0 (0.0%) |
| 75 Years and over | 0 (0.0%) | 0 (0.0%) |
Disability Class: Ambulatory Difficulty
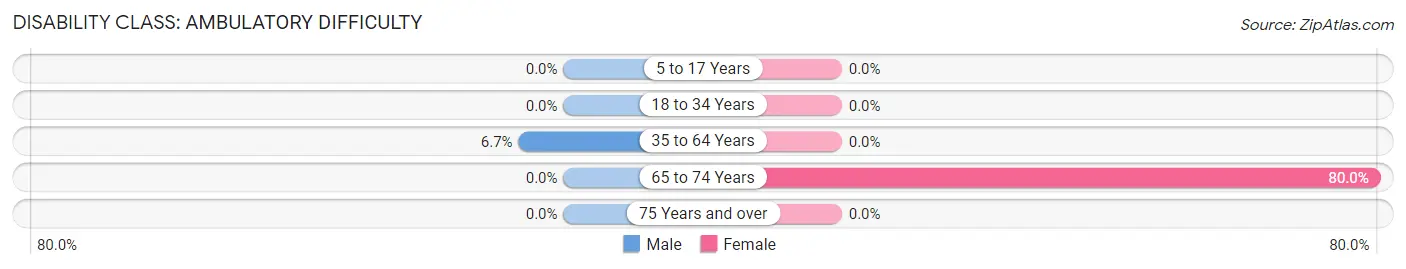
| Age Bracket | Male | Female |
| 5 to 17 Years | 0 (0.0%) | 0 (0.0%) |
| 18 to 34 Years | 0 (0.0%) | 0 (0.0%) |
| 35 to 64 Years | 2 (6.7%) | 0 (0.0%) |
| 65 to 74 Years | 0 (0.0%) | 8 (80.0%) |
| 75 Years and over | 0 (0.0%) | 0 (0.0%) |
Disability Class: Self-Care Difficulty
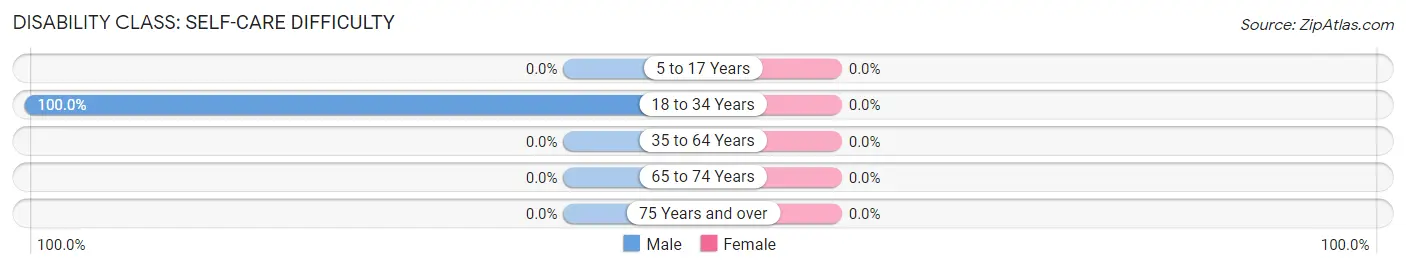
| Age Bracket | Male | Female |
| 5 to 17 Years | 0 (0.0%) | 0 (0.0%) |
| 18 to 34 Years | 3 (100.0%) | 0 (0.0%) |
| 35 to 64 Years | 0 (0.0%) | 0 (0.0%) |
| 65 to 74 Years | 0 (0.0%) | 0 (0.0%) |
| 75 Years and over | 0 (0.0%) | 0 (0.0%) |
Technology Access in Manassas
Computing Device Access in Manassas
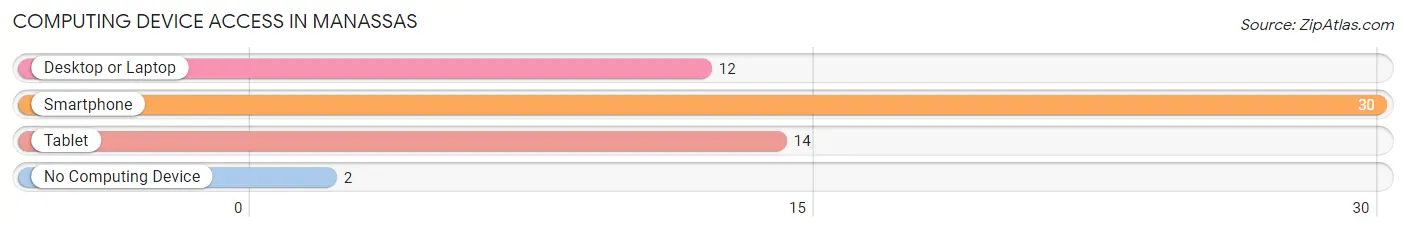
| Device Type | # Households | % Households |
| Desktop or Laptop | 12 | 37.5% |
| Smartphone | 30 | 93.8% |
| Tablet | 14 | 43.8% |
| No Computing Device | 2 | 6.2% |
| Total | 32 | 100.0% |
Internet Access in Manassas
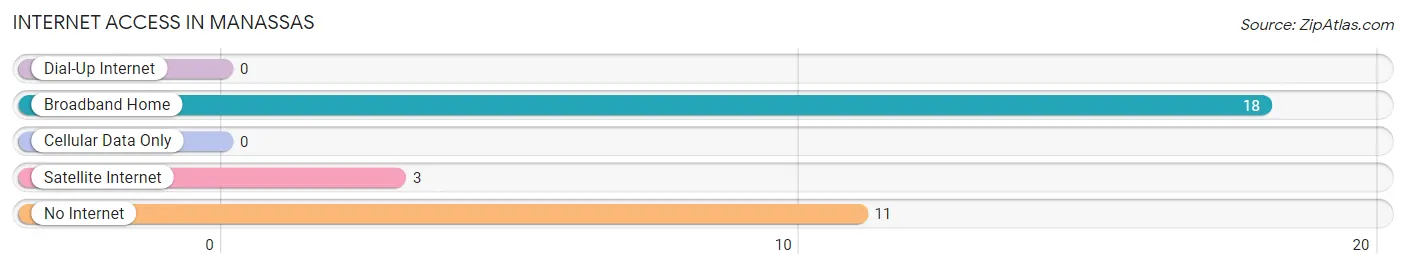
| Internet Type | # Households | % Households |
| Dial-Up Internet | 0 | 0.0% |
| Broadband Home | 18 | 56.2% |
| Cellular Data Only | 0 | 0.0% |
| Satellite Internet | 3 | 9.4% |
| No Internet | 11 | 34.4% |
| Total | 32 | 100.0% |
Manassas Summary
Manassas is a small city located in the state of Georgia, United States. It is situated in the southwestern part of the state, in the county of Bartow. The city has a population of approximately 1,500 people, according to the 2010 census.
History
The city of Manassas was founded in 1854 by a group of settlers from the nearby town of Cartersville. The settlers named the town after the Battle of Manassas, which had taken place in Virginia during the American Civil War. The town was incorporated in 1887 and was initially a farming community. In the early 1900s, the town began to grow and develop, with the construction of a railroad line and the opening of a cotton mill.
Geography
Manassas is located in the southwestern part of Georgia, in the county of Bartow. It is situated at an elevation of 845 feet above sea level. The city covers an area of 1.2 square miles, all of which is land. The city is located near the Etowah River, which flows through the area.
Economy
The economy of Manassas is largely based on agriculture and manufacturing. The city is home to several farms, which produce a variety of crops, including cotton, corn, soybeans, and peanuts. The city also has several manufacturing plants, which produce a variety of products, including furniture, textiles, and paper products.
Demographics
According to the 2010 census, the population of Manassas was 1,500. The racial makeup of the city was 79.3% White, 17.3% African American, 0.7% Native American, 0.3% Asian, 0.1% Pacific Islander, and 2.3% from other races. The median household income was $31,250, and the median family income was $37,500. The per capita income was $15,845.
Conclusion
Manassas is a small city located in the southwestern part of Georgia. It was founded in 1854 and was initially a farming community. The city has a population of approximately 1,500 people, according to the 2010 census. The economy of Manassas is largely based on agriculture and manufacturing. The racial makeup of the city is 79.3% White, 17.3% African American, 0.7% Native American, 0.3% Asian, 0.1% Pacific Islander, and 2.3% from other races. The median household income was $31,250, and the median family income was $37,500.
Common Questions
What is Per Capita Income in Manassas?
Per Capita income in Manassas is $36,357.
What is the Median Family Income in Manassas?
Median Family Income in Manassas is $80,833.
What is the Median Household income in Manassas?
Median Household Income in Manassas is $74,167.
What is Inequality or Gini Index in Manassas?
Inequality or Gini Index in Manassas is 0.26.
What is the Total Population of Manassas?
Total Population of Manassas is 82.
What is the Total Male Population of Manassas?
Total Male Population of Manassas is 47.
What is the Total Female Population of Manassas?
Total Female Population of Manassas is 35.
What is the Ratio of Males per 100 Females in Manassas?
There are 134.29 Males per 100 Females in Manassas.
What is the Ratio of Females per 100 Males in Manassas?
There are 74.47 Females per 100 Males in Manassas.
What is the Median Population Age in Manassas?
Median Population Age in Manassas is 50.0 Years.
What is the Average Family Size in Manassas
Average Family Size in Manassas is 3.1 People.
What is the Average Household Size in Manassas
Average Household Size in Manassas is 2.6 People.
How Large is the Labor Force in Manassas?
There are 48 People in the Labor Forcein in Manassas.
What is the Percentage of People in the Labor Force in Manassas?
65.8% of People are in the Labor Force in Manassas.