Pocono Springs, PA Map & Demographics
Pocono Springs Map
Pocono Springs Overview
$25,461
PER CAPITA INCOME
$58,221
AVG FAMILY INCOME
$47,434
AVG HOUSEHOLD INCOME
0.36
INEQUALITY / GINI INDEX
852
TOTAL POPULATION
388
MALE POPULATION
464
FEMALE POPULATION
83.62
MALES / 100 FEMALES
119.59
FEMALES / 100 MALES
44.5
MEDIAN AGE
3.7
AVG FAMILY SIZE
2.9
AVG HOUSEHOLD SIZE
296
LABOR FORCE [ PEOPLE ]
44.4%
PERCENT IN LABOR FORCE
12.8%
UNEMPLOYMENT RATE
Income in Pocono Springs
Income Overview in Pocono Springs
Per Capita Income in Pocono Springs is $25,461, while median incomes of families and households are $58,221 and $47,434 respectively.
| Characteristic | Number | Measure |
| Per Capita Income | 852 | $25,461 |
| Median Family Income | 193 | $58,221 |
| Mean Family Income | 193 | $74,435 |
| Median Household Income | 288 | $47,434 |
| Mean Household Income | 288 | $64,044 |
| Income Deficit | 193 | $0 |
| Wage / Income Gap (%) | 852 | 0.00% |
| Wage / Income Gap ($) | 852 | 100.00¢ per $1 |
| Gini / Inequality Index | 852 | 0.36 |
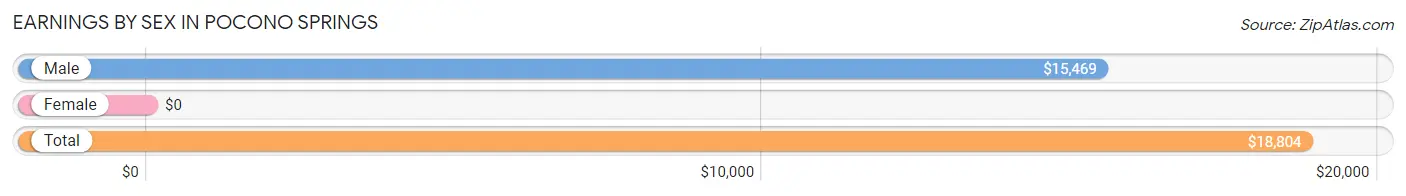
Earnings by Sex in Pocono Springs
| Sex | Number | Average Earnings |
| Male | 157 (44.9%) | $15,469 |
| Female | 193 (55.1%) | $0 |
| Total | 350 (100.0%) | $18,804 |
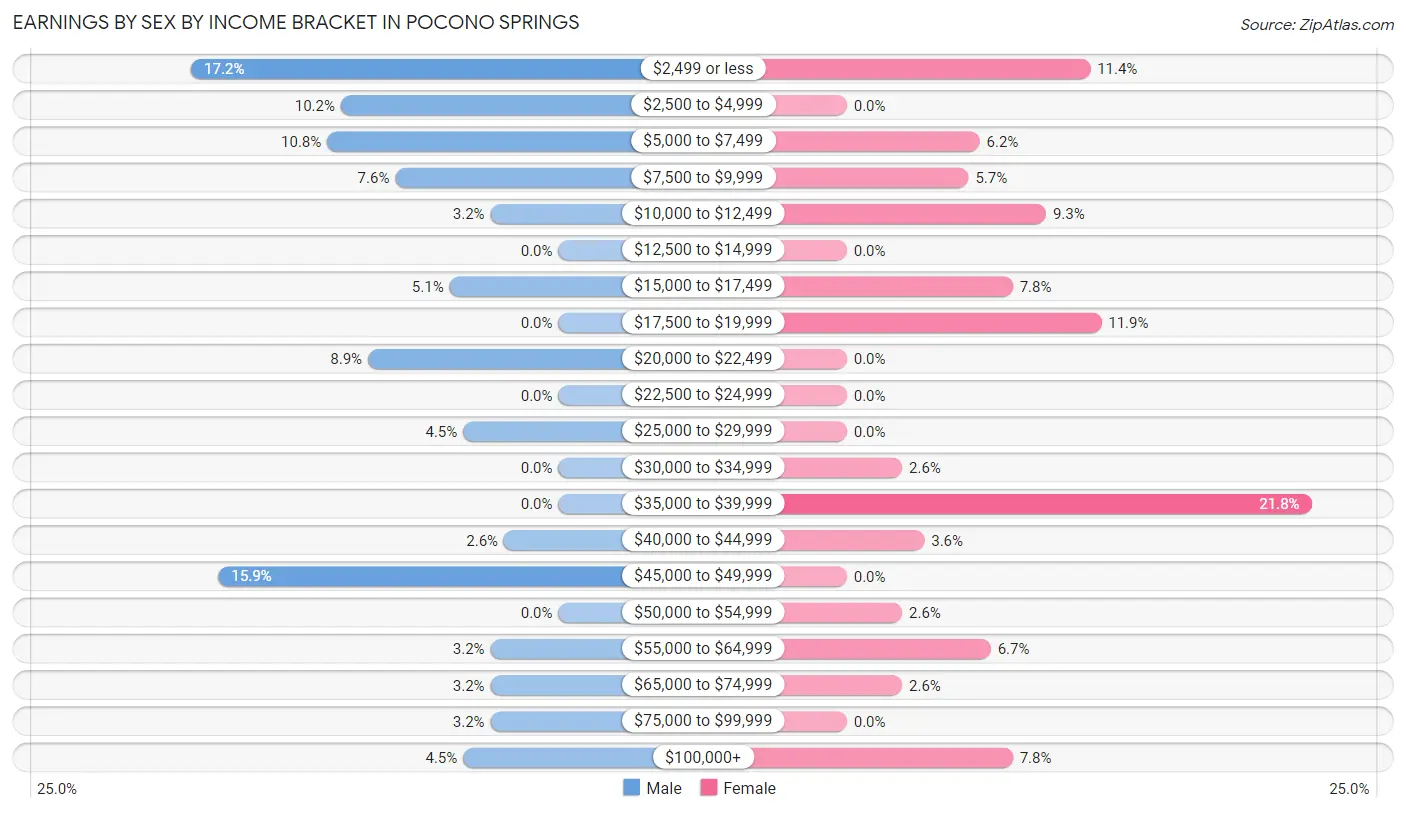
Earnings by Sex by Income Bracket in Pocono Springs
The most common earnings brackets in Pocono Springs are $2,499 or less for men (27 | 17.2%) and $35,000 to $39,999 for women (42 | 21.8%).
| Income | Male | Female |
| $2,499 or less | 27 (17.2%) | 22 (11.4%) |
| $2,500 to $4,999 | 16 (10.2%) | 0 (0.0%) |
| $5,000 to $7,499 | 17 (10.8%) | 12 (6.2%) |
| $7,500 to $9,999 | 12 (7.6%) | 11 (5.7%) |
| $10,000 to $12,499 | 5 (3.2%) | 18 (9.3%) |
| $12,500 to $14,999 | 0 (0.0%) | 0 (0.0%) |
| $15,000 to $17,499 | 8 (5.1%) | 15 (7.8%) |
| $17,500 to $19,999 | 0 (0.0%) | 23 (11.9%) |
| $20,000 to $22,499 | 14 (8.9%) | 0 (0.0%) |
| $22,500 to $24,999 | 0 (0.0%) | 0 (0.0%) |
| $25,000 to $29,999 | 7 (4.5%) | 0 (0.0%) |
| $30,000 to $34,999 | 0 (0.0%) | 5 (2.6%) |
| $35,000 to $39,999 | 0 (0.0%) | 42 (21.8%) |
| $40,000 to $44,999 | 4 (2.5%) | 7 (3.6%) |
| $45,000 to $49,999 | 25 (15.9%) | 0 (0.0%) |
| $50,000 to $54,999 | 0 (0.0%) | 5 (2.6%) |
| $55,000 to $64,999 | 5 (3.2%) | 13 (6.7%) |
| $65,000 to $74,999 | 5 (3.2%) | 5 (2.6%) |
| $75,000 to $99,999 | 5 (3.2%) | 0 (0.0%) |
| $100,000+ | 7 (4.5%) | 15 (7.8%) |
| Total | 157 (100.0%) | 193 (100.0%) |
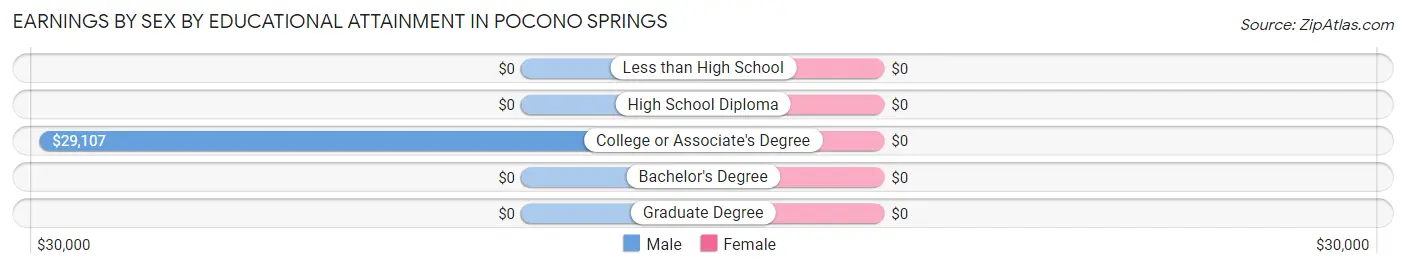
Earnings by Sex by Educational Attainment in Pocono Springs
| Educational Attainment | Male Income | Female Income |
| Less than High School | - | - |
| High School Diploma | - | - |
| College or Associate's Degree | $29,107 | $0 |
| Bachelor's Degree | - | - |
| Graduate Degree | - | - |
| Total | $17,188 | $0 |
Family Income in Pocono Springs
Family Income Brackets in Pocono Springs
According to the Pocono Springs family income data, there are 46 families falling into the $35,000 to $49,999 income range, which is the most common income bracket and makes up 23.8% of all families.
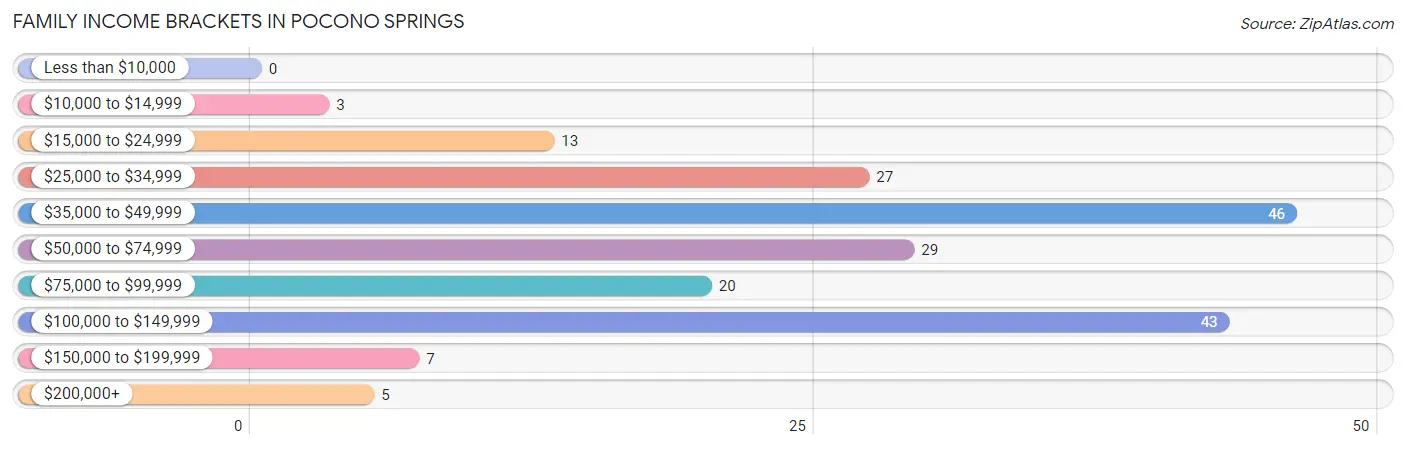
| Income Bracket | # Families | % Families |
| Less than $10,000 | 0 | 0.0% |
| $10,000 to $14,999 | 3 | 1.6% |
| $15,000 to $24,999 | 13 | 6.7% |
| $25,000 to $34,999 | 27 | 14.0% |
| $35,000 to $49,999 | 46 | 23.8% |
| $50,000 to $74,999 | 29 | 15.0% |
| $75,000 to $99,999 | 20 | 10.4% |
| $100,000 to $149,999 | 43 | 22.3% |
| $150,000 to $199,999 | 7 | 3.6% |
| $200,000+ | 5 | 2.6% |
Family Income by Famaliy Size in Pocono Springs
2-person families (110 | 57.0%) account for the highest median family income in Pocono Springs with $66,667 per family, while 2-person families (110 | 57.0%) have the highest median income of $33,334 per family member.
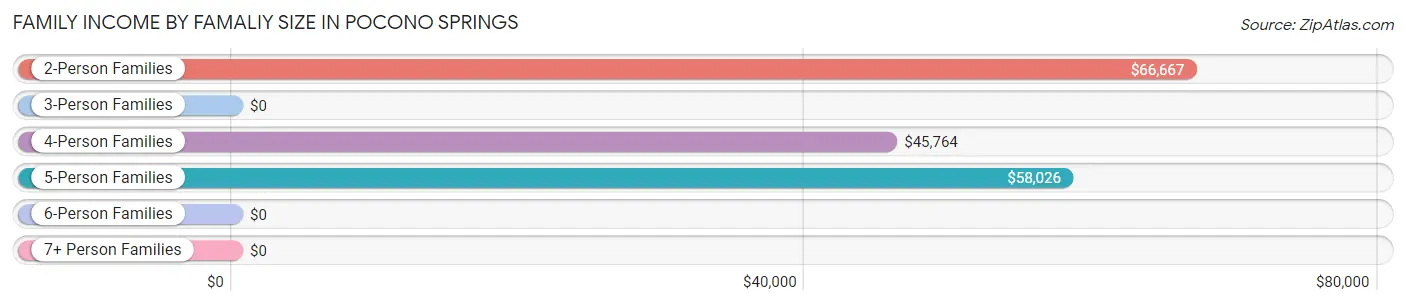
| Income Bracket | # Families | Median Income |
| 2-Person Families | 110 (57.0%) | $66,667 |
| 3-Person Families | 5 (2.6%) | $0 |
| 4-Person Families | 35 (18.1%) | $45,764 |
| 5-Person Families | 34 (17.6%) | $58,026 |
| 6-Person Families | 9 (4.7%) | $0 |
| 7+ Person Families | 0 (0.0%) | $0 |
| Total | 193 (100.0%) | $58,221 |
Family Income by Number of Earners in Pocono Springs
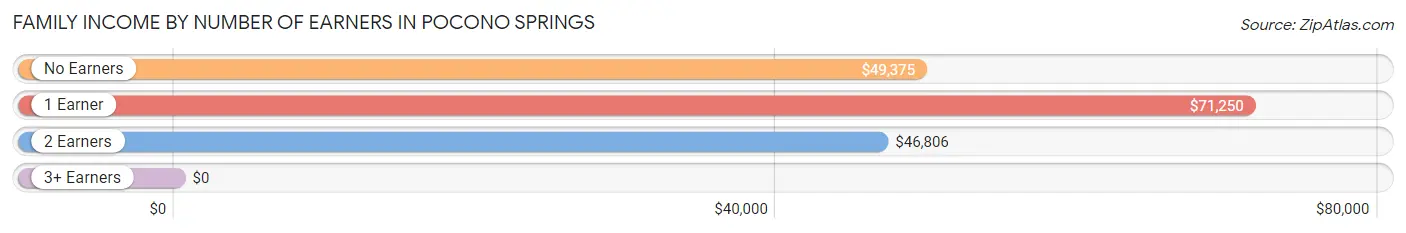
| Number of Earners | # Families | Median Income |
| No Earners | 35 (18.1%) | $49,375 |
| 1 Earner | 84 (43.5%) | $71,250 |
| 2 Earners | 74 (38.3%) | $46,806 |
| 3+ Earners | 0 (0.0%) | $0 |
| Total | 193 (100.0%) | $58,221 |
Household Income in Pocono Springs
Household Income Brackets in Pocono Springs
With 98 households falling in the category, the $35,000 to $49,999 income range is the most frequent in Pocono Springs, accounting for 34.0% of all households. In contrast, only 5 households (1.7%) fall into the $200,000+ income bracket, making it the least populous group.
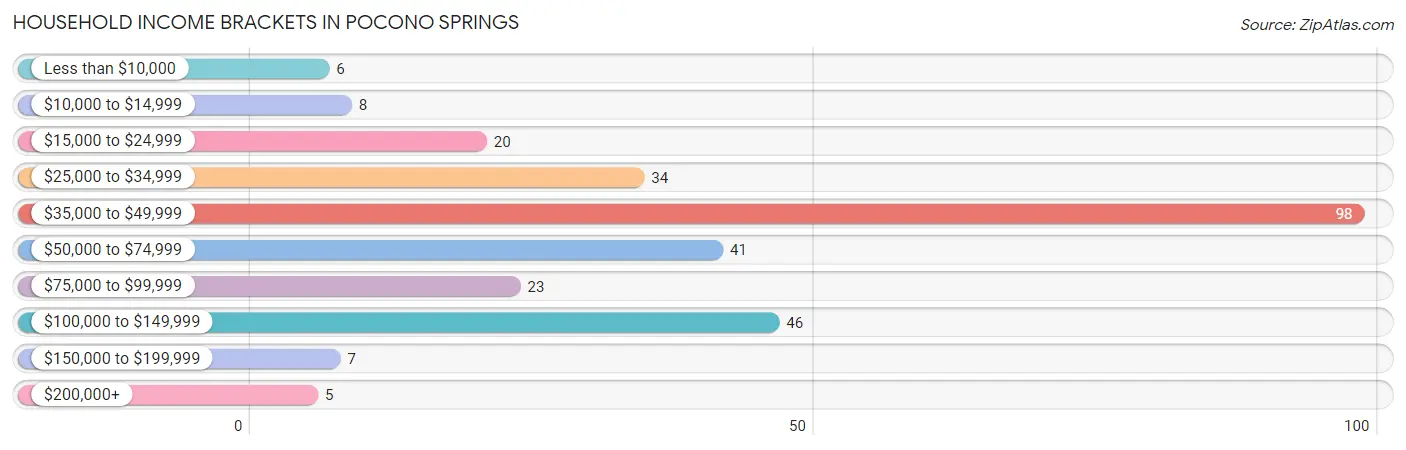
| Income Bracket | # Households | % Households |
| Less than $10,000 | 6 | 2.1% |
| $10,000 to $14,999 | 8 | 2.8% |
| $15,000 to $24,999 | 20 | 6.9% |
| $25,000 to $34,999 | 34 | 11.8% |
| $35,000 to $49,999 | 98 | 34.0% |
| $50,000 to $74,999 | 41 | 14.2% |
| $75,000 to $99,999 | 23 | 8.0% |
| $100,000 to $149,999 | 46 | 16.0% |
| $150,000 to $199,999 | 7 | 2.4% |
| $200,000+ | 5 | 1.7% |
Household Income by Householder Age in Pocono Springs
The median household income in Pocono Springs is $47,434, with the highest median household income of $58,618 found in the 45 to 64 years age bracket for the primary householder. A total of 105 households (36.5%) fall into this category.
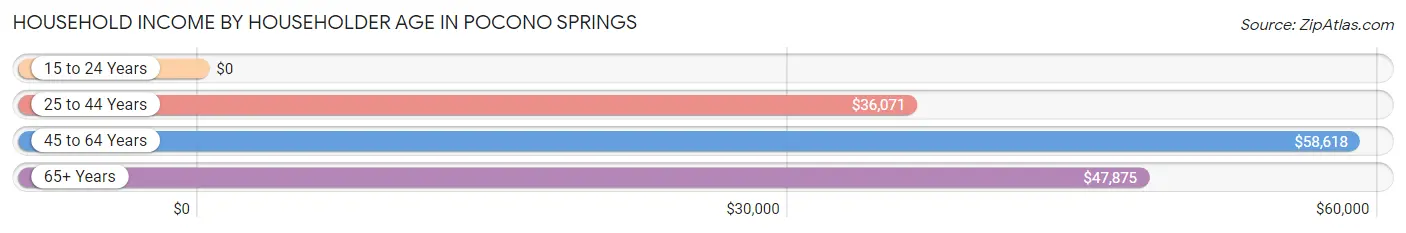
| Income Bracket | # Households | Median Income |
| 15 to 24 Years | 0 (0.0%) | $0 |
| 25 to 44 Years | 54 (18.8%) | $36,071 |
| 45 to 64 Years | 105 (36.5%) | $58,618 |
| 65+ Years | 129 (44.8%) | $47,875 |
| Total | 288 (100.0%) | $47,434 |
Poverty in Pocono Springs
Income Below Poverty by Sex and Age in Pocono Springs
With 22.9% poverty level for males and 20.0% for females among the residents of Pocono Springs, 6 to 11 year old males and 5 year old females are the most vulnerable to poverty, with 15 males (100.0%) and 13 females (100.0%) in their respective age groups living below the poverty level.
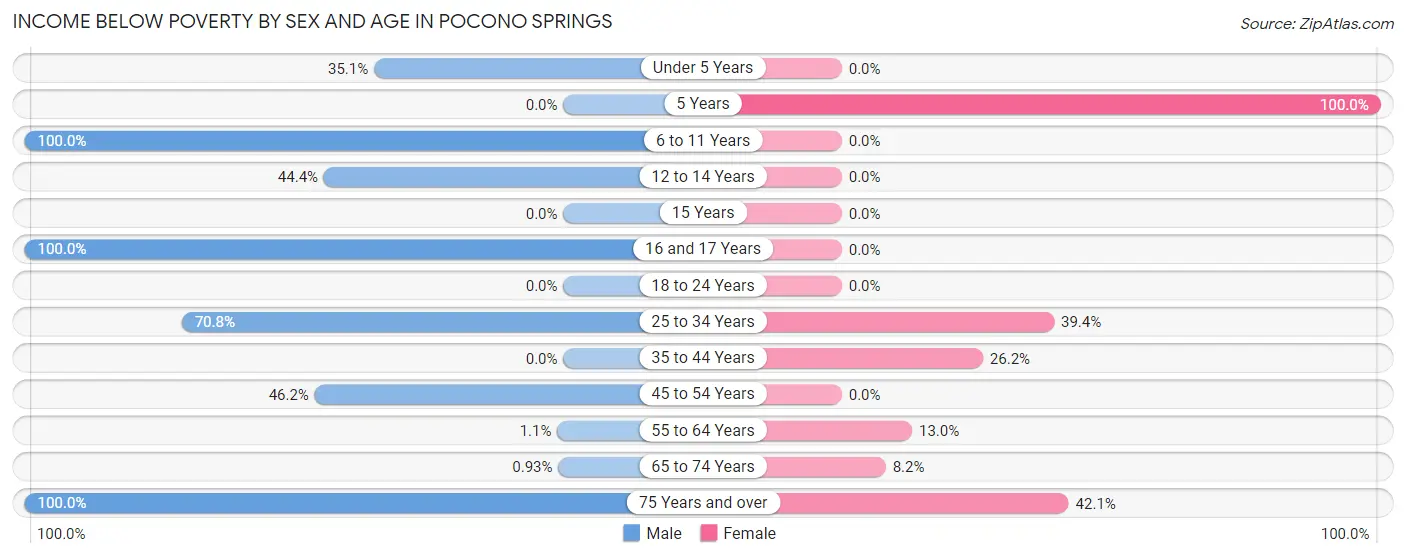
| Age Bracket | Male | Female |
| Under 5 Years | 13 (35.1%) | 0 (0.0%) |
| 5 Years | 0 (0.0%) | 13 (100.0%) |
| 6 to 11 Years | 15 (100.0%) | 0 (0.0%) |
| 12 to 14 Years | 16 (44.4%) | 0 (0.0%) |
| 15 Years | 0 (0.0%) | 0 (0.0%) |
| 16 and 17 Years | 16 (100.0%) | 0 (0.0%) |
| 18 to 24 Years | 0 (0.0%) | 0 (0.0%) |
| 25 to 34 Years | 17 (70.8%) | 26 (39.4%) |
| 35 to 44 Years | 0 (0.0%) | 22 (26.2%) |
| 45 to 54 Years | 6 (46.2%) | 0 (0.0%) |
| 55 to 64 Years | 1 (1.1%) | 12 (13.0%) |
| 65 to 74 Years | 1 (0.9%) | 4 (8.2%) |
| 75 Years and over | 4 (100.0%) | 16 (42.1%) |
| Total | 89 (22.9%) | 93 (20.0%) |
Income Above Poverty by Sex and Age in Pocono Springs
According to the poverty statistics in Pocono Springs, males aged 5 years and females aged 6 to 11 years are the age groups that are most secure financially, with 100.0% of males and 100.0% of females in these age groups living above the poverty line.
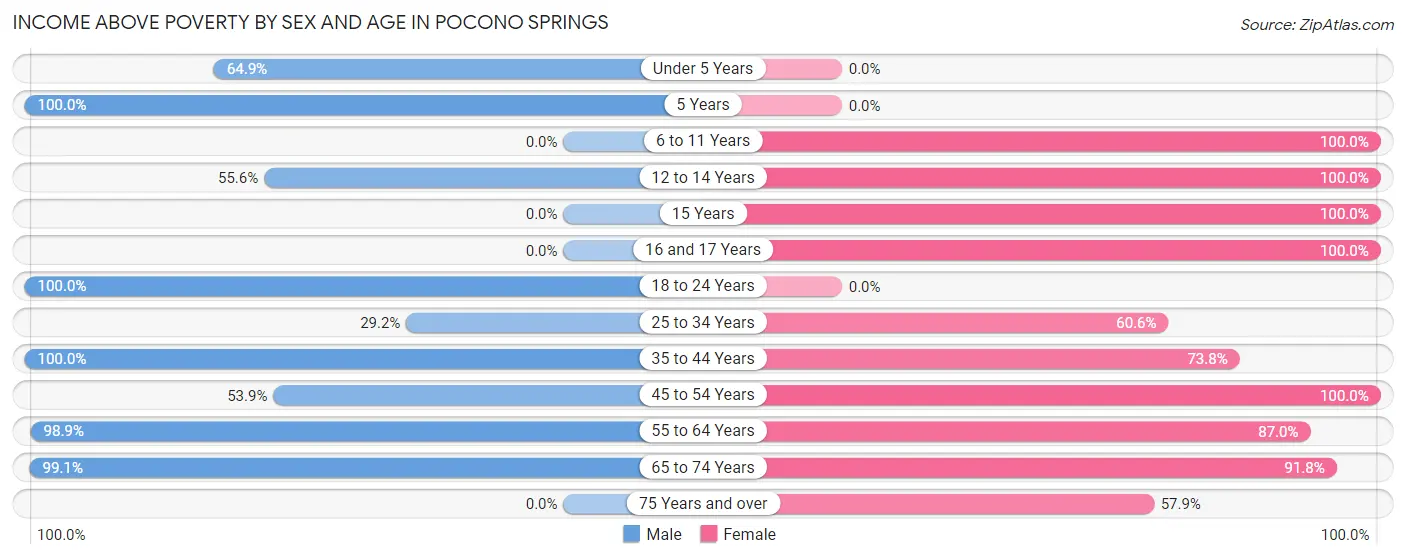
| Age Bracket | Male | Female |
| Under 5 Years | 24 (64.9%) | 0 (0.0%) |
| 5 Years | 2 (100.0%) | 0 (0.0%) |
| 6 to 11 Years | 0 (0.0%) | 52 (100.0%) |
| 12 to 14 Years | 20 (55.6%) | 3 (100.0%) |
| 15 Years | 0 (0.0%) | 28 (100.0%) |
| 16 and 17 Years | 0 (0.0%) | 18 (100.0%) |
| 18 to 24 Years | 11 (100.0%) | 0 (0.0%) |
| 25 to 34 Years | 7 (29.2%) | 40 (60.6%) |
| 35 to 44 Years | 33 (100.0%) | 62 (73.8%) |
| 45 to 54 Years | 7 (53.8%) | 21 (100.0%) |
| 55 to 64 Years | 88 (98.9%) | 80 (87.0%) |
| 65 to 74 Years | 107 (99.1%) | 45 (91.8%) |
| 75 Years and over | 0 (0.0%) | 22 (57.9%) |
| Total | 299 (77.1%) | 371 (80.0%) |
Income Below Poverty Among Married-Couple Families in Pocono Springs
The poverty statistics for married-couple families in Pocono Springs show that 10.1% or 15 of the total 148 families live below the poverty line. Families with 1 or 2 children have the highest poverty rate of 23.5%, comprising of 12 families. On the other hand, families with 3 or 4 children have the lowest poverty rate of 0.0%, which includes 0 families.
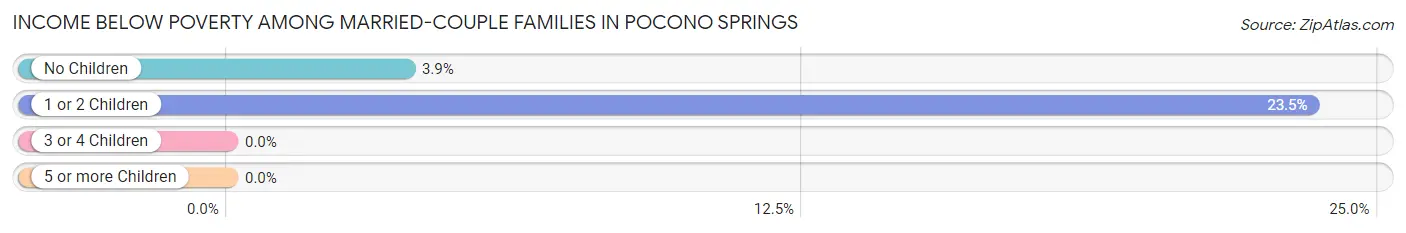
| Children | Above Poverty | Below Poverty |
| No Children | 75 (96.2%) | 3 (3.8%) |
| 1 or 2 Children | 39 (76.5%) | 12 (23.5%) |
| 3 or 4 Children | 19 (100.0%) | 0 (0.0%) |
| 5 or more Children | 0 (0.0%) | 0 (0.0%) |
| Total | 133 (89.9%) | 15 (10.1%) |
Income Below Poverty Among Single-Parent Households in Pocono Springs
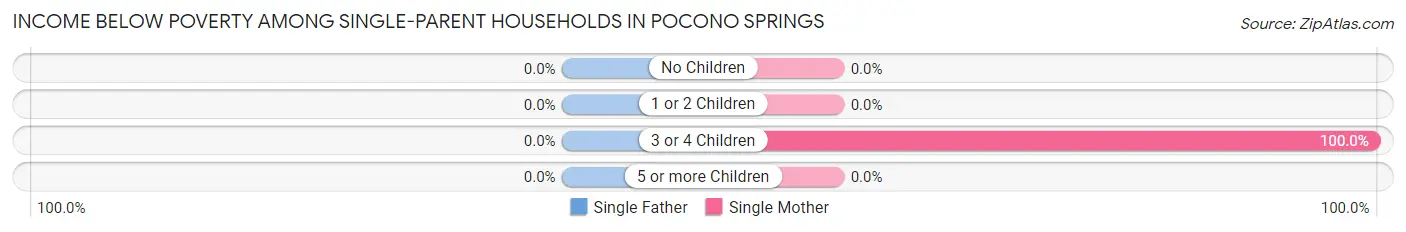
| Children | Single Father | Single Mother |
| No Children | 0 (0.0%) | 0 (0.0%) |
| 1 or 2 Children | 0 (0.0%) | 0 (0.0%) |
| 3 or 4 Children | 0 (0.0%) | 13 (100.0%) |
| 5 or more Children | 0 (0.0%) | 0 (0.0%) |
| Total | 0 (0.0%) | 13 (34.2%) |
Income Below Poverty Among Married-Couple vs Single-Parent Households in Pocono Springs
The poverty data for Pocono Springs shows that 15 of the married-couple family households (10.1%) and 13 of the single-parent households (28.9%) are living below the poverty level. Within the married-couple family households, those with 1 or 2 children have the highest poverty rate, with 12 households (23.5%) falling below the poverty line. Among the single-parent households, those with 3 or 4 children have the highest poverty rate, with 13 household (100.0%) living below poverty.
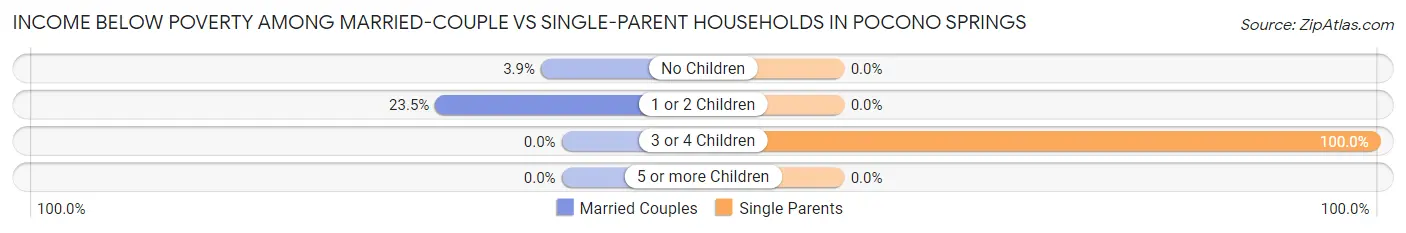
| Children | Married-Couple Families | Single-Parent Households |
| No Children | 3 (3.8%) | 0 (0.0%) |
| 1 or 2 Children | 12 (23.5%) | 0 (0.0%) |
| 3 or 4 Children | 0 (0.0%) | 13 (100.0%) |
| 5 or more Children | 0 (0.0%) | 0 (0.0%) |
| Total | 15 (10.1%) | 13 (28.9%) |
Race in Pocono Springs
The most populous races in Pocono Springs are White / Caucasian (729 | 85.6%), Hispanic or Latino (119 | 14.0%), and Black / African American (79 | 9.3%).
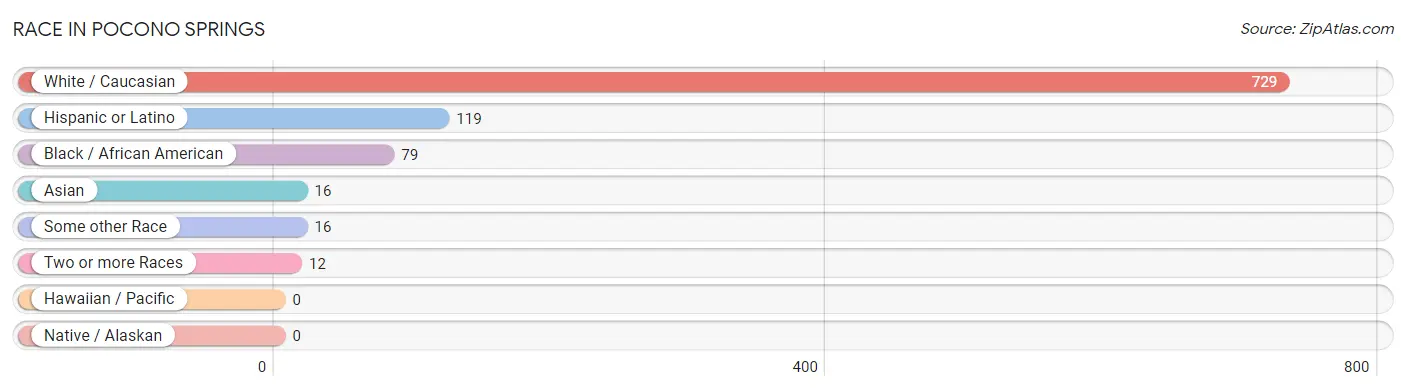
| Race | # Population | % Population |
| Asian | 16 | 1.9% |
| Black / African American | 79 | 9.3% |
| Hawaiian / Pacific | 0 | 0.0% |
| Hispanic or Latino | 119 | 14.0% |
| Native / Alaskan | 0 | 0.0% |
| White / Caucasian | 729 | 85.6% |
| Two or more Races | 12 | 1.4% |
| Some other Race | 16 | 1.9% |
| Total | 852 | 100.0% |
Ancestry in Pocono Springs
The most populous ancestries reported in Pocono Springs are German (302 | 35.4%), Irish (241 | 28.3%), Italian (217 | 25.5%), Polish (79 | 9.3%), and Dominican (66 | 7.7%), together accounting for 106.2% of all Pocono Springs residents.
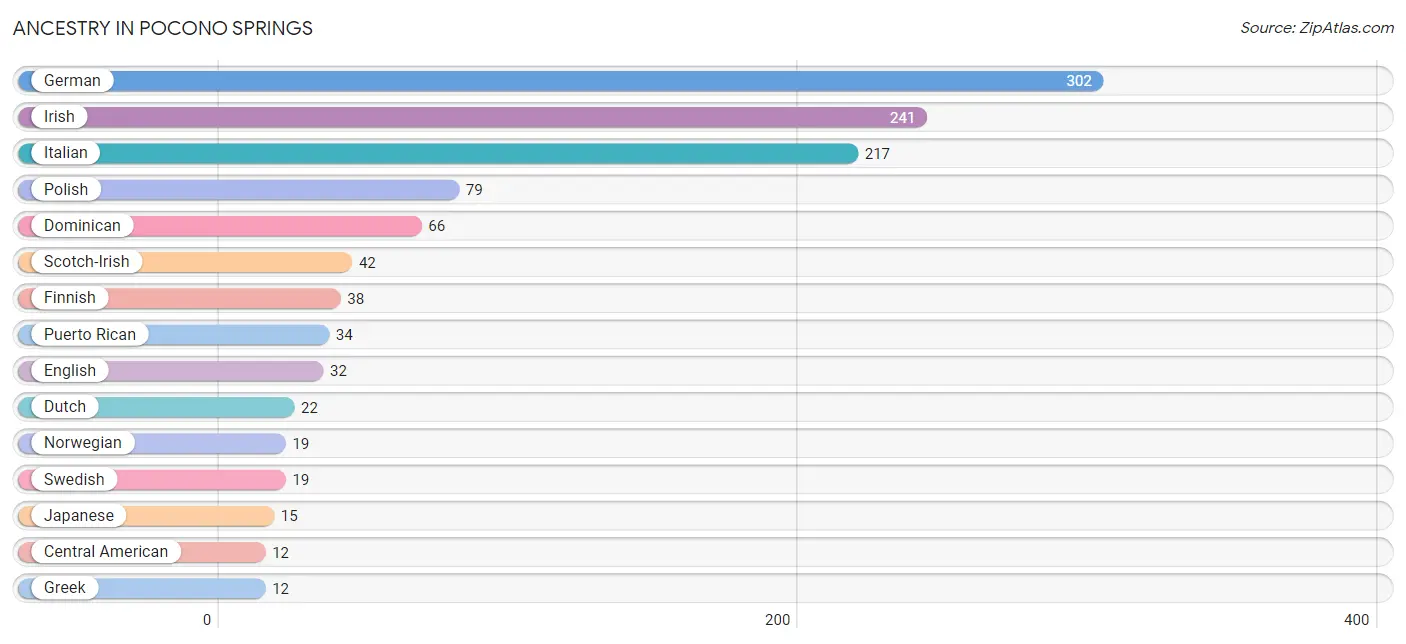
| Ancestry | # Population | % Population |
| American | 3 | 0.4% |
| British West Indian | 7 | 0.8% |
| Burmese | 4 | 0.5% |
| Central American | 12 | 1.4% |
| Dominican | 66 | 7.7% |
| Dutch | 22 | 2.6% |
| English | 32 | 3.8% |
| Finnish | 38 | 4.5% |
| French Canadian | 1 | 0.1% |
| German | 302 | 35.4% |
| Greek | 12 | 1.4% |
| Hungarian | 5 | 0.6% |
| Irish | 241 | 28.3% |
| Italian | 217 | 25.5% |
| Japanese | 15 | 1.8% |
| Norwegian | 19 | 2.2% |
| Panamanian | 12 | 1.4% |
| Pennsylvania German | 3 | 0.4% |
| Polish | 79 | 9.3% |
| Puerto Rican | 34 | 4.0% |
| Russian | 5 | 0.6% |
| Scotch-Irish | 42 | 4.9% |
| Spaniard | 7 | 0.8% |
| Swedish | 19 | 2.2% |
| Welsh | 5 | 0.6% | View All 25 Rows |
Immigrants in Pocono Springs
The most numerous immigrant groups reported in Pocono Springs came from Eastern Europe (32 | 3.8%), Europe (32 | 3.8%), Poland (32 | 3.8%), Latin America (19 | 2.2%), and Asia (16 | 1.9%), together accounting for 15.4% of all Pocono Springs residents.
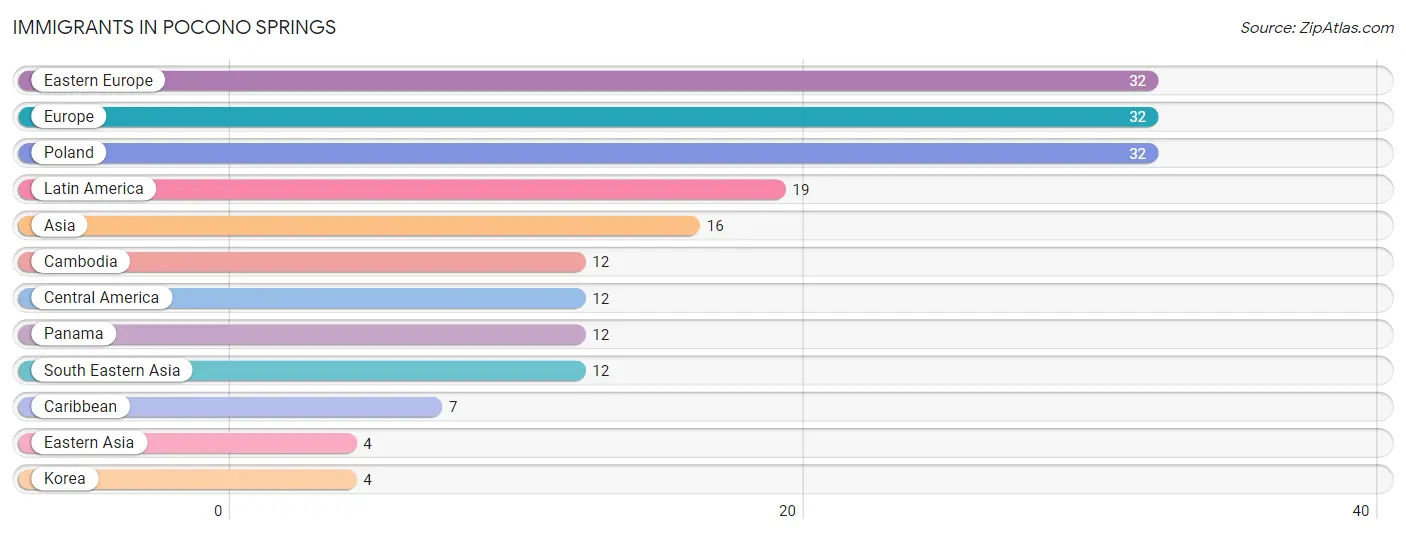
| Immigration Origin | # Population | % Population |
| Asia | 16 | 1.9% |
| Cambodia | 12 | 1.4% |
| Caribbean | 7 | 0.8% |
| Central America | 12 | 1.4% |
| Eastern Asia | 4 | 0.5% |
| Eastern Europe | 32 | 3.8% |
| Europe | 32 | 3.8% |
| Korea | 4 | 0.5% |
| Latin America | 19 | 2.2% |
| Panama | 12 | 1.4% |
| Poland | 32 | 3.8% |
| South Eastern Asia | 12 | 1.4% | View All 12 Rows |
Sex and Age in Pocono Springs
Sex and Age in Pocono Springs
The most populous age groups in Pocono Springs are 65 to 69 Years (73 | 18.8%) for men and 40 to 44 Years (66 | 14.2%) for women.
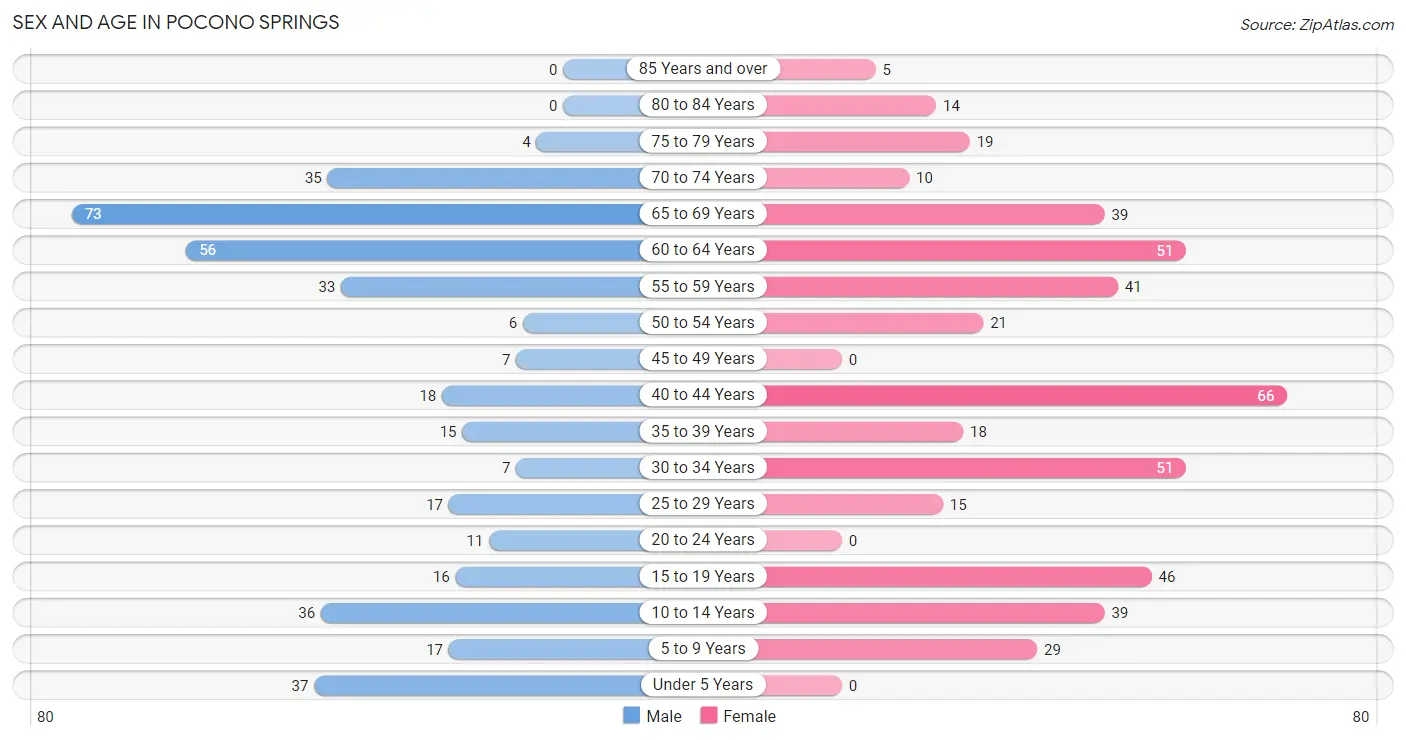
| Age Bracket | Male | Female |
| Under 5 Years | 37 (9.5%) | 0 (0.0%) |
| 5 to 9 Years | 17 (4.4%) | 29 (6.2%) |
| 10 to 14 Years | 36 (9.3%) | 39 (8.4%) |
| 15 to 19 Years | 16 (4.1%) | 46 (9.9%) |
| 20 to 24 Years | 11 (2.8%) | 0 (0.0%) |
| 25 to 29 Years | 17 (4.4%) | 15 (3.2%) |
| 30 to 34 Years | 7 (1.8%) | 51 (11.0%) |
| 35 to 39 Years | 15 (3.9%) | 18 (3.9%) |
| 40 to 44 Years | 18 (4.6%) | 66 (14.2%) |
| 45 to 49 Years | 7 (1.8%) | 0 (0.0%) |
| 50 to 54 Years | 6 (1.5%) | 21 (4.5%) |
| 55 to 59 Years | 33 (8.5%) | 41 (8.8%) |
| 60 to 64 Years | 56 (14.4%) | 51 (11.0%) |
| 65 to 69 Years | 73 (18.8%) | 39 (8.4%) |
| 70 to 74 Years | 35 (9.0%) | 10 (2.2%) |
| 75 to 79 Years | 4 (1.0%) | 19 (4.1%) |
| 80 to 84 Years | 0 (0.0%) | 14 (3.0%) |
| 85 Years and over | 0 (0.0%) | 5 (1.1%) |
| Total | 388 (100.0%) | 464 (100.0%) |
Families and Households in Pocono Springs
Median Family Size in Pocono Springs
The median family size in Pocono Springs is 3.70 persons per family, with single female/mother families (38 | 19.7%) accounting for the largest median family size of 4 persons per family. On the other hand, single male/father families (7 | 3.6%) represent the smallest median family size with 2.57 persons per family.
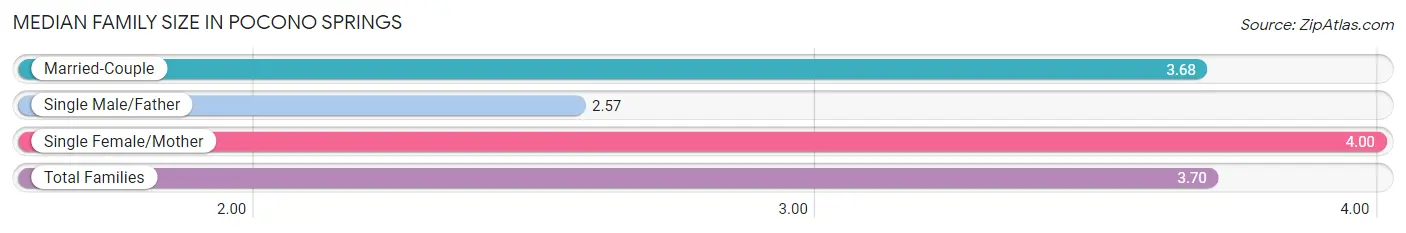
| Family Type | # Families | Family Size |
| Married-Couple | 148 (76.7%) | 3.68 |
| Single Male/Father | 7 (3.6%) | 2.57 |
| Single Female/Mother | 38 (19.7%) | 4.00 |
| Total Families | 193 (100.0%) | 3.70 |
Median Household Size in Pocono Springs
The median household size in Pocono Springs is 2.94 persons per household, with single female/mother households (38 | 13.2%) accounting for the largest median household size of 4.29 persons per household. non-family households (95 | 33.0%) represent the smallest median household size with 1.27 persons per household.
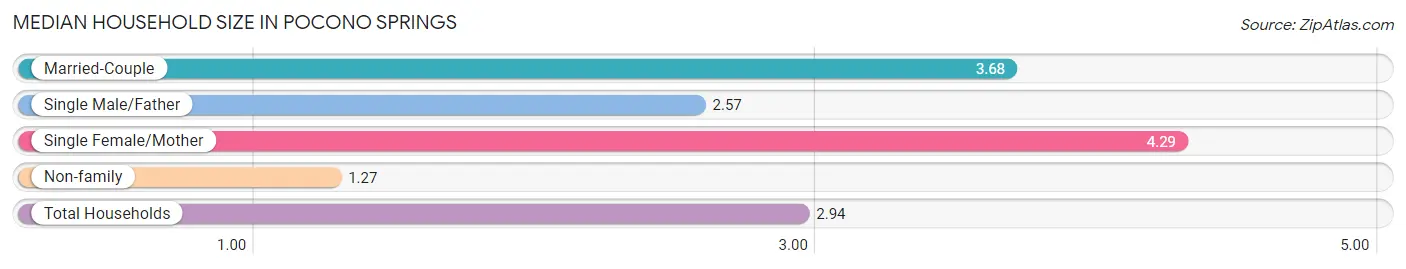
| Household Type | # Households | Household Size |
| Married-Couple | 148 (51.4%) | 3.68 |
| Single Male/Father | 7 (2.4%) | 2.57 |
| Single Female/Mother | 38 (13.2%) | 4.29 |
| Non-family | 95 (33.0%) | 1.27 |
| Total Households | 288 (100.0%) | 2.94 |
Household Size by Marriage Status in Pocono Springs
Out of a total of 288 households in Pocono Springs, 193 (67.0%) are family households, while 95 (33.0%) are nonfamily households. The most numerous type of family households are 2-person households, comprising 103, and the most common type of nonfamily households are 1-person households, comprising 79.

| Household Size | Family Households | Nonfamily Households |
| 1-Person Households | - | 79 (27.4%) |
| 2-Person Households | 103 (35.8%) | 16 (5.6%) |
| 3-Person Households | 12 (4.2%) | 0 (0.0%) |
| 4-Person Households | 35 (12.1%) | 0 (0.0%) |
| 5-Person Households | 34 (11.8%) | 0 (0.0%) |
| 6-Person Households | 9 (3.1%) | 0 (0.0%) |
| 7+ Person Households | 0 (0.0%) | 0 (0.0%) |
| Total | 193 (67.0%) | 95 (33.0%) |
Female Fertility in Pocono Springs
Fertility by Age in Pocono Springs
Average fertility rate in Pocono Springs is 102.0 births per 1,000 women. Women in the age bracket of 35 to 50 years have the highest fertility rate with 226.0 births per 1,000 women. Women in the age bracket of 35 to 50 years acount for 100.0% of all women with births.
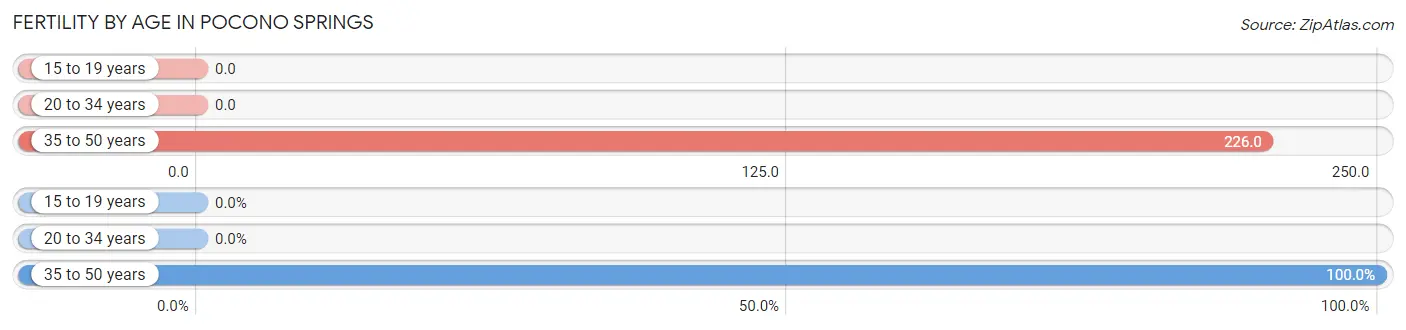
| Age Bracket | Women with Births | Births / 1,000 Women |
| 15 to 19 years | 0 (0.0%) | 0.0 |
| 20 to 34 years | 0 (0.0%) | 0.0 |
| 35 to 50 years | 21 (100.0%) | 226.0 |
| Total | 21 (100.0%) | 102.0 |
Fertility by Age by Marriage Status in Pocono Springs
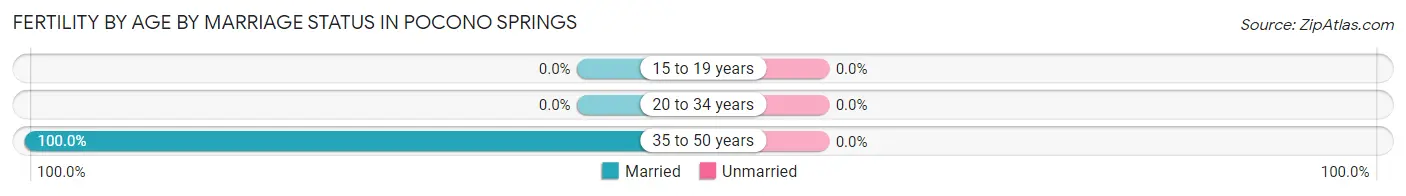
| Age Bracket | Married | Unmarried |
| 15 to 19 years | 0 (0.0%) | 0 (0.0%) |
| 20 to 34 years | 0 (0.0%) | 0 (0.0%) |
| 35 to 50 years | 21 (100.0%) | 0 (0.0%) |
| Total | 21 (100.0%) | 0 (0.0%) |
Fertility by Education in Pocono Springs
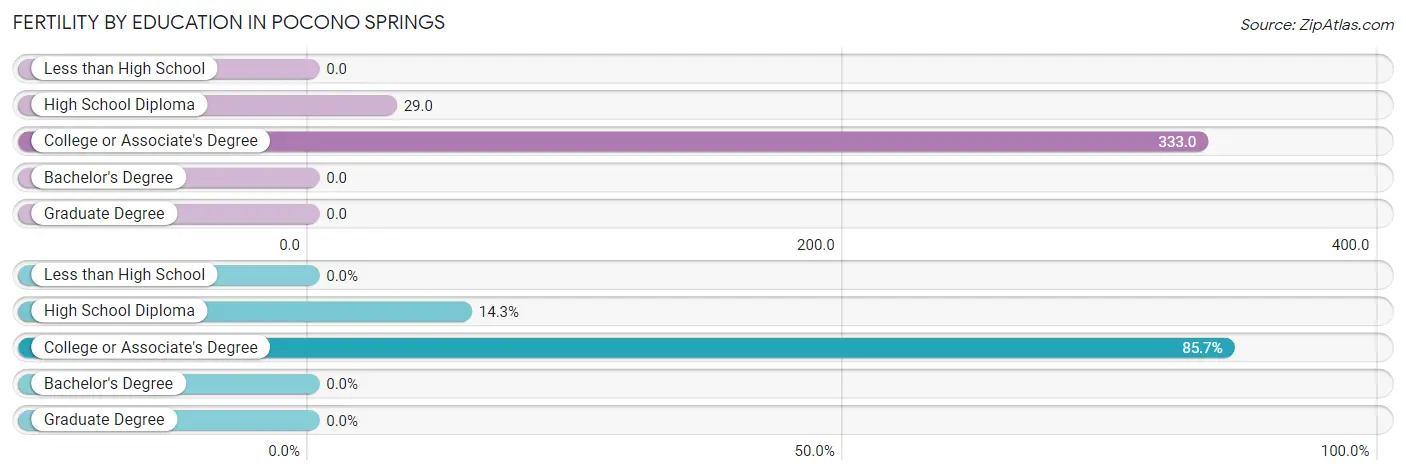
| Educational Attainment | Women with Births | Births / 1,000 Women |
| Less than High School | 0 (0.0%) | 0.0 |
| High School Diploma | 3 (14.3%) | 29.0 |
| College or Associate's Degree | 18 (85.7%) | 333.0 |
| Bachelor's Degree | 0 (0.0%) | 0.0 |
| Graduate Degree | 0 (0.0%) | 0.0 |
| Total | 21 (100.0%) | 102.0 |
Fertility by Education by Marriage Status in Pocono Springs
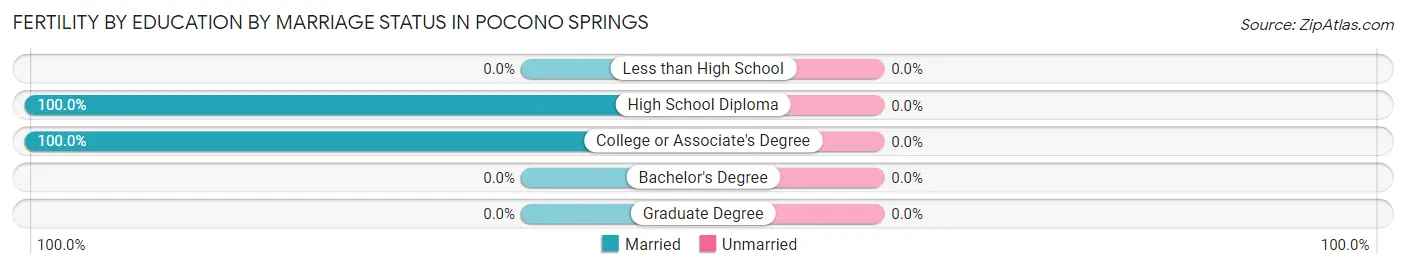
| Educational Attainment | Married | Unmarried |
| Less than High School | 0 (0.0%) | 0 (0.0%) |
| High School Diploma | 3 (100.0%) | 0 (0.0%) |
| College or Associate's Degree | 18 (100.0%) | 0 (0.0%) |
| Bachelor's Degree | 0 (0.0%) | 0 (0.0%) |
| Graduate Degree | 0 (0.0%) | 0 (0.0%) |
| Total | 21 (100.0%) | 0 (0.0%) |
Employment Characteristics in Pocono Springs
Employment by Class of Employer in Pocono Springs
Among the 247 employed individuals in Pocono Springs, private company employees (151 | 61.1%), not-for-profit organizations (28 | 11.3%), and state government employees (25 | 10.1%) make up the most common classes of employment.
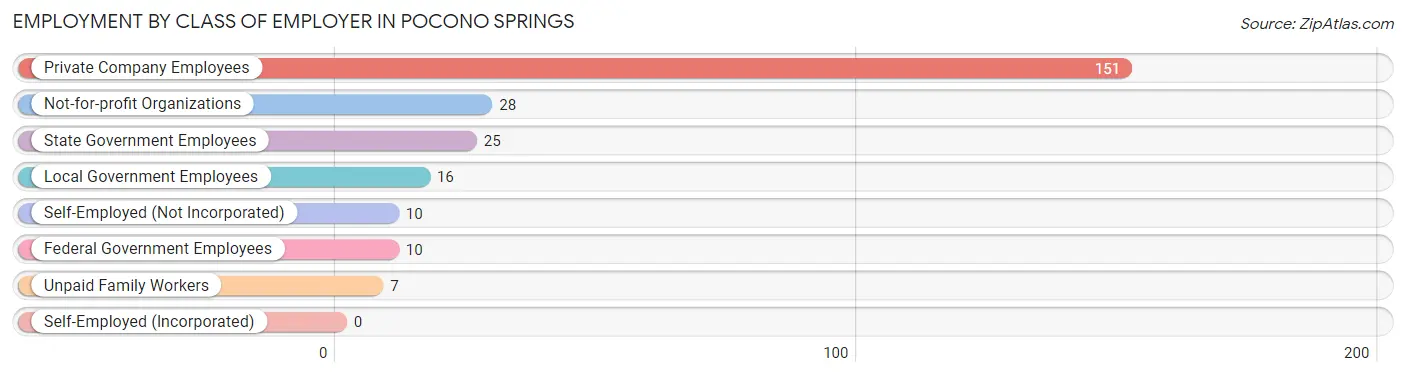
| Employer Class | # Employees | % Employees |
| Private Company Employees | 151 | 61.1% |
| Self-Employed (Incorporated) | 0 | 0.0% |
| Self-Employed (Not Incorporated) | 10 | 4.1% |
| Not-for-profit Organizations | 28 | 11.3% |
| Local Government Employees | 16 | 6.5% |
| State Government Employees | 25 | 10.1% |
| Federal Government Employees | 10 | 4.1% |
| Unpaid Family Workers | 7 | 2.8% |
| Total | 247 | 100.0% |
Employment Status by Age in Pocono Springs
According to the labor force statistics for Pocono Springs, out of the total population over 16 years of age (666), 44.4% or 296 individuals are in the labor force, with 12.8% or 38 of them unemployed. The age group with the highest labor force participation rate is 20 to 24 years, with 100.0% or 11 individuals in the labor force. Within the labor force, the 16 to 19 years age range has the highest percentage of unemployed individuals, with 100.0% or 16 of them being unemployed.
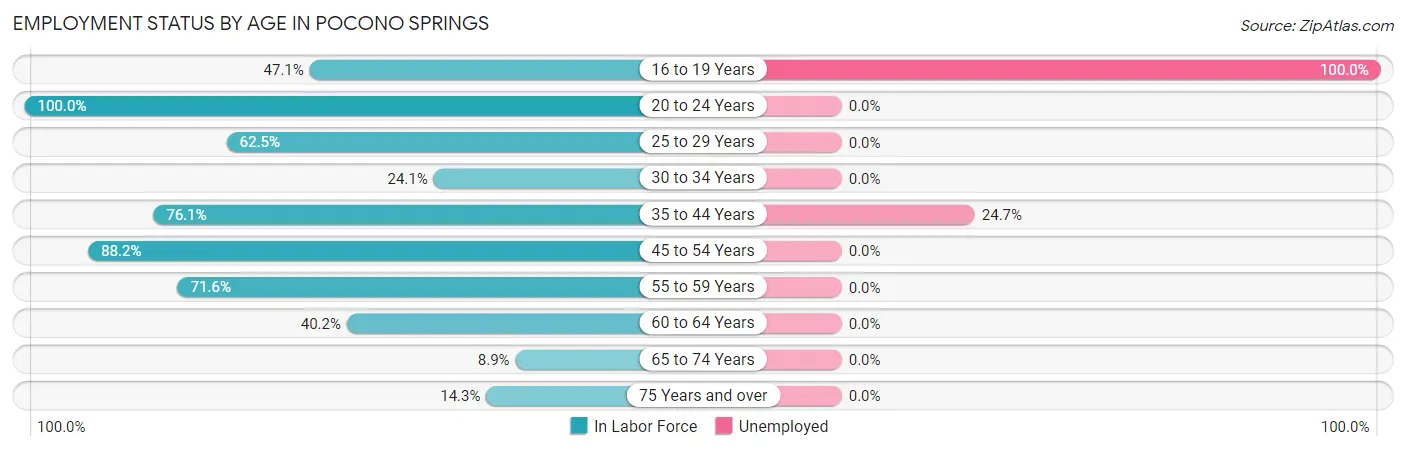
| Age Bracket | In Labor Force | Unemployed |
| 16 to 19 Years | 16 (47.1%) | 16 (100.0%) |
| 20 to 24 Years | 11 (100.0%) | 0 (0.0%) |
| 25 to 29 Years | 20 (62.5%) | 0 (0.0%) |
| 30 to 34 Years | 14 (24.1%) | 0 (0.0%) |
| 35 to 44 Years | 89 (76.1%) | 22 (24.7%) |
| 45 to 54 Years | 30 (88.2%) | 0 (0.0%) |
| 55 to 59 Years | 53 (71.6%) | 0 (0.0%) |
| 60 to 64 Years | 43 (40.2%) | 0 (0.0%) |
| 65 to 74 Years | 14 (8.9%) | 0 (0.0%) |
| 75 Years and over | 6 (14.3%) | 0 (0.0%) |
| Total | 296 (44.4%) | 38 (12.8%) |
Employment Status by Educational Attainment in Pocono Springs
According to labor force statistics for Pocono Springs, 59.0% of individuals (249) out of the total population between 25 and 64 years of age (422) are in the labor force, with 8.8% or 22 of them being unemployed. The group with the highest labor force participation rate are those with the educational attainment of bachelor's degree or higher, with 100.0% or 22 individuals in the labor force. Within the labor force, individuals with high school diploma education have the highest percentage of unemployment, with 17.1% or 22 of them being unemployed.
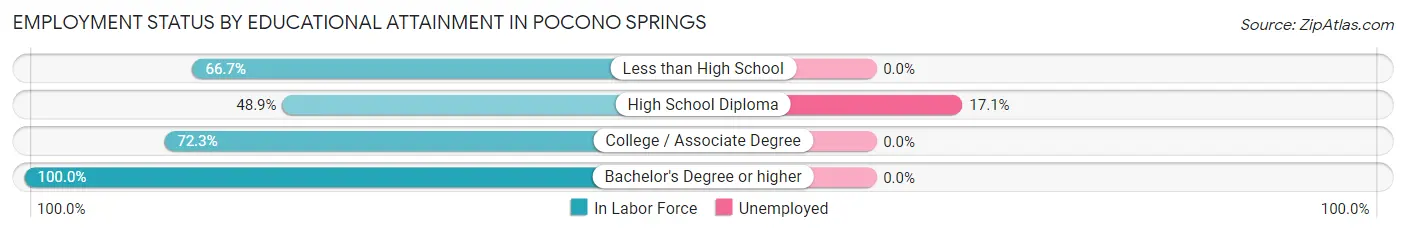
| Educational Attainment | In Labor Force | Unemployed |
| Less than High School | 4 (66.7%) | 0 (0.0%) |
| High School Diploma | 129 (48.9%) | 45 (17.1%) |
| College / Associate Degree | 94 (72.3%) | 0 (0.0%) |
| Bachelor's Degree or higher | 22 (100.0%) | 0 (0.0%) |
| Total | 249 (59.0%) | 37 (8.8%) |
Employment Occupations by Sex in Pocono Springs
Management, Business, Science and Arts Occupations
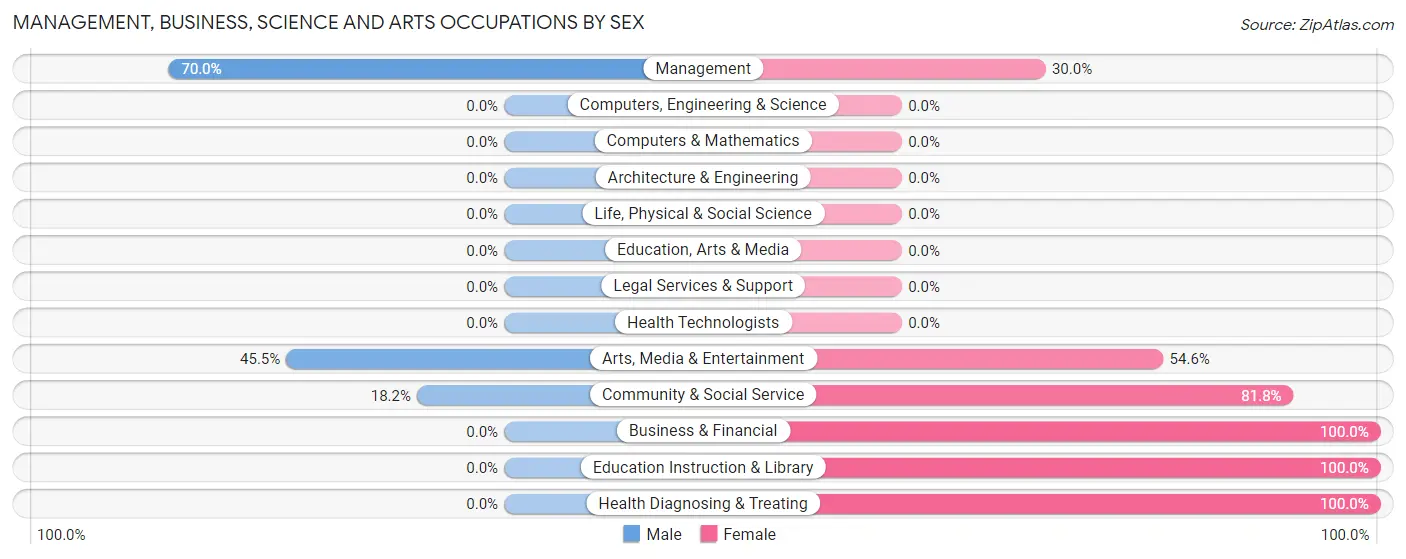
The most common Management, Business, Science and Arts occupations in Pocono Springs are Community & Social Service (55 | 21.3%), Education Instruction & Library (33 | 12.8%), Arts, Media & Entertainment (22 | 8.5%), Management (10 | 3.9%), and Health Diagnosing & Treating (10 | 3.9%).
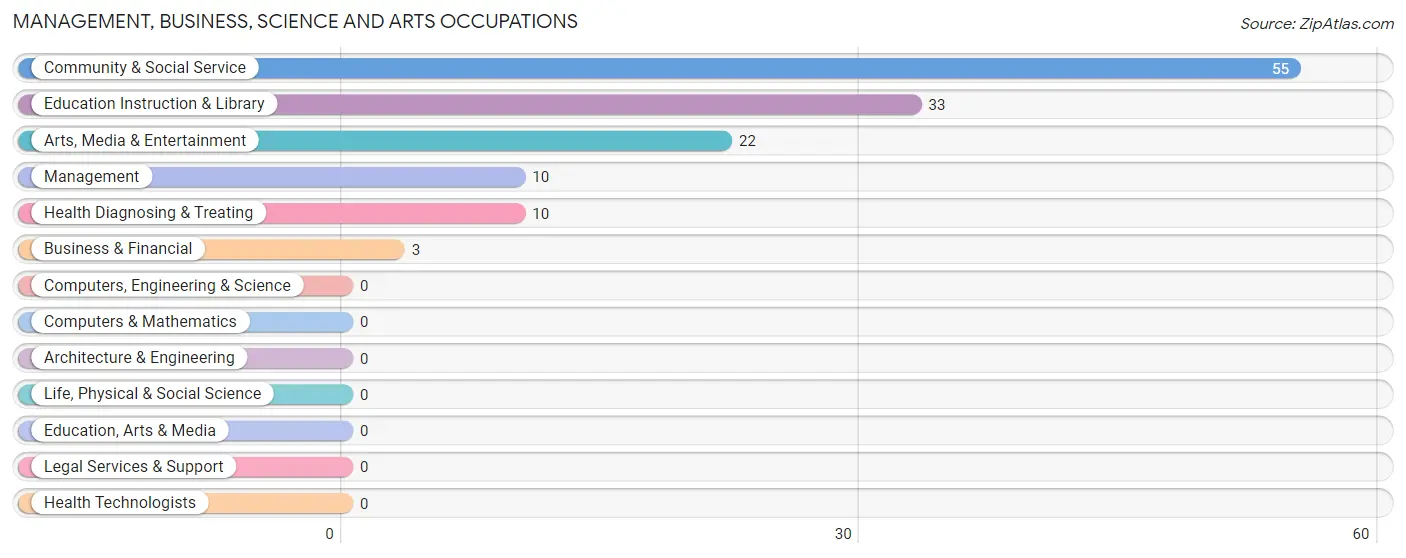
Management, Business, Science and Arts Occupations by Sex
Within the Management, Business, Science and Arts occupations in Pocono Springs, the most male-oriented occupations are Management (70.0%), Arts, Media & Entertainment (45.5%), and Community & Social Service (18.2%), while the most female-oriented occupations are Business & Financial (100.0%), Education Instruction & Library (100.0%), and Health Diagnosing & Treating (100.0%).
| Occupation | Male | Female |
| Management | 7 (70.0%) | 3 (30.0%) |
| Business & Financial | 0 (0.0%) | 3 (100.0%) |
| Computers, Engineering & Science | 0 (0.0%) | 0 (0.0%) |
| Computers & Mathematics | 0 (0.0%) | 0 (0.0%) |
| Architecture & Engineering | 0 (0.0%) | 0 (0.0%) |
| Life, Physical & Social Science | 0 (0.0%) | 0 (0.0%) |
| Community & Social Service | 10 (18.2%) | 45 (81.8%) |
| Education, Arts & Media | 0 (0.0%) | 0 (0.0%) |
| Legal Services & Support | 0 (0.0%) | 0 (0.0%) |
| Education Instruction & Library | 0 (0.0%) | 33 (100.0%) |
| Arts, Media & Entertainment | 10 (45.5%) | 12 (54.5%) |
| Health Diagnosing & Treating | 0 (0.0%) | 10 (100.0%) |
| Health Technologists | 0 (0.0%) | 0 (0.0%) |
| Total (Category) | 17 (21.8%) | 61 (78.2%) |
| Total (Overall) | 105 (40.7%) | 153 (59.3%) |
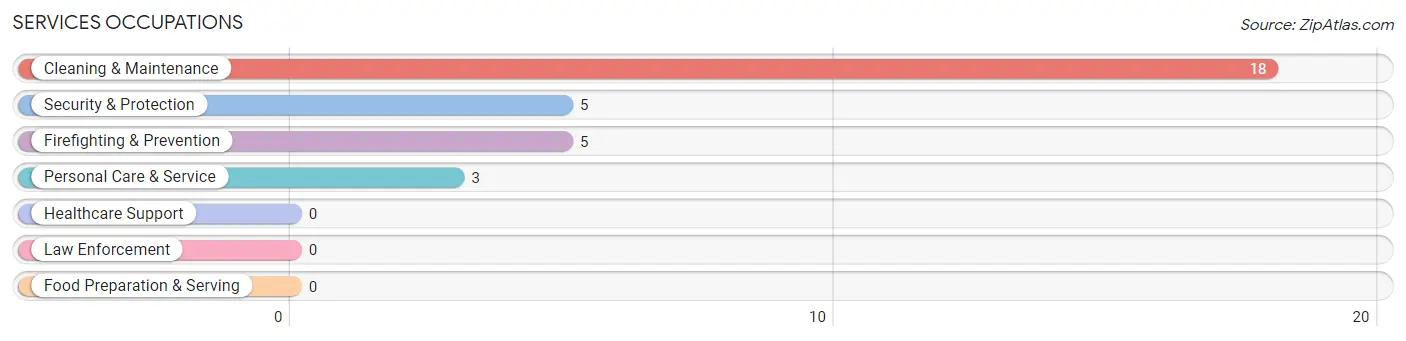
Services Occupations
The most common Services occupations in Pocono Springs are Cleaning & Maintenance (18 | 7.0%), Security & Protection (5 | 1.9%), Firefighting & Prevention (5 | 1.9%), and Personal Care & Service (3 | 1.2%).
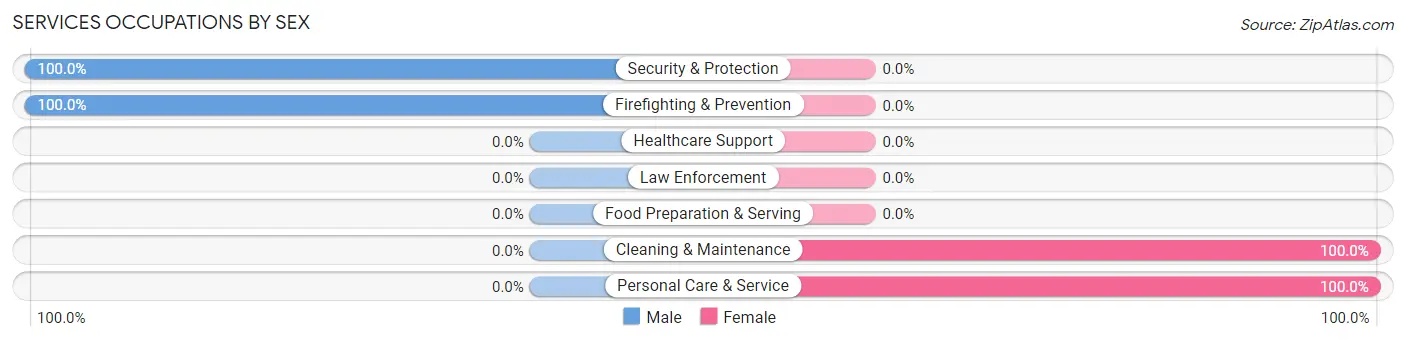
Services Occupations by Sex
Within the Services occupations in Pocono Springs, the most male-oriented occupations are Security & Protection (100.0%), and Firefighting & Prevention (100.0%), while the most female-oriented occupations are Cleaning & Maintenance (100.0%), and Personal Care & Service (100.0%).
| Occupation | Male | Female |
| Healthcare Support | 0 (0.0%) | 0 (0.0%) |
| Security & Protection | 5 (100.0%) | 0 (0.0%) |
| Firefighting & Prevention | 5 (100.0%) | 0 (0.0%) |
| Law Enforcement | 0 (0.0%) | 0 (0.0%) |
| Food Preparation & Serving | 0 (0.0%) | 0 (0.0%) |
| Cleaning & Maintenance | 0 (0.0%) | 18 (100.0%) |
| Personal Care & Service | 0 (0.0%) | 3 (100.0%) |
| Total (Category) | 5 (19.2%) | 21 (80.8%) |
| Total (Overall) | 105 (40.7%) | 153 (59.3%) |
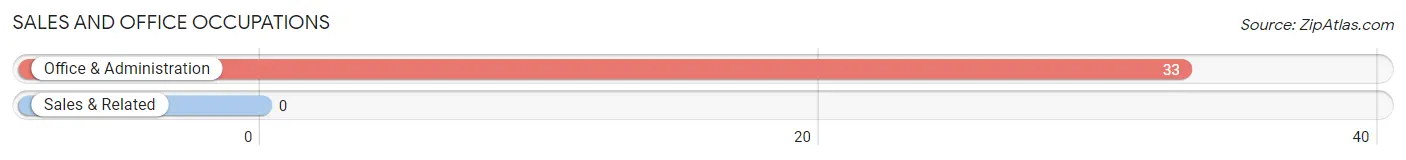
Sales and Office Occupations
The most common Sales and Office occupations in Pocono Springs are , and Office & Administration (33 | 12.8%).
Sales and Office Occupations by Sex
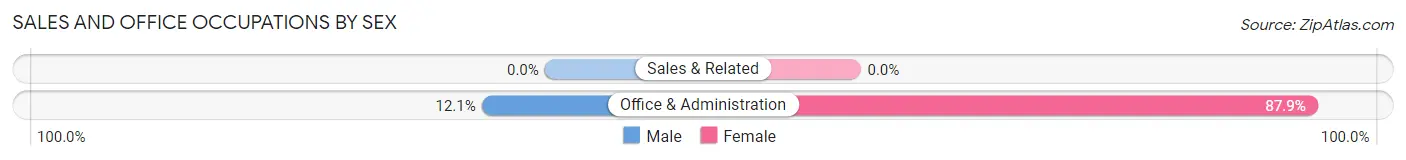
| Occupation | Male | Female |
| Sales & Related | 0 (0.0%) | 0 (0.0%) |
| Office & Administration | 4 (12.1%) | 29 (87.9%) |
| Total (Category) | 4 (12.1%) | 29 (87.9%) |
| Total (Overall) | 105 (40.7%) | 153 (59.3%) |
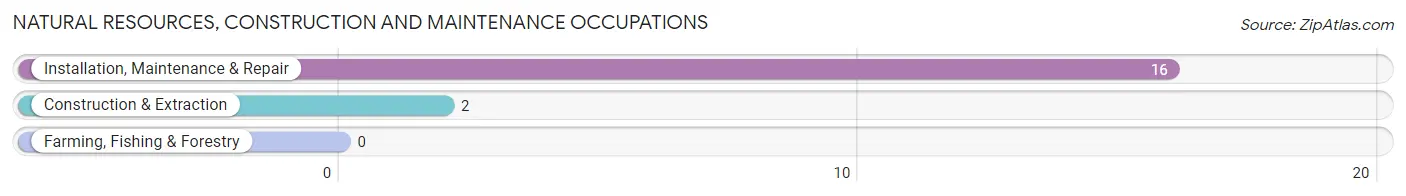
Natural Resources, Construction and Maintenance Occupations
The most common Natural Resources, Construction and Maintenance occupations in Pocono Springs are Installation, Maintenance & Repair (16 | 6.2%), and Construction & Extraction (2 | 0.8%).
Natural Resources, Construction and Maintenance Occupations by Sex
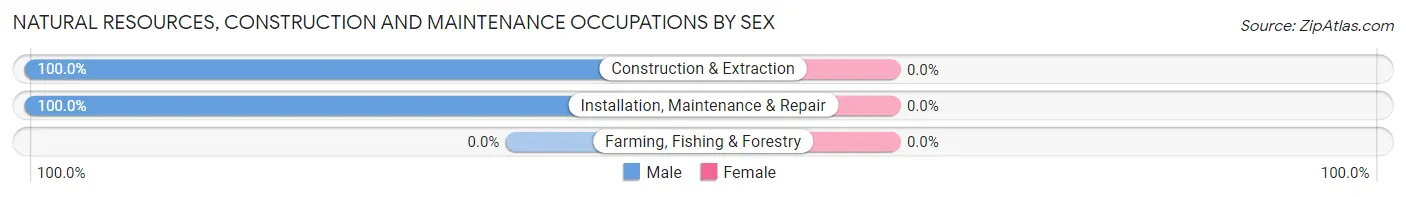
| Occupation | Male | Female |
| Farming, Fishing & Forestry | 0 (0.0%) | 0 (0.0%) |
| Construction & Extraction | 2 (100.0%) | 0 (0.0%) |
| Installation, Maintenance & Repair | 16 (100.0%) | 0 (0.0%) |
| Total (Category) | 18 (100.0%) | 0 (0.0%) |
| Total (Overall) | 105 (40.7%) | 153 (59.3%) |
Production, Transportation and Moving Occupations
The most common Production, Transportation and Moving occupations in Pocono Springs are Material Moving (53 | 20.5%), Transportation (39 | 15.1%), and Production (11 | 4.3%).
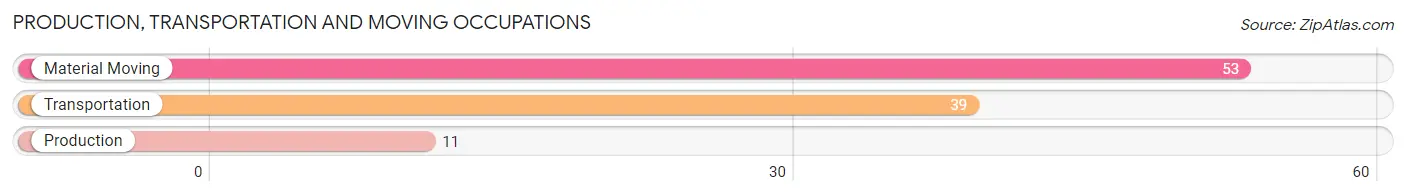
Production, Transportation and Moving Occupations by Sex
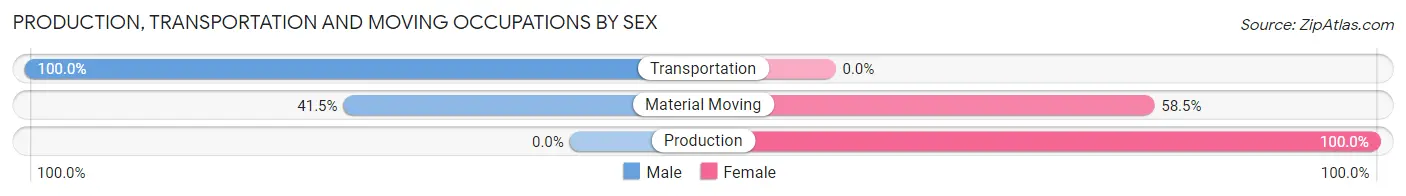
| Occupation | Male | Female |
| Production | 0 (0.0%) | 11 (100.0%) |
| Transportation | 39 (100.0%) | 0 (0.0%) |
| Material Moving | 22 (41.5%) | 31 (58.5%) |
| Total (Category) | 61 (59.2%) | 42 (40.8%) |
| Total (Overall) | 105 (40.7%) | 153 (59.3%) |
Employment Industries by Sex in Pocono Springs
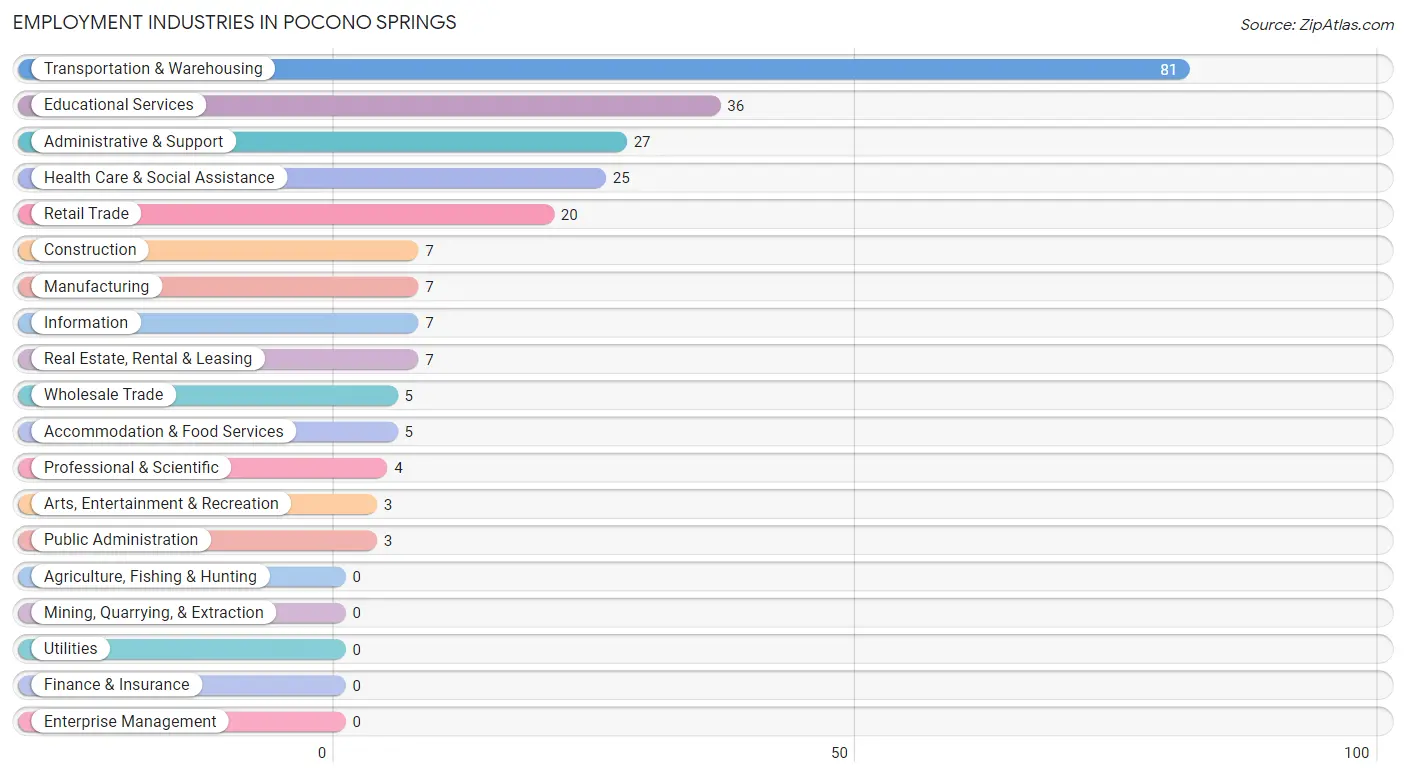
Employment Industries in Pocono Springs
The major employment industries in Pocono Springs include Transportation & Warehousing (81 | 31.4%), Educational Services (36 | 14.0%), Administrative & Support (27 | 10.5%), Health Care & Social Assistance (25 | 9.7%), and Retail Trade (20 | 7.7%).
Employment Industries by Sex in Pocono Springs
The Pocono Springs industries that see more men than women are Construction (100.0%), Wholesale Trade (100.0%), and Information (100.0%), whereas the industries that tend to have a higher number of women are Manufacturing (100.0%), Professional & Scientific (100.0%), and Educational Services (100.0%).
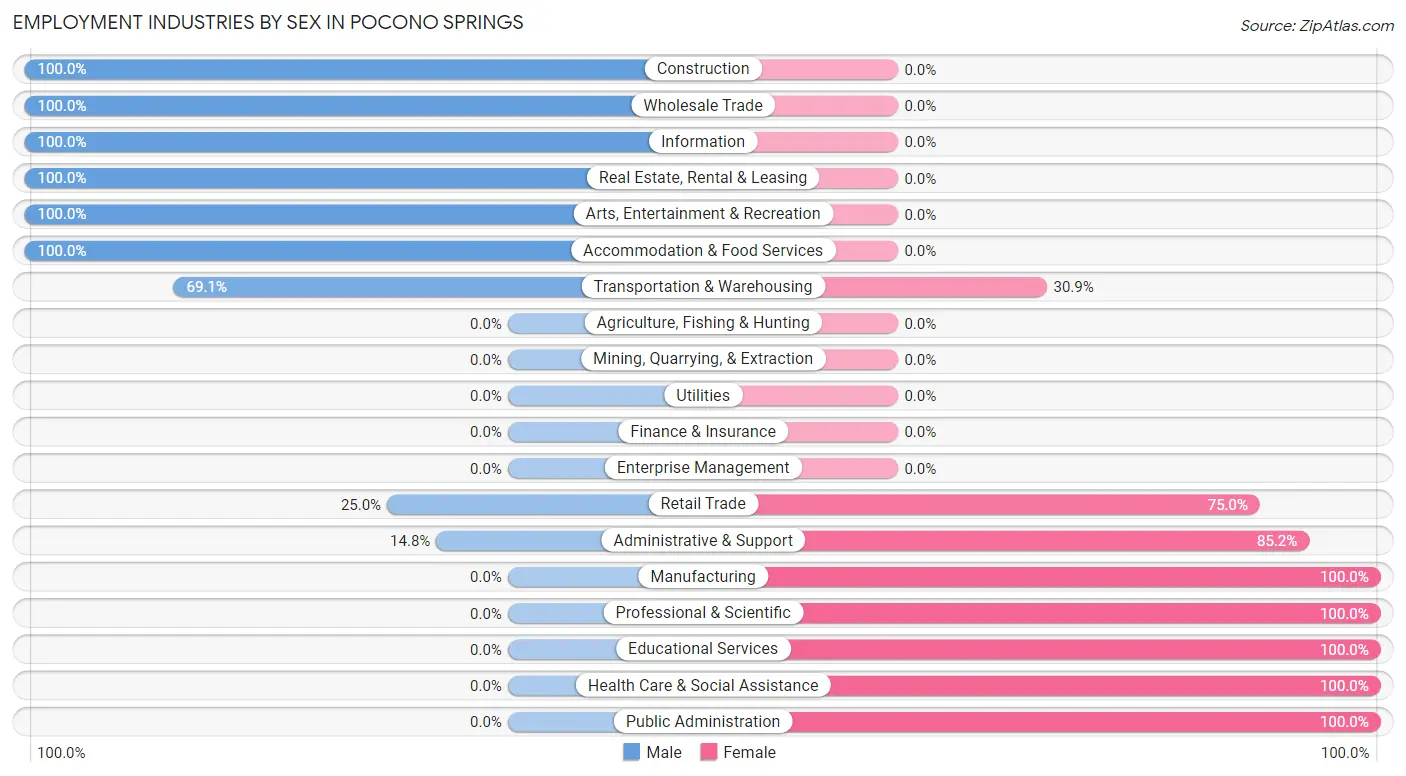
| Industry | Male | Female |
| Agriculture, Fishing & Hunting | 0 (0.0%) | 0 (0.0%) |
| Mining, Quarrying, & Extraction | 0 (0.0%) | 0 (0.0%) |
| Construction | 7 (100.0%) | 0 (0.0%) |
| Manufacturing | 0 (0.0%) | 7 (100.0%) |
| Wholesale Trade | 5 (100.0%) | 0 (0.0%) |
| Retail Trade | 5 (25.0%) | 15 (75.0%) |
| Transportation & Warehousing | 56 (69.1%) | 25 (30.9%) |
| Utilities | 0 (0.0%) | 0 (0.0%) |
| Information | 7 (100.0%) | 0 (0.0%) |
| Finance & Insurance | 0 (0.0%) | 0 (0.0%) |
| Real Estate, Rental & Leasing | 7 (100.0%) | 0 (0.0%) |
| Professional & Scientific | 0 (0.0%) | 4 (100.0%) |
| Enterprise Management | 0 (0.0%) | 0 (0.0%) |
| Administrative & Support | 4 (14.8%) | 23 (85.2%) |
| Educational Services | 0 (0.0%) | 36 (100.0%) |
| Health Care & Social Assistance | 0 (0.0%) | 25 (100.0%) |
| Arts, Entertainment & Recreation | 3 (100.0%) | 0 (0.0%) |
| Accommodation & Food Services | 5 (100.0%) | 0 (0.0%) |
| Public Administration | 0 (0.0%) | 3 (100.0%) |
| Total | 105 (40.7%) | 153 (59.3%) |
Education in Pocono Springs
School Enrollment in Pocono Springs
The most common levels of schooling among the 194 students in Pocono Springs are high school (82 | 42.3%), middle school (55 | 28.3%), and kindergarten (28 | 14.4%).
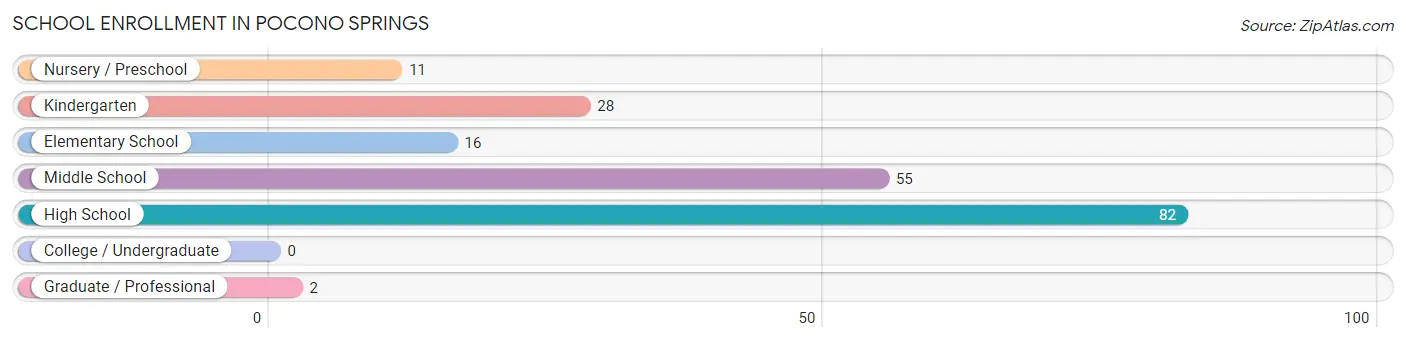
| School Level | # Students | % Students |
| Nursery / Preschool | 11 | 5.7% |
| Kindergarten | 28 | 14.4% |
| Elementary School | 16 | 8.3% |
| Middle School | 55 | 28.3% |
| High School | 82 | 42.3% |
| College / Undergraduate | 0 | 0.0% |
| Graduate / Professional | 2 | 1.0% |
| Total | 194 | 100.0% |
School Enrollment by Age by Funding Source in Pocono Springs
Out of a total of 194 students who are enrolled in schools in Pocono Springs, 2 (1.0%) attend a private institution, while the remaining 192 (99.0%) are enrolled in public schools. The age group of 25 to 34 year olds has the highest likelihood of being enrolled in private schools, with 2 (100.0% in the age bracket) enrolled. Conversely, the age group of 3 to 4 year olds has the lowest likelihood of being enrolled in a private school, with 11 (100.0% in the age bracket) attending a public institution.
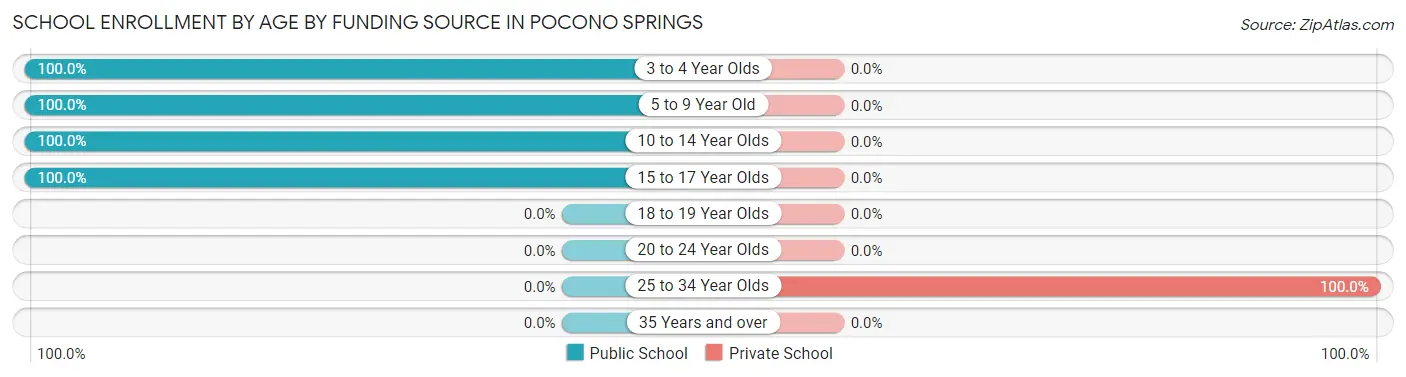
| Age Bracket | Public School | Private School |
| 3 to 4 Year Olds | 11 (100.0%) | 0 (0.0%) |
| 5 to 9 Year Old | 44 (100.0%) | 0 (0.0%) |
| 10 to 14 Year Olds | 75 (100.0%) | 0 (0.0%) |
| 15 to 17 Year Olds | 62 (100.0%) | 0 (0.0%) |
| 18 to 19 Year Olds | 0 (0.0%) | 0 (0.0%) |
| 20 to 24 Year Olds | 0 (0.0%) | 0 (0.0%) |
| 25 to 34 Year Olds | 0 (0.0%) | 2 (100.0%) |
| 35 Years and over | 0 (0.0%) | 0 (0.0%) |
| Total | 192 (99.0%) | 2 (1.0%) |
Educational Attainment by Field of Study in Pocono Springs
Business (28 | 34.2%), engineering (26 | 31.7%), education (19 | 23.2%), arts & humanities (5 | 6.1%), and science & technology (4 | 4.9%) are the most common fields of study among 82 individuals in Pocono Springs who have obtained a bachelor's degree or higher.
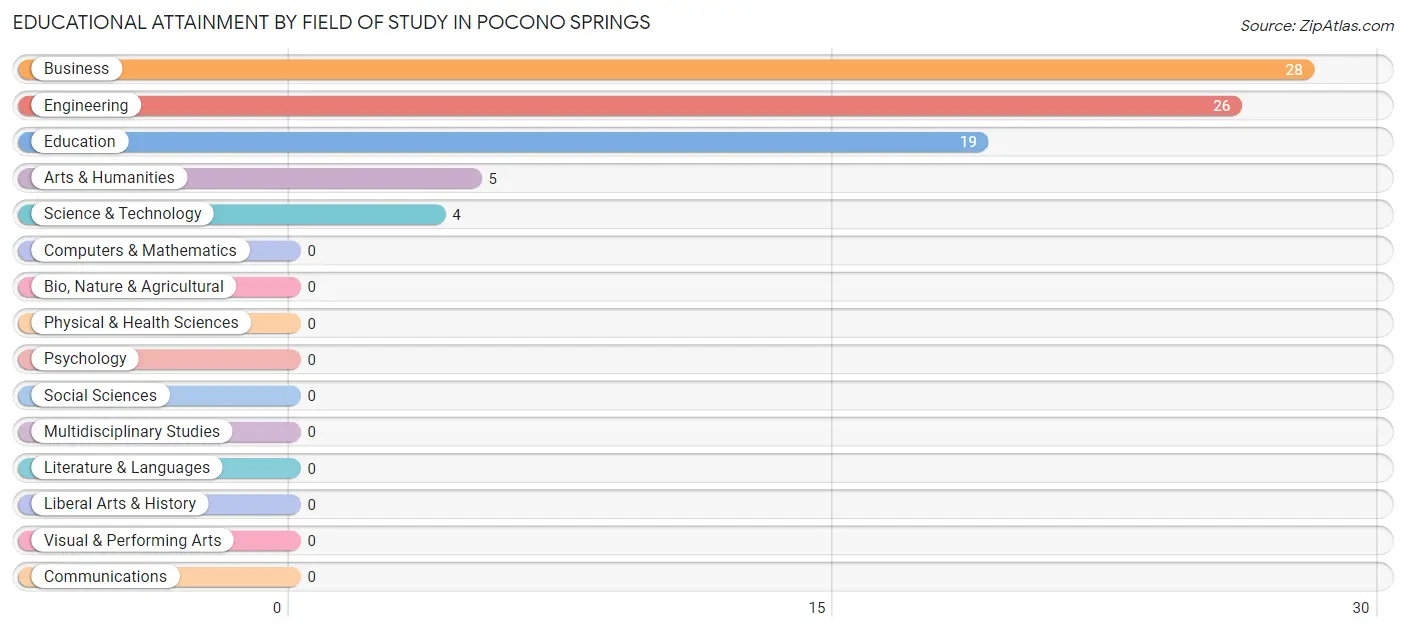
| Field of Study | # Graduates | % Graduates |
| Computers & Mathematics | 0 | 0.0% |
| Bio, Nature & Agricultural | 0 | 0.0% |
| Physical & Health Sciences | 0 | 0.0% |
| Psychology | 0 | 0.0% |
| Social Sciences | 0 | 0.0% |
| Engineering | 26 | 31.7% |
| Multidisciplinary Studies | 0 | 0.0% |
| Science & Technology | 4 | 4.9% |
| Business | 28 | 34.2% |
| Education | 19 | 23.2% |
| Literature & Languages | 0 | 0.0% |
| Liberal Arts & History | 0 | 0.0% |
| Visual & Performing Arts | 0 | 0.0% |
| Communications | 0 | 0.0% |
| Arts & Humanities | 5 | 6.1% |
| Total | 82 | 100.0% |
Transportation & Commute in Pocono Springs
Vehicle Availability by Sex in Pocono Springs
The most prevalent vehicle ownership categories in Pocono Springs are males with 2 vehicles (47, accounting for 50.0%) and females with 2 vehicles (84, making up 30.7%).
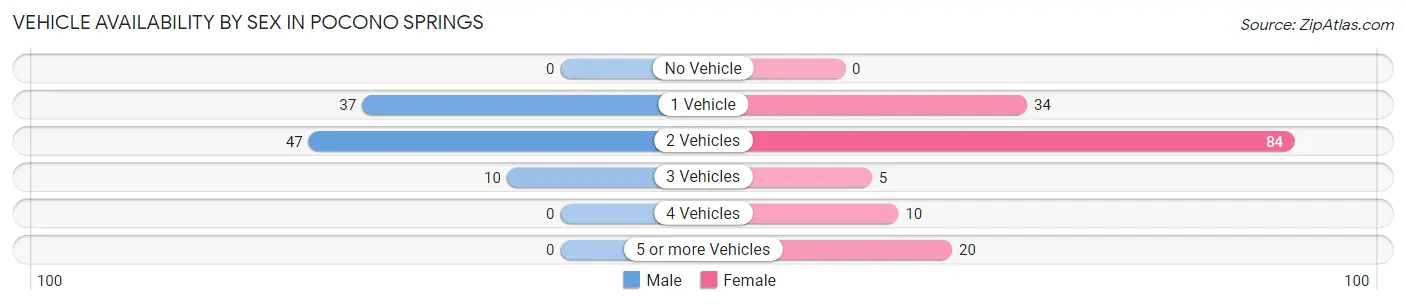
| Vehicles Available | Male | Female |
| No Vehicle | 0 (0.0%) | 0 (0.0%) |
| 1 Vehicle | 37 (39.4%) | 34 (22.2%) |
| 2 Vehicles | 47 (50.0%) | 84 (54.9%) |
| 3 Vehicles | 10 (10.6%) | 5 (3.3%) |
| 4 Vehicles | 0 (0.0%) | 10 (6.5%) |
| 5 or more Vehicles | 0 (0.0%) | 20 (13.1%) |
| Total | 94 (100.0%) | 153 (100.0%) |
Commute Time in Pocono Springs
The most frequently occuring commute durations in Pocono Springs are 20 to 24 minutes (56 commuters, 23.6%), 30 to 34 minutes (40 commuters, 16.9%), and 45 to 59 minutes (38 commuters, 16.0%).
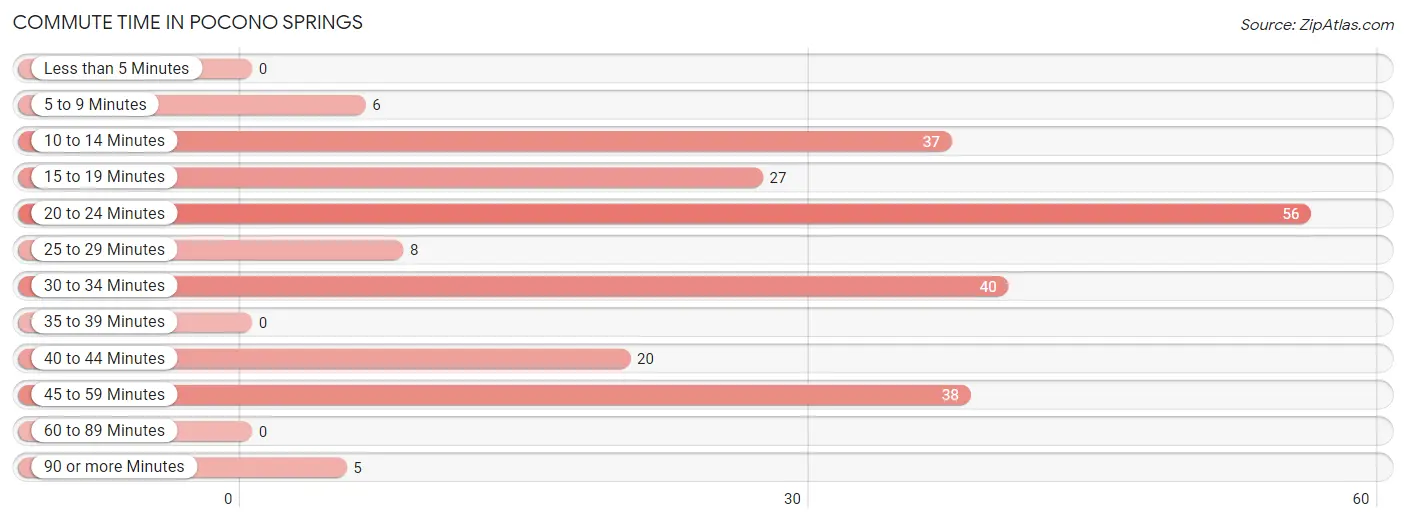
| Commute Time | # Commuters | % Commuters |
| Less than 5 Minutes | 0 | 0.0% |
| 5 to 9 Minutes | 6 | 2.5% |
| 10 to 14 Minutes | 37 | 15.6% |
| 15 to 19 Minutes | 27 | 11.4% |
| 20 to 24 Minutes | 56 | 23.6% |
| 25 to 29 Minutes | 8 | 3.4% |
| 30 to 34 Minutes | 40 | 16.9% |
| 35 to 39 Minutes | 0 | 0.0% |
| 40 to 44 Minutes | 20 | 8.4% |
| 45 to 59 Minutes | 38 | 16.0% |
| 60 to 89 Minutes | 0 | 0.0% |
| 90 or more Minutes | 5 | 2.1% |
Commute Time by Sex in Pocono Springs
The most common commute times in Pocono Springs are 10 to 14 minutes (26 commuters, 29.9%) for males and 20 to 24 minutes (47 commuters, 31.3%) for females.
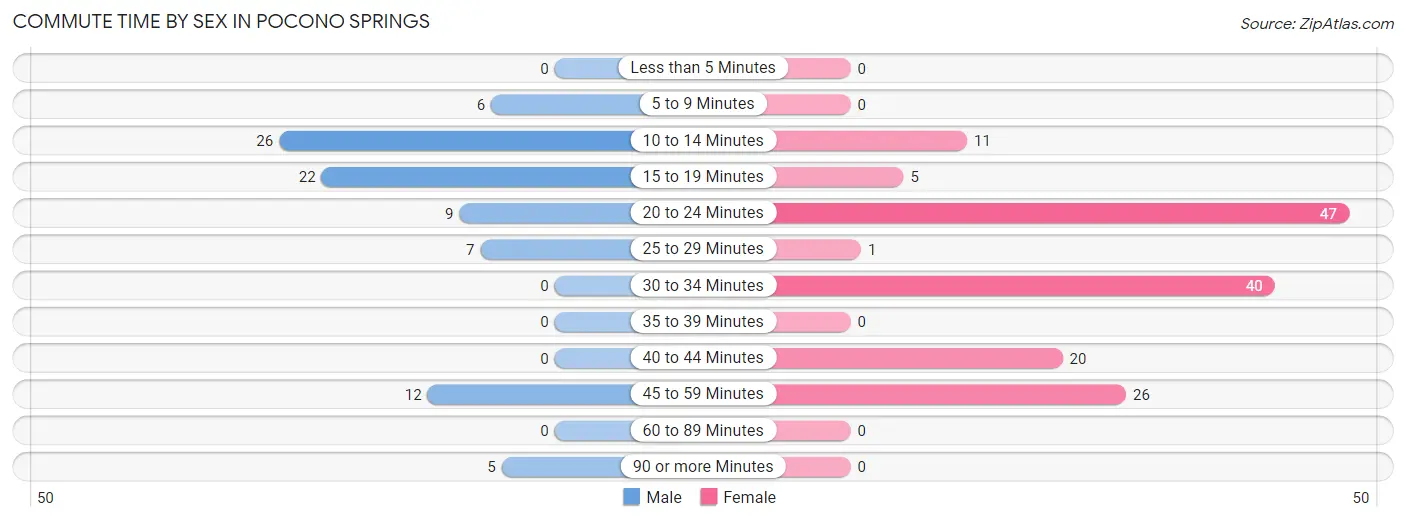
| Commute Time | Male | Female |
| Less than 5 Minutes | 0 (0.0%) | 0 (0.0%) |
| 5 to 9 Minutes | 6 (6.9%) | 0 (0.0%) |
| 10 to 14 Minutes | 26 (29.9%) | 11 (7.3%) |
| 15 to 19 Minutes | 22 (25.3%) | 5 (3.3%) |
| 20 to 24 Minutes | 9 (10.3%) | 47 (31.3%) |
| 25 to 29 Minutes | 7 (8.1%) | 1 (0.7%) |
| 30 to 34 Minutes | 0 (0.0%) | 40 (26.7%) |
| 35 to 39 Minutes | 0 (0.0%) | 0 (0.0%) |
| 40 to 44 Minutes | 0 (0.0%) | 20 (13.3%) |
| 45 to 59 Minutes | 12 (13.8%) | 26 (17.3%) |
| 60 to 89 Minutes | 0 (0.0%) | 0 (0.0%) |
| 90 or more Minutes | 5 (5.8%) | 0 (0.0%) |
Time of Departure to Work by Sex in Pocono Springs
The most frequent times of departure to work in Pocono Springs are 9:00 AM to 9:59 AM (21, 24.1%) for males and 6:30 AM to 6:59 AM (42, 28.0%) for females.
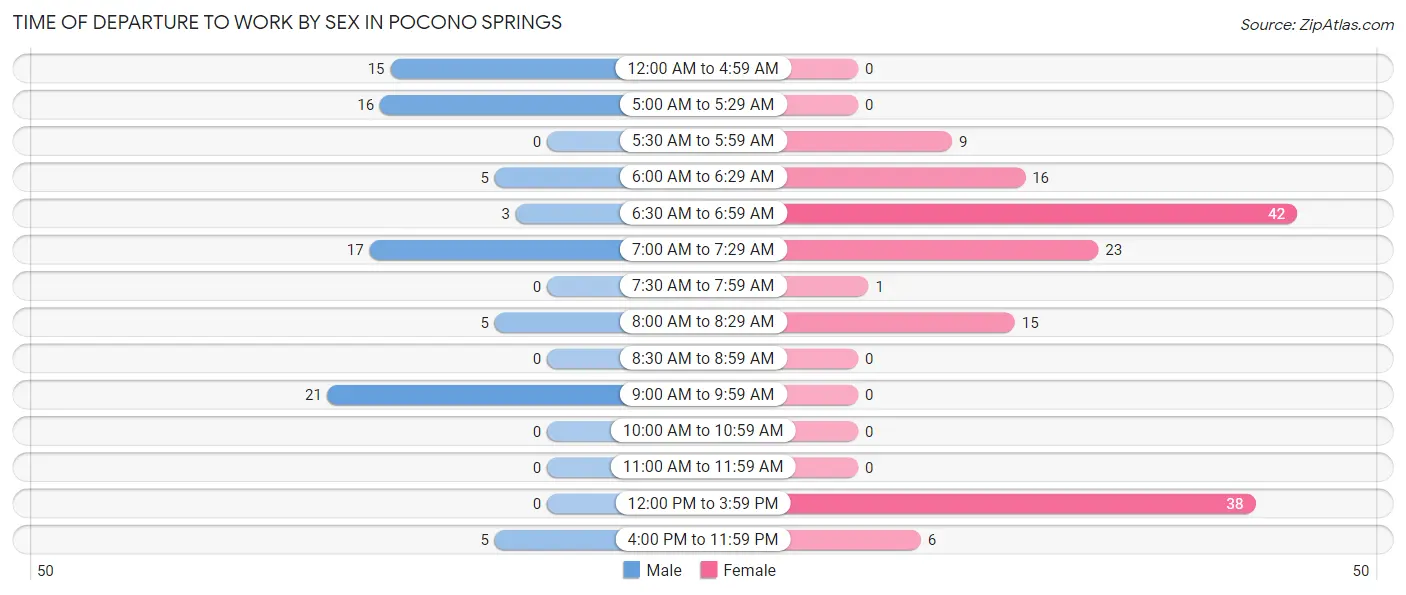
| Time of Departure | Male | Female |
| 12:00 AM to 4:59 AM | 15 (17.2%) | 0 (0.0%) |
| 5:00 AM to 5:29 AM | 16 (18.4%) | 0 (0.0%) |
| 5:30 AM to 5:59 AM | 0 (0.0%) | 9 (6.0%) |
| 6:00 AM to 6:29 AM | 5 (5.8%) | 16 (10.7%) |
| 6:30 AM to 6:59 AM | 3 (3.5%) | 42 (28.0%) |
| 7:00 AM to 7:29 AM | 17 (19.5%) | 23 (15.3%) |
| 7:30 AM to 7:59 AM | 0 (0.0%) | 1 (0.7%) |
| 8:00 AM to 8:29 AM | 5 (5.8%) | 15 (10.0%) |
| 8:30 AM to 8:59 AM | 0 (0.0%) | 0 (0.0%) |
| 9:00 AM to 9:59 AM | 21 (24.1%) | 0 (0.0%) |
| 10:00 AM to 10:59 AM | 0 (0.0%) | 0 (0.0%) |
| 11:00 AM to 11:59 AM | 0 (0.0%) | 0 (0.0%) |
| 12:00 PM to 3:59 PM | 0 (0.0%) | 38 (25.3%) |
| 4:00 PM to 11:59 PM | 5 (5.8%) | 6 (4.0%) |
| Total | 87 (100.0%) | 150 (100.0%) |
Housing Occupancy in Pocono Springs
Occupancy by Ownership in Pocono Springs
Of the total 288 dwellings in Pocono Springs, owner-occupied units account for 243 (84.4%), while renter-occupied units make up 45 (15.6%).
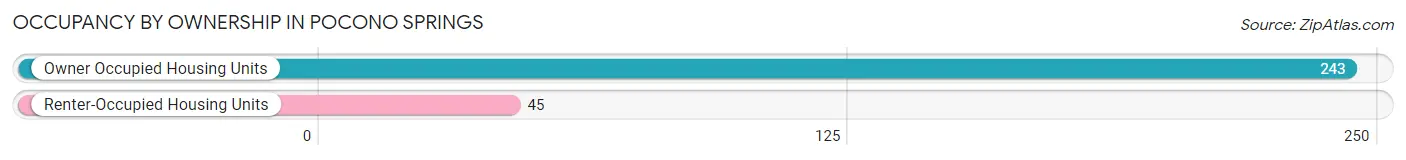
| Occupancy | # Housing Units | % Housing Units |
| Owner Occupied Housing Units | 243 | 84.4% |
| Renter-Occupied Housing Units | 45 | 15.6% |
| Total Occupied Housing Units | 288 | 100.0% |
Occupancy by Household Size in Pocono Springs
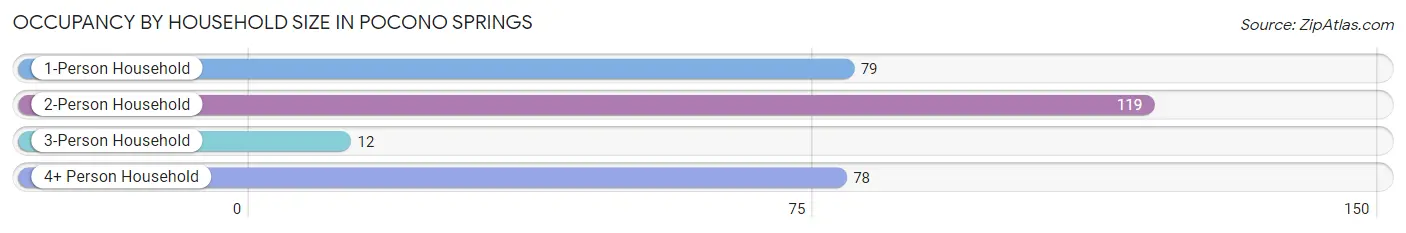
| Household Size | # Housing Units | % Housing Units |
| 1-Person Household | 79 | 27.4% |
| 2-Person Household | 119 | 41.3% |
| 3-Person Household | 12 | 4.2% |
| 4+ Person Household | 78 | 27.1% |
| Total Housing Units | 288 | 100.0% |
Occupancy by Ownership by Household Size in Pocono Springs
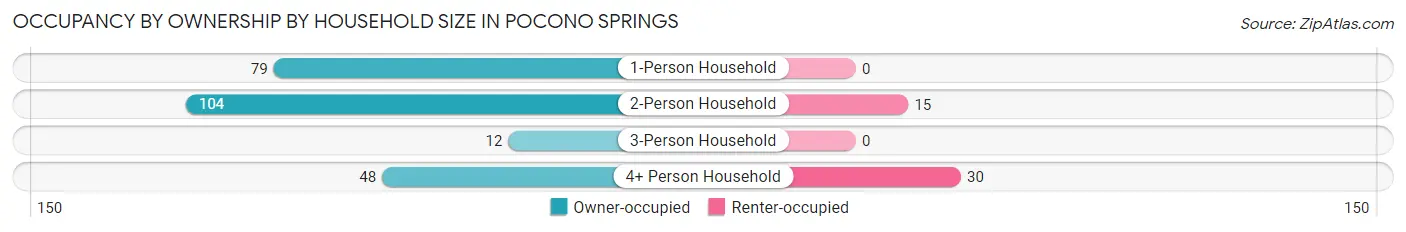
| Household Size | Owner-occupied | Renter-occupied |
| 1-Person Household | 79 (100.0%) | 0 (0.0%) |
| 2-Person Household | 104 (87.4%) | 15 (12.6%) |
| 3-Person Household | 12 (100.0%) | 0 (0.0%) |
| 4+ Person Household | 48 (61.5%) | 30 (38.5%) |
| Total Housing Units | 243 (84.4%) | 45 (15.6%) |
Occupancy by Educational Attainment in Pocono Springs
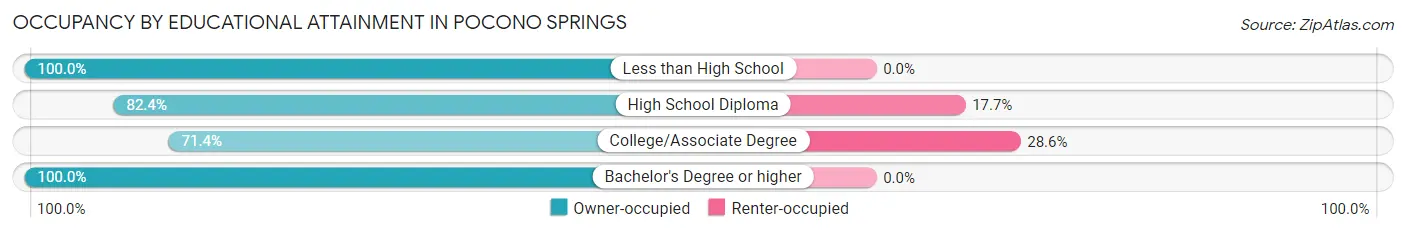
| Household Size | Owner-occupied | Renter-occupied |
| Less than High School | 14 (100.0%) | 0 (0.0%) |
| High School Diploma | 126 (82.4%) | 27 (17.6%) |
| College/Associate Degree | 45 (71.4%) | 18 (28.6%) |
| Bachelor's Degree or higher | 58 (100.0%) | 0 (0.0%) |
Occupancy by Age of Householder in Pocono Springs
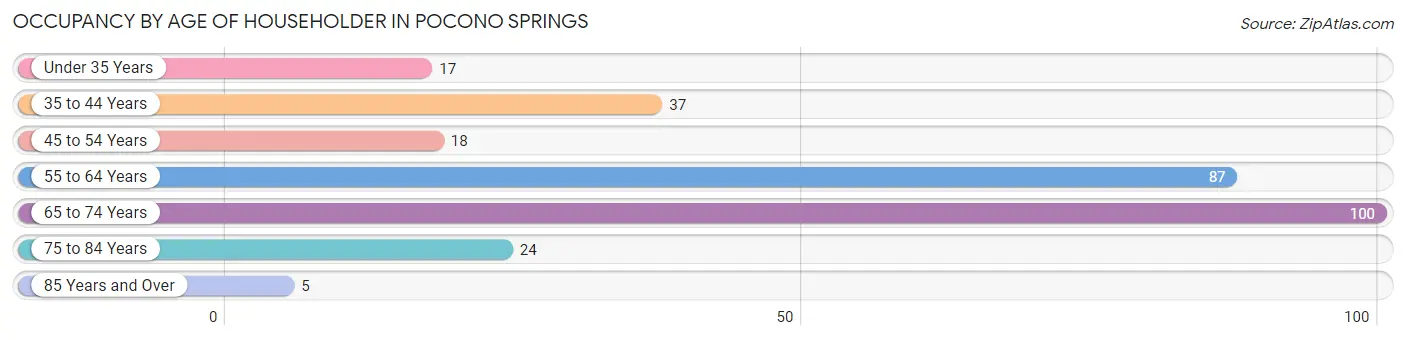
| Age Bracket | # Households | % Households |
| Under 35 Years | 17 | 5.9% |
| 35 to 44 Years | 37 | 12.9% |
| 45 to 54 Years | 18 | 6.2% |
| 55 to 64 Years | 87 | 30.2% |
| 65 to 74 Years | 100 | 34.7% |
| 75 to 84 Years | 24 | 8.3% |
| 85 Years and Over | 5 | 1.7% |
| Total | 288 | 100.0% |
Housing Finances in Pocono Springs
Median Income by Occupancy in Pocono Springs
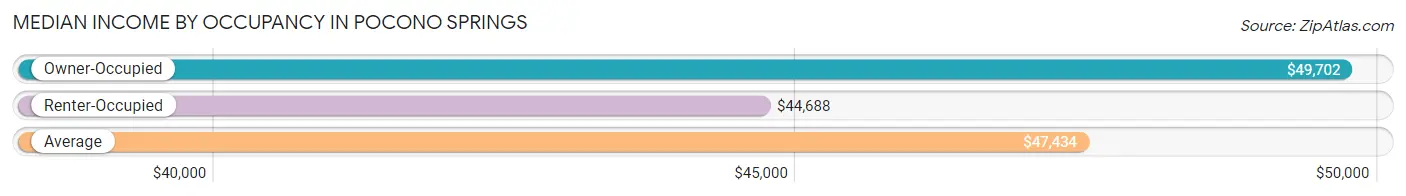
| Occupancy Type | # Households | Median Income |
| Owner-Occupied | 243 (84.4%) | $49,702 |
| Renter-Occupied | 45 (15.6%) | $44,688 |
| Average | 288 (100.0%) | $47,434 |
Occupancy by Householder Income Bracket in Pocono Springs
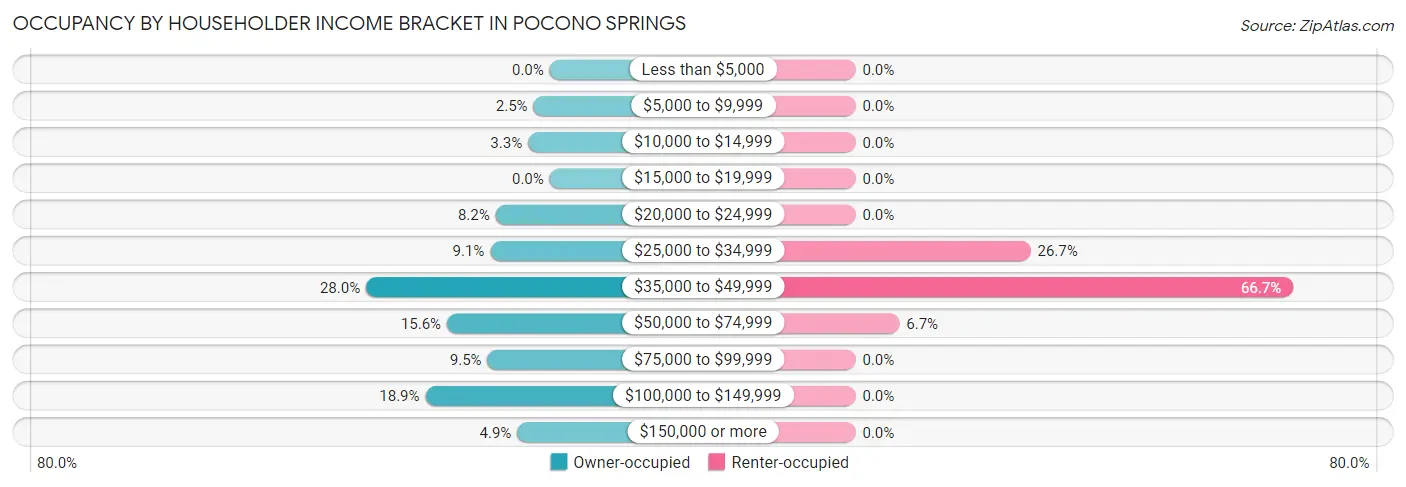
| Income Bracket | Owner-occupied | Renter-occupied |
| Less than $5,000 | 0 (0.0%) | 0 (0.0%) |
| $5,000 to $9,999 | 6 (2.5%) | 0 (0.0%) |
| $10,000 to $14,999 | 8 (3.3%) | 0 (0.0%) |
| $15,000 to $19,999 | 0 (0.0%) | 0 (0.0%) |
| $20,000 to $24,999 | 20 (8.2%) | 0 (0.0%) |
| $25,000 to $34,999 | 22 (9.0%) | 12 (26.7%) |
| $35,000 to $49,999 | 68 (28.0%) | 30 (66.7%) |
| $50,000 to $74,999 | 38 (15.6%) | 3 (6.7%) |
| $75,000 to $99,999 | 23 (9.5%) | 0 (0.0%) |
| $100,000 to $149,999 | 46 (18.9%) | 0 (0.0%) |
| $150,000 or more | 12 (4.9%) | 0 (0.0%) |
| Total | 243 (100.0%) | 45 (100.0%) |
Monthly Housing Cost Tiers in Pocono Springs
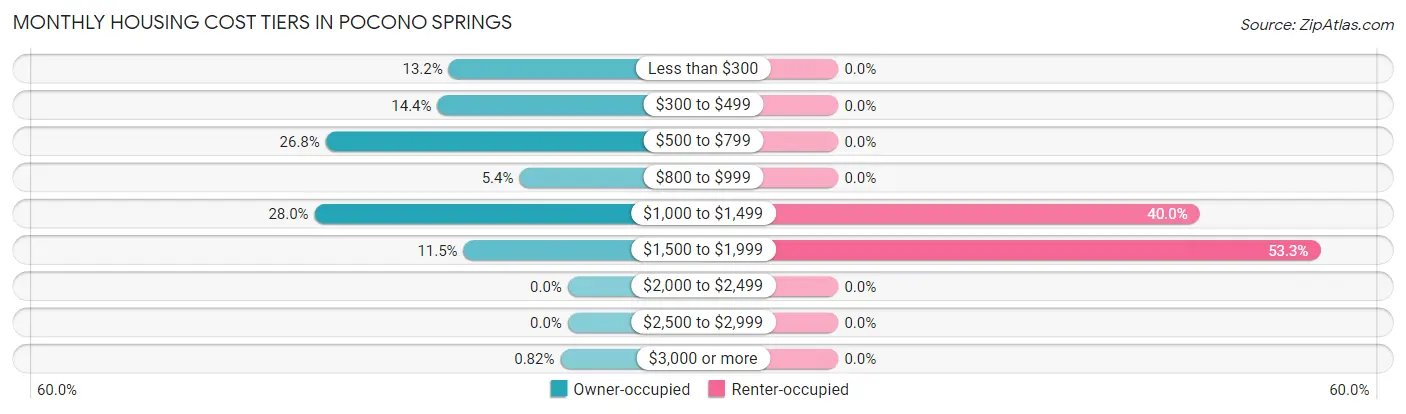
| Monthly Cost | Owner-occupied | Renter-occupied |
| Less than $300 | 32 (13.2%) | 0 (0.0%) |
| $300 to $499 | 35 (14.4%) | 0 (0.0%) |
| $500 to $799 | 65 (26.8%) | 0 (0.0%) |
| $800 to $999 | 13 (5.3%) | 0 (0.0%) |
| $1,000 to $1,499 | 68 (28.0%) | 18 (40.0%) |
| $1,500 to $1,999 | 28 (11.5%) | 24 (53.3%) |
| $2,000 to $2,499 | 0 (0.0%) | 0 (0.0%) |
| $2,500 to $2,999 | 0 (0.0%) | 0 (0.0%) |
| $3,000 or more | 2 (0.8%) | 0 (0.0%) |
| Total | 243 (100.0%) | 45 (100.0%) |
Physical Housing Characteristics in Pocono Springs
Housing Structures in Pocono Springs
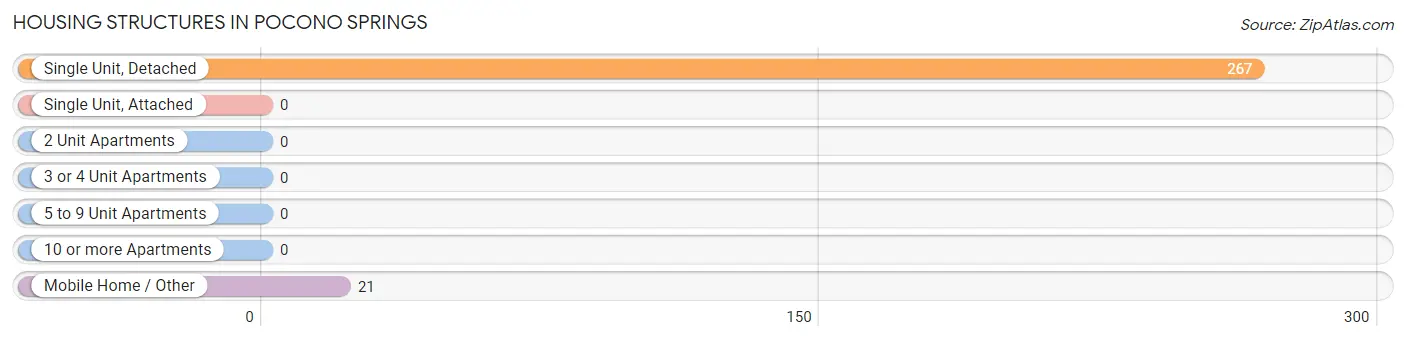
| Structure Type | # Housing Units | % Housing Units |
| Single Unit, Detached | 267 | 92.7% |
| Single Unit, Attached | 0 | 0.0% |
| 2 Unit Apartments | 0 | 0.0% |
| 3 or 4 Unit Apartments | 0 | 0.0% |
| 5 to 9 Unit Apartments | 0 | 0.0% |
| 10 or more Apartments | 0 | 0.0% |
| Mobile Home / Other | 21 | 7.3% |
| Total | 288 | 100.0% |
Housing Structures by Occupancy in Pocono Springs
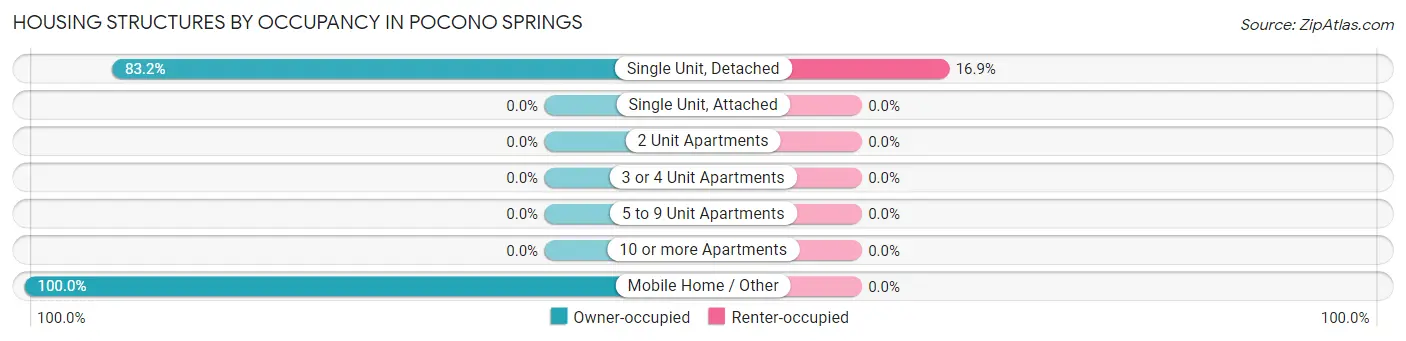
| Structure Type | Owner-occupied | Renter-occupied |
| Single Unit, Detached | 222 (83.2%) | 45 (16.9%) |
| Single Unit, Attached | 0 (0.0%) | 0 (0.0%) |
| 2 Unit Apartments | 0 (0.0%) | 0 (0.0%) |
| 3 or 4 Unit Apartments | 0 (0.0%) | 0 (0.0%) |
| 5 to 9 Unit Apartments | 0 (0.0%) | 0 (0.0%) |
| 10 or more Apartments | 0 (0.0%) | 0 (0.0%) |
| Mobile Home / Other | 21 (100.0%) | 0 (0.0%) |
| Total | 243 (84.4%) | 45 (15.6%) |
Housing Structures by Number of Rooms in Pocono Springs
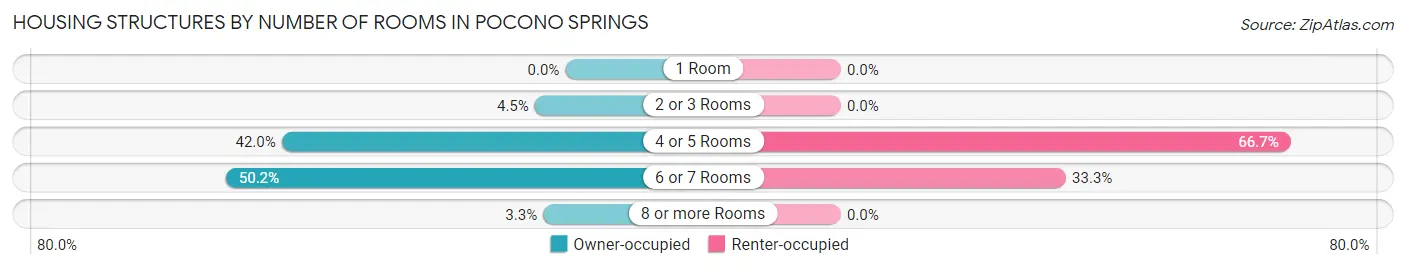
| Number of Rooms | Owner-occupied | Renter-occupied |
| 1 Room | 0 (0.0%) | 0 (0.0%) |
| 2 or 3 Rooms | 11 (4.5%) | 0 (0.0%) |
| 4 or 5 Rooms | 102 (42.0%) | 30 (66.7%) |
| 6 or 7 Rooms | 122 (50.2%) | 15 (33.3%) |
| 8 or more Rooms | 8 (3.3%) | 0 (0.0%) |
| Total | 243 (100.0%) | 45 (100.0%) |
Housing Structure by Heating Type in Pocono Springs
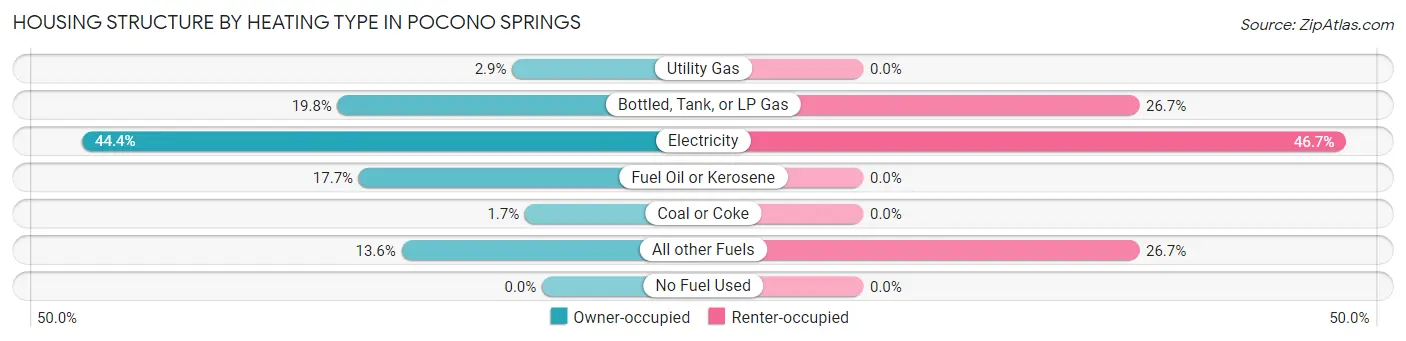
| Heating Type | Owner-occupied | Renter-occupied |
| Utility Gas | 7 (2.9%) | 0 (0.0%) |
| Bottled, Tank, or LP Gas | 48 (19.8%) | 12 (26.7%) |
| Electricity | 108 (44.4%) | 21 (46.7%) |
| Fuel Oil or Kerosene | 43 (17.7%) | 0 (0.0%) |
| Coal or Coke | 4 (1.7%) | 0 (0.0%) |
| All other Fuels | 33 (13.6%) | 12 (26.7%) |
| No Fuel Used | 0 (0.0%) | 0 (0.0%) |
| Total | 243 (100.0%) | 45 (100.0%) |
Household Vehicle Usage in Pocono Springs
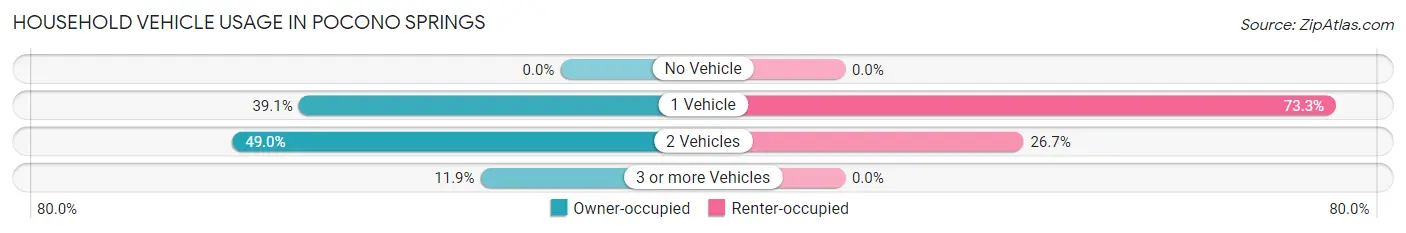
| Vehicles per Household | Owner-occupied | Renter-occupied |
| No Vehicle | 0 (0.0%) | 0 (0.0%) |
| 1 Vehicle | 95 (39.1%) | 33 (73.3%) |
| 2 Vehicles | 119 (49.0%) | 12 (26.7%) |
| 3 or more Vehicles | 29 (11.9%) | 0 (0.0%) |
| Total | 243 (100.0%) | 45 (100.0%) |
Real Estate & Mortgages in Pocono Springs
Real Estate and Mortgage Overview in Pocono Springs
| Characteristic | Without Mortgage | With Mortgage |
| Housing Units | 128 | 115 |
| Median Property Value | $151,600 | $143,400 |
| Median Household Income | $49,048 | $12 |
| Monthly Housing Costs | $486 | $2 |
| Real Estate Taxes | $1,696 | $0 |
Property Value by Mortgage Status in Pocono Springs
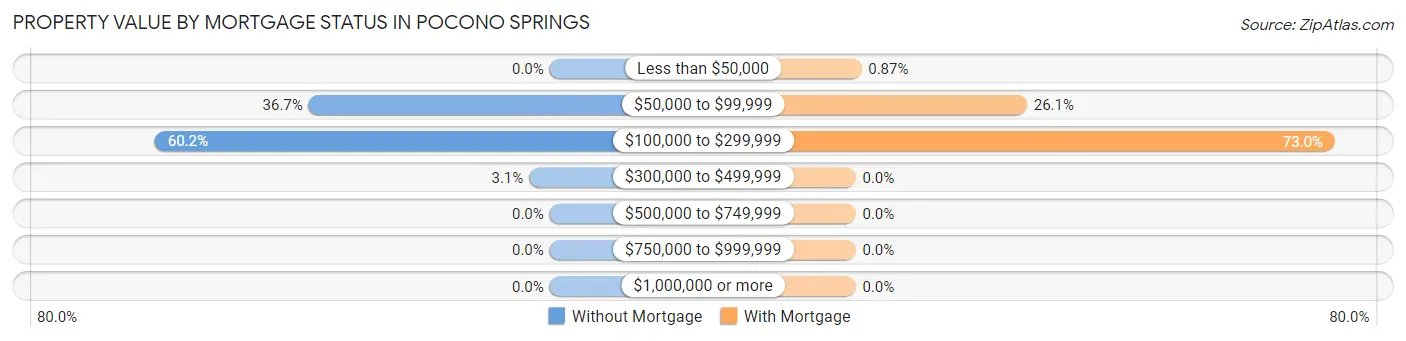
| Property Value | Without Mortgage | With Mortgage |
| Less than $50,000 | 0 (0.0%) | 1 (0.9%) |
| $50,000 to $99,999 | 47 (36.7%) | 30 (26.1%) |
| $100,000 to $299,999 | 77 (60.2%) | 84 (73.0%) |
| $300,000 to $499,999 | 4 (3.1%) | 0 (0.0%) |
| $500,000 to $749,999 | 0 (0.0%) | 0 (0.0%) |
| $750,000 to $999,999 | 0 (0.0%) | 0 (0.0%) |
| $1,000,000 or more | 0 (0.0%) | 0 (0.0%) |
| Total | 128 (100.0%) | 115 (100.0%) |
Household Income by Mortgage Status in Pocono Springs
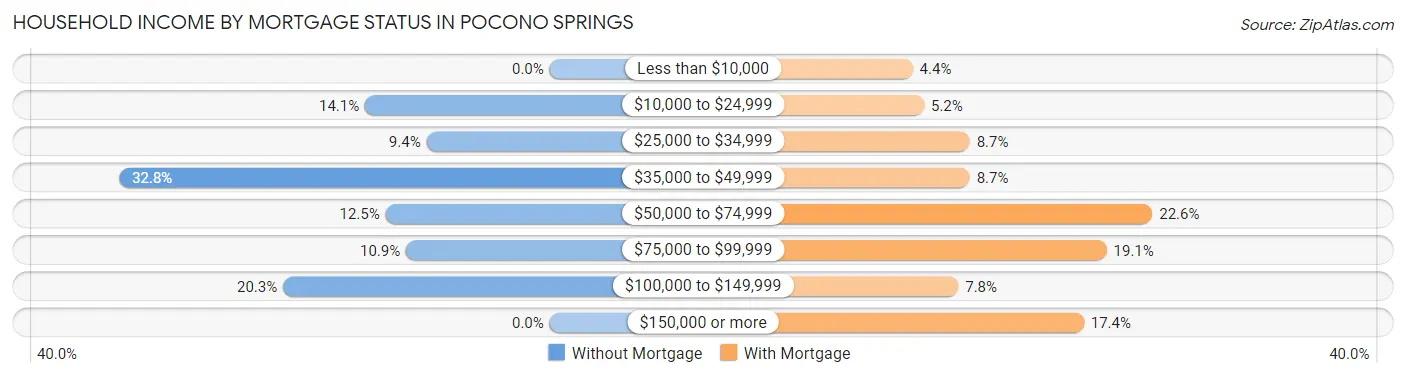
| Household Income | Without Mortgage | With Mortgage |
| Less than $10,000 | 0 (0.0%) | 5 (4.3%) |
| $10,000 to $24,999 | 18 (14.1%) | 6 (5.2%) |
| $25,000 to $34,999 | 12 (9.4%) | 10 (8.7%) |
| $35,000 to $49,999 | 42 (32.8%) | 10 (8.7%) |
| $50,000 to $74,999 | 16 (12.5%) | 26 (22.6%) |
| $75,000 to $99,999 | 14 (10.9%) | 22 (19.1%) |
| $100,000 to $149,999 | 26 (20.3%) | 9 (7.8%) |
| $150,000 or more | 0 (0.0%) | 20 (17.4%) |
| Total | 128 (100.0%) | 115 (100.0%) |
Property Value to Household Income Ratio in Pocono Springs
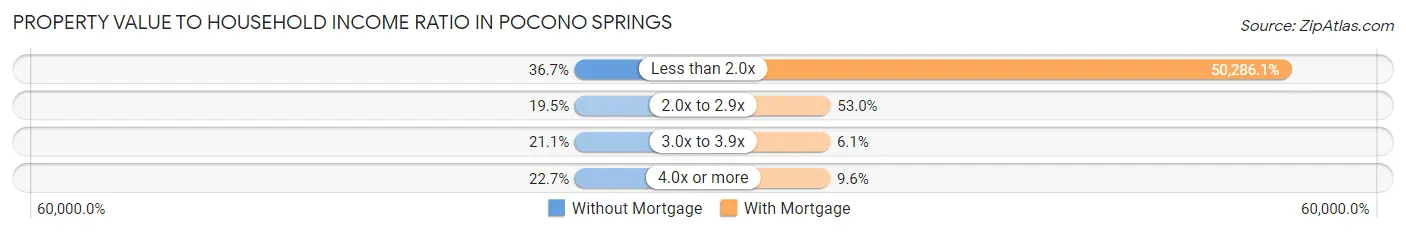
| Value-to-Income Ratio | Without Mortgage | With Mortgage |
| Less than 2.0x | 47 (36.7%) | 57,829 (50,286.1%) |
| 2.0x to 2.9x | 25 (19.5%) | 61 (53.0%) |
| 3.0x to 3.9x | 27 (21.1%) | 7 (6.1%) |
| 4.0x or more | 29 (22.7%) | 11 (9.6%) |
| Total | 128 (100.0%) | 115 (100.0%) |
Real Estate Taxes by Mortgage Status in Pocono Springs
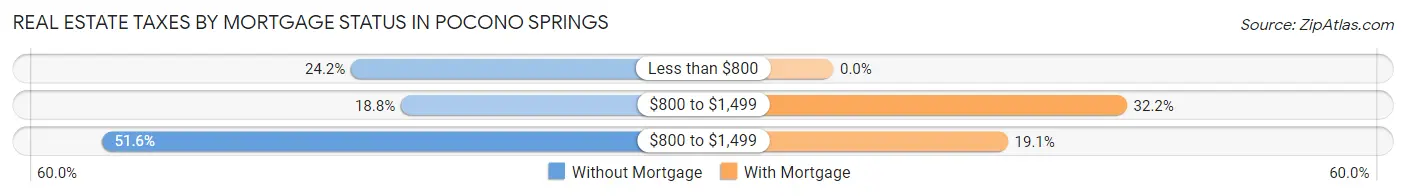
| Property Taxes | Without Mortgage | With Mortgage |
| Less than $800 | 31 (24.2%) | 0 (0.0%) |
| $800 to $1,499 | 24 (18.8%) | 37 (32.2%) |
| $800 to $1,499 | 66 (51.6%) | 22 (19.1%) |
| Total | 128 (100.0%) | 115 (100.0%) |
Health & Disability in Pocono Springs
Health Insurance Coverage by Age in Pocono Springs
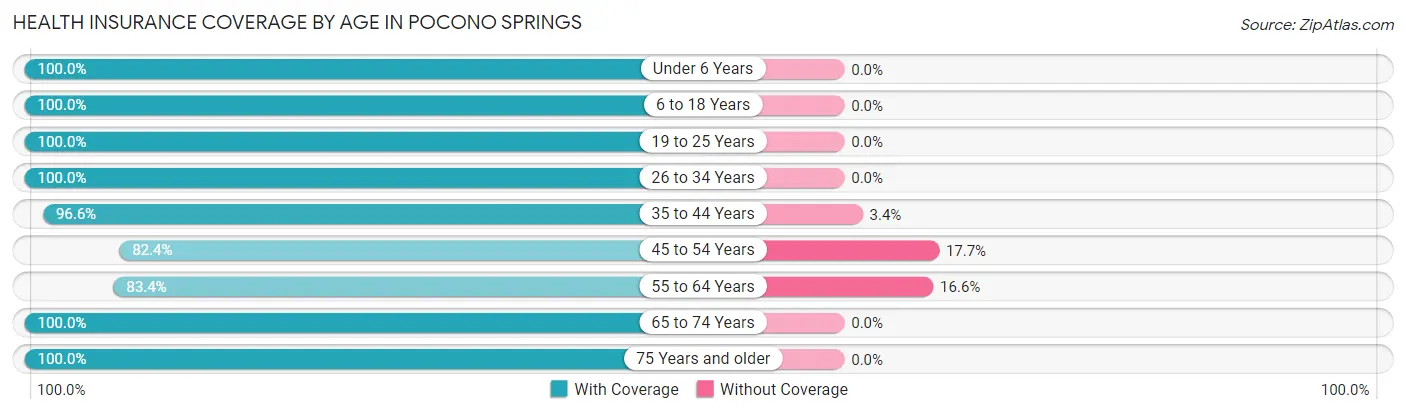
| Age Bracket | With Coverage | Without Coverage |
| Under 6 Years | 52 (100.0%) | 0 (0.0%) |
| 6 to 18 Years | 168 (100.0%) | 0 (0.0%) |
| 19 to 25 Years | 11 (100.0%) | 0 (0.0%) |
| 26 to 34 Years | 90 (100.0%) | 0 (0.0%) |
| 35 to 44 Years | 113 (96.6%) | 4 (3.4%) |
| 45 to 54 Years | 28 (82.4%) | 6 (17.6%) |
| 55 to 64 Years | 151 (83.4%) | 30 (16.6%) |
| 65 to 74 Years | 157 (100.0%) | 0 (0.0%) |
| 75 Years and older | 42 (100.0%) | 0 (0.0%) |
| Total | 812 (95.3%) | 40 (4.7%) |
Health Insurance Coverage by Citizenship Status in Pocono Springs
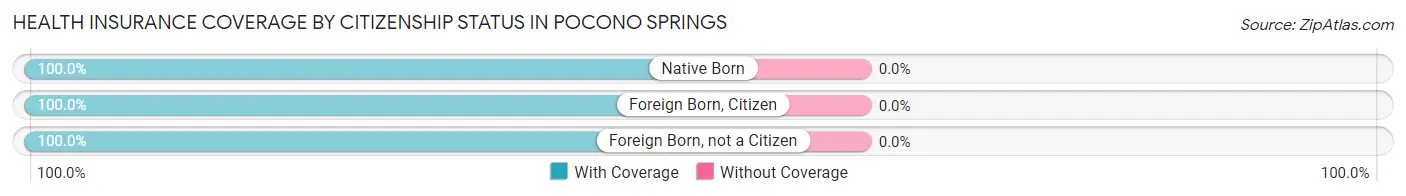
| Citizenship Status | With Coverage | Without Coverage |
| Native Born | 52 (100.0%) | 0 (0.0%) |
| Foreign Born, Citizen | 168 (100.0%) | 0 (0.0%) |
| Foreign Born, not a Citizen | 11 (100.0%) | 0 (0.0%) |
Health Insurance Coverage by Household Income in Pocono Springs
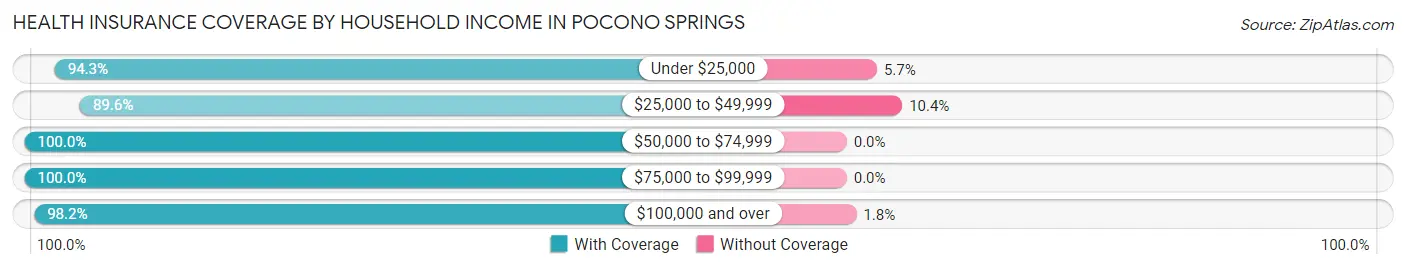
| Household Income | With Coverage | Without Coverage |
| Under $25,000 | 100 (94.3%) | 6 (5.7%) |
| $25,000 to $49,999 | 259 (89.6%) | 30 (10.4%) |
| $50,000 to $74,999 | 175 (100.0%) | 0 (0.0%) |
| $75,000 to $99,999 | 56 (100.0%) | 0 (0.0%) |
| $100,000 and over | 217 (98.2%) | 4 (1.8%) |
Public vs Private Health Insurance Coverage by Age in Pocono Springs
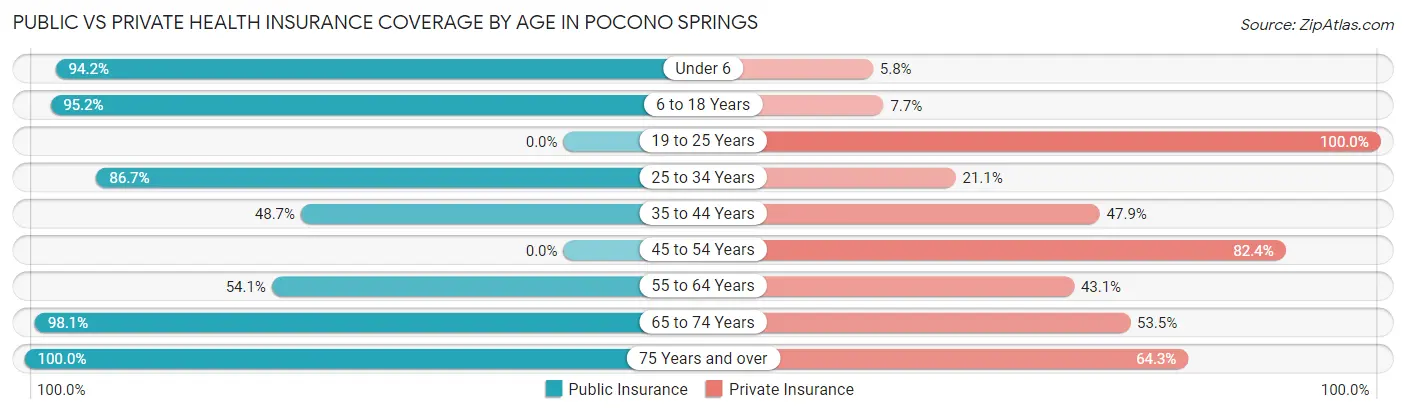
| Age Bracket | Public Insurance | Private Insurance |
| Under 6 | 49 (94.2%) | 3 (5.8%) |
| 6 to 18 Years | 160 (95.2%) | 13 (7.7%) |
| 19 to 25 Years | 0 (0.0%) | 11 (100.0%) |
| 25 to 34 Years | 78 (86.7%) | 19 (21.1%) |
| 35 to 44 Years | 57 (48.7%) | 56 (47.9%) |
| 45 to 54 Years | 0 (0.0%) | 28 (82.4%) |
| 55 to 64 Years | 98 (54.1%) | 78 (43.1%) |
| 65 to 74 Years | 154 (98.1%) | 84 (53.5%) |
| 75 Years and over | 42 (100.0%) | 27 (64.3%) |
| Total | 638 (74.9%) | 319 (37.4%) |
Disability Status by Sex by Age in Pocono Springs
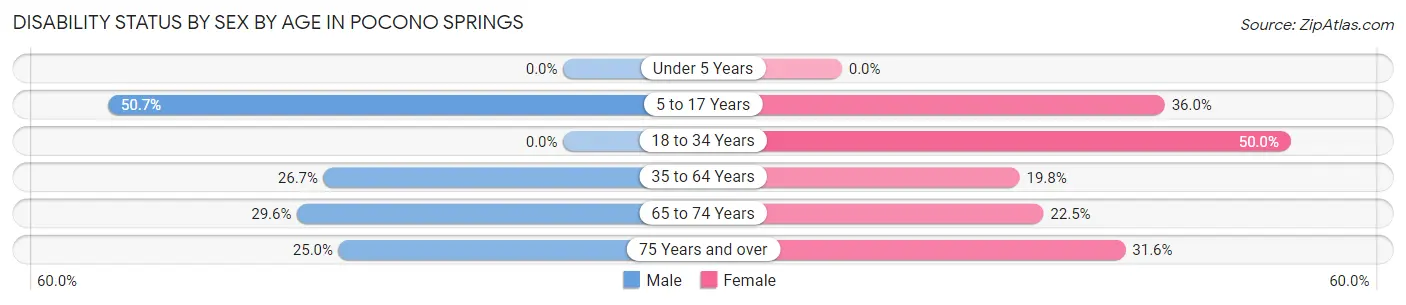
| Age Bracket | Male | Female |
| Under 5 Years | 0 (0.0%) | 0 (0.0%) |
| 5 to 17 Years | 35 (50.7%) | 41 (36.0%) |
| 18 to 34 Years | 0 (0.0%) | 33 (50.0%) |
| 35 to 64 Years | 36 (26.7%) | 39 (19.8%) |
| 65 to 74 Years | 32 (29.6%) | 11 (22.5%) |
| 75 Years and over | 1 (25.0%) | 12 (31.6%) |
Disability Class by Sex by Age in Pocono Springs
Disability Class: Hearing Difficulty
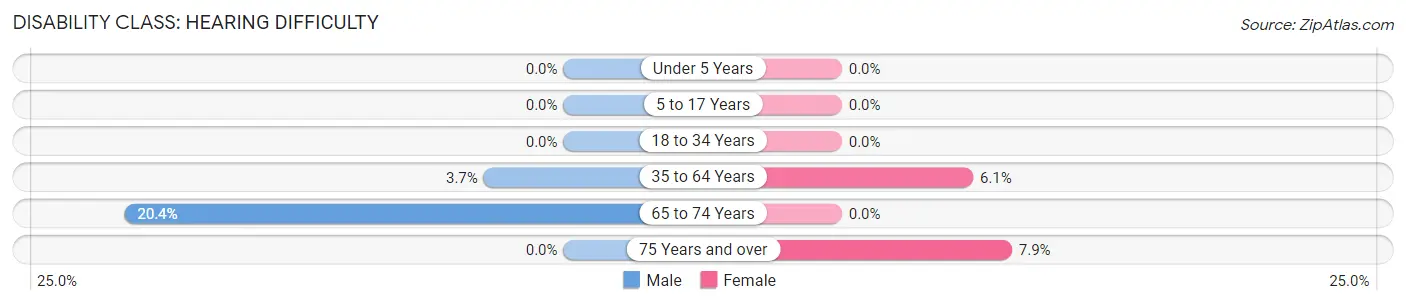
| Age Bracket | Male | Female |
| Under 5 Years | 0 (0.0%) | 0 (0.0%) |
| 5 to 17 Years | 0 (0.0%) | 0 (0.0%) |
| 18 to 34 Years | 0 (0.0%) | 0 (0.0%) |
| 35 to 64 Years | 5 (3.7%) | 12 (6.1%) |
| 65 to 74 Years | 22 (20.4%) | 0 (0.0%) |
| 75 Years and over | 0 (0.0%) | 3 (7.9%) |
Disability Class: Vision Difficulty
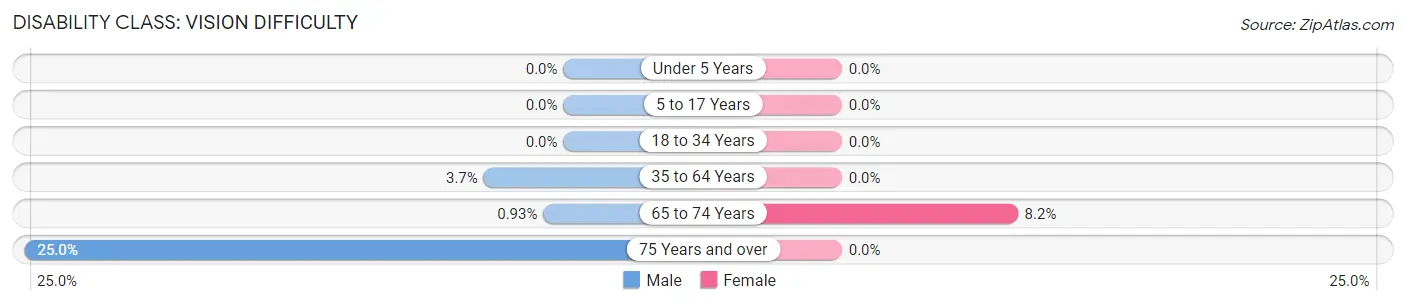
| Age Bracket | Male | Female |
| Under 5 Years | 0 (0.0%) | 0 (0.0%) |
| 5 to 17 Years | 0 (0.0%) | 0 (0.0%) |
| 18 to 34 Years | 0 (0.0%) | 0 (0.0%) |
| 35 to 64 Years | 5 (3.7%) | 0 (0.0%) |
| 65 to 74 Years | 1 (0.9%) | 4 (8.2%) |
| 75 Years and over | 1 (25.0%) | 0 (0.0%) |
Disability Class: Cognitive Difficulty
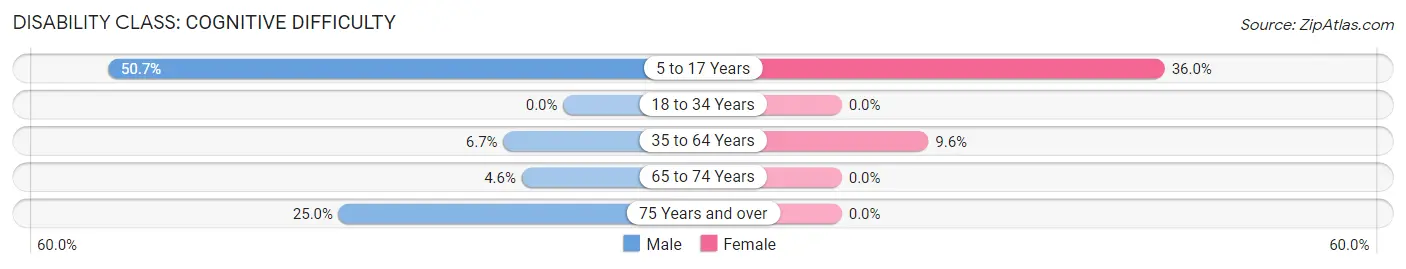
| Age Bracket | Male | Female |
| 5 to 17 Years | 35 (50.7%) | 41 (36.0%) |
| 18 to 34 Years | 0 (0.0%) | 0 (0.0%) |
| 35 to 64 Years | 9 (6.7%) | 19 (9.6%) |
| 65 to 74 Years | 5 (4.6%) | 0 (0.0%) |
| 75 Years and over | 1 (25.0%) | 0 (0.0%) |
Disability Class: Ambulatory Difficulty
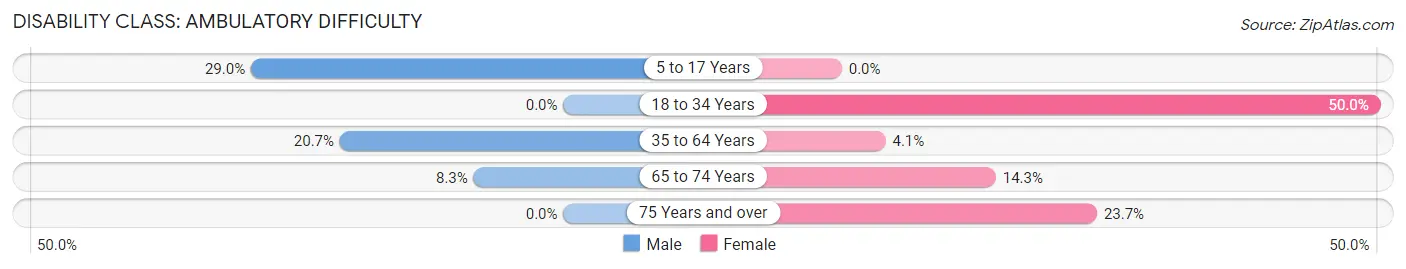
| Age Bracket | Male | Female |
| 5 to 17 Years | 20 (29.0%) | 0 (0.0%) |
| 18 to 34 Years | 0 (0.0%) | 33 (50.0%) |
| 35 to 64 Years | 28 (20.7%) | 8 (4.1%) |
| 65 to 74 Years | 9 (8.3%) | 7 (14.3%) |
| 75 Years and over | 0 (0.0%) | 9 (23.7%) |
Disability Class: Self-Care Difficulty
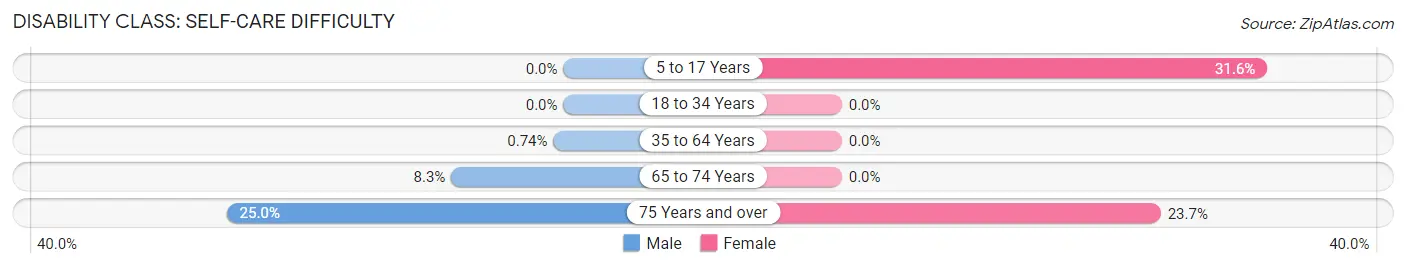
| Age Bracket | Male | Female |
| 5 to 17 Years | 0 (0.0%) | 36 (31.6%) |
| 18 to 34 Years | 0 (0.0%) | 0 (0.0%) |
| 35 to 64 Years | 1 (0.7%) | 0 (0.0%) |
| 65 to 74 Years | 9 (8.3%) | 0 (0.0%) |
| 75 Years and over | 1 (25.0%) | 9 (23.7%) |
Technology Access in Pocono Springs
Computing Device Access in Pocono Springs
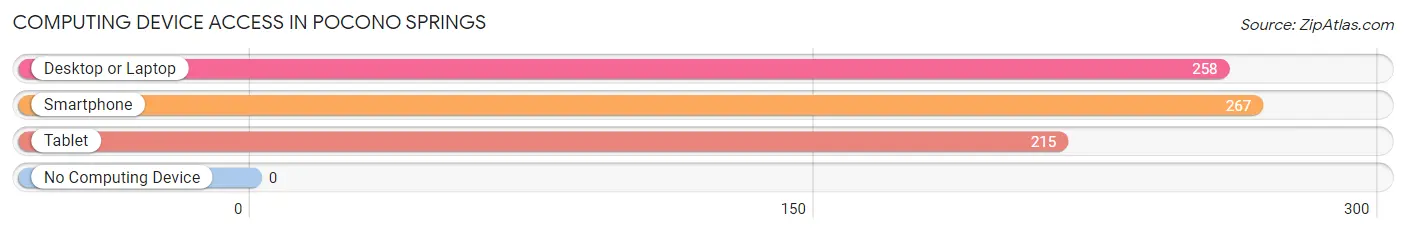
| Device Type | # Households | % Households |
| Desktop or Laptop | 258 | 89.6% |
| Smartphone | 267 | 92.7% |
| Tablet | 215 | 74.7% |
| No Computing Device | 0 | 0.0% |
| Total | 288 | 100.0% |
Internet Access in Pocono Springs
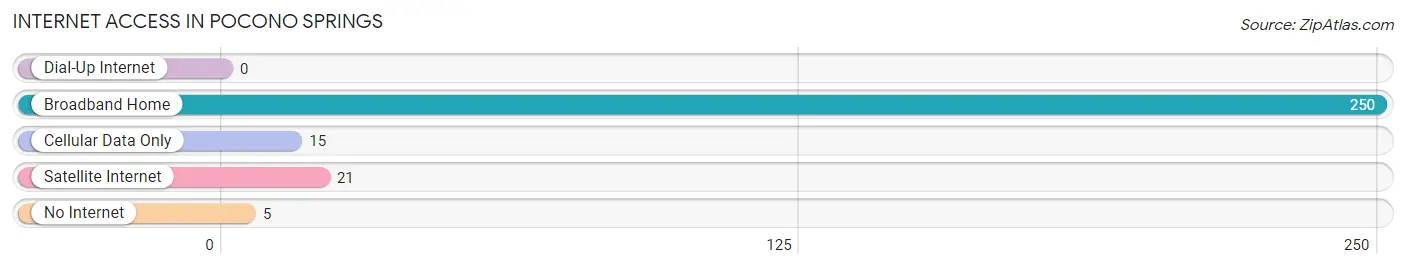
| Internet Type | # Households | % Households |
| Dial-Up Internet | 0 | 0.0% |
| Broadband Home | 250 | 86.8% |
| Cellular Data Only | 15 | 5.2% |
| Satellite Internet | 21 | 7.3% |
| No Internet | 5 | 1.7% |
| Total | 288 | 100.0% |
Pocono Springs Summary
Pocono Springs is a small borough located in Monroe County, Pennsylvania. It is situated in the Pocono Mountains region of the state, and is part of the Stroudsburg–East Stroudsburg Metropolitan Statistical Area. The borough has a population of just over 1,000 people, and is known for its scenic beauty and outdoor recreation opportunities.
Geography
Pocono Springs is located in the Pocono Mountains region of Pennsylvania, in the northeastern part of Monroe County. It is situated in the foothills of the Appalachian Mountains, and is surrounded by forests and rolling hills. The borough is located approximately 80 miles from Philadelphia and 90 miles from New York City.
The borough is situated on the banks of the Brodhead Creek, which flows through the center of town. The creek is a popular destination for fishing, canoeing, and kayaking. The area is also home to several state parks, including Big Pocono State Park, which offers camping, hiking, and other outdoor activities.
Climate
Pocono Springs has a humid continental climate, with cold winters and warm summers. The average annual temperature is around 50°F, with temperatures ranging from an average low of 28°F in January to an average high of 73°F in July. The area receives an average of 44 inches of precipitation per year, with most of it falling in the form of snow during the winter months.
Demographics
As of the 2010 census, Pocono Springs had a population of 1,072 people. The racial makeup of the borough was 94.2% White, 2.2% African American, 0.3% Native American, 0.7% Asian, 0.1% Pacific Islander, and 2.5% from other races. Hispanic or Latino of any race were 3.2% of the population.
The median household income in Pocono Springs was $45,938, and the median family income was $51,250. The per capita income was $20,945. About 8.3% of families and 10.2% of the population were below the poverty line, including 14.2% of those under age 18 and 5.2% of those age 65 or over.
Economy
Pocono Springs is a small, rural community with a largely agricultural economy. The area is home to several farms, which produce a variety of crops, including corn, soybeans, and hay. The borough is also home to several small businesses, including restaurants, retail stores, and service providers.
The area is also a popular tourist destination, with many visitors coming to the area to enjoy the scenic beauty and outdoor recreation opportunities. The borough is home to several resorts, which offer lodging, dining, and other amenities.
Conclusion
Pocono Springs is a small borough located in the Pocono Mountains region of Pennsylvania. It is known for its scenic beauty and outdoor recreation opportunities, and is a popular tourist destination. The borough has a population of just over 1,000 people, and has a largely agricultural economy. The area is also home to several small businesses, and is a great place to live and work.
Common Questions
What is Per Capita Income in Pocono Springs?
Per Capita income in Pocono Springs is $25,461.
What is the Median Family Income in Pocono Springs?
Median Family Income in Pocono Springs is $58,221.
What is the Median Household income in Pocono Springs?
Median Household Income in Pocono Springs is $47,434.
What is Inequality or Gini Index in Pocono Springs?
Inequality or Gini Index in Pocono Springs is 0.36.
What is the Total Population of Pocono Springs?
Total Population of Pocono Springs is 852.
What is the Total Male Population of Pocono Springs?
Total Male Population of Pocono Springs is 388.
What is the Total Female Population of Pocono Springs?
Total Female Population of Pocono Springs is 464.
What is the Ratio of Males per 100 Females in Pocono Springs?
There are 83.62 Males per 100 Females in Pocono Springs.
What is the Ratio of Females per 100 Males in Pocono Springs?
There are 119.59 Females per 100 Males in Pocono Springs.
What is the Median Population Age in Pocono Springs?
Median Population Age in Pocono Springs is 44.5 Years.
What is the Average Family Size in Pocono Springs
Average Family Size in Pocono Springs is 3.7 People.
What is the Average Household Size in Pocono Springs
Average Household Size in Pocono Springs is 2.9 People.
How Large is the Labor Force in Pocono Springs?
There are 296 People in the Labor Forcein in Pocono Springs.
What is the Percentage of People in the Labor Force in Pocono Springs?
44.4% of People are in the Labor Force in Pocono Springs.
What is the Unemployment Rate in Pocono Springs?
Unemployment Rate in Pocono Springs is 12.8%.