North Newton, KS Map & Demographics
North Newton Map
North Newton Overview
$40,803
PER CAPITA INCOME
$125,893
AVG FAMILY INCOME
$95,221
AVG HOUSEHOLD INCOME
59.8%
WAGE / INCOME GAP [ % ]
40.2¢/ $1
WAGE / INCOME GAP [ $ ]
0.38
INEQUALITY / GINI INDEX
2,105
TOTAL POPULATION
1,024
MALE POPULATION
1,081
FEMALE POPULATION
94.73
MALES / 100 FEMALES
105.57
FEMALES / 100 MALES
41.4
MEDIAN AGE
2.5
AVG FAMILY SIZE
2.1
AVG HOUSEHOLD SIZE
1,066
LABOR FORCE [ PEOPLE ]
59.4%
PERCENT IN LABOR FORCE
7.8%
UNEMPLOYMENT RATE
North Newton Zip Codes
Income in North Newton
Income Overview in North Newton
Per Capita Income in North Newton is $40,803, while median incomes of families and households are $125,893 and $95,221 respectively.
| Characteristic | Number | Measure |
| Per Capita Income | 2,105 | $40,803 |
| Median Family Income | 519 | $125,893 |
| Mean Family Income | 519 | $133,987 |
| Median Household Income | 805 | $95,221 |
| Mean Household Income | 805 | $105,605 |
| Income Deficit | 519 | $0 |
| Wage / Income Gap (%) | 2,105 | 59.82% |
| Wage / Income Gap ($) | 2,105 | 40.18¢ per $1 |
| Gini / Inequality Index | 2,105 | 0.38 |
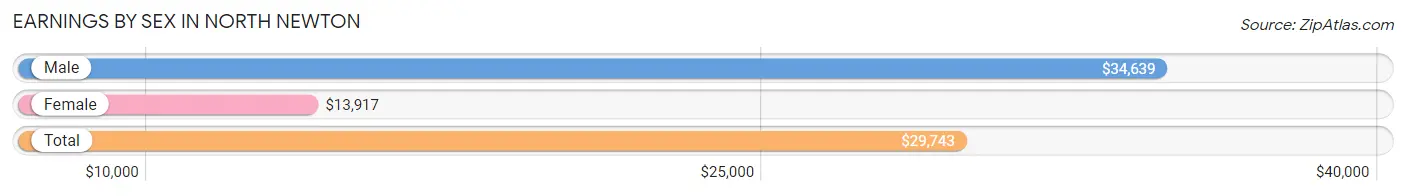
Earnings by Sex in North Newton
Average Earnings in North Newton are $29,743, $34,639 for men and $13,917 for women, a difference of 59.8%.
| Sex | Number | Average Earnings |
| Male | 610 (52.0%) | $34,639 |
| Female | 563 (48.0%) | $13,917 |
| Total | 1,173 (100.0%) | $29,743 |
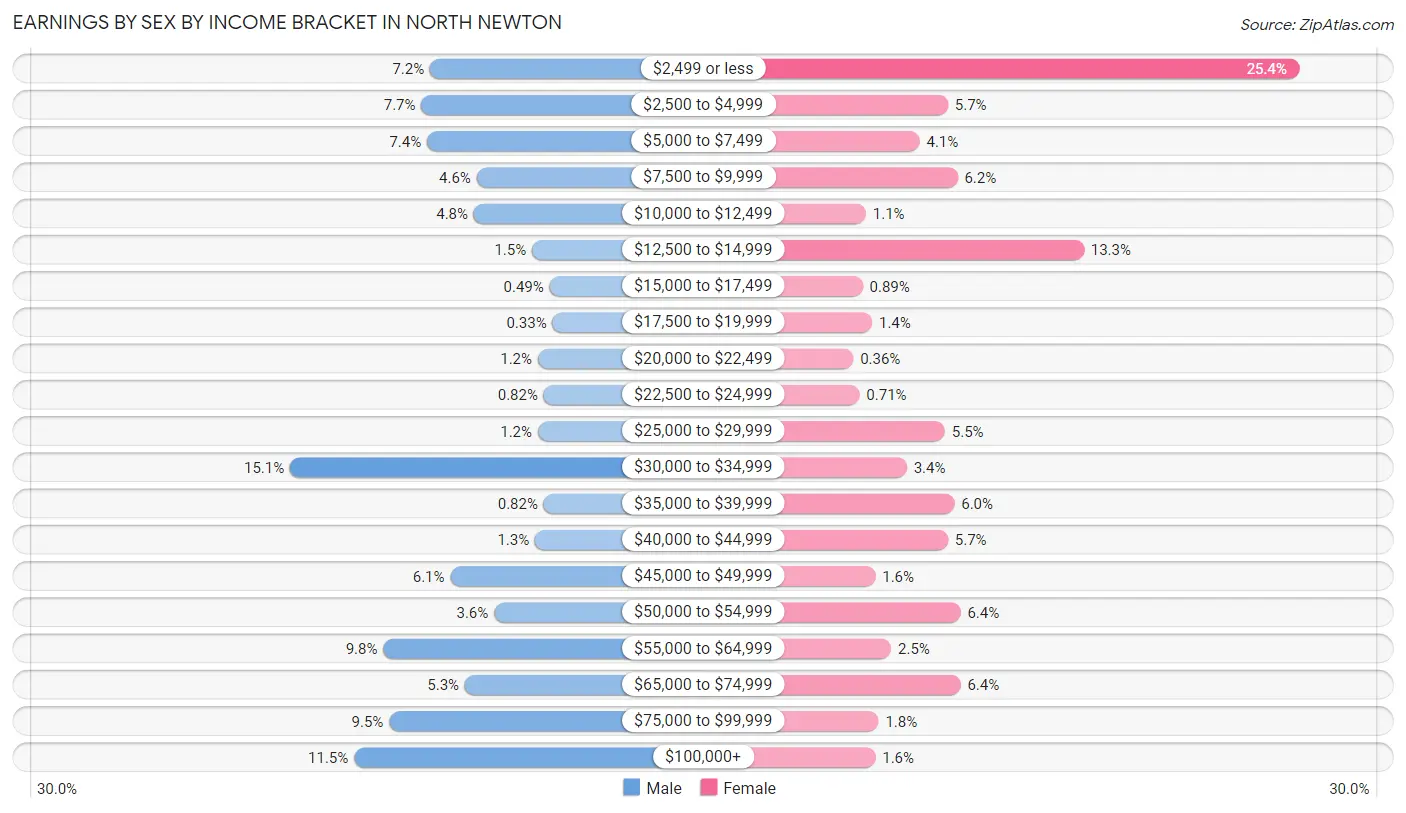
Earnings by Sex by Income Bracket in North Newton
The most common earnings brackets in North Newton are $30,000 to $34,999 for men (92 | 15.1%) and $2,499 or less for women (143 | 25.4%).
| Income | Male | Female |
| $2,499 or less | 44 (7.2%) | 143 (25.4%) |
| $2,500 to $4,999 | 47 (7.7%) | 32 (5.7%) |
| $5,000 to $7,499 | 45 (7.4%) | 23 (4.1%) |
| $7,500 to $9,999 | 28 (4.6%) | 35 (6.2%) |
| $10,000 to $12,499 | 29 (4.8%) | 6 (1.1%) |
| $12,500 to $14,999 | 9 (1.5%) | 75 (13.3%) |
| $15,000 to $17,499 | 3 (0.5%) | 5 (0.9%) |
| $17,500 to $19,999 | 2 (0.3%) | 8 (1.4%) |
| $20,000 to $22,499 | 7 (1.1%) | 2 (0.4%) |
| $22,500 to $24,999 | 5 (0.8%) | 4 (0.7%) |
| $25,000 to $29,999 | 7 (1.1%) | 31 (5.5%) |
| $30,000 to $34,999 | 92 (15.1%) | 19 (3.4%) |
| $35,000 to $39,999 | 5 (0.8%) | 34 (6.0%) |
| $40,000 to $44,999 | 8 (1.3%) | 32 (5.7%) |
| $45,000 to $49,999 | 37 (6.1%) | 9 (1.6%) |
| $50,000 to $54,999 | 22 (3.6%) | 36 (6.4%) |
| $55,000 to $64,999 | 60 (9.8%) | 14 (2.5%) |
| $65,000 to $74,999 | 32 (5.2%) | 36 (6.4%) |
| $75,000 to $99,999 | 58 (9.5%) | 10 (1.8%) |
| $100,000+ | 70 (11.5%) | 9 (1.6%) |
| Total | 610 (100.0%) | 563 (100.0%) |
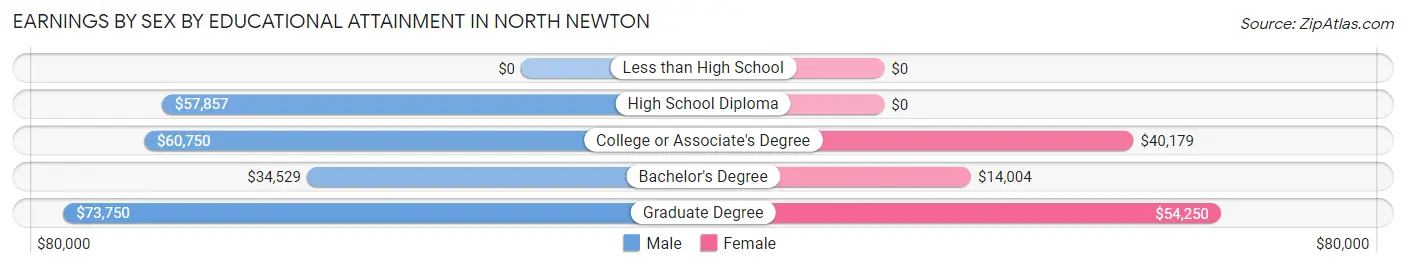
Earnings by Sex by Educational Attainment in North Newton
Average earnings in North Newton are $54,375 for men and $31,719 for women, a difference of 41.7%. Men with an educational attainment of graduate degree enjoy the highest average annual earnings of $73,750, while those with bachelor's degree education earn the least with $34,529. Women with an educational attainment of graduate degree earn the most with the average annual earnings of $54,250, while those with bachelor's degree education have the smallest earnings of $14,004.
| Educational Attainment | Male Income | Female Income |
| Less than High School | - | - |
| High School Diploma | $57,857 | $0 |
| College or Associate's Degree | $60,750 | $40,179 |
| Bachelor's Degree | $34,529 | $14,004 |
| Graduate Degree | $73,750 | $54,250 |
| Total | $54,375 | $31,719 |
Family Income in North Newton
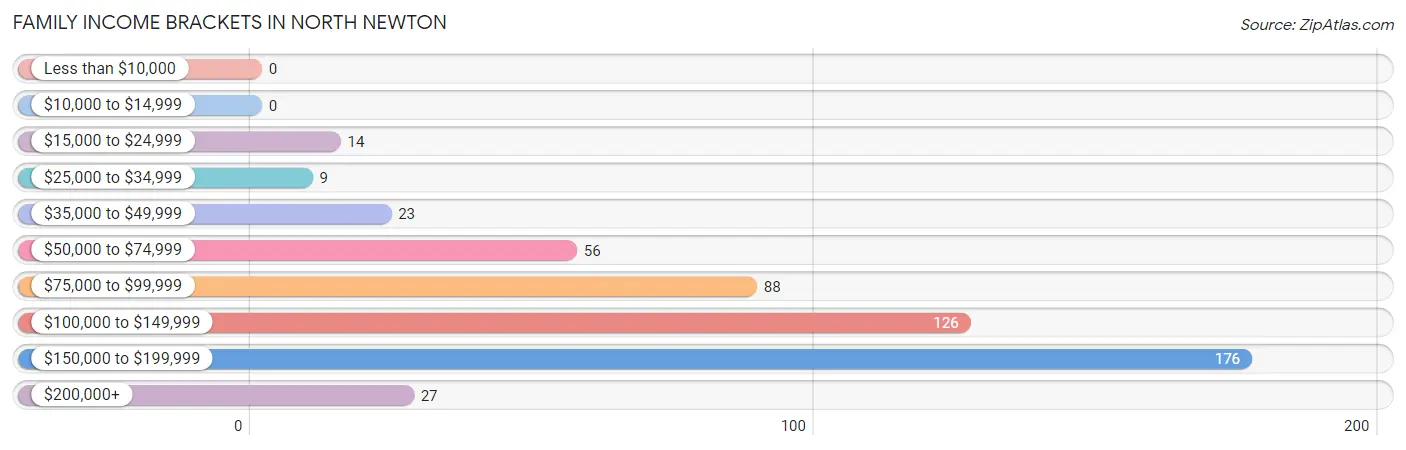
Family Income Brackets in North Newton
According to the North Newton family income data, there are 176 families falling into the $150,000 to $199,999 income range, which is the most common income bracket and makes up 33.9% of all families.
| Income Bracket | # Families | % Families |
| Less than $10,000 | 0 | 0.0% |
| $10,000 to $14,999 | 0 | 0.0% |
| $15,000 to $24,999 | 14 | 2.7% |
| $25,000 to $34,999 | 9 | 1.7% |
| $35,000 to $49,999 | 23 | 4.4% |
| $50,000 to $74,999 | 56 | 10.8% |
| $75,000 to $99,999 | 88 | 17.0% |
| $100,000 to $149,999 | 126 | 24.3% |
| $150,000 to $199,999 | 176 | 33.9% |
| $200,000+ | 27 | 5.2% |
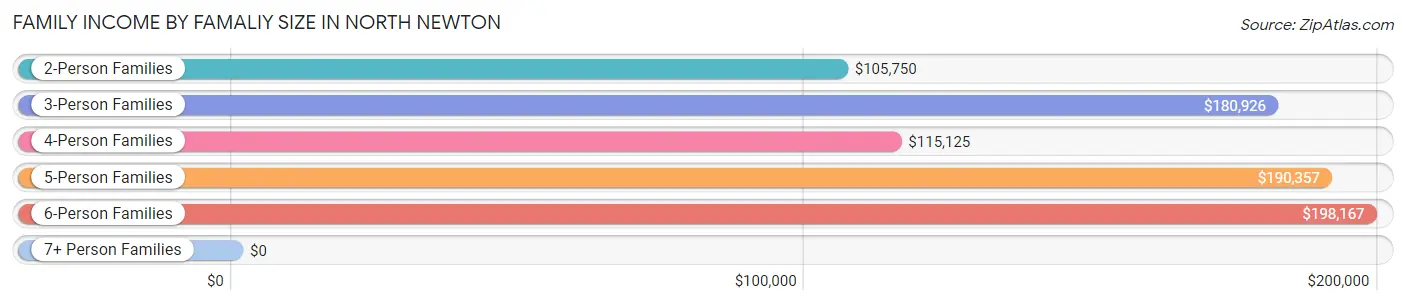
Family Income by Famaliy Size in North Newton
6-person families (22 | 4.2%) account for the highest median family income in North Newton with $198,167 per family, while 3-person families (112 | 21.6%) have the highest median income of $60,309 per family member.
| Income Bracket | # Families | Median Income |
| 2-Person Families | 277 (53.4%) | $105,750 |
| 3-Person Families | 112 (21.6%) | $180,926 |
| 4-Person Families | 43 (8.3%) | $115,125 |
| 5-Person Families | 62 (11.9%) | $190,357 |
| 6-Person Families | 22 (4.2%) | $198,167 |
| 7+ Person Families | 3 (0.6%) | $0 |
| Total | 519 (100.0%) | $125,893 |
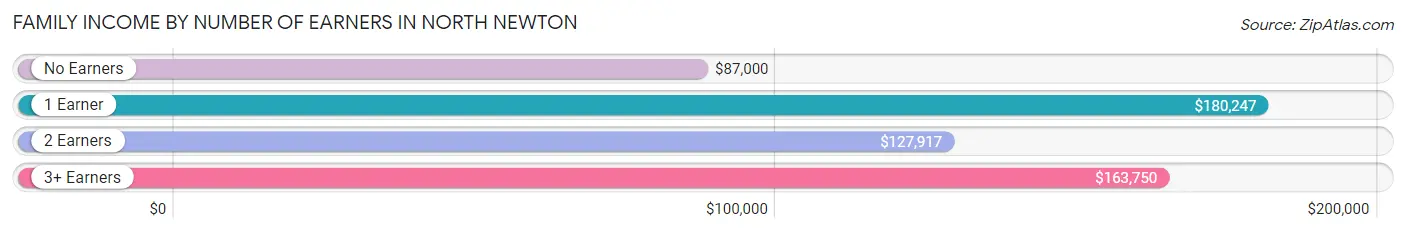
Family Income by Number of Earners in North Newton
The median family income in North Newton is $125,893, with families comprising 1 earner (156) having the highest median family income of $180,247, while families with no earners (114) have the lowest median family income of $87,000, accounting for 30.1% and 22.0% of families, respectively.
| Number of Earners | # Families | Median Income |
| No Earners | 114 (22.0%) | $87,000 |
| 1 Earner | 156 (30.1%) | $180,247 |
| 2 Earners | 205 (39.5%) | $127,917 |
| 3+ Earners | 44 (8.5%) | $163,750 |
| Total | 519 (100.0%) | $125,893 |
Household Income in North Newton
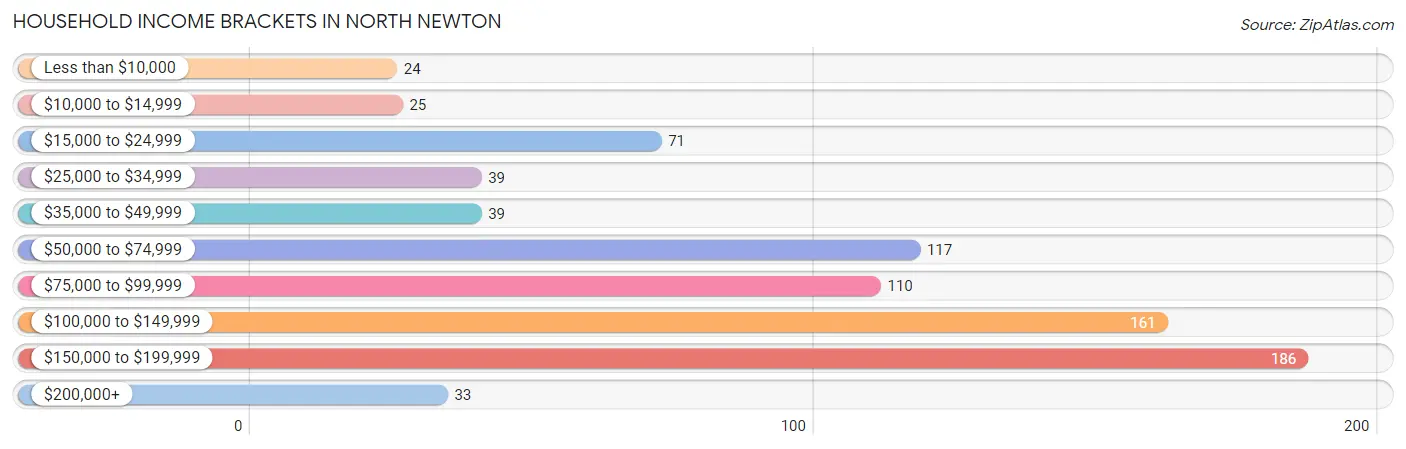
Household Income Brackets in North Newton
With 186 households falling in the category, the $150,000 to $199,999 income range is the most frequent in North Newton, accounting for 23.1% of all households. In contrast, only 24 households (3.0%) fall into the less than $10,000 income bracket, making it the least populous group.
| Income Bracket | # Households | % Households |
| Less than $10,000 | 24 | 3.0% |
| $10,000 to $14,999 | 25 | 3.1% |
| $15,000 to $24,999 | 71 | 8.8% |
| $25,000 to $34,999 | 39 | 4.8% |
| $35,000 to $49,999 | 39 | 4.8% |
| $50,000 to $74,999 | 117 | 14.5% |
| $75,000 to $99,999 | 110 | 13.7% |
| $100,000 to $149,999 | 161 | 20.0% |
| $150,000 to $199,999 | 186 | 23.1% |
| $200,000+ | 33 | 4.1% |
Household Income by Householder Age in North Newton
The median household income in North Newton is $95,221, with the highest median household income of $133,413 found in the 15 to 24 years age bracket for the primary householder. A total of 33 households (4.1%) fall into this category. Meanwhile, the 65+ years age bracket for the primary householder has the lowest median household income of $78,750, with 445 households (55.3%) in this group.
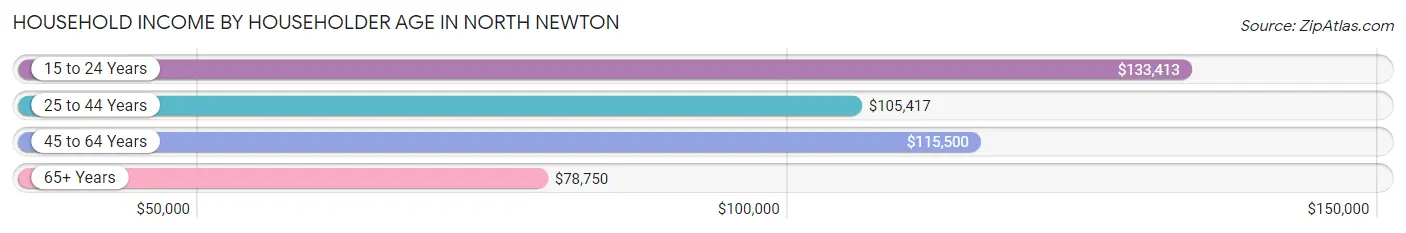
| Income Bracket | # Households | Median Income |
| 15 to 24 Years | 33 (4.1%) | $133,413 |
| 25 to 44 Years | 191 (23.7%) | $105,417 |
| 45 to 64 Years | 136 (16.9%) | $115,500 |
| 65+ Years | 445 (55.3%) | $78,750 |
| Total | 805 (100.0%) | $95,221 |
Poverty in North Newton
Income Below Poverty by Sex and Age in North Newton
With 3.0% poverty level for males and 4.2% for females among the residents of North Newton, 55 to 64 year old males and 18 to 24 year old females are the most vulnerable to poverty, with 7 males (13.2%) and 3 females (16.7%) in their respective age groups living below the poverty level.
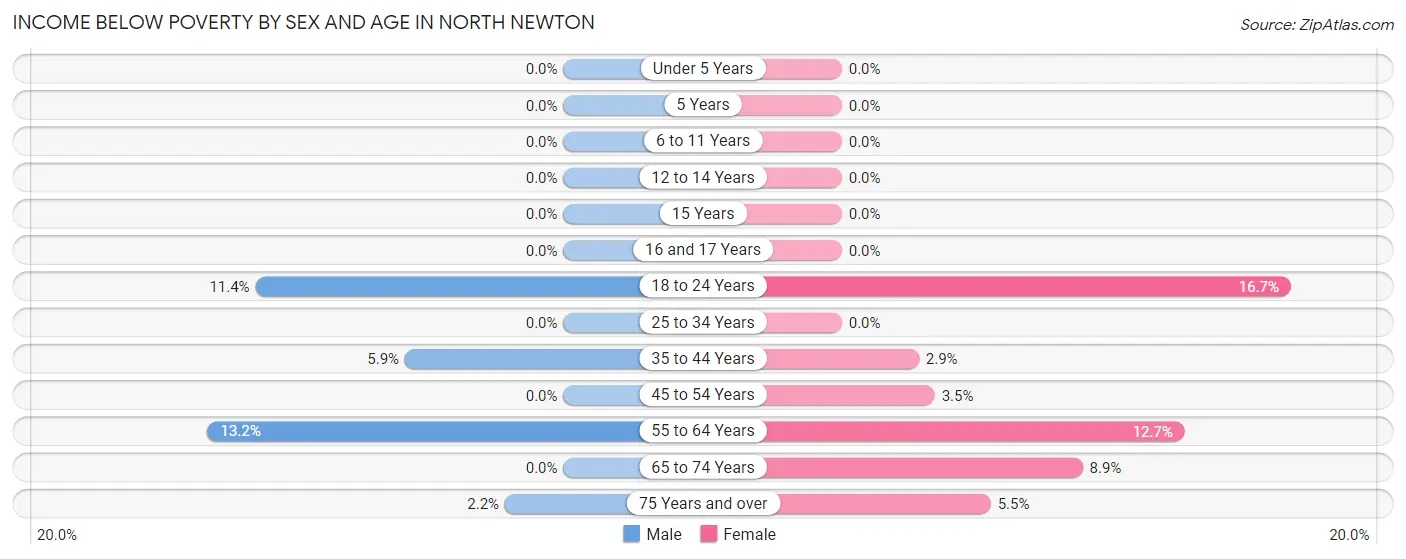
| Age Bracket | Male | Female |
| Under 5 Years | 0 (0.0%) | 0 (0.0%) |
| 5 Years | 0 (0.0%) | 0 (0.0%) |
| 6 to 11 Years | 0 (0.0%) | 0 (0.0%) |
| 12 to 14 Years | 0 (0.0%) | 0 (0.0%) |
| 15 Years | 0 (0.0%) | 0 (0.0%) |
| 16 and 17 Years | 0 (0.0%) | 0 (0.0%) |
| 18 to 24 Years | 8 (11.4%) | 3 (16.7%) |
| 25 to 34 Years | 0 (0.0%) | 0 (0.0%) |
| 35 to 44 Years | 5 (5.9%) | 2 (2.9%) |
| 45 to 54 Years | 0 (0.0%) | 3 (3.5%) |
| 55 to 64 Years | 7 (13.2%) | 7 (12.7%) |
| 65 to 74 Years | 0 (0.0%) | 11 (8.9%) |
| 75 Years and over | 3 (2.2%) | 11 (5.5%) |
| Total | 23 (3.0%) | 37 (4.2%) |
Income Above Poverty by Sex and Age in North Newton
According to the poverty statistics in North Newton, males aged under 5 years and females aged under 5 years are the age groups that are most secure financially, with 100.0% of males and 100.0% of females in these age groups living above the poverty line.
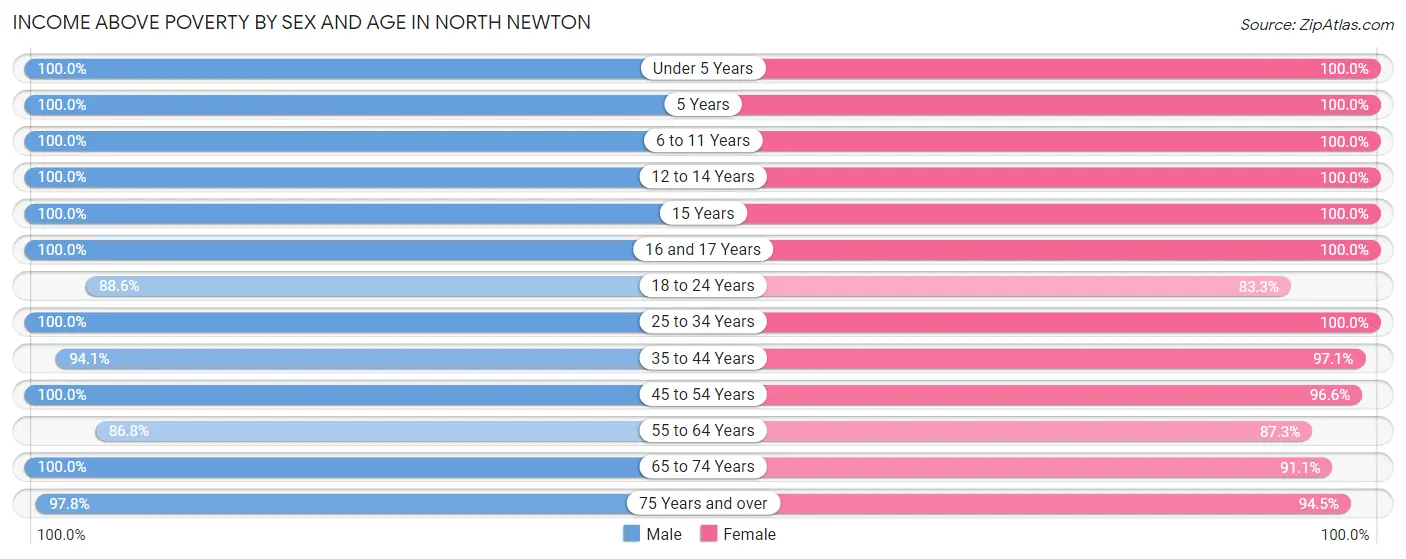
| Age Bracket | Male | Female |
| Under 5 Years | 43 (100.0%) | 48 (100.0%) |
| 5 Years | 9 (100.0%) | 28 (100.0%) |
| 6 to 11 Years | 45 (100.0%) | 50 (100.0%) |
| 12 to 14 Years | 14 (100.0%) | 25 (100.0%) |
| 15 Years | 3 (100.0%) | 37 (100.0%) |
| 16 and 17 Years | 6 (100.0%) | 25 (100.0%) |
| 18 to 24 Years | 62 (88.6%) | 15 (83.3%) |
| 25 to 34 Years | 73 (100.0%) | 126 (100.0%) |
| 35 to 44 Years | 80 (94.1%) | 68 (97.1%) |
| 45 to 54 Years | 84 (100.0%) | 84 (96.6%) |
| 55 to 64 Years | 46 (86.8%) | 48 (87.3%) |
| 65 to 74 Years | 150 (100.0%) | 112 (91.1%) |
| 75 Years and over | 135 (97.8%) | 188 (94.5%) |
| Total | 750 (97.0%) | 854 (95.9%) |
Income Below Poverty Among Married-Couple Families in North Newton
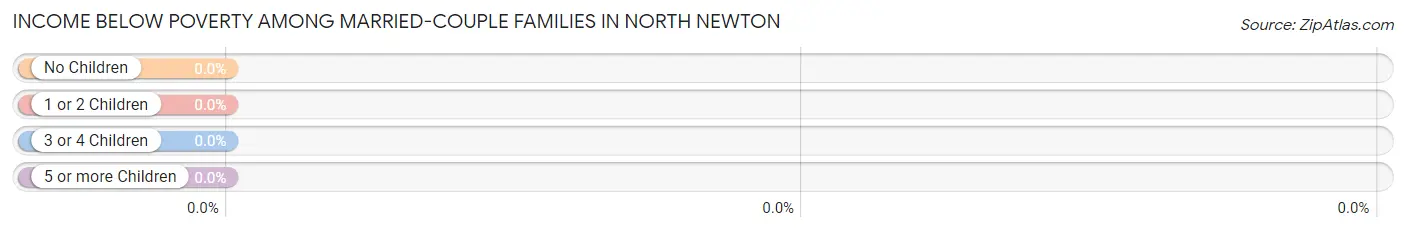
| Children | Above Poverty | Below Poverty |
| No Children | 264 (100.0%) | 0 (0.0%) |
| 1 or 2 Children | 130 (100.0%) | 0 (0.0%) |
| 3 or 4 Children | 59 (100.0%) | 0 (0.0%) |
| 5 or more Children | 3 (100.0%) | 0 (0.0%) |
| Total | 456 (100.0%) | 0 (0.0%) |
Income Below Poverty Among Single-Parent Households in North Newton
| Children | Single Father | Single Mother |
| No Children | 0 (0.0%) | 0 (0.0%) |
| 1 or 2 Children | 0 (0.0%) | 0 (0.0%) |
| 3 or 4 Children | 0 (0.0%) | 0 (0.0%) |
| 5 or more Children | 0 (0.0%) | 0 (0.0%) |
| Total | 0 (0.0%) | 0 (0.0%) |
Income Below Poverty Among Married-Couple vs Single-Parent Households in North Newton
| Children | Married-Couple Families | Single-Parent Households |
| No Children | 0 (0.0%) | 0 (0.0%) |
| 1 or 2 Children | 0 (0.0%) | 0 (0.0%) |
| 3 or 4 Children | 0 (0.0%) | 0 (0.0%) |
| 5 or more Children | 0 (0.0%) | 0 (0.0%) |
| Total | 0 (0.0%) | 0 (0.0%) |
Race in North Newton
The most populous races in North Newton are White / Caucasian (1,621 | 77.0%), Asian (243 | 11.5%), and Hispanic or Latino (218 | 10.4%).
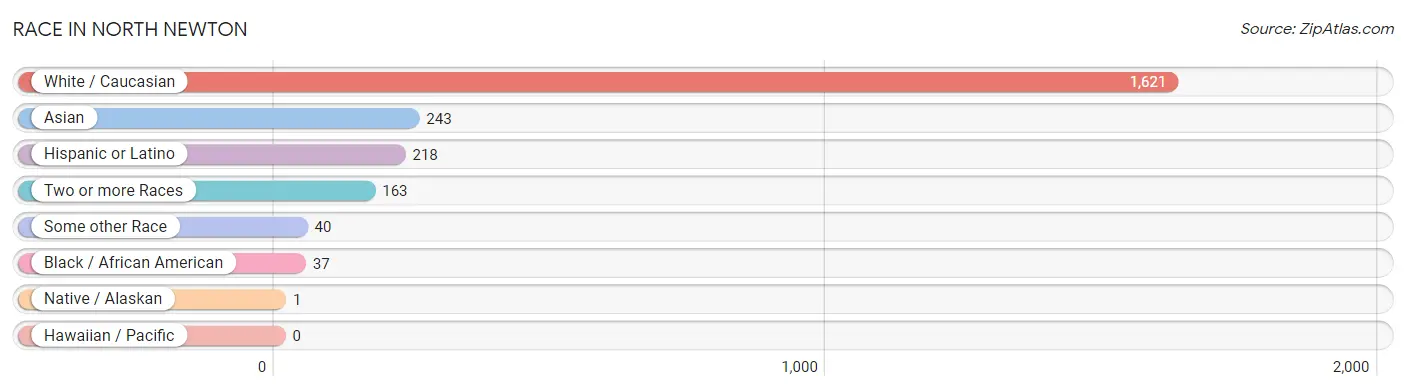
| Race | # Population | % Population |
| Asian | 243 | 11.5% |
| Black / African American | 37 | 1.8% |
| Hawaiian / Pacific | 0 | 0.0% |
| Hispanic or Latino | 218 | 10.4% |
| Native / Alaskan | 1 | 0.1% |
| White / Caucasian | 1,621 | 77.0% |
| Two or more Races | 163 | 7.7% |
| Some other Race | 40 | 1.9% |
| Total | 2,105 | 100.0% |
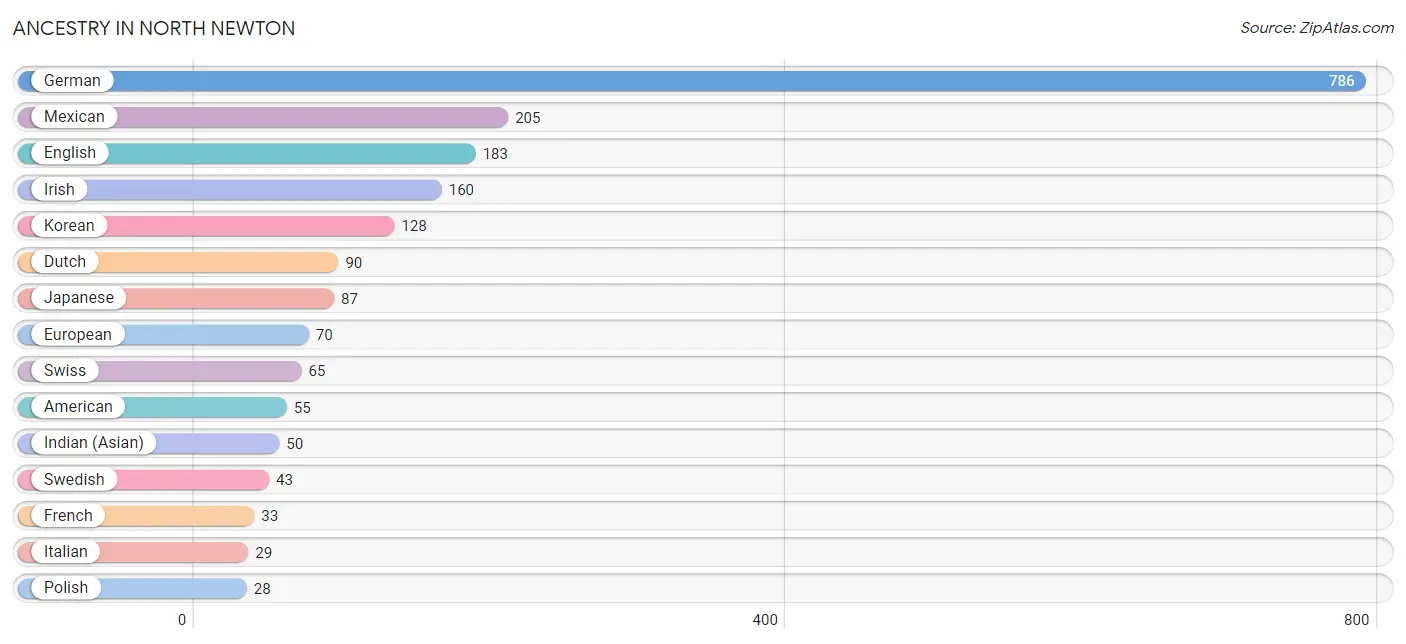
Ancestry in North Newton
The most populous ancestries reported in North Newton are German (786 | 37.3%), Mexican (205 | 9.7%), English (183 | 8.7%), Irish (160 | 7.6%), and Korean (128 | 6.1%), together accounting for 69.4% of all North Newton residents.
| Ancestry | # Population | % Population |
| American | 55 | 2.6% |
| Austrian | 3 | 0.1% |
| British | 10 | 0.5% |
| Cherokee | 19 | 0.9% |
| Czech | 15 | 0.7% |
| Danish | 5 | 0.2% |
| Delaware | 10 | 0.5% |
| Dutch | 90 | 4.3% |
| Eastern European | 16 | 0.8% |
| English | 183 | 8.7% |
| Ethiopian | 11 | 0.5% |
| European | 70 | 3.3% |
| French | 33 | 1.6% |
| German | 786 | 37.3% |
| Hungarian | 7 | 0.3% |
| Indian (Asian) | 50 | 2.4% |
| Irish | 160 | 7.6% |
| Italian | 29 | 1.4% |
| Japanese | 87 | 4.1% |
| Korean | 128 | 6.1% |
| Latvian | 1 | 0.1% |
| Mexican | 205 | 9.7% |
| Northern European | 2 | 0.1% |
| Norwegian | 14 | 0.7% |
| Polish | 28 | 1.3% |
| Potawatomi | 26 | 1.2% |
| Puerto Rican | 3 | 0.1% |
| Russian | 26 | 1.2% |
| Scandinavian | 5 | 0.2% |
| Scotch-Irish | 15 | 0.7% |
| Scottish | 13 | 0.6% |
| Sioux | 1 | 0.1% |
| Slavic | 3 | 0.1% |
| Slovak | 3 | 0.1% |
| South American | 5 | 0.2% |
| Subsaharan African | 12 | 0.6% |
| Swedish | 43 | 2.0% |
| Swiss | 65 | 3.1% |
| Ukrainian | 8 | 0.4% |
| Uruguayan | 5 | 0.2% |
| Welsh | 8 | 0.4% | View All 41 Rows |
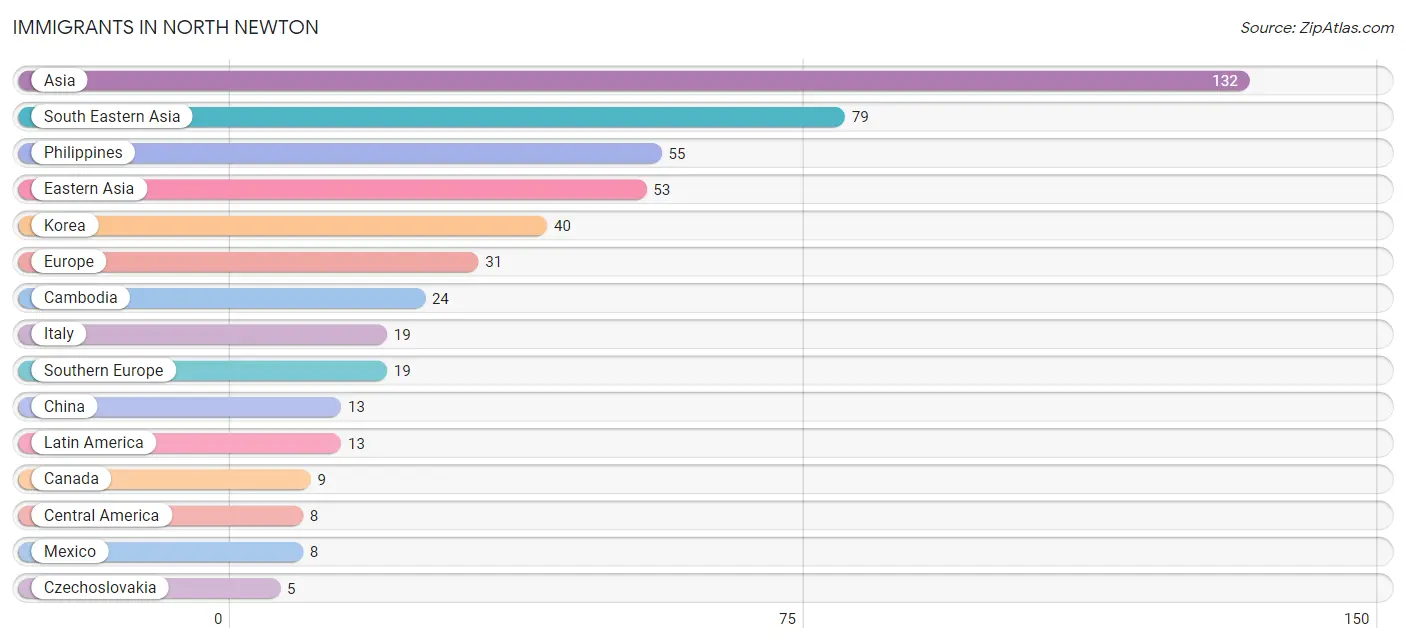
Immigrants in North Newton
The most numerous immigrant groups reported in North Newton came from Asia (132 | 6.3%), South Eastern Asia (79 | 3.7%), Philippines (55 | 2.6%), Eastern Asia (53 | 2.5%), and Korea (40 | 1.9%), together accounting for 17.1% of all North Newton residents.
| Immigration Origin | # Population | % Population |
| Africa | 1 | 0.1% |
| Asia | 132 | 6.3% |
| Cambodia | 24 | 1.1% |
| Canada | 9 | 0.4% |
| Central America | 8 | 0.4% |
| China | 13 | 0.6% |
| Czechoslovakia | 5 | 0.2% |
| Eastern Asia | 53 | 2.5% |
| Eastern Europe | 5 | 0.2% |
| England | 4 | 0.2% |
| Europe | 31 | 1.5% |
| Italy | 19 | 0.9% |
| Korea | 40 | 1.9% |
| Latin America | 13 | 0.6% |
| Mexico | 8 | 0.4% |
| Netherlands | 3 | 0.1% |
| Northern Europe | 4 | 0.2% |
| Philippines | 55 | 2.6% |
| South America | 5 | 0.2% |
| South Eastern Asia | 79 | 3.7% |
| Southern Europe | 19 | 0.9% |
| Uruguay | 5 | 0.2% |
| Western Africa | 1 | 0.1% |
| Western Europe | 3 | 0.1% | View All 24 Rows |
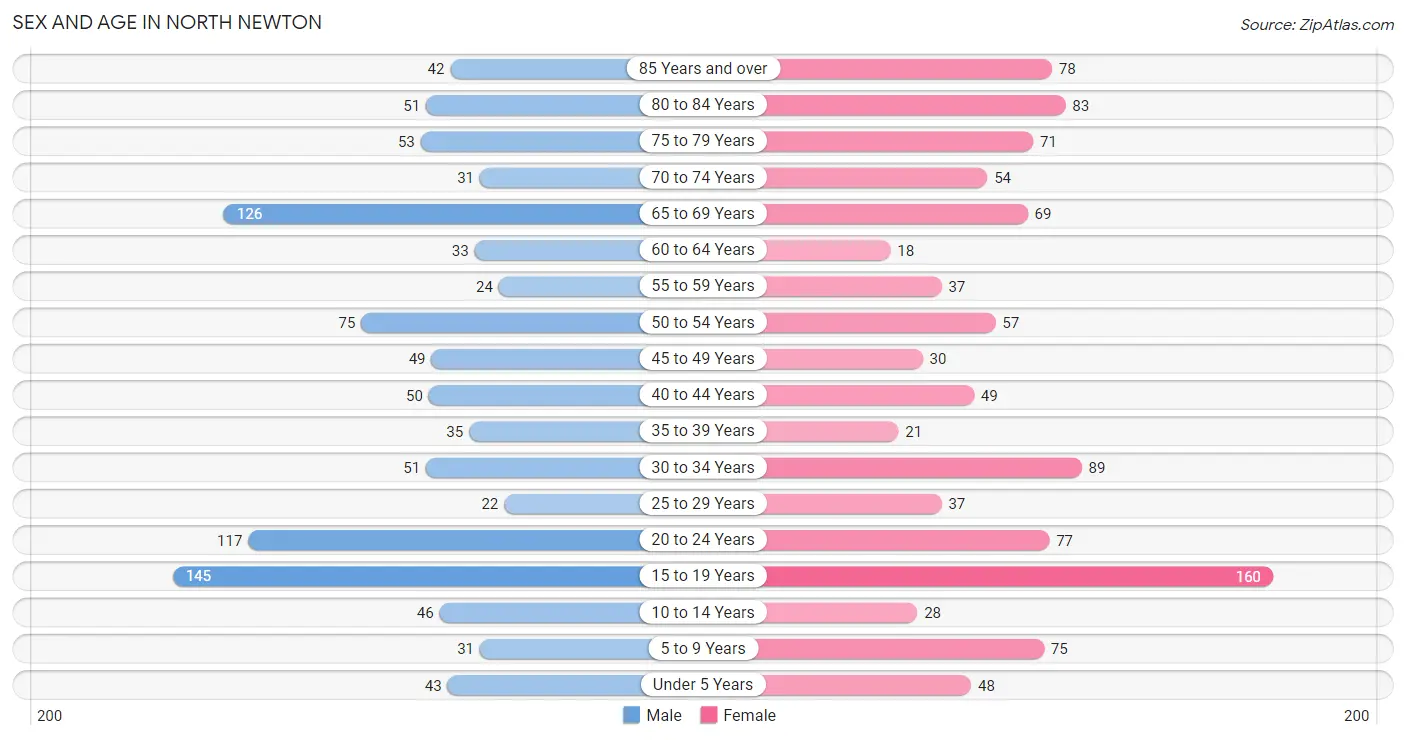
Sex and Age in North Newton
Sex and Age in North Newton
The most populous age groups in North Newton are 15 to 19 Years (145 | 14.2%) for men and 15 to 19 Years (160 | 14.8%) for women.
| Age Bracket | Male | Female |
| Under 5 Years | 43 (4.2%) | 48 (4.4%) |
| 5 to 9 Years | 31 (3.0%) | 75 (6.9%) |
| 10 to 14 Years | 46 (4.5%) | 28 (2.6%) |
| 15 to 19 Years | 145 (14.2%) | 160 (14.8%) |
| 20 to 24 Years | 117 (11.4%) | 77 (7.1%) |
| 25 to 29 Years | 22 (2.1%) | 37 (3.4%) |
| 30 to 34 Years | 51 (5.0%) | 89 (8.2%) |
| 35 to 39 Years | 35 (3.4%) | 21 (1.9%) |
| 40 to 44 Years | 50 (4.9%) | 49 (4.5%) |
| 45 to 49 Years | 49 (4.8%) | 30 (2.8%) |
| 50 to 54 Years | 75 (7.3%) | 57 (5.3%) |
| 55 to 59 Years | 24 (2.3%) | 37 (3.4%) |
| 60 to 64 Years | 33 (3.2%) | 18 (1.7%) |
| 65 to 69 Years | 126 (12.3%) | 69 (6.4%) |
| 70 to 74 Years | 31 (3.0%) | 54 (5.0%) |
| 75 to 79 Years | 53 (5.2%) | 71 (6.6%) |
| 80 to 84 Years | 51 (5.0%) | 83 (7.7%) |
| 85 Years and over | 42 (4.1%) | 78 (7.2%) |
| Total | 1,024 (100.0%) | 1,081 (100.0%) |
Families and Households in North Newton
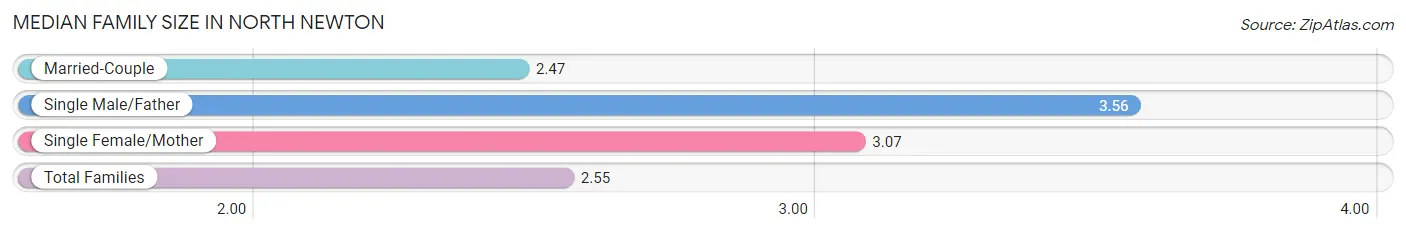
Median Family Size in North Newton
The median family size in North Newton is 2.55 persons per family, with single male/father families (9 | 1.7%) accounting for the largest median family size of 3.56 persons per family. On the other hand, married-couple families (456 | 87.9%) represent the smallest median family size with 2.47 persons per family.
| Family Type | # Families | Family Size |
| Married-Couple | 456 (87.9%) | 2.47 |
| Single Male/Father | 9 (1.7%) | 3.56 |
| Single Female/Mother | 54 (10.4%) | 3.07 |
| Total Families | 519 (100.0%) | 2.55 |
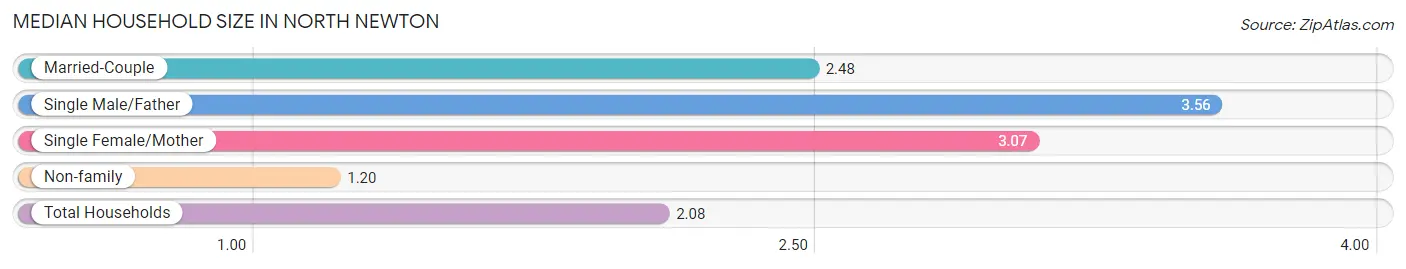
Median Household Size in North Newton
The median household size in North Newton is 2.08 persons per household, with single male/father households (9 | 1.1%) accounting for the largest median household size of 3.56 persons per household. non-family households (286 | 35.5%) represent the smallest median household size with 1.20 persons per household.
| Household Type | # Households | Household Size |
| Married-Couple | 456 (56.7%) | 2.48 |
| Single Male/Father | 9 (1.1%) | 3.56 |
| Single Female/Mother | 54 (6.7%) | 3.07 |
| Non-family | 286 (35.5%) | 1.20 |
| Total Households | 805 (100.0%) | 2.08 |
Household Size by Marriage Status in North Newton
Out of a total of 805 households in North Newton, 519 (64.5%) are family households, while 286 (35.5%) are nonfamily households. The most numerous type of family households are 2-person households, comprising 276, and the most common type of nonfamily households are 1-person households, comprising 246.
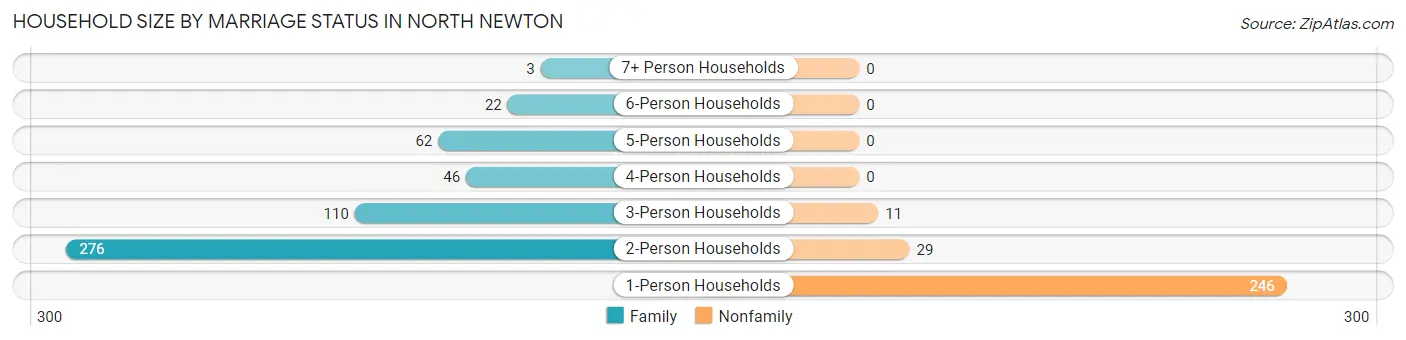
| Household Size | Family Households | Nonfamily Households |
| 1-Person Households | - | 246 (30.6%) |
| 2-Person Households | 276 (34.3%) | 29 (3.6%) |
| 3-Person Households | 110 (13.7%) | 11 (1.4%) |
| 4-Person Households | 46 (5.7%) | 0 (0.0%) |
| 5-Person Households | 62 (7.7%) | 0 (0.0%) |
| 6-Person Households | 22 (2.7%) | 0 (0.0%) |
| 7+ Person Households | 3 (0.4%) | 0 (0.0%) |
| Total | 519 (64.5%) | 286 (35.5%) |
Female Fertility in North Newton
Fertility by Age in North Newton
Average fertility rate in North Newton is 43.0 births per 1,000 women. Women in the age bracket of 20 to 34 years have the highest fertility rate with 99.0 births per 1,000 women. Women in the age bracket of 20 to 34 years acount for 100.0% of all women with births.
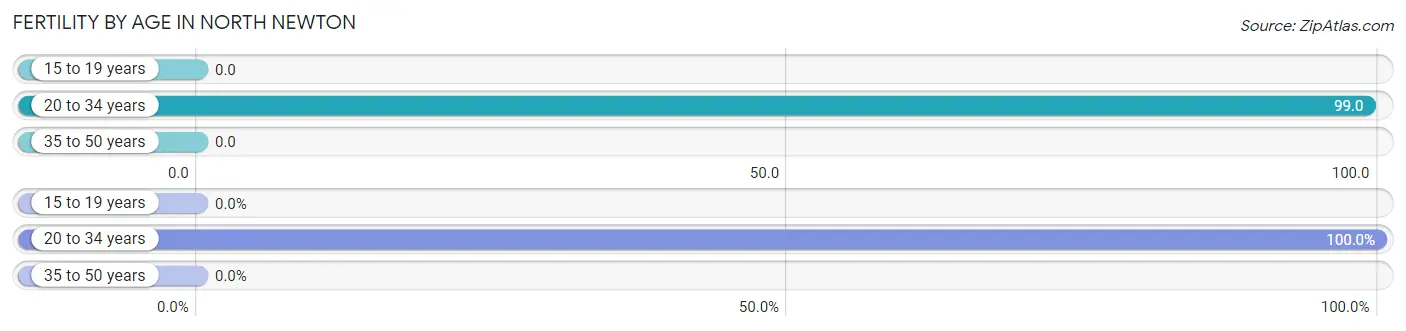
| Age Bracket | Women with Births | Births / 1,000 Women |
| 15 to 19 years | 0 (0.0%) | 0.0 |
| 20 to 34 years | 20 (100.0%) | 99.0 |
| 35 to 50 years | 0 (0.0%) | 0.0 |
| Total | 20 (100.0%) | 43.0 |
Fertility by Age by Marriage Status in North Newton
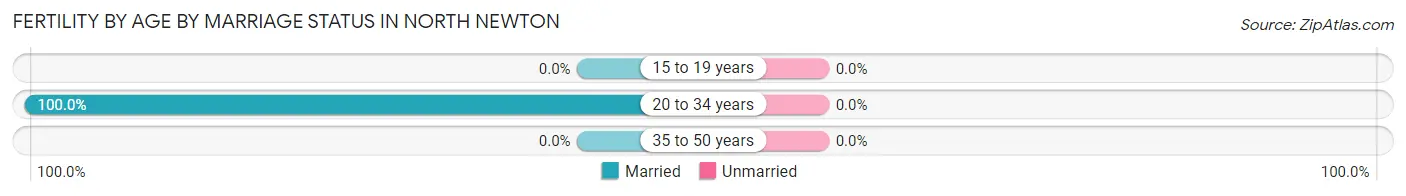
| Age Bracket | Married | Unmarried |
| 15 to 19 years | 0 (0.0%) | 0 (0.0%) |
| 20 to 34 years | 20 (100.0%) | 0 (0.0%) |
| 35 to 50 years | 0 (0.0%) | 0 (0.0%) |
| Total | 20 (100.0%) | 0 (0.0%) |
Fertility by Education in North Newton
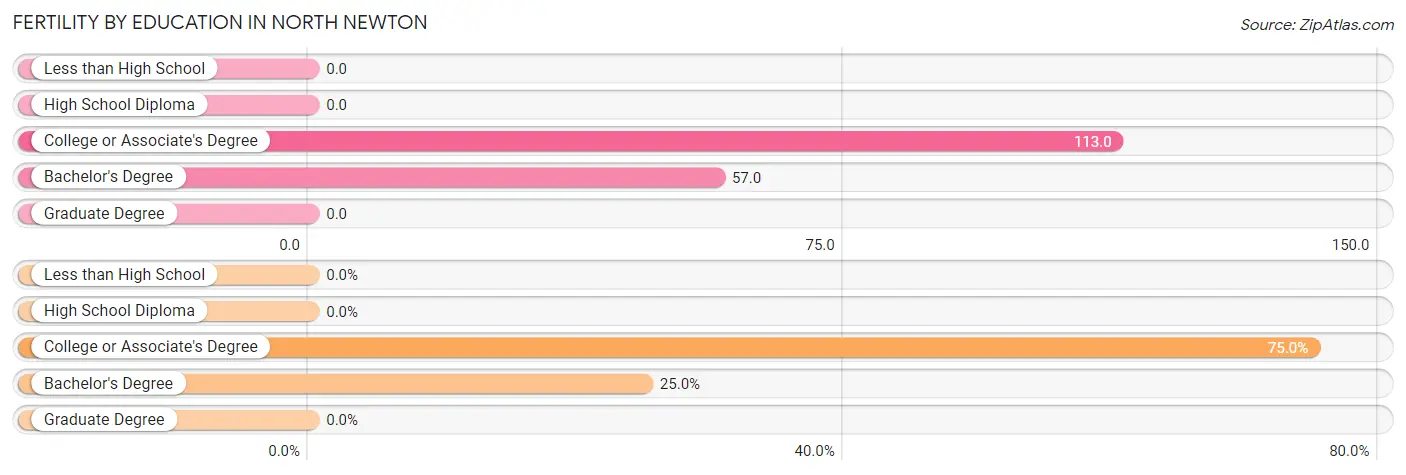
| Educational Attainment | Women with Births | Births / 1,000 Women |
| Less than High School | 0 (0.0%) | 0.0 |
| High School Diploma | 0 (0.0%) | 0.0 |
| College or Associate's Degree | 15 (75.0%) | 113.0 |
| Bachelor's Degree | 5 (25.0%) | 57.0 |
| Graduate Degree | 0 (0.0%) | 0.0 |
| Total | 20 (100.0%) | 43.0 |
Fertility by Education by Marriage Status in North Newton
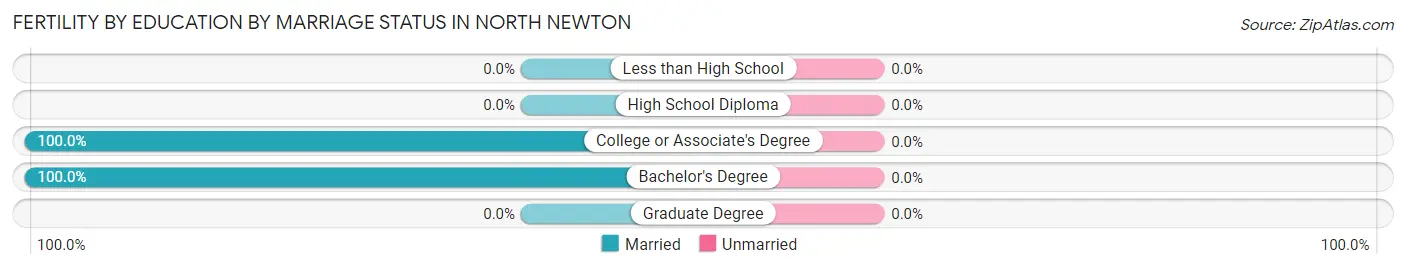
| Educational Attainment | Married | Unmarried |
| Less than High School | 0 (0.0%) | 0 (0.0%) |
| High School Diploma | 0 (0.0%) | 0 (0.0%) |
| College or Associate's Degree | 15 (100.0%) | 0 (0.0%) |
| Bachelor's Degree | 5 (100.0%) | 0 (0.0%) |
| Graduate Degree | 0 (0.0%) | 0 (0.0%) |
| Total | 20 (100.0%) | 0 (0.0%) |
Employment Characteristics in North Newton
Employment by Class of Employer in North Newton
Among the 942 employed individuals in North Newton, private company employees (478 | 50.7%), not-for-profit organizations (232 | 24.6%), and self-employed (incorporated) (93 | 9.9%) make up the most common classes of employment.
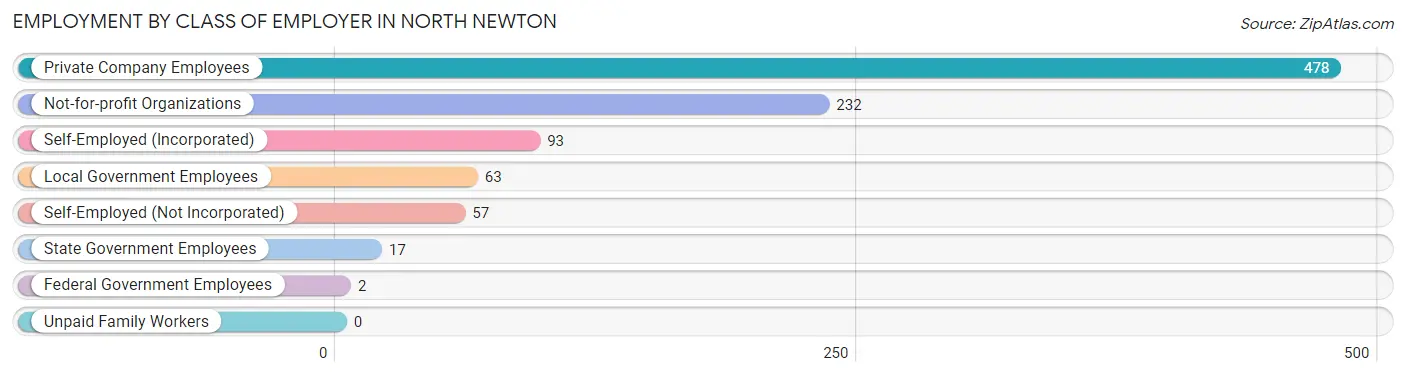
| Employer Class | # Employees | % Employees |
| Private Company Employees | 478 | 50.7% |
| Self-Employed (Incorporated) | 93 | 9.9% |
| Self-Employed (Not Incorporated) | 57 | 6.0% |
| Not-for-profit Organizations | 232 | 24.6% |
| Local Government Employees | 63 | 6.7% |
| State Government Employees | 17 | 1.8% |
| Federal Government Employees | 2 | 0.2% |
| Unpaid Family Workers | 0 | 0.0% |
| Total | 942 | 100.0% |
Employment Status by Age in North Newton
According to the labor force statistics for North Newton, out of the total population over 16 years of age (1,794), 59.4% or 1,066 individuals are in the labor force, with 7.8% or 83 of them unemployed. The age group with the highest labor force participation rate is 25 to 29 years, with 100.0% or 59 individuals in the labor force. Within the labor force, the 16 to 19 years age range has the highest percentage of unemployed individuals, with 27.2% or 46 of them being unemployed.
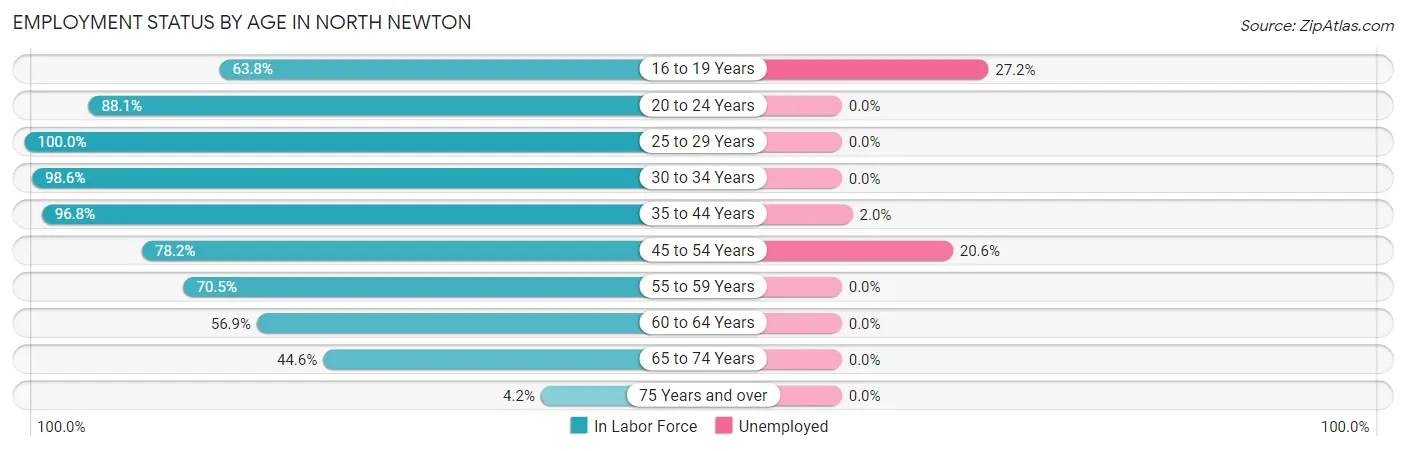
| Age Bracket | In Labor Force | Unemployed |
| 16 to 19 Years | 169 (63.8%) | 46 (27.2%) |
| 20 to 24 Years | 171 (88.1%) | 0 (0.0%) |
| 25 to 29 Years | 59 (100.0%) | 0 (0.0%) |
| 30 to 34 Years | 138 (98.6%) | 0 (0.0%) |
| 35 to 44 Years | 150 (96.8%) | 3 (2.0%) |
| 45 to 54 Years | 165 (78.2%) | 34 (20.6%) |
| 55 to 59 Years | 43 (70.5%) | 0 (0.0%) |
| 60 to 64 Years | 29 (56.9%) | 0 (0.0%) |
| 65 to 74 Years | 125 (44.6%) | 0 (0.0%) |
| 75 Years and over | 16 (4.2%) | 0 (0.0%) |
| Total | 1,066 (59.4%) | 83 (7.8%) |
Employment Status by Educational Attainment in North Newton
According to labor force statistics for North Newton, 86.3% of individuals (584) out of the total population between 25 and 64 years of age (677) are in the labor force, with 6.3% or 37 of them being unemployed. The group with the highest labor force participation rate are those with the educational attainment of college / associate degree, with 100.0% or 207 individuals in the labor force. Within the labor force, individuals with bachelor's degree or higher education have the highest percentage of unemployment, with 12.2% or 37 of them being unemployed.
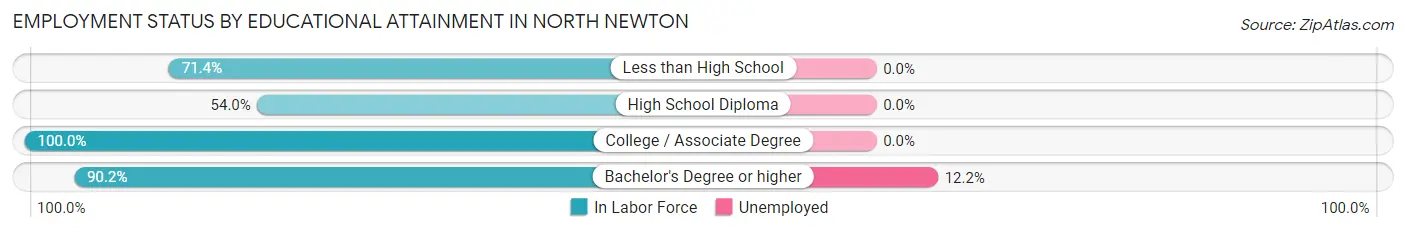
| Educational Attainment | In Labor Force | Unemployed |
| Less than High School | 5 (71.4%) | 0 (0.0%) |
| High School Diploma | 68 (54.0%) | 0 (0.0%) |
| College / Associate Degree | 207 (100.0%) | 0 (0.0%) |
| Bachelor's Degree or higher | 304 (90.2%) | 41 (12.2%) |
| Total | 584 (86.3%) | 43 (6.3%) |
Employment Occupations by Sex in North Newton
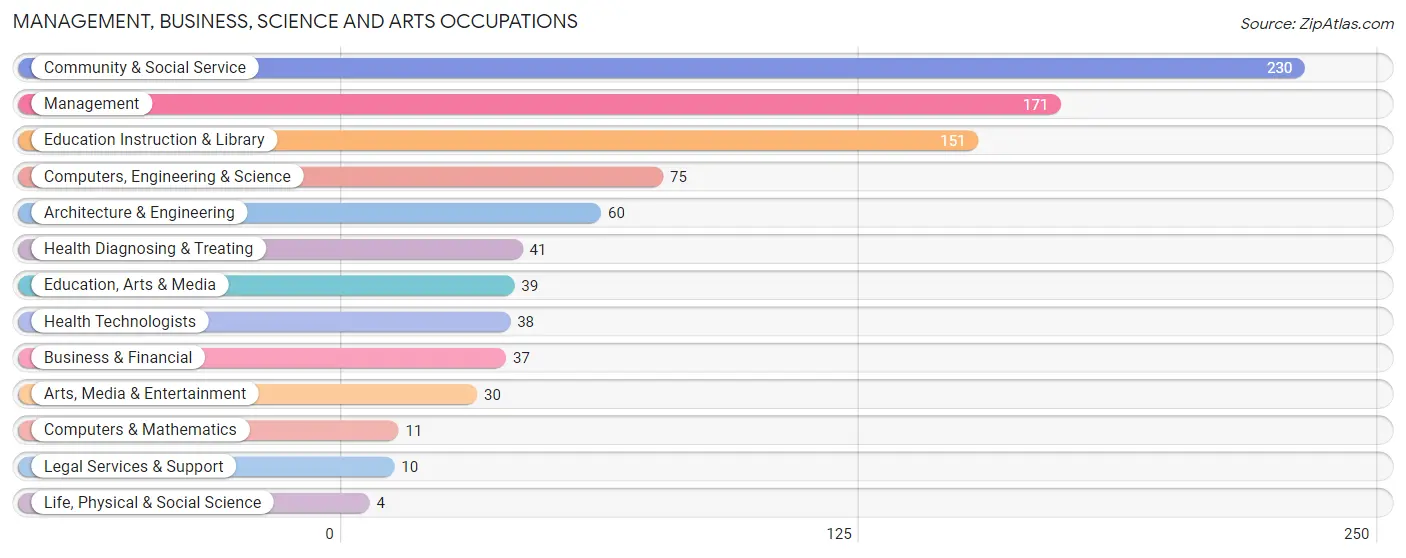
Management, Business, Science and Arts Occupations
The most common Management, Business, Science and Arts occupations in North Newton are Community & Social Service (230 | 23.4%), Management (171 | 17.4%), Education Instruction & Library (151 | 15.4%), Computers, Engineering & Science (75 | 7.6%), and Architecture & Engineering (60 | 6.1%).
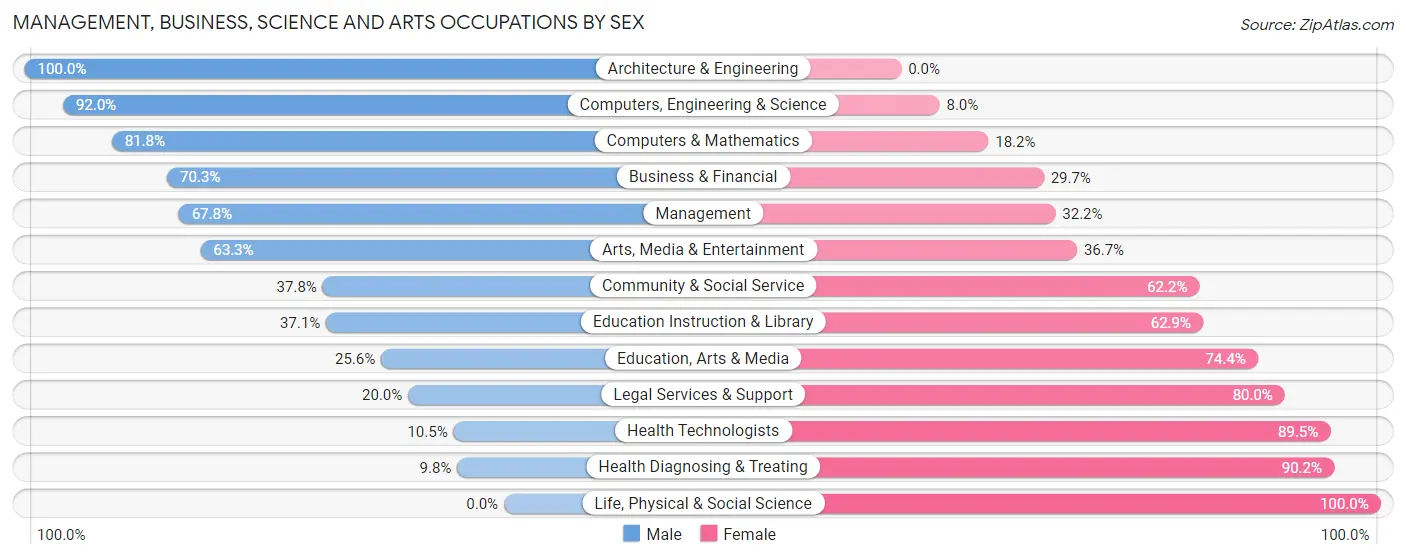
Management, Business, Science and Arts Occupations by Sex
Within the Management, Business, Science and Arts occupations in North Newton, the most male-oriented occupations are Architecture & Engineering (100.0%), Computers, Engineering & Science (92.0%), and Computers & Mathematics (81.8%), while the most female-oriented occupations are Life, Physical & Social Science (100.0%), Health Diagnosing & Treating (90.2%), and Health Technologists (89.5%).
| Occupation | Male | Female |
| Management | 116 (67.8%) | 55 (32.2%) |
| Business & Financial | 26 (70.3%) | 11 (29.7%) |
| Computers, Engineering & Science | 69 (92.0%) | 6 (8.0%) |
| Computers & Mathematics | 9 (81.8%) | 2 (18.2%) |
| Architecture & Engineering | 60 (100.0%) | 0 (0.0%) |
| Life, Physical & Social Science | 0 (0.0%) | 4 (100.0%) |
| Community & Social Service | 87 (37.8%) | 143 (62.2%) |
| Education, Arts & Media | 10 (25.6%) | 29 (74.4%) |
| Legal Services & Support | 2 (20.0%) | 8 (80.0%) |
| Education Instruction & Library | 56 (37.1%) | 95 (62.9%) |
| Arts, Media & Entertainment | 19 (63.3%) | 11 (36.7%) |
| Health Diagnosing & Treating | 4 (9.8%) | 37 (90.2%) |
| Health Technologists | 4 (10.5%) | 34 (89.5%) |
| Total (Category) | 302 (54.5%) | 252 (45.5%) |
| Total (Overall) | 537 (54.7%) | 445 (45.3%) |
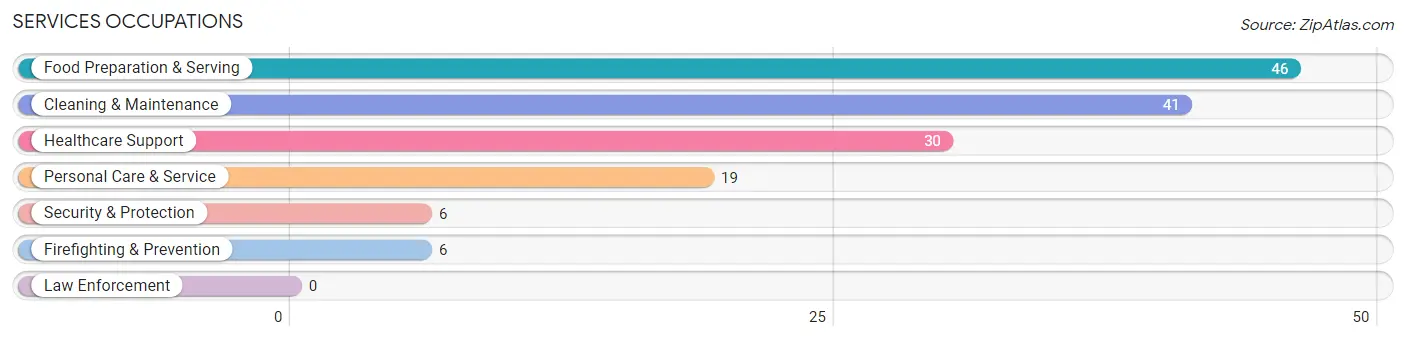
Services Occupations
The most common Services occupations in North Newton are Food Preparation & Serving (46 | 4.7%), Cleaning & Maintenance (41 | 4.2%), Healthcare Support (30 | 3.0%), Personal Care & Service (19 | 1.9%), and Security & Protection (6 | 0.6%).
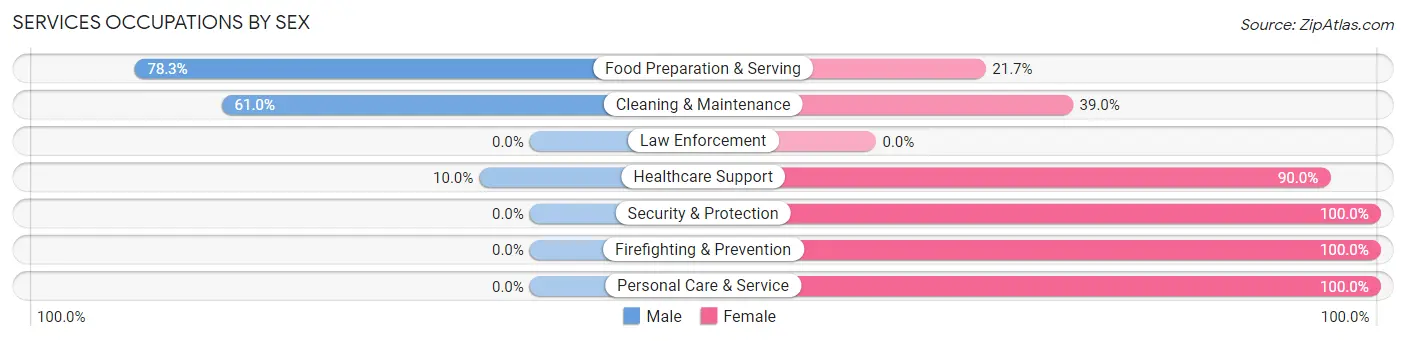
Services Occupations by Sex
Within the Services occupations in North Newton, the most male-oriented occupations are Food Preparation & Serving (78.3%), Cleaning & Maintenance (61.0%), and Healthcare Support (10.0%), while the most female-oriented occupations are Security & Protection (100.0%), Firefighting & Prevention (100.0%), and Personal Care & Service (100.0%).
| Occupation | Male | Female |
| Healthcare Support | 3 (10.0%) | 27 (90.0%) |
| Security & Protection | 0 (0.0%) | 6 (100.0%) |
| Firefighting & Prevention | 0 (0.0%) | 6 (100.0%) |
| Law Enforcement | 0 (0.0%) | 0 (0.0%) |
| Food Preparation & Serving | 36 (78.3%) | 10 (21.7%) |
| Cleaning & Maintenance | 25 (61.0%) | 16 (39.0%) |
| Personal Care & Service | 0 (0.0%) | 19 (100.0%) |
| Total (Category) | 64 (45.1%) | 78 (54.9%) |
| Total (Overall) | 537 (54.7%) | 445 (45.3%) |
Sales and Office Occupations
The most common Sales and Office occupations in North Newton are Office & Administration (76 | 7.7%), and Sales & Related (50 | 5.1%).
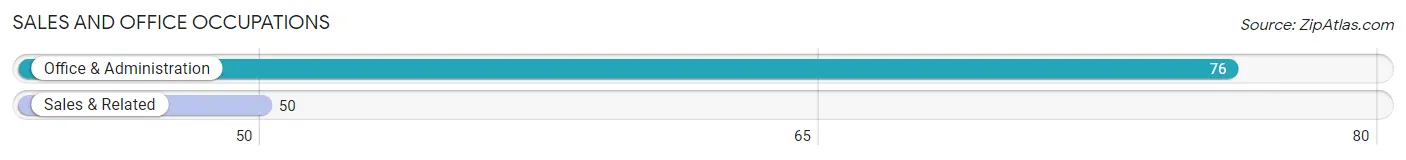
Sales and Office Occupations by Sex
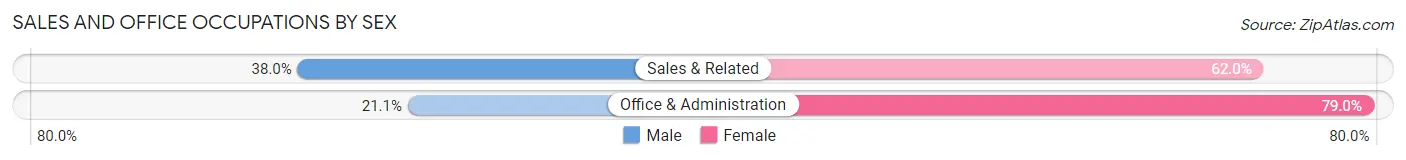
| Occupation | Male | Female |
| Sales & Related | 19 (38.0%) | 31 (62.0%) |
| Office & Administration | 16 (21.0%) | 60 (78.9%) |
| Total (Category) | 35 (27.8%) | 91 (72.2%) |
| Total (Overall) | 537 (54.7%) | 445 (45.3%) |
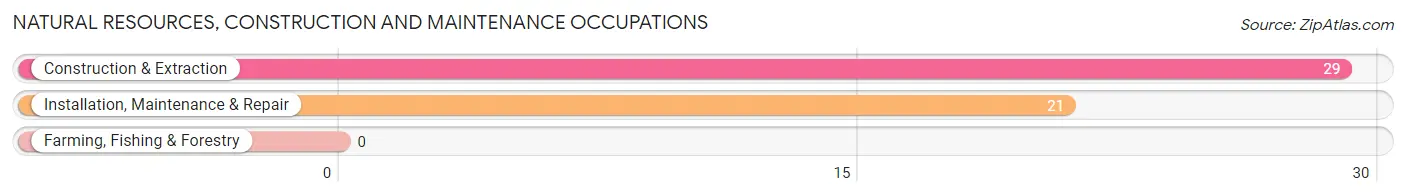
Natural Resources, Construction and Maintenance Occupations
The most common Natural Resources, Construction and Maintenance occupations in North Newton are Construction & Extraction (29 | 2.9%), and Installation, Maintenance & Repair (21 | 2.1%).
Natural Resources, Construction and Maintenance Occupations by Sex
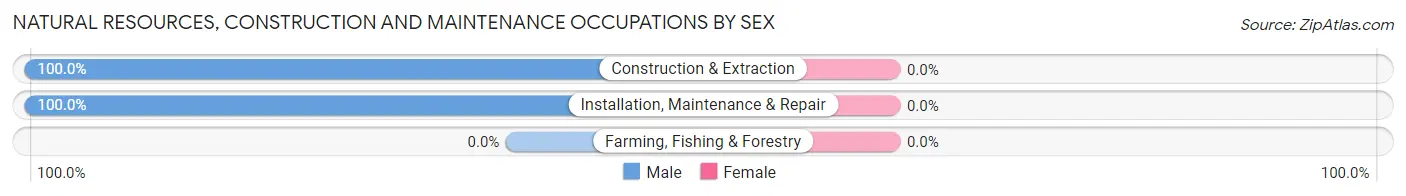
| Occupation | Male | Female |
| Farming, Fishing & Forestry | 0 (0.0%) | 0 (0.0%) |
| Construction & Extraction | 29 (100.0%) | 0 (0.0%) |
| Installation, Maintenance & Repair | 21 (100.0%) | 0 (0.0%) |
| Total (Category) | 50 (100.0%) | 0 (0.0%) |
| Total (Overall) | 537 (54.7%) | 445 (45.3%) |
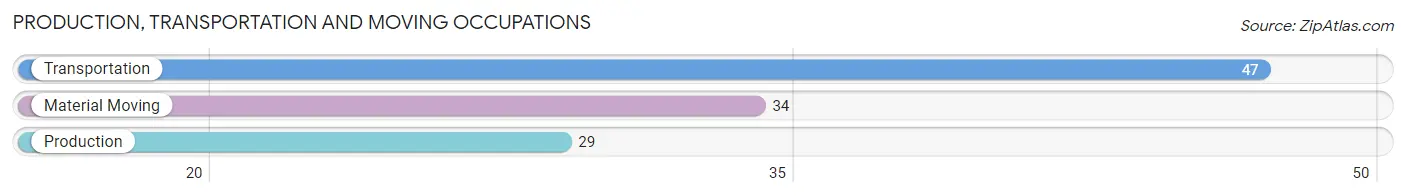
Production, Transportation and Moving Occupations
The most common Production, Transportation and Moving occupations in North Newton are Transportation (47 | 4.8%), Material Moving (34 | 3.5%), and Production (29 | 2.9%).
Production, Transportation and Moving Occupations by Sex
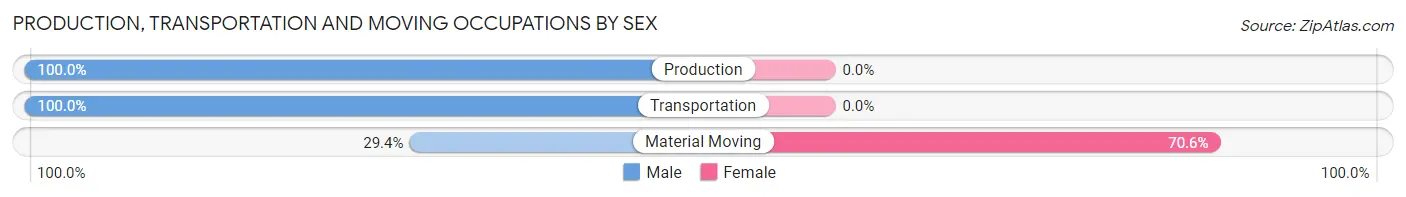
| Occupation | Male | Female |
| Production | 29 (100.0%) | 0 (0.0%) |
| Transportation | 47 (100.0%) | 0 (0.0%) |
| Material Moving | 10 (29.4%) | 24 (70.6%) |
| Total (Category) | 86 (78.2%) | 24 (21.8%) |
| Total (Overall) | 537 (54.7%) | 445 (45.3%) |
Employment Industries by Sex in North Newton
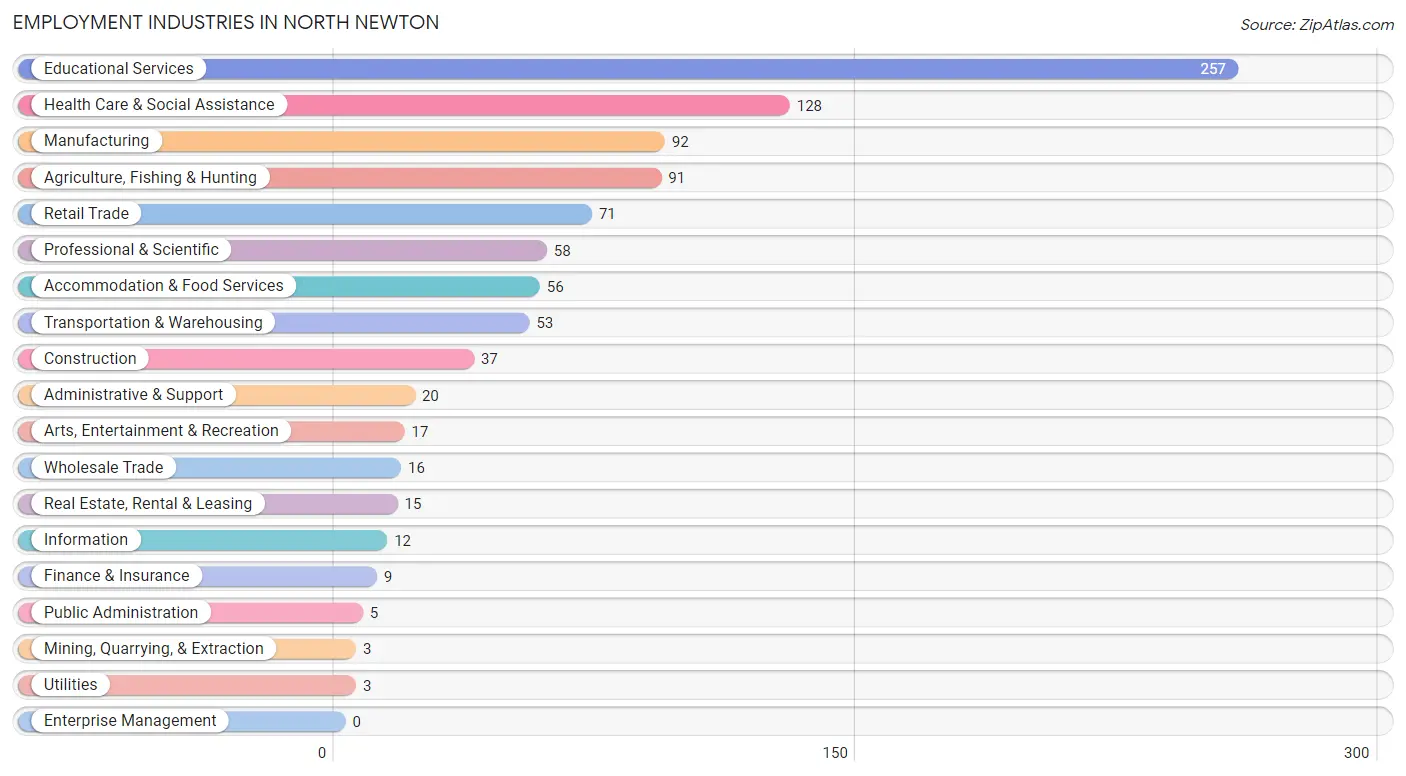
Employment Industries in North Newton
The major employment industries in North Newton include Educational Services (257 | 26.2%), Health Care & Social Assistance (128 | 13.0%), Manufacturing (92 | 9.4%), Agriculture, Fishing & Hunting (91 | 9.3%), and Retail Trade (71 | 7.2%).
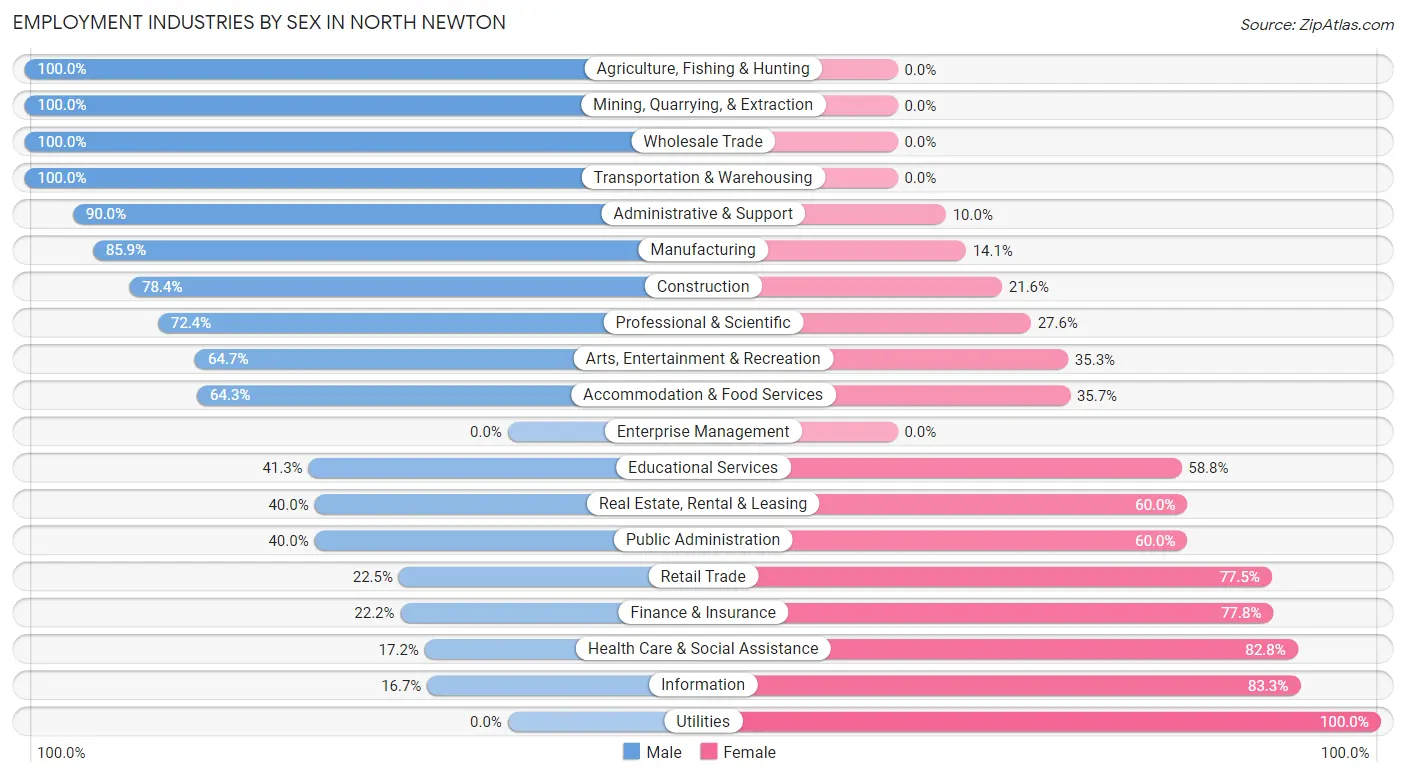
Employment Industries by Sex in North Newton
The North Newton industries that see more men than women are Agriculture, Fishing & Hunting (100.0%), Mining, Quarrying, & Extraction (100.0%), and Wholesale Trade (100.0%), whereas the industries that tend to have a higher number of women are Utilities (100.0%), Information (83.3%), and Health Care & Social Assistance (82.8%).
| Industry | Male | Female |
| Agriculture, Fishing & Hunting | 91 (100.0%) | 0 (0.0%) |
| Mining, Quarrying, & Extraction | 3 (100.0%) | 0 (0.0%) |
| Construction | 29 (78.4%) | 8 (21.6%) |
| Manufacturing | 79 (85.9%) | 13 (14.1%) |
| Wholesale Trade | 16 (100.0%) | 0 (0.0%) |
| Retail Trade | 16 (22.5%) | 55 (77.5%) |
| Transportation & Warehousing | 53 (100.0%) | 0 (0.0%) |
| Utilities | 0 (0.0%) | 3 (100.0%) |
| Information | 2 (16.7%) | 10 (83.3%) |
| Finance & Insurance | 2 (22.2%) | 7 (77.8%) |
| Real Estate, Rental & Leasing | 6 (40.0%) | 9 (60.0%) |
| Professional & Scientific | 42 (72.4%) | 16 (27.6%) |
| Enterprise Management | 0 (0.0%) | 0 (0.0%) |
| Administrative & Support | 18 (90.0%) | 2 (10.0%) |
| Educational Services | 106 (41.2%) | 151 (58.8%) |
| Health Care & Social Assistance | 22 (17.2%) | 106 (82.8%) |
| Arts, Entertainment & Recreation | 11 (64.7%) | 6 (35.3%) |
| Accommodation & Food Services | 36 (64.3%) | 20 (35.7%) |
| Public Administration | 2 (40.0%) | 3 (60.0%) |
| Total | 537 (54.7%) | 445 (45.3%) |
Education in North Newton
School Enrollment in North Newton
The most common levels of schooling among the 608 students in North Newton are college / undergraduate (358 | 58.9%), high school (99 | 16.3%), and middle school (53 | 8.7%).
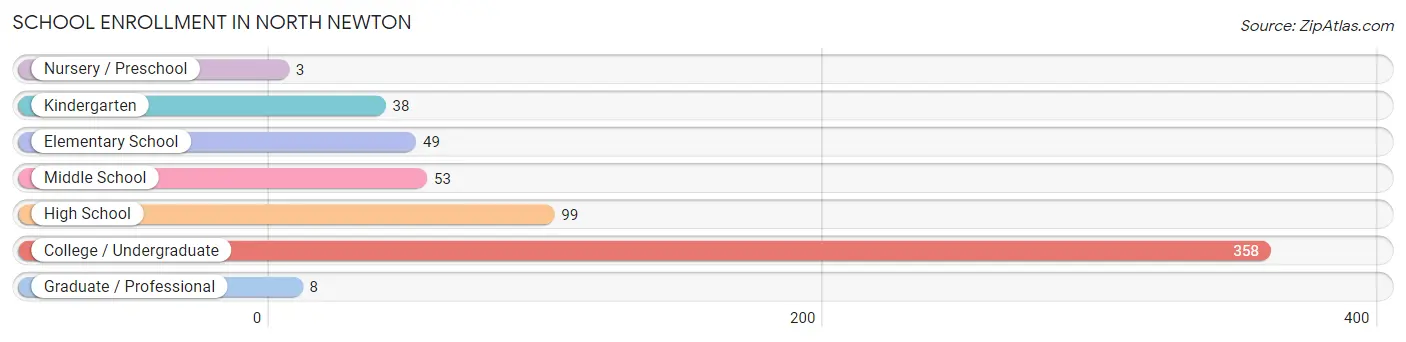
| School Level | # Students | % Students |
| Nursery / Preschool | 3 | 0.5% |
| Kindergarten | 38 | 6.2% |
| Elementary School | 49 | 8.1% |
| Middle School | 53 | 8.7% |
| High School | 99 | 16.3% |
| College / Undergraduate | 358 | 58.9% |
| Graduate / Professional | 8 | 1.3% |
| Total | 608 | 100.0% |
School Enrollment by Age by Funding Source in North Newton
Out of a total of 608 students who are enrolled in schools in North Newton, 377 (62.0%) attend a private institution, while the remaining 231 (38.0%) are enrolled in public schools. The age group of 3 to 4 year olds has the highest likelihood of being enrolled in private schools, with 3 (100.0% in the age bracket) enrolled. Conversely, the age group of 35 years and over has the lowest likelihood of being enrolled in a private school, with 8 (100.0% in the age bracket) attending a public institution.
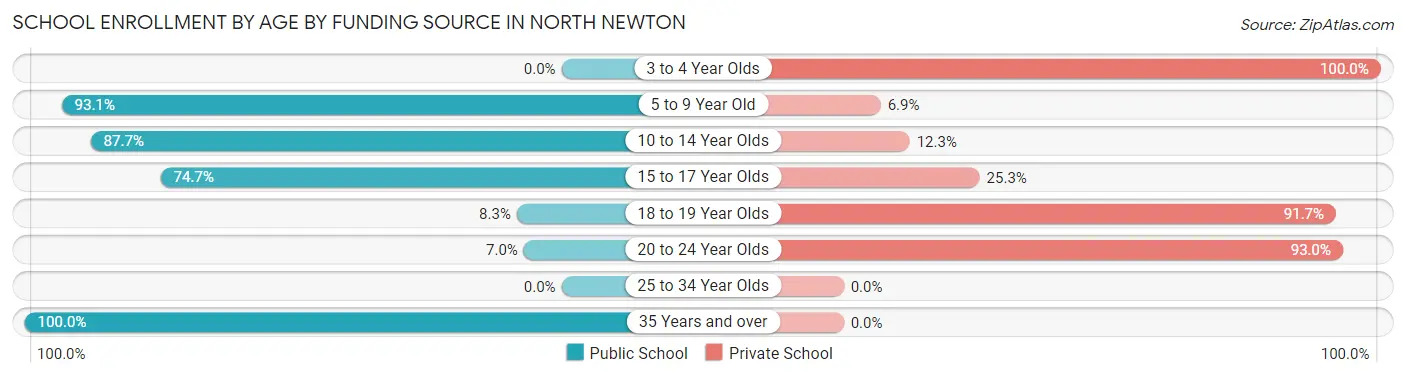
| Age Bracket | Public School | Private School |
| 3 to 4 Year Olds | 0 (0.0%) | 3 (100.0%) |
| 5 to 9 Year Old | 81 (93.1%) | 6 (6.9%) |
| 10 to 14 Year Olds | 57 (87.7%) | 8 (12.3%) |
| 15 to 17 Year Olds | 56 (74.7%) | 19 (25.3%) |
| 18 to 19 Year Olds | 19 (8.3%) | 209 (91.7%) |
| 20 to 24 Year Olds | 10 (7.0%) | 132 (93.0%) |
| 25 to 34 Year Olds | 0 (0.0%) | 0 (0.0%) |
| 35 Years and over | 8 (100.0%) | 0 (0.0%) |
| Total | 231 (38.0%) | 377 (62.0%) |
Educational Attainment by Field of Study in North Newton
Science & technology (130 | 17.5%), education (122 | 16.4%), bio, nature & agricultural (111 | 14.9%), business (79 | 10.6%), and physical & health sciences (50 | 6.7%) are the most common fields of study among 743 individuals in North Newton who have obtained a bachelor's degree or higher.
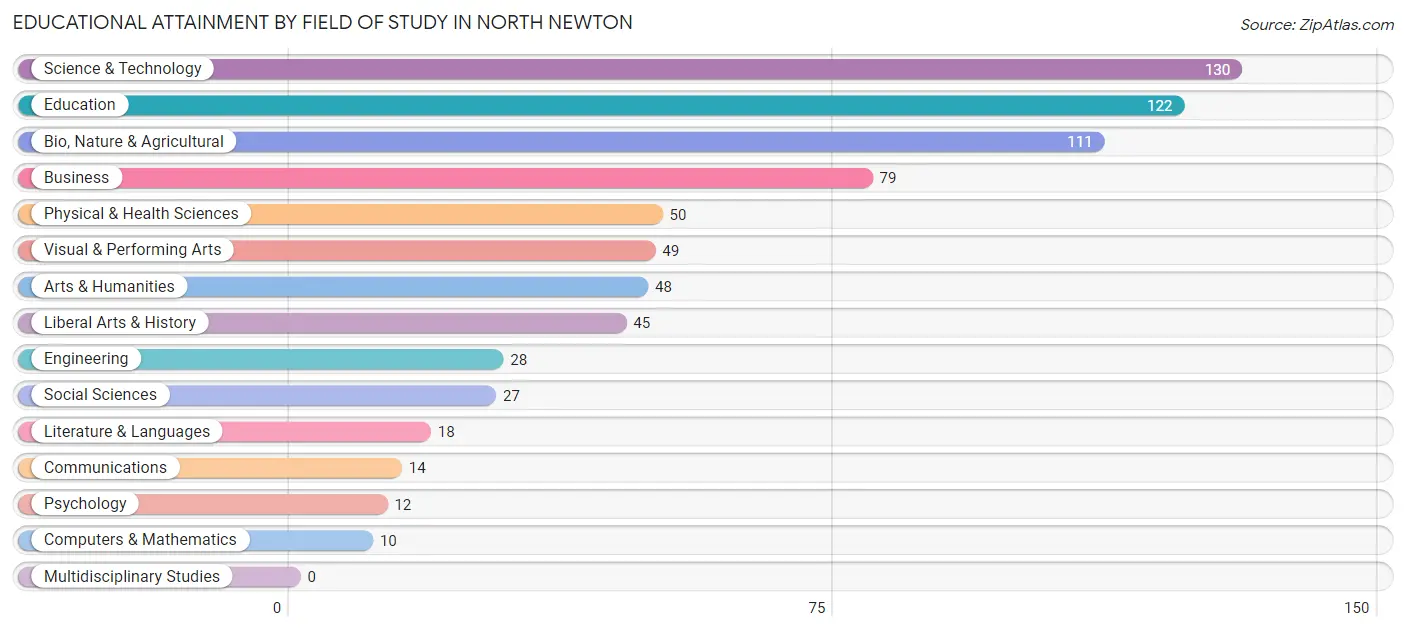
| Field of Study | # Graduates | % Graduates |
| Computers & Mathematics | 10 | 1.3% |
| Bio, Nature & Agricultural | 111 | 14.9% |
| Physical & Health Sciences | 50 | 6.7% |
| Psychology | 12 | 1.6% |
| Social Sciences | 27 | 3.6% |
| Engineering | 28 | 3.8% |
| Multidisciplinary Studies | 0 | 0.0% |
| Science & Technology | 130 | 17.5% |
| Business | 79 | 10.6% |
| Education | 122 | 16.4% |
| Literature & Languages | 18 | 2.4% |
| Liberal Arts & History | 45 | 6.1% |
| Visual & Performing Arts | 49 | 6.6% |
| Communications | 14 | 1.9% |
| Arts & Humanities | 48 | 6.5% |
| Total | 743 | 100.0% |
Transportation & Commute in North Newton
Vehicle Availability by Sex in North Newton
The most prevalent vehicle ownership categories in North Newton are males with 2 vehicles (223, accounting for 53.3%) and females with 2 vehicles (179, making up 65.0%).
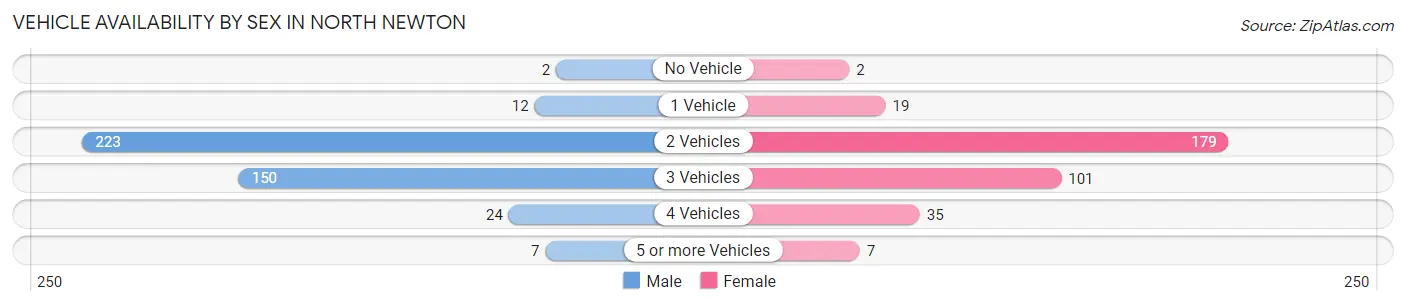
| Vehicles Available | Male | Female |
| No Vehicle | 2 (0.5%) | 2 (0.6%) |
| 1 Vehicle | 12 (2.9%) | 19 (5.5%) |
| 2 Vehicles | 223 (53.3%) | 179 (52.2%) |
| 3 Vehicles | 150 (35.9%) | 101 (29.4%) |
| 4 Vehicles | 24 (5.7%) | 35 (10.2%) |
| 5 or more Vehicles | 7 (1.7%) | 7 (2.0%) |
| Total | 418 (100.0%) | 343 (100.0%) |
Commute Time in North Newton
The most frequently occuring commute durations in North Newton are 5 to 9 minutes (212 commuters, 25.4%), less than 5 minutes (183 commuters, 21.9%), and 10 to 14 minutes (148 commuters, 17.7%).
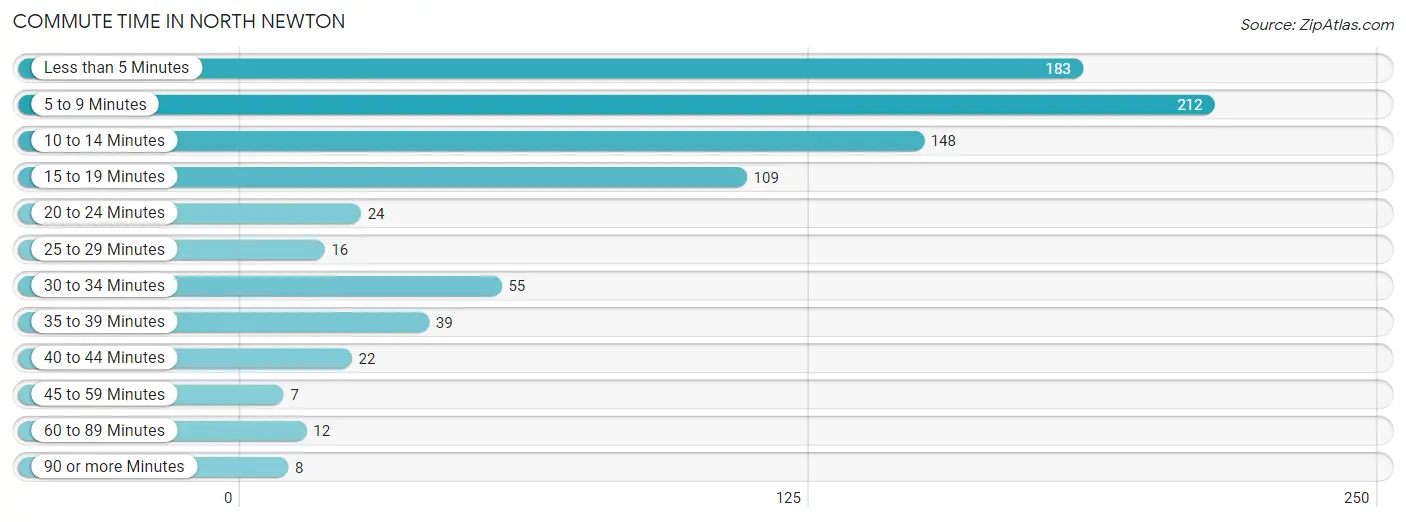
| Commute Time | # Commuters | % Commuters |
| Less than 5 Minutes | 183 | 21.9% |
| 5 to 9 Minutes | 212 | 25.4% |
| 10 to 14 Minutes | 148 | 17.7% |
| 15 to 19 Minutes | 109 | 13.1% |
| 20 to 24 Minutes | 24 | 2.9% |
| 25 to 29 Minutes | 16 | 1.9% |
| 30 to 34 Minutes | 55 | 6.6% |
| 35 to 39 Minutes | 39 | 4.7% |
| 40 to 44 Minutes | 22 | 2.6% |
| 45 to 59 Minutes | 7 | 0.8% |
| 60 to 89 Minutes | 12 | 1.4% |
| 90 or more Minutes | 8 | 1.0% |
Commute Time by Sex in North Newton
The most common commute times in North Newton are 10 to 14 minutes (108 commuters, 25.8%) for males and less than 5 minutes (136 commuters, 32.7%) for females.
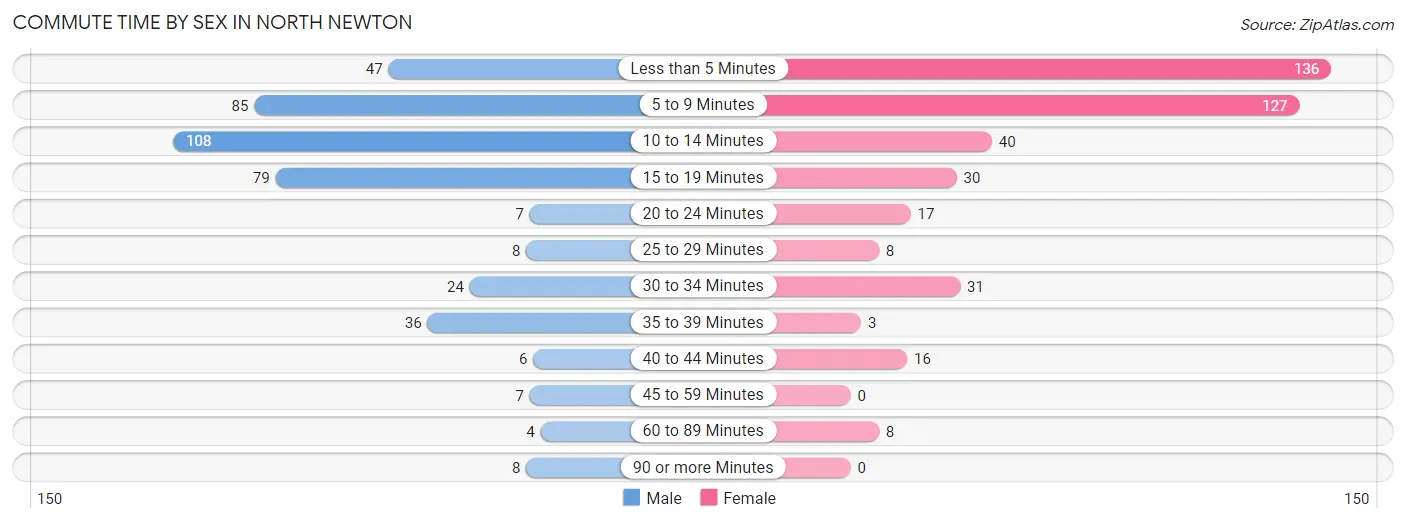
| Commute Time | Male | Female |
| Less than 5 Minutes | 47 (11.2%) | 136 (32.7%) |
| 5 to 9 Minutes | 85 (20.3%) | 127 (30.5%) |
| 10 to 14 Minutes | 108 (25.8%) | 40 (9.6%) |
| 15 to 19 Minutes | 79 (18.9%) | 30 (7.2%) |
| 20 to 24 Minutes | 7 (1.7%) | 17 (4.1%) |
| 25 to 29 Minutes | 8 (1.9%) | 8 (1.9%) |
| 30 to 34 Minutes | 24 (5.7%) | 31 (7.4%) |
| 35 to 39 Minutes | 36 (8.6%) | 3 (0.7%) |
| 40 to 44 Minutes | 6 (1.4%) | 16 (3.8%) |
| 45 to 59 Minutes | 7 (1.7%) | 0 (0.0%) |
| 60 to 89 Minutes | 4 (0.9%) | 8 (1.9%) |
| 90 or more Minutes | 8 (1.9%) | 0 (0.0%) |
Time of Departure to Work by Sex in North Newton
The most frequent times of departure to work in North Newton are 6:30 AM to 6:59 AM (69, 16.5%) for males and 10:00 AM to 10:59 AM (76, 18.3%) for females.
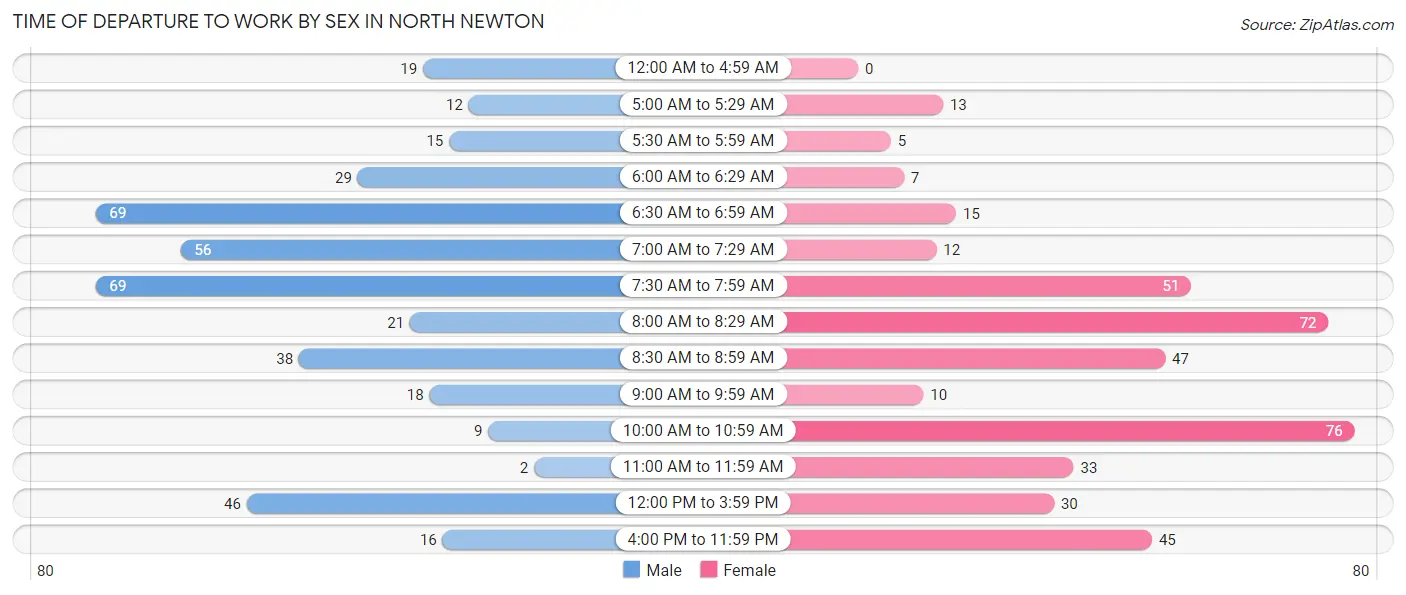
| Time of Departure | Male | Female |
| 12:00 AM to 4:59 AM | 19 (4.5%) | 0 (0.0%) |
| 5:00 AM to 5:29 AM | 12 (2.9%) | 13 (3.1%) |
| 5:30 AM to 5:59 AM | 15 (3.6%) | 5 (1.2%) |
| 6:00 AM to 6:29 AM | 29 (6.9%) | 7 (1.7%) |
| 6:30 AM to 6:59 AM | 69 (16.5%) | 15 (3.6%) |
| 7:00 AM to 7:29 AM | 56 (13.4%) | 12 (2.9%) |
| 7:30 AM to 7:59 AM | 69 (16.5%) | 51 (12.3%) |
| 8:00 AM to 8:29 AM | 21 (5.0%) | 72 (17.3%) |
| 8:30 AM to 8:59 AM | 38 (9.1%) | 47 (11.3%) |
| 9:00 AM to 9:59 AM | 18 (4.3%) | 10 (2.4%) |
| 10:00 AM to 10:59 AM | 9 (2.1%) | 76 (18.3%) |
| 11:00 AM to 11:59 AM | 2 (0.5%) | 33 (7.9%) |
| 12:00 PM to 3:59 PM | 46 (11.0%) | 30 (7.2%) |
| 4:00 PM to 11:59 PM | 16 (3.8%) | 45 (10.8%) |
| Total | 419 (100.0%) | 416 (100.0%) |
Housing Occupancy in North Newton
Occupancy by Ownership in North Newton
Of the total 805 dwellings in North Newton, owner-occupied units account for 535 (66.5%), while renter-occupied units make up 270 (33.5%).
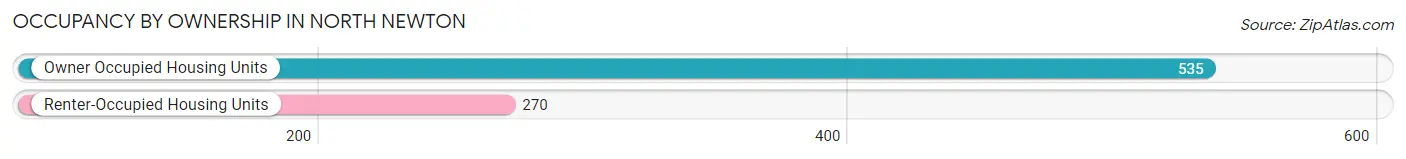
| Occupancy | # Housing Units | % Housing Units |
| Owner Occupied Housing Units | 535 | 66.5% |
| Renter-Occupied Housing Units | 270 | 33.5% |
| Total Occupied Housing Units | 805 | 100.0% |
Occupancy by Household Size in North Newton
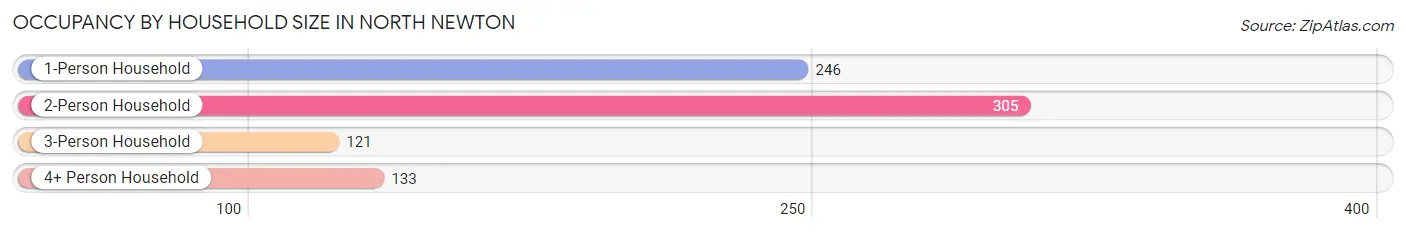
| Household Size | # Housing Units | % Housing Units |
| 1-Person Household | 246 | 30.6% |
| 2-Person Household | 305 | 37.9% |
| 3-Person Household | 121 | 15.0% |
| 4+ Person Household | 133 | 16.5% |
| Total Housing Units | 805 | 100.0% |
Occupancy by Ownership by Household Size in North Newton
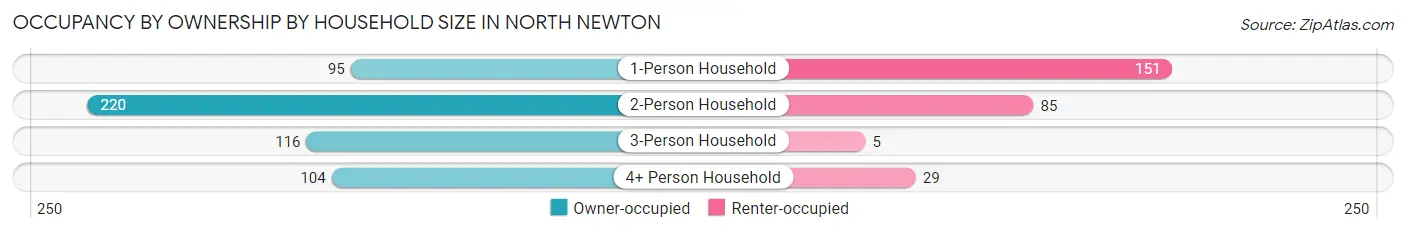
| Household Size | Owner-occupied | Renter-occupied |
| 1-Person Household | 95 (38.6%) | 151 (61.4%) |
| 2-Person Household | 220 (72.1%) | 85 (27.9%) |
| 3-Person Household | 116 (95.9%) | 5 (4.1%) |
| 4+ Person Household | 104 (78.2%) | 29 (21.8%) |
| Total Housing Units | 535 (66.5%) | 270 (33.5%) |
Occupancy by Educational Attainment in North Newton
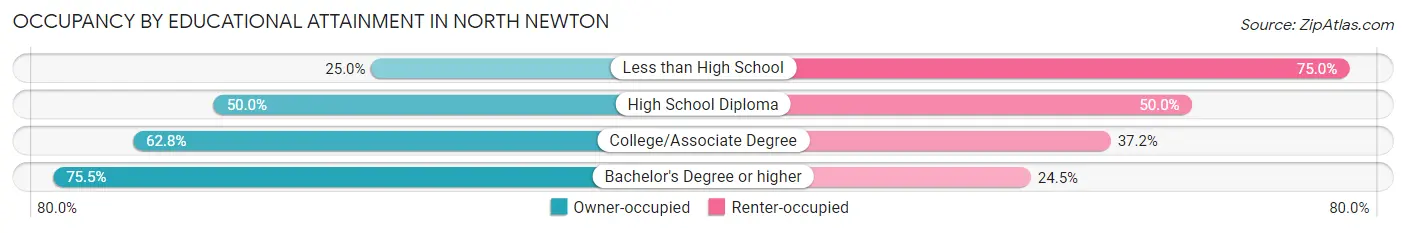
| Household Size | Owner-occupied | Renter-occupied |
| Less than High School | 5 (25.0%) | 15 (75.0%) |
| High School Diploma | 71 (50.0%) | 71 (50.0%) |
| College/Associate Degree | 130 (62.8%) | 77 (37.2%) |
| Bachelor's Degree or higher | 329 (75.5%) | 107 (24.5%) |
Occupancy by Age of Householder in North Newton
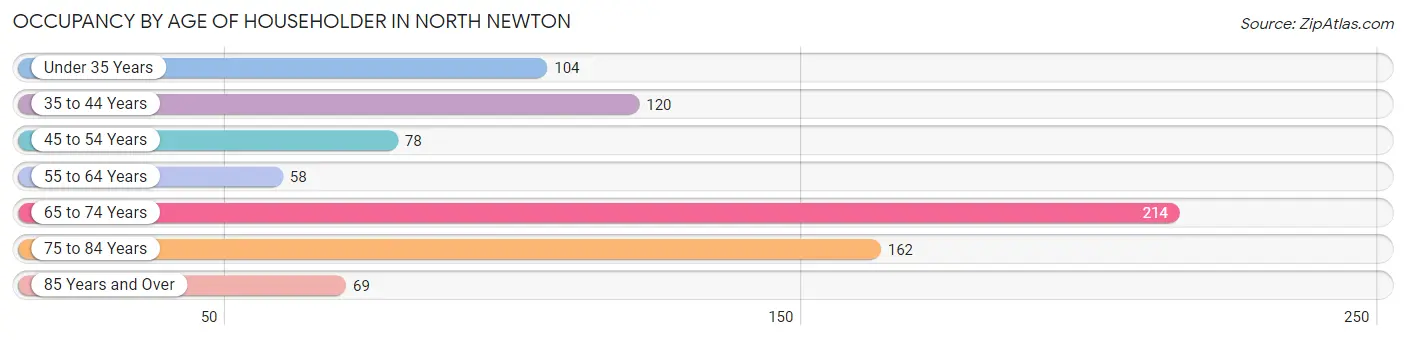
| Age Bracket | # Households | % Households |
| Under 35 Years | 104 | 12.9% |
| 35 to 44 Years | 120 | 14.9% |
| 45 to 54 Years | 78 | 9.7% |
| 55 to 64 Years | 58 | 7.2% |
| 65 to 74 Years | 214 | 26.6% |
| 75 to 84 Years | 162 | 20.1% |
| 85 Years and Over | 69 | 8.6% |
| Total | 805 | 100.0% |
Housing Finances in North Newton
Median Income by Occupancy in North Newton
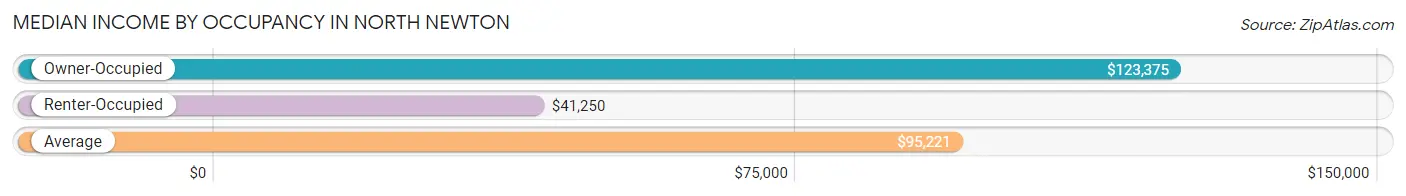
| Occupancy Type | # Households | Median Income |
| Owner-Occupied | 535 (66.5%) | $123,375 |
| Renter-Occupied | 270 (33.5%) | $41,250 |
| Average | 805 (100.0%) | $95,221 |
Occupancy by Householder Income Bracket in North Newton
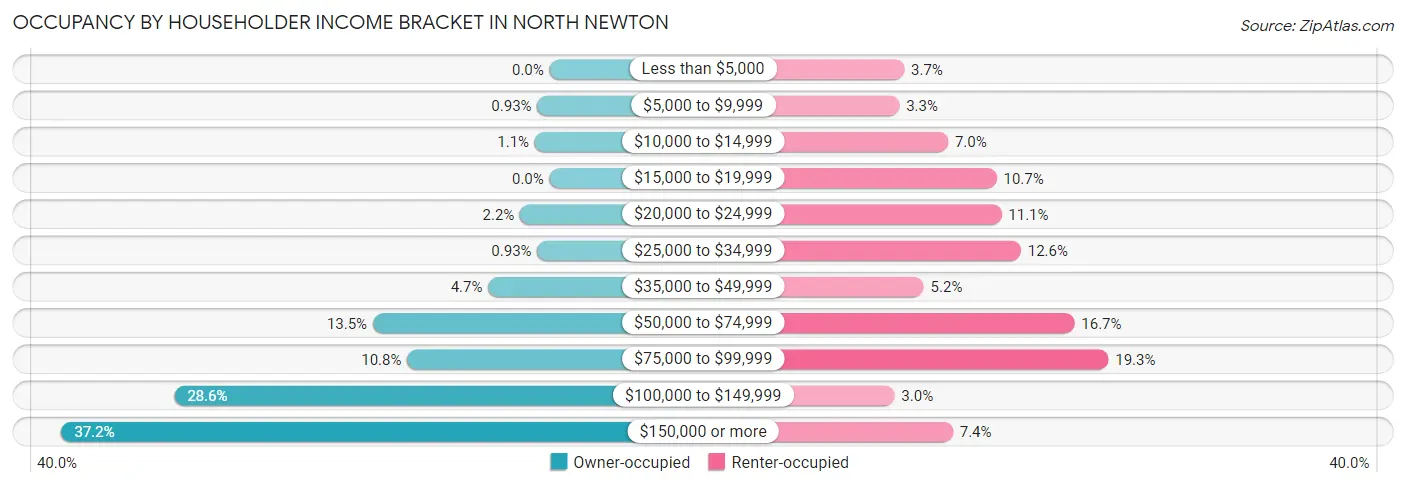
| Income Bracket | Owner-occupied | Renter-occupied |
| Less than $5,000 | 0 (0.0%) | 10 (3.7%) |
| $5,000 to $9,999 | 5 (0.9%) | 9 (3.3%) |
| $10,000 to $14,999 | 6 (1.1%) | 19 (7.0%) |
| $15,000 to $19,999 | 0 (0.0%) | 29 (10.7%) |
| $20,000 to $24,999 | 12 (2.2%) | 30 (11.1%) |
| $25,000 to $34,999 | 5 (0.9%) | 34 (12.6%) |
| $35,000 to $49,999 | 25 (4.7%) | 14 (5.2%) |
| $50,000 to $74,999 | 72 (13.5%) | 45 (16.7%) |
| $75,000 to $99,999 | 58 (10.8%) | 52 (19.3%) |
| $100,000 to $149,999 | 153 (28.6%) | 8 (3.0%) |
| $150,000 or more | 199 (37.2%) | 20 (7.4%) |
| Total | 535 (100.0%) | 270 (100.0%) |
Monthly Housing Cost Tiers in North Newton
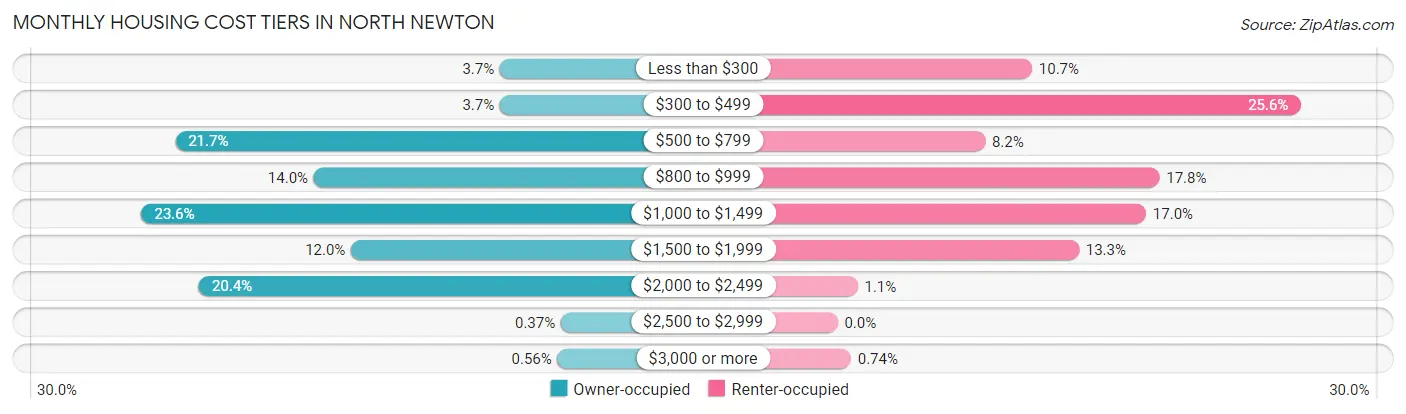
| Monthly Cost | Owner-occupied | Renter-occupied |
| Less than $300 | 20 (3.7%) | 29 (10.7%) |
| $300 to $499 | 20 (3.7%) | 69 (25.6%) |
| $500 to $799 | 116 (21.7%) | 22 (8.2%) |
| $800 to $999 | 75 (14.0%) | 48 (17.8%) |
| $1,000 to $1,499 | 126 (23.5%) | 46 (17.0%) |
| $1,500 to $1,999 | 64 (12.0%) | 36 (13.3%) |
| $2,000 to $2,499 | 109 (20.4%) | 3 (1.1%) |
| $2,500 to $2,999 | 2 (0.4%) | 0 (0.0%) |
| $3,000 or more | 3 (0.6%) | 2 (0.7%) |
| Total | 535 (100.0%) | 270 (100.0%) |
Physical Housing Characteristics in North Newton
Housing Structures in North Newton
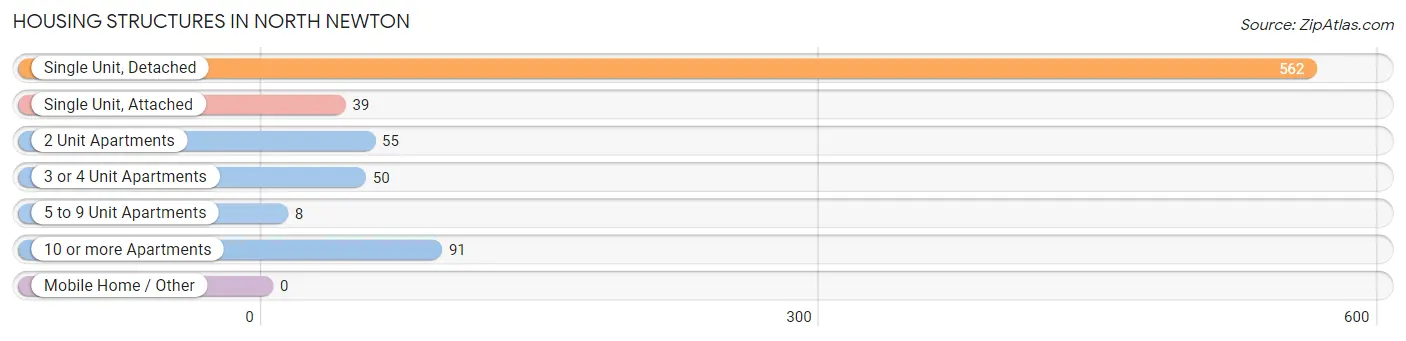
| Structure Type | # Housing Units | % Housing Units |
| Single Unit, Detached | 562 | 69.8% |
| Single Unit, Attached | 39 | 4.8% |
| 2 Unit Apartments | 55 | 6.8% |
| 3 or 4 Unit Apartments | 50 | 6.2% |
| 5 to 9 Unit Apartments | 8 | 1.0% |
| 10 or more Apartments | 91 | 11.3% |
| Mobile Home / Other | 0 | 0.0% |
| Total | 805 | 100.0% |
Housing Structures by Occupancy in North Newton
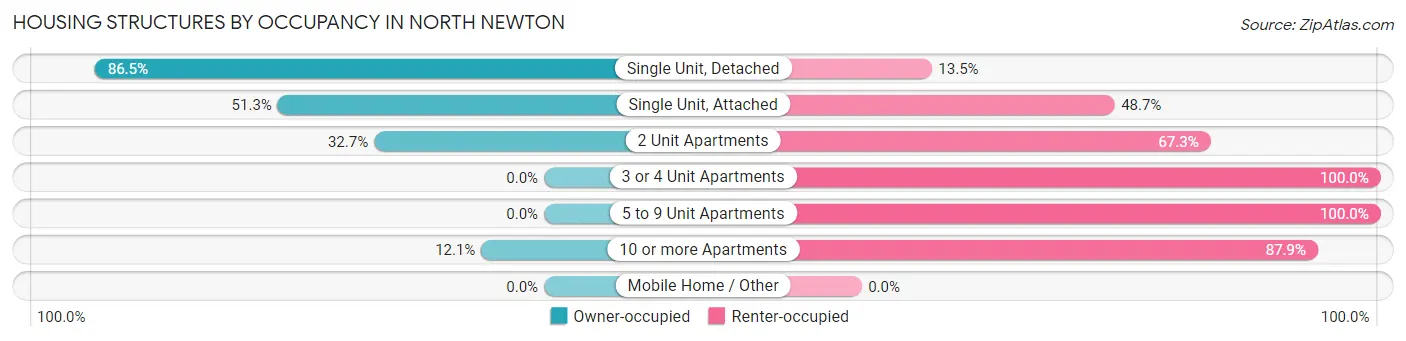
| Structure Type | Owner-occupied | Renter-occupied |
| Single Unit, Detached | 486 (86.5%) | 76 (13.5%) |
| Single Unit, Attached | 20 (51.3%) | 19 (48.7%) |
| 2 Unit Apartments | 18 (32.7%) | 37 (67.3%) |
| 3 or 4 Unit Apartments | 0 (0.0%) | 50 (100.0%) |
| 5 to 9 Unit Apartments | 0 (0.0%) | 8 (100.0%) |
| 10 or more Apartments | 11 (12.1%) | 80 (87.9%) |
| Mobile Home / Other | 0 (0.0%) | 0 (0.0%) |
| Total | 535 (66.5%) | 270 (33.5%) |
Housing Structures by Number of Rooms in North Newton
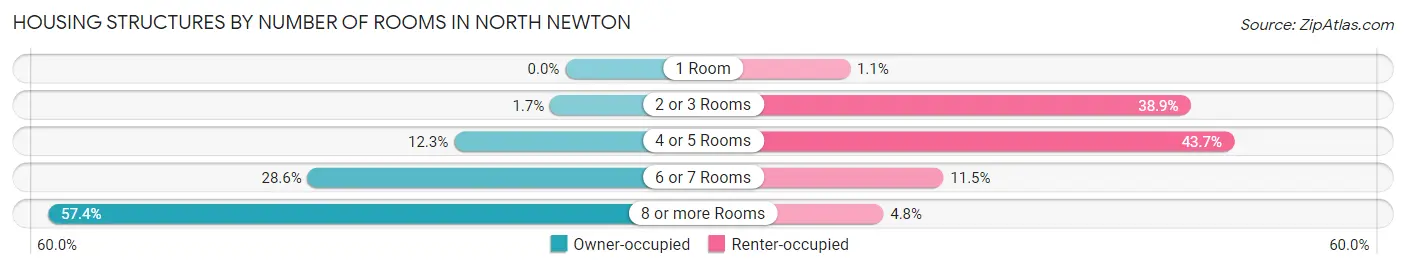
| Number of Rooms | Owner-occupied | Renter-occupied |
| 1 Room | 0 (0.0%) | 3 (1.1%) |
| 2 or 3 Rooms | 9 (1.7%) | 105 (38.9%) |
| 4 or 5 Rooms | 66 (12.3%) | 118 (43.7%) |
| 6 or 7 Rooms | 153 (28.6%) | 31 (11.5%) |
| 8 or more Rooms | 307 (57.4%) | 13 (4.8%) |
| Total | 535 (100.0%) | 270 (100.0%) |
Housing Structure by Heating Type in North Newton
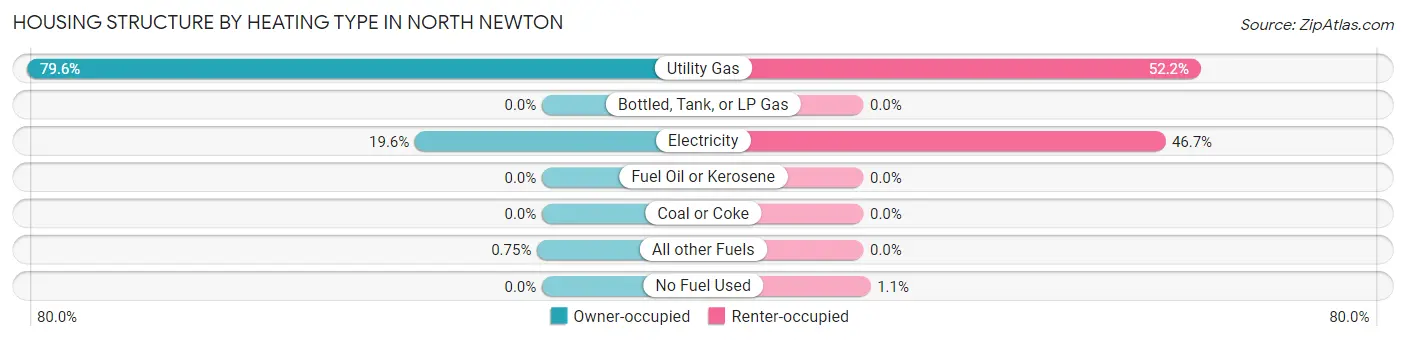
| Heating Type | Owner-occupied | Renter-occupied |
| Utility Gas | 426 (79.6%) | 141 (52.2%) |
| Bottled, Tank, or LP Gas | 0 (0.0%) | 0 (0.0%) |
| Electricity | 105 (19.6%) | 126 (46.7%) |
| Fuel Oil or Kerosene | 0 (0.0%) | 0 (0.0%) |
| Coal or Coke | 0 (0.0%) | 0 (0.0%) |
| All other Fuels | 4 (0.7%) | 0 (0.0%) |
| No Fuel Used | 0 (0.0%) | 3 (1.1%) |
| Total | 535 (100.0%) | 270 (100.0%) |
Household Vehicle Usage in North Newton
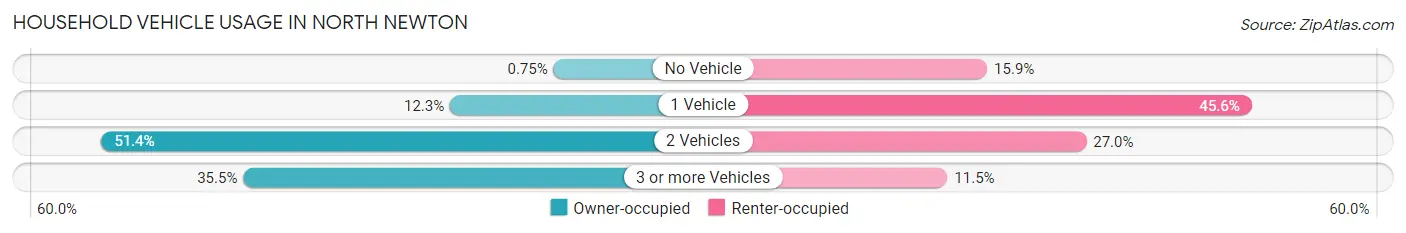
| Vehicles per Household | Owner-occupied | Renter-occupied |
| No Vehicle | 4 (0.7%) | 43 (15.9%) |
| 1 Vehicle | 66 (12.3%) | 123 (45.6%) |
| 2 Vehicles | 275 (51.4%) | 73 (27.0%) |
| 3 or more Vehicles | 190 (35.5%) | 31 (11.5%) |
| Total | 535 (100.0%) | 270 (100.0%) |
Real Estate & Mortgages in North Newton
Real Estate and Mortgage Overview in North Newton
| Characteristic | Without Mortgage | With Mortgage |
| Housing Units | 233 | 302 |
| Median Property Value | $191,700 | $214,500 |
| Median Household Income | $118,125 | $107 |
| Monthly Housing Costs | $797 | $3 |
| Real Estate Taxes | $2,854 | $3 |
Property Value by Mortgage Status in North Newton
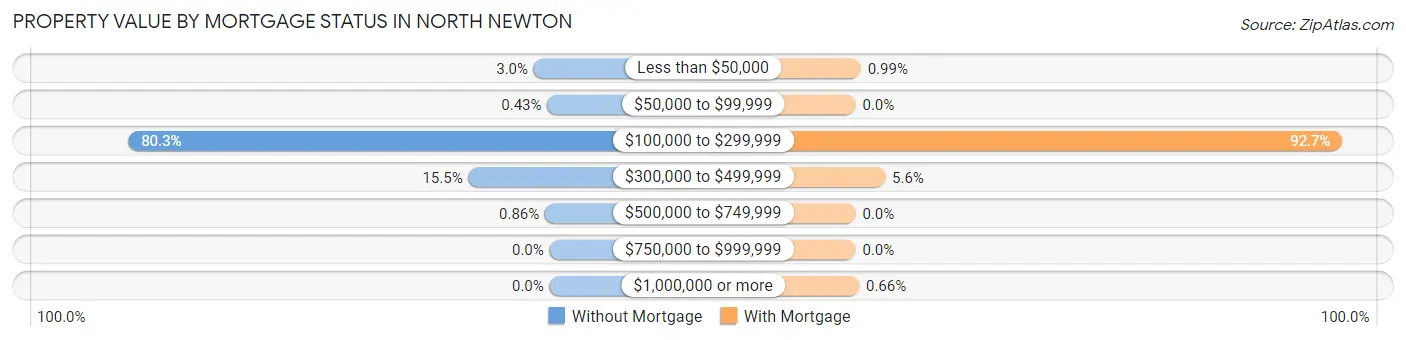
| Property Value | Without Mortgage | With Mortgage |
| Less than $50,000 | 7 (3.0%) | 3 (1.0%) |
| $50,000 to $99,999 | 1 (0.4%) | 0 (0.0%) |
| $100,000 to $299,999 | 187 (80.3%) | 280 (92.7%) |
| $300,000 to $499,999 | 36 (15.4%) | 17 (5.6%) |
| $500,000 to $749,999 | 2 (0.9%) | 0 (0.0%) |
| $750,000 to $999,999 | 0 (0.0%) | 0 (0.0%) |
| $1,000,000 or more | 0 (0.0%) | 2 (0.7%) |
| Total | 233 (100.0%) | 302 (100.0%) |
Household Income by Mortgage Status in North Newton
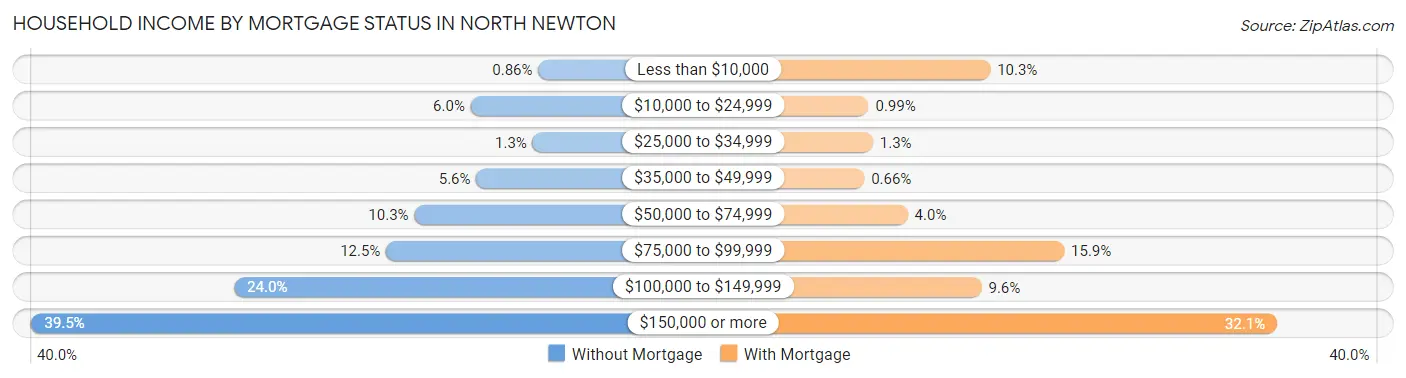
| Household Income | Without Mortgage | With Mortgage |
| Less than $10,000 | 2 (0.9%) | 31 (10.3%) |
| $10,000 to $24,999 | 14 (6.0%) | 3 (1.0%) |
| $25,000 to $34,999 | 3 (1.3%) | 4 (1.3%) |
| $35,000 to $49,999 | 13 (5.6%) | 2 (0.7%) |
| $50,000 to $74,999 | 24 (10.3%) | 12 (4.0%) |
| $75,000 to $99,999 | 29 (12.4%) | 48 (15.9%) |
| $100,000 to $149,999 | 56 (24.0%) | 29 (9.6%) |
| $150,000 or more | 92 (39.5%) | 97 (32.1%) |
| Total | 233 (100.0%) | 302 (100.0%) |
Property Value to Household Income Ratio in North Newton
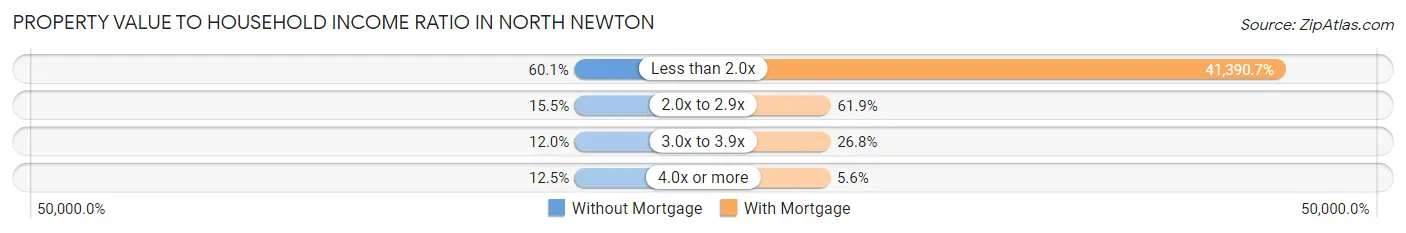
| Value-to-Income Ratio | Without Mortgage | With Mortgage |
| Less than 2.0x | 140 (60.1%) | 125,000 (41,390.7%) |
| 2.0x to 2.9x | 36 (15.4%) | 187 (61.9%) |
| 3.0x to 3.9x | 28 (12.0%) | 81 (26.8%) |
| 4.0x or more | 29 (12.4%) | 17 (5.6%) |
| Total | 233 (100.0%) | 302 (100.0%) |
Real Estate Taxes by Mortgage Status in North Newton
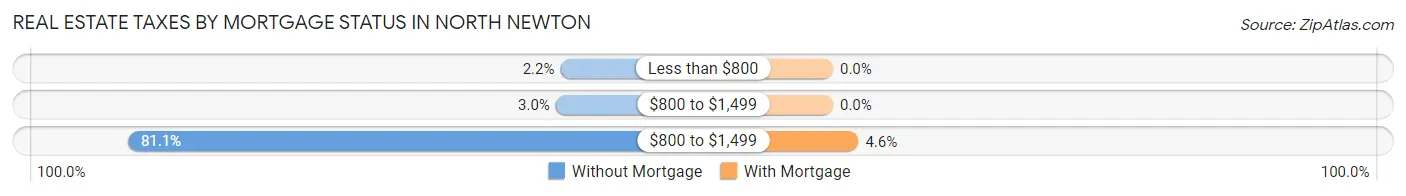
| Property Taxes | Without Mortgage | With Mortgage |
| Less than $800 | 5 (2.1%) | 0 (0.0%) |
| $800 to $1,499 | 7 (3.0%) | 0 (0.0%) |
| $800 to $1,499 | 189 (81.1%) | 14 (4.6%) |
| Total | 233 (100.0%) | 302 (100.0%) |
Health & Disability in North Newton
Health Insurance Coverage by Age in North Newton
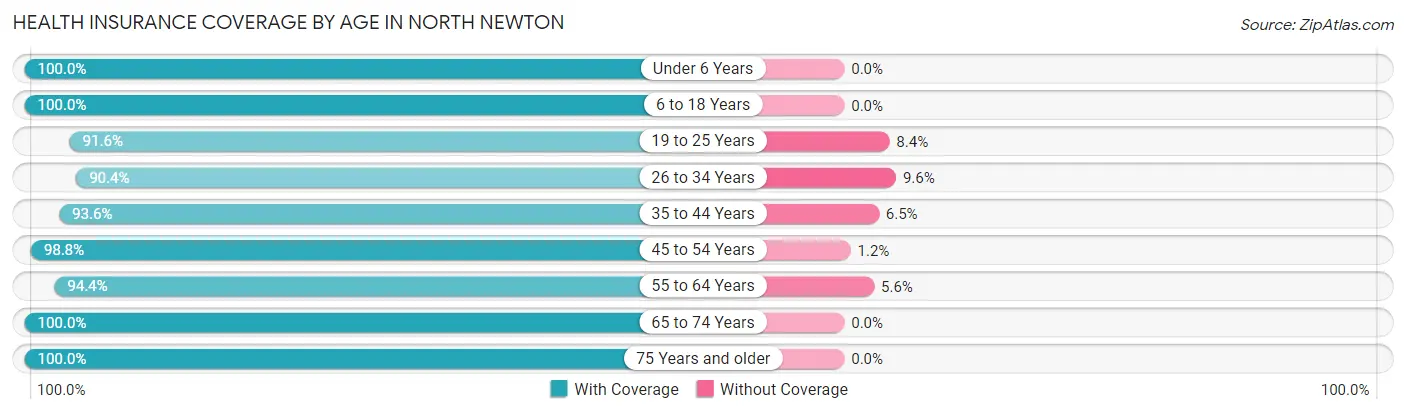
| Age Bracket | With Coverage | Without Coverage |
| Under 6 Years | 128 (100.0%) | 0 (0.0%) |
| 6 to 18 Years | 309 (100.0%) | 0 (0.0%) |
| 19 to 25 Years | 316 (91.6%) | 29 (8.4%) |
| 26 to 34 Years | 169 (90.4%) | 18 (9.6%) |
| 35 to 44 Years | 145 (93.5%) | 10 (6.5%) |
| 45 to 54 Years | 169 (98.8%) | 2 (1.2%) |
| 55 to 64 Years | 102 (94.4%) | 6 (5.6%) |
| 65 to 74 Years | 273 (100.0%) | 0 (0.0%) |
| 75 Years and older | 337 (100.0%) | 0 (0.0%) |
| Total | 1,948 (96.8%) | 65 (3.2%) |
Health Insurance Coverage by Citizenship Status in North Newton
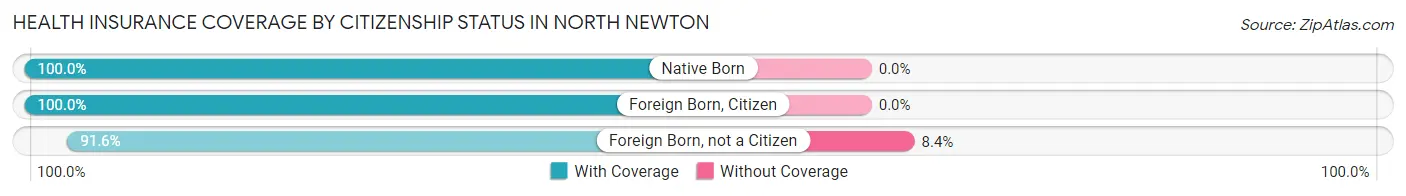
| Citizenship Status | With Coverage | Without Coverage |
| Native Born | 128 (100.0%) | 0 (0.0%) |
| Foreign Born, Citizen | 309 (100.0%) | 0 (0.0%) |
| Foreign Born, not a Citizen | 316 (91.6%) | 29 (8.4%) |
Health Insurance Coverage by Household Income in North Newton
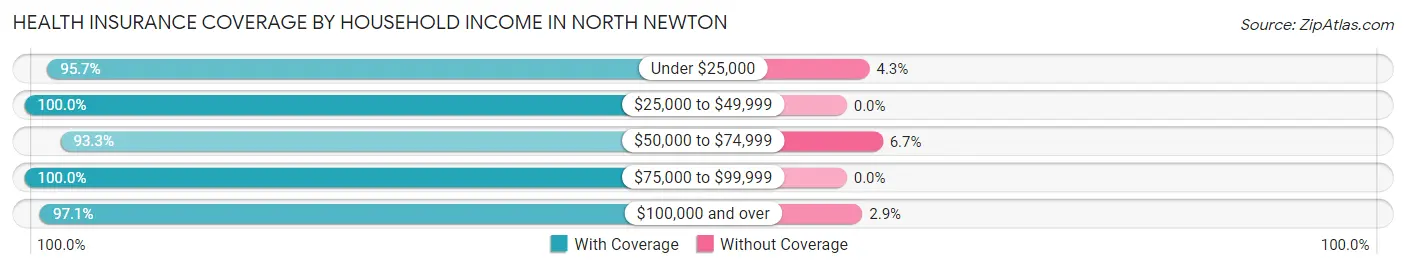
| Household Income | With Coverage | Without Coverage |
| Under $25,000 | 135 (95.7%) | 6 (4.3%) |
| $25,000 to $49,999 | 113 (100.0%) | 0 (0.0%) |
| $50,000 to $74,999 | 194 (93.3%) | 14 (6.7%) |
| $75,000 to $99,999 | 318 (100.0%) | 0 (0.0%) |
| $100,000 and over | 867 (97.1%) | 26 (2.9%) |
Public vs Private Health Insurance Coverage by Age in North Newton
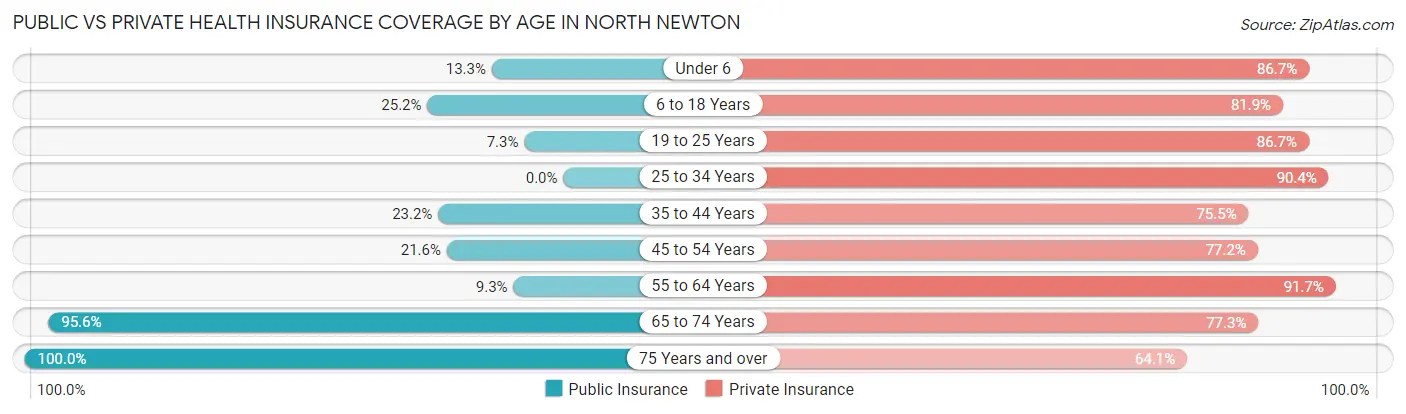
| Age Bracket | Public Insurance | Private Insurance |
| Under 6 | 17 (13.3%) | 111 (86.7%) |
| 6 to 18 Years | 78 (25.2%) | 253 (81.9%) |
| 19 to 25 Years | 25 (7.2%) | 299 (86.7%) |
| 25 to 34 Years | 0 (0.0%) | 169 (90.4%) |
| 35 to 44 Years | 36 (23.2%) | 117 (75.5%) |
| 45 to 54 Years | 37 (21.6%) | 132 (77.2%) |
| 55 to 64 Years | 10 (9.3%) | 99 (91.7%) |
| 65 to 74 Years | 261 (95.6%) | 211 (77.3%) |
| 75 Years and over | 337 (100.0%) | 216 (64.1%) |
| Total | 801 (39.8%) | 1,607 (79.8%) |
Disability Status by Sex by Age in North Newton
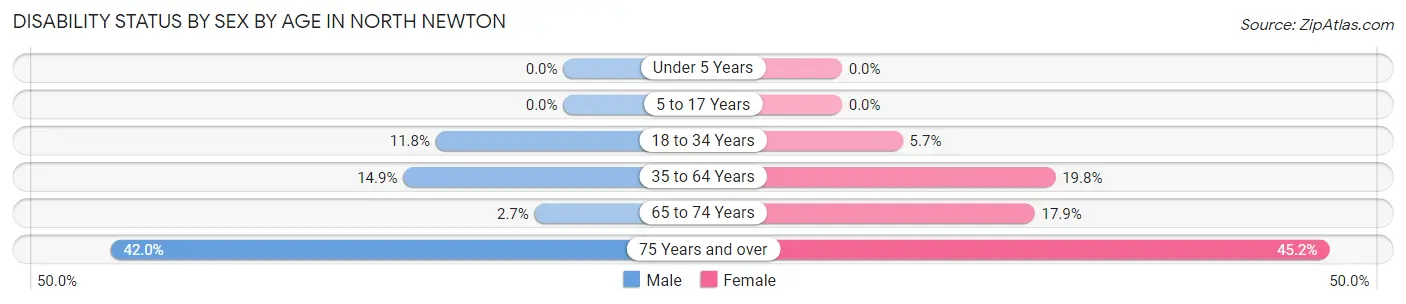
| Age Bracket | Male | Female |
| Under 5 Years | 0 (0.0%) | 0 (0.0%) |
| 5 to 17 Years | 0 (0.0%) | 0 (0.0%) |
| 18 to 34 Years | 38 (11.8%) | 17 (5.7%) |
| 35 to 64 Years | 33 (14.9%) | 42 (19.8%) |
| 65 to 74 Years | 4 (2.7%) | 22 (17.9%) |
| 75 Years and over | 58 (42.0%) | 90 (45.2%) |
Disability Class by Sex by Age in North Newton
Disability Class: Hearing Difficulty
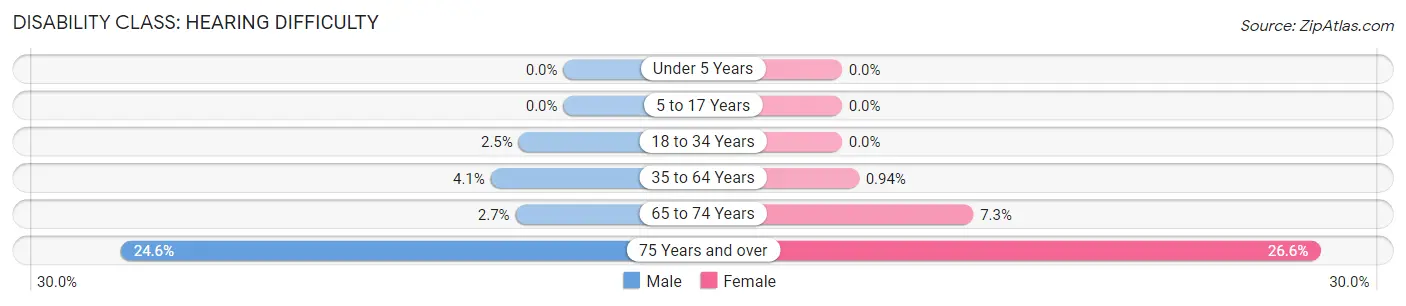
| Age Bracket | Male | Female |
| Under 5 Years | 0 (0.0%) | 0 (0.0%) |
| 5 to 17 Years | 0 (0.0%) | 0 (0.0%) |
| 18 to 34 Years | 8 (2.5%) | 0 (0.0%) |
| 35 to 64 Years | 9 (4.1%) | 2 (0.9%) |
| 65 to 74 Years | 4 (2.7%) | 9 (7.3%) |
| 75 Years and over | 34 (24.6%) | 53 (26.6%) |
Disability Class: Vision Difficulty
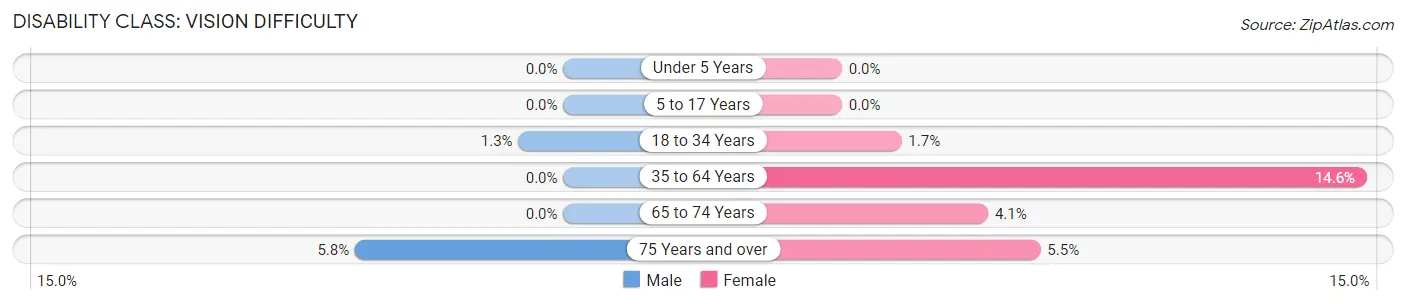
| Age Bracket | Male | Female |
| Under 5 Years | 0 (0.0%) | 0 (0.0%) |
| 5 to 17 Years | 0 (0.0%) | 0 (0.0%) |
| 18 to 34 Years | 4 (1.3%) | 5 (1.7%) |
| 35 to 64 Years | 0 (0.0%) | 31 (14.6%) |
| 65 to 74 Years | 0 (0.0%) | 5 (4.1%) |
| 75 Years and over | 8 (5.8%) | 11 (5.5%) |
Disability Class: Cognitive Difficulty
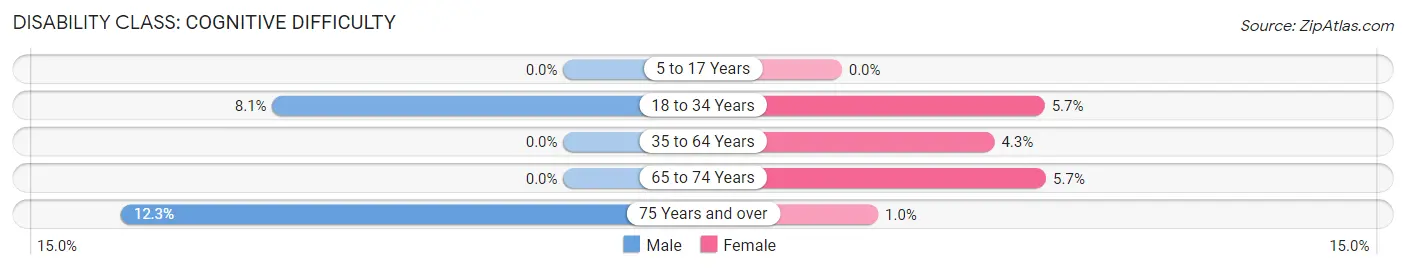
| Age Bracket | Male | Female |
| 5 to 17 Years | 0 (0.0%) | 0 (0.0%) |
| 18 to 34 Years | 26 (8.1%) | 17 (5.7%) |
| 35 to 64 Years | 0 (0.0%) | 9 (4.3%) |
| 65 to 74 Years | 0 (0.0%) | 7 (5.7%) |
| 75 Years and over | 17 (12.3%) | 2 (1.0%) |
Disability Class: Ambulatory Difficulty
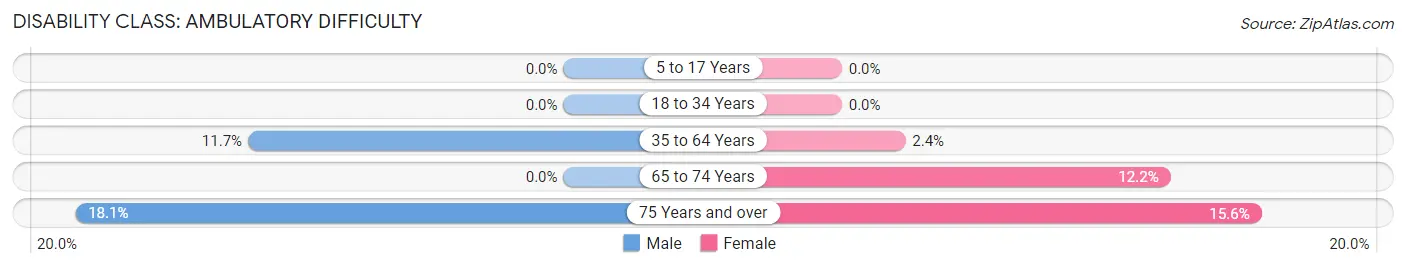
| Age Bracket | Male | Female |
| 5 to 17 Years | 0 (0.0%) | 0 (0.0%) |
| 18 to 34 Years | 0 (0.0%) | 0 (0.0%) |
| 35 to 64 Years | 26 (11.7%) | 5 (2.4%) |
| 65 to 74 Years | 0 (0.0%) | 15 (12.2%) |
| 75 Years and over | 25 (18.1%) | 31 (15.6%) |
Disability Class: Self-Care Difficulty
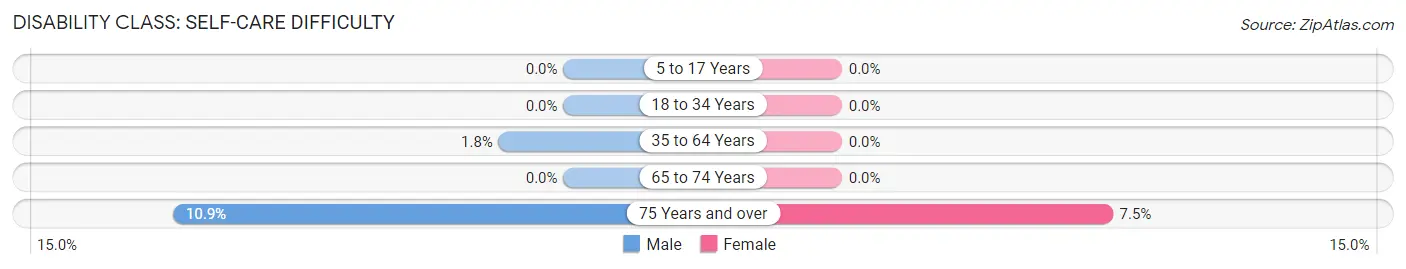
| Age Bracket | Male | Female |
| 5 to 17 Years | 0 (0.0%) | 0 (0.0%) |
| 18 to 34 Years | 0 (0.0%) | 0 (0.0%) |
| 35 to 64 Years | 4 (1.8%) | 0 (0.0%) |
| 65 to 74 Years | 0 (0.0%) | 0 (0.0%) |
| 75 Years and over | 15 (10.9%) | 15 (7.5%) |
Technology Access in North Newton
Computing Device Access in North Newton
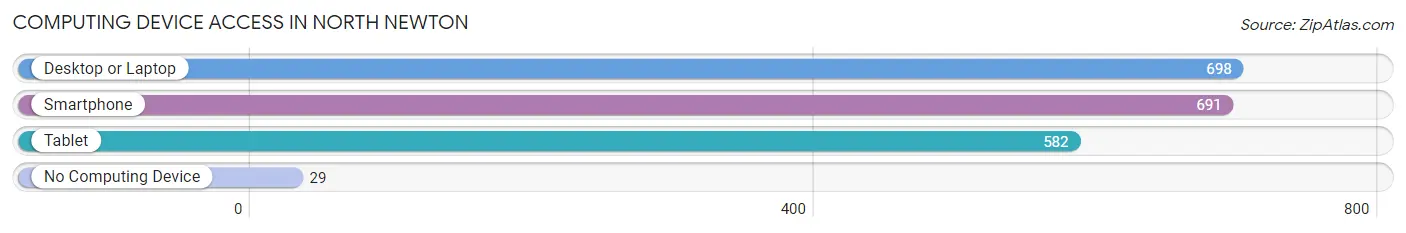
| Device Type | # Households | % Households |
| Desktop or Laptop | 698 | 86.7% |
| Smartphone | 691 | 85.8% |
| Tablet | 582 | 72.3% |
| No Computing Device | 29 | 3.6% |
| Total | 805 | 100.0% |
Internet Access in North Newton
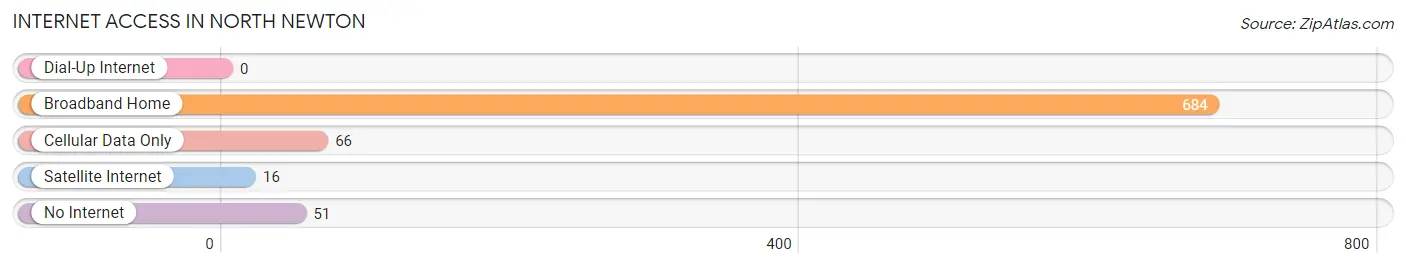
| Internet Type | # Households | % Households |
| Dial-Up Internet | 0 | 0.0% |
| Broadband Home | 684 | 85.0% |
| Cellular Data Only | 66 | 8.2% |
| Satellite Internet | 16 | 2.0% |
| No Internet | 51 | 6.3% |
| Total | 805 | 100.0% |
North Newton Summary
Newton, Kansas is a small city located in Harvey County, in the south-central part of the state. It is situated on the banks of the Arkansas River, and is part of the Wichita metropolitan area. The city has a population of approximately 12,000 people, and is the county seat of Harvey County.
History
Newton was founded in 1871 by a group of settlers from Newton, Massachusetts. The city was named after the Massachusetts town, and was incorporated in 1872. The city was originally a stop on the Santa Fe Trail, and was a major trading center for the area.
In 1887, the Atchison, Topeka and Santa Fe Railway arrived in Newton, and the city quickly became a major hub for the region. The city was also home to a number of manufacturing plants, including a flour mill, a brickyard, and a furniture factory.
In the early 20th century, Newton was a major center for the oil industry, and the city was home to several oil refineries. The city also became a major center for the cattle industry, and was home to several large cattle ranches.
Geography
Newton is located in south-central Kansas, in Harvey County. The city is situated on the banks of the Arkansas River, and is part of the Wichita metropolitan area. The city has a total area of 8.3 square miles, of which 8.2 square miles is land and 0.1 square miles is water.
The city has a humid continental climate, with hot summers and cold winters. The average annual temperature is 54 degrees Fahrenheit, and the average annual precipitation is 33 inches.
Economy
Newton’s economy is largely based on agriculture and manufacturing. The city is home to several large agricultural operations, including cattle ranches and grain farms. The city is also home to several manufacturing plants, including a flour mill, a brickyard, and a furniture factory.
The city is also home to several retail stores, restaurants, and other businesses. The city is served by the Newton Municipal Airport, and is home to several hotels and motels.
Demographics
As of the 2010 census, Newton had a population of 12,000 people. The racial makeup of the city was 87.3% White, 5.3% African American, 0.7% Native American, 0.7% Asian, 0.1% Pacific Islander, and 4.9% from other races. Hispanic or Latino of any race were 8.3% of the population.
The median household income in Newton was $41,000, and the median family income was $50,000. The per capita income in the city was $20,000. About 11.3% of the population was below the poverty line.
Newton is served by the Newton Unified School District, which includes four elementary schools, one middle school, and one high school. The city is also home to several private schools, including a Catholic school and a Christian school.
Common Questions
What is Per Capita Income in North Newton?
Per Capita income in North Newton is $40,803.
What is the Median Family Income in North Newton?
Median Family Income in North Newton is $125,893.
What is the Median Household income in North Newton?
Median Household Income in North Newton is $95,221.
What is Income or Wage Gap in North Newton?
Income or Wage Gap in North Newton is 59.8%.
Women in North Newton earn 40.2 cents for every dollar earned by a man.
What is Inequality or Gini Index in North Newton?
Inequality or Gini Index in North Newton is 0.38.
What is the Total Population of North Newton?
Total Population of North Newton is 2,105.
What is the Total Male Population of North Newton?
Total Male Population of North Newton is 1,024.
What is the Total Female Population of North Newton?
Total Female Population of North Newton is 1,081.
What is the Ratio of Males per 100 Females in North Newton?
There are 94.73 Males per 100 Females in North Newton.
What is the Ratio of Females per 100 Males in North Newton?
There are 105.57 Females per 100 Males in North Newton.
What is the Median Population Age in North Newton?
Median Population Age in North Newton is 41.4 Years.
What is the Average Family Size in North Newton
Average Family Size in North Newton is 2.5 People.
What is the Average Household Size in North Newton
Average Household Size in North Newton is 2.1 People.
How Large is the Labor Force in North Newton?
There are 1,066 People in the Labor Forcein in North Newton.
What is the Percentage of People in the Labor Force in North Newton?
59.4% of People are in the Labor Force in North Newton.
What is the Unemployment Rate in North Newton?
Unemployment Rate in North Newton is 7.8%.