Leetonia, OH Map & Demographics
Leetonia Map
Leetonia Overview
$30,581
PER CAPITA INCOME
$70,664
AVG FAMILY INCOME
$59,688
AVG HOUSEHOLD INCOME
41.1%
WAGE / INCOME GAP [ % ]
58.9¢/ $1
WAGE / INCOME GAP [ $ ]
$11,887
FAMILY INCOME DEFICIT
0.38
INEQUALITY / GINI INDEX
2,075
TOTAL POPULATION
1,035
MALE POPULATION
1,040
FEMALE POPULATION
99.52
MALES / 100 FEMALES
100.48
FEMALES / 100 MALES
46.6
MEDIAN AGE
2.9
AVG FAMILY SIZE
2.3
AVG HOUSEHOLD SIZE
1,042
LABOR FORCE [ PEOPLE ]
59.7%
PERCENT IN LABOR FORCE
7.9%
UNEMPLOYMENT RATE
Leetonia Zip Codes
Leetonia Area Codes
Income in Leetonia
Income Overview in Leetonia
Per Capita Income in Leetonia is $30,581, while median incomes of families and households are $70,664 and $59,688 respectively.
| Characteristic | Number | Measure |
| Per Capita Income | 2,075 | $30,581 |
| Median Family Income | 577 | $70,664 |
| Mean Family Income | 577 | $76,636 |
| Median Household Income | 915 | $59,688 |
| Mean Household Income | 915 | $68,190 |
| Income Deficit | 577 | $11,887 |
| Wage / Income Gap (%) | 2,075 | 41.09% |
| Wage / Income Gap ($) | 2,075 | 58.91¢ per $1 |
| Gini / Inequality Index | 2,075 | 0.38 |
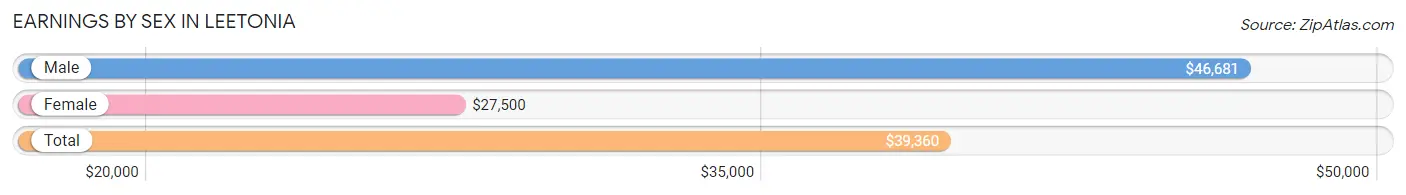
Earnings by Sex in Leetonia
Average Earnings in Leetonia are $39,360, $46,681 for men and $27,500 for women, a difference of 41.1%.
| Sex | Number | Average Earnings |
| Male | 555 (52.3%) | $46,681 |
| Female | 506 (47.7%) | $27,500 |
| Total | 1,061 (100.0%) | $39,360 |
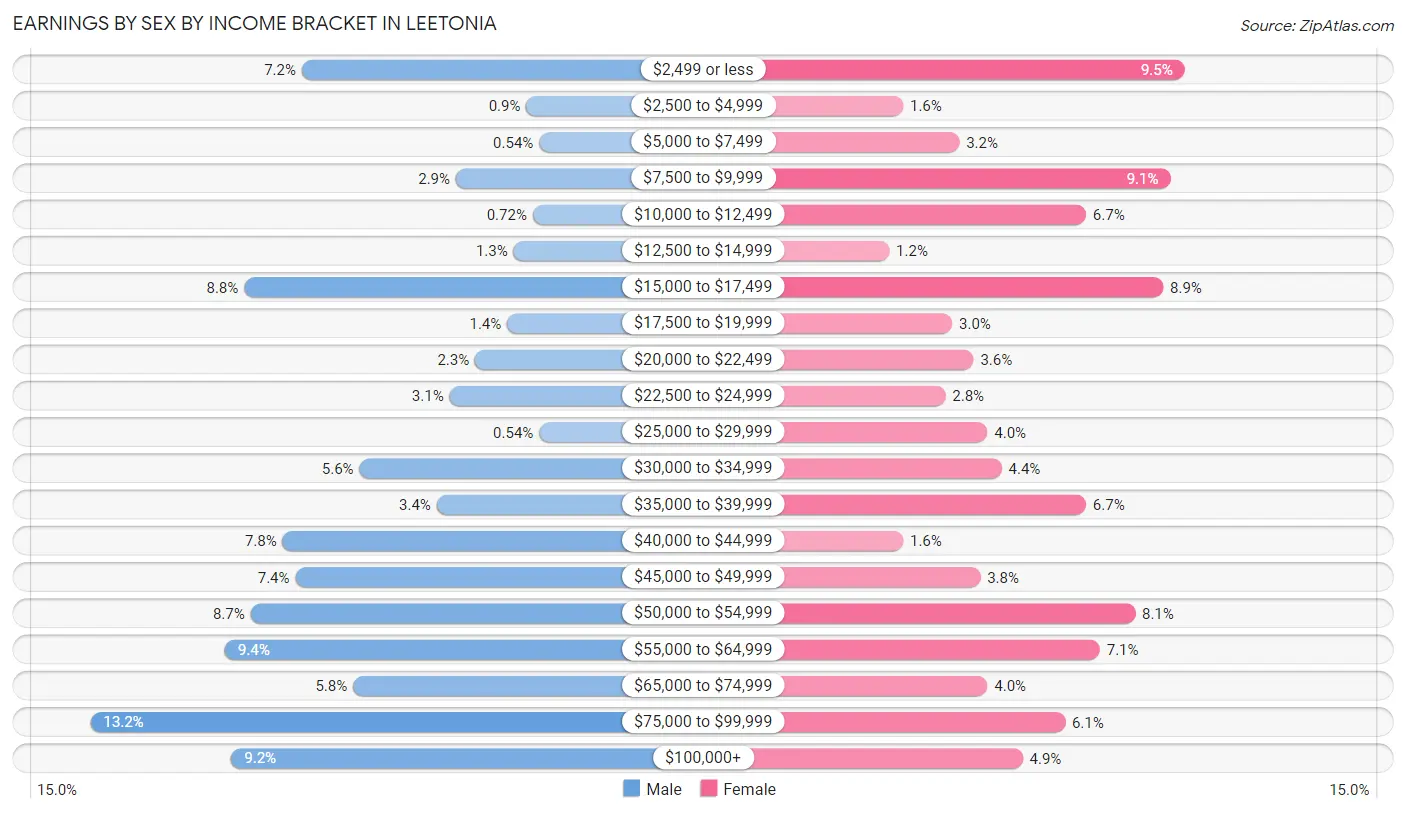
Earnings by Sex by Income Bracket in Leetonia
The most common earnings brackets in Leetonia are $75,000 to $99,999 for men (73 | 13.2%) and $2,499 or less for women (48 | 9.5%).
| Income | Male | Female |
| $2,499 or less | 40 (7.2%) | 48 (9.5%) |
| $2,500 to $4,999 | 5 (0.9%) | 8 (1.6%) |
| $5,000 to $7,499 | 3 (0.5%) | 16 (3.2%) |
| $7,500 to $9,999 | 16 (2.9%) | 46 (9.1%) |
| $10,000 to $12,499 | 4 (0.7%) | 34 (6.7%) |
| $12,500 to $14,999 | 7 (1.3%) | 6 (1.2%) |
| $15,000 to $17,499 | 49 (8.8%) | 45 (8.9%) |
| $17,500 to $19,999 | 8 (1.4%) | 15 (3.0%) |
| $20,000 to $22,499 | 13 (2.3%) | 18 (3.6%) |
| $22,500 to $24,999 | 17 (3.1%) | 14 (2.8%) |
| $25,000 to $29,999 | 3 (0.5%) | 20 (4.0%) |
| $30,000 to $34,999 | 31 (5.6%) | 22 (4.3%) |
| $35,000 to $39,999 | 19 (3.4%) | 34 (6.7%) |
| $40,000 to $44,999 | 43 (7.7%) | 8 (1.6%) |
| $45,000 to $49,999 | 41 (7.4%) | 19 (3.7%) |
| $50,000 to $54,999 | 48 (8.6%) | 41 (8.1%) |
| $55,000 to $64,999 | 52 (9.4%) | 36 (7.1%) |
| $65,000 to $74,999 | 32 (5.8%) | 20 (4.0%) |
| $75,000 to $99,999 | 73 (13.2%) | 31 (6.1%) |
| $100,000+ | 51 (9.2%) | 25 (4.9%) |
| Total | 555 (100.0%) | 506 (100.0%) |
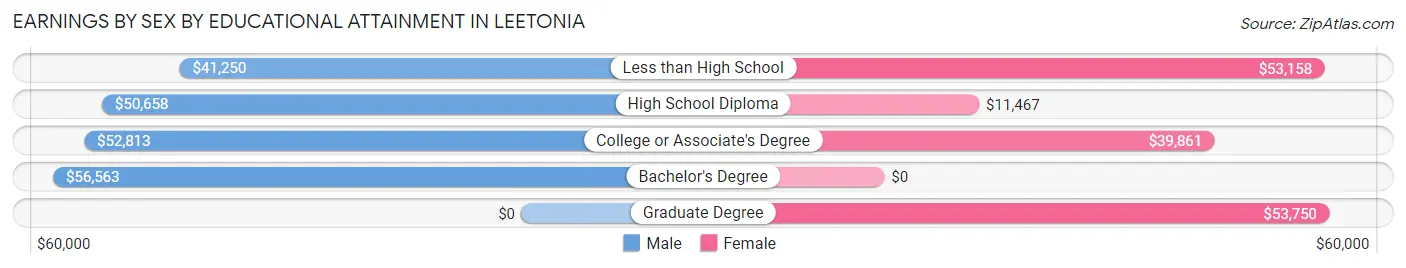
Earnings by Sex by Educational Attainment in Leetonia
Average earnings in Leetonia are $50,855 for men and $34,773 for women, a difference of 31.6%. Men with an educational attainment of bachelor's degree enjoy the highest average annual earnings of $56,563, while those with less than high school education earn the least with $41,250. Women with an educational attainment of graduate degree earn the most with the average annual earnings of $53,750, while those with high school diploma education have the smallest earnings of $11,467.
| Educational Attainment | Male Income | Female Income |
| Less than High School | $41,250 | $53,158 |
| High School Diploma | $50,658 | $11,467 |
| College or Associate's Degree | $52,813 | $39,861 |
| Bachelor's Degree | $56,563 | $0 |
| Graduate Degree | - | - |
| Total | $50,855 | $34,773 |
Family Income in Leetonia
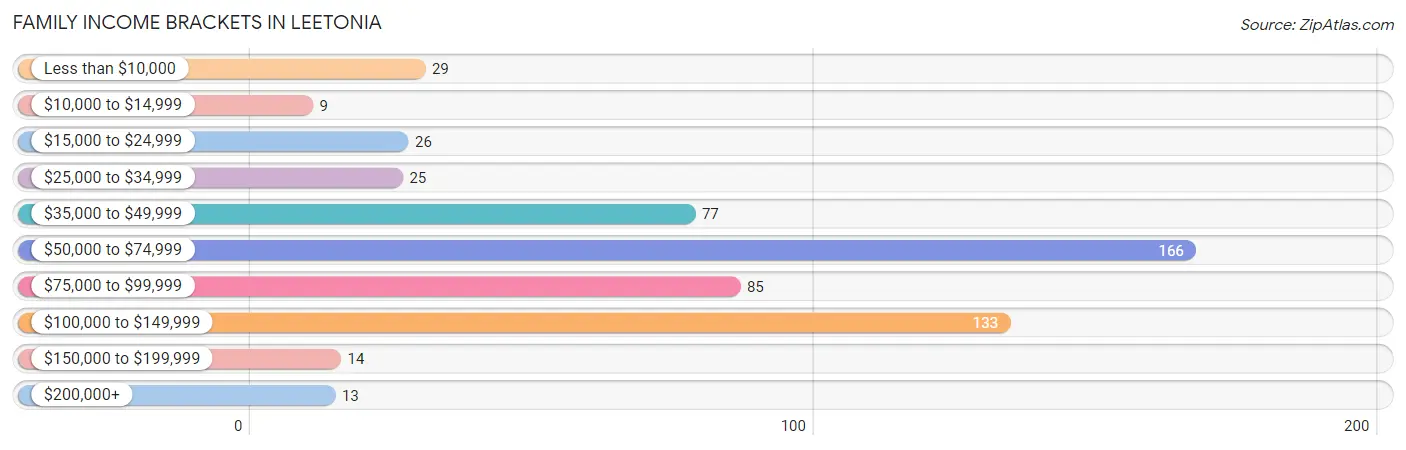
Family Income Brackets in Leetonia
According to the Leetonia family income data, there are 166 families falling into the $50,000 to $74,999 income range, which is the most common income bracket and makes up 28.8% of all families. Conversely, the $10,000 to $14,999 income bracket is the least frequent group with only 9 families (1.6%) belonging to this category.
| Income Bracket | # Families | % Families |
| Less than $10,000 | 29 | 5.0% |
| $10,000 to $14,999 | 9 | 1.6% |
| $15,000 to $24,999 | 26 | 4.5% |
| $25,000 to $34,999 | 25 | 4.3% |
| $35,000 to $49,999 | 77 | 13.3% |
| $50,000 to $74,999 | 166 | 28.8% |
| $75,000 to $99,999 | 85 | 14.7% |
| $100,000 to $149,999 | 133 | 23.1% |
| $150,000 to $199,999 | 14 | 2.4% |
| $200,000+ | 13 | 2.3% |
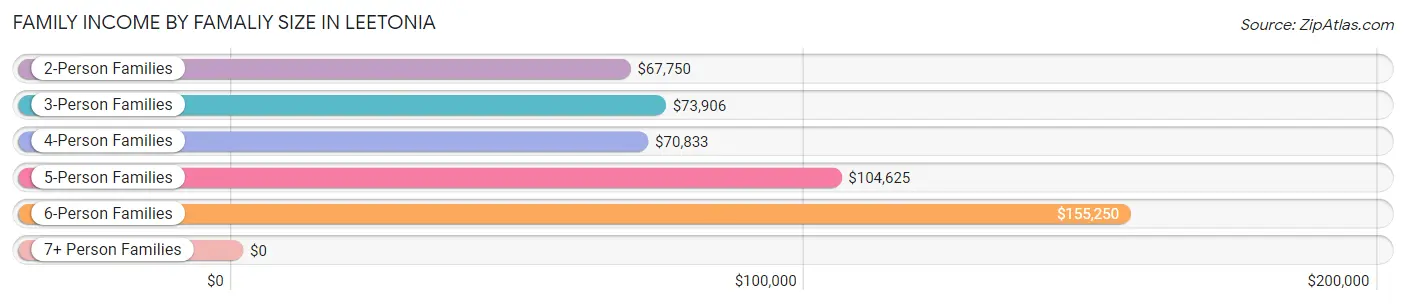
Family Income by Famaliy Size in Leetonia
6-person families (9 | 1.6%) account for the highest median family income in Leetonia with $155,250 per family, while 2-person families (293 | 50.8%) have the highest median income of $33,875 per family member.
| Income Bracket | # Families | Median Income |
| 2-Person Families | 293 (50.8%) | $67,750 |
| 3-Person Families | 193 (33.5%) | $73,906 |
| 4-Person Families | 50 (8.7%) | $70,833 |
| 5-Person Families | 29 (5.0%) | $104,625 |
| 6-Person Families | 9 (1.6%) | $155,250 |
| 7+ Person Families | 3 (0.5%) | $0 |
| Total | 577 (100.0%) | $70,664 |
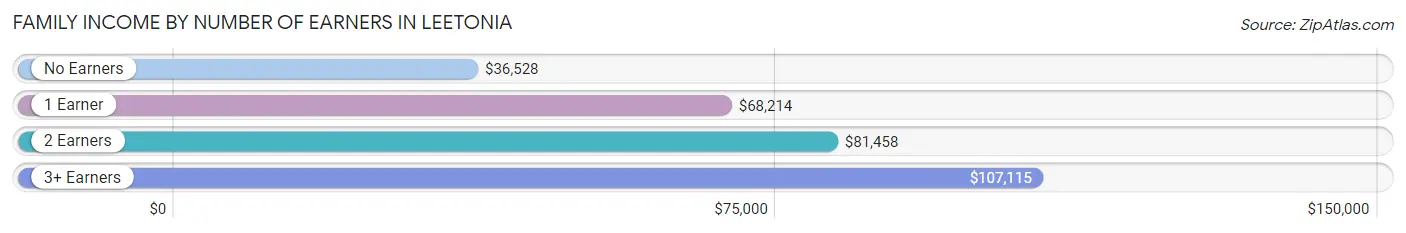
Family Income by Number of Earners in Leetonia
The median family income in Leetonia is $70,664, with families comprising 3+ earners (58) having the highest median family income of $107,115, while families with no earners (130) have the lowest median family income of $36,528, accounting for 10.1% and 22.5% of families, respectively.
| Number of Earners | # Families | Median Income |
| No Earners | 130 (22.5%) | $36,528 |
| 1 Earner | 200 (34.7%) | $68,214 |
| 2 Earners | 189 (32.8%) | $81,458 |
| 3+ Earners | 58 (10.1%) | $107,115 |
| Total | 577 (100.0%) | $70,664 |
Household Income in Leetonia
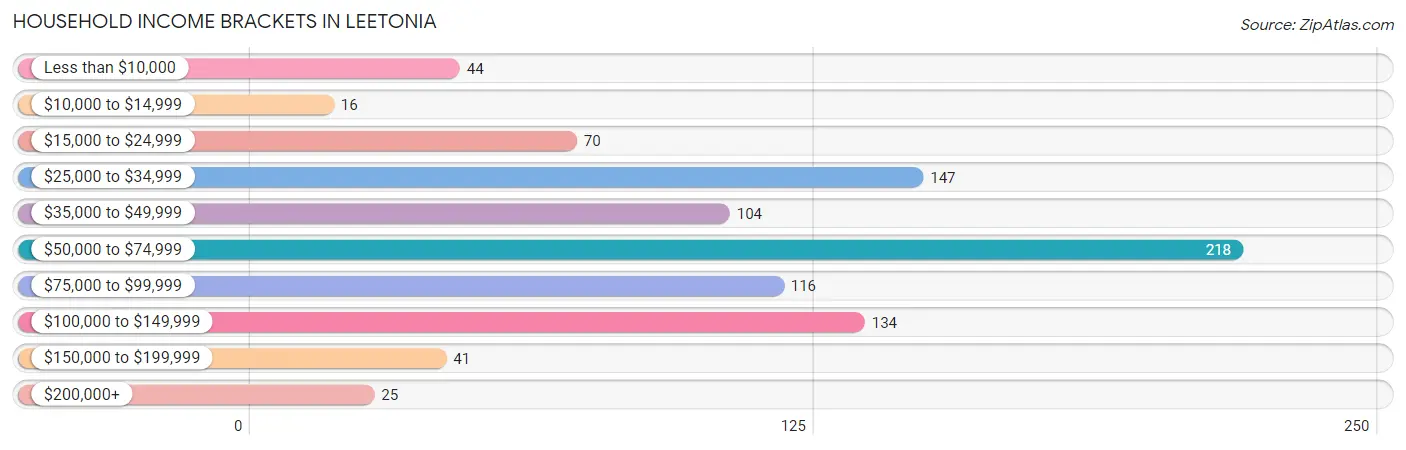
Household Income Brackets in Leetonia
With 218 households falling in the category, the $50,000 to $74,999 income range is the most frequent in Leetonia, accounting for 23.8% of all households. In contrast, only 16 households (1.8%) fall into the $10,000 to $14,999 income bracket, making it the least populous group.
| Income Bracket | # Households | % Households |
| Less than $10,000 | 44 | 4.8% |
| $10,000 to $14,999 | 16 | 1.7% |
| $15,000 to $24,999 | 70 | 7.7% |
| $25,000 to $34,999 | 147 | 16.1% |
| $35,000 to $49,999 | 104 | 11.4% |
| $50,000 to $74,999 | 218 | 23.8% |
| $75,000 to $99,999 | 116 | 12.7% |
| $100,000 to $149,999 | 134 | 14.6% |
| $150,000 to $199,999 | 41 | 4.5% |
| $200,000+ | 25 | 2.7% |
Household Income by Householder Age in Leetonia
The median household income in Leetonia is $59,688, with the highest median household income of $78,083 found in the 25 to 44 years age bracket for the primary householder. A total of 211 households (23.1%) fall into this category. Meanwhile, the 65+ years age bracket for the primary householder has the lowest median household income of $37,313, with 355 households (38.8%) in this group.
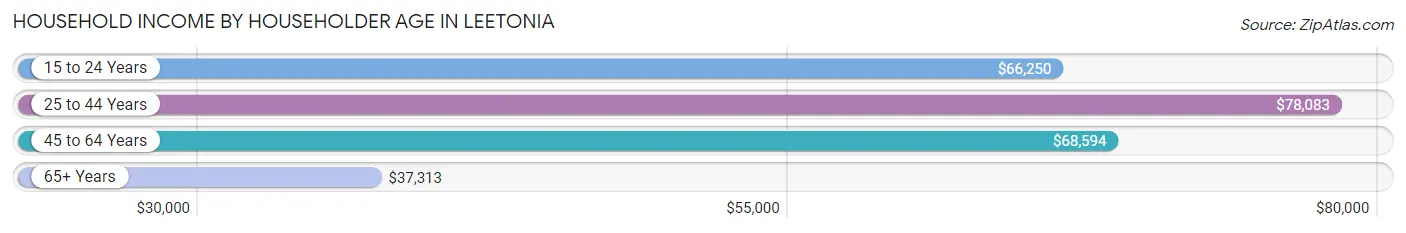
| Income Bracket | # Households | Median Income |
| 15 to 24 Years | 20 (2.2%) | $66,250 |
| 25 to 44 Years | 211 (23.1%) | $78,083 |
| 45 to 64 Years | 329 (36.0%) | $68,594 |
| 65+ Years | 355 (38.8%) | $37,313 |
| Total | 915 (100.0%) | $59,688 |
Poverty in Leetonia
Income Below Poverty by Sex and Age in Leetonia
With 8.5% poverty level for males and 13.0% for females among the residents of Leetonia, under 5 year old males and 5 year old females are the most vulnerable to poverty, with 18 males (34.6%) and 8 females (100.0%) in their respective age groups living below the poverty level.
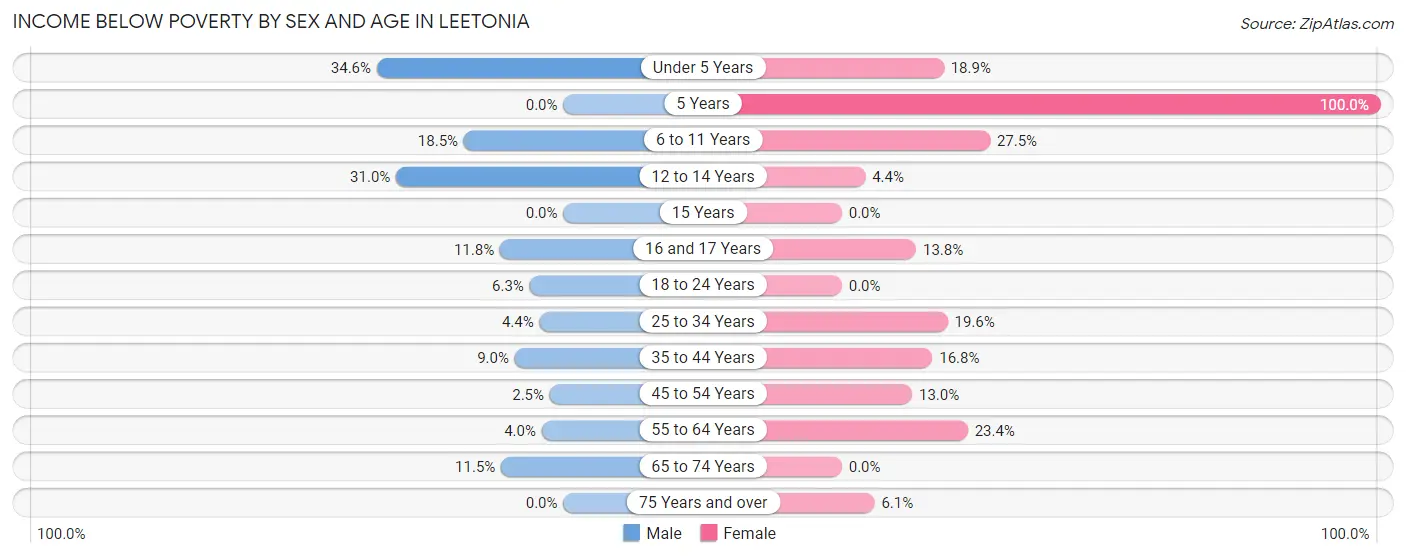
| Age Bracket | Male | Female |
| Under 5 Years | 18 (34.6%) | 7 (18.9%) |
| 5 Years | 0 (0.0%) | 8 (100.0%) |
| 6 to 11 Years | 12 (18.5%) | 11 (27.5%) |
| 12 to 14 Years | 9 (31.0%) | 2 (4.3%) |
| 15 Years | 0 (0.0%) | 0 (0.0%) |
| 16 and 17 Years | 2 (11.8%) | 4 (13.8%) |
| 18 to 24 Years | 6 (6.2%) | 0 (0.0%) |
| 25 to 34 Years | 5 (4.4%) | 21 (19.6%) |
| 35 to 44 Years | 10 (9.0%) | 21 (16.8%) |
| 45 to 54 Years | 4 (2.5%) | 12 (13.0%) |
| 55 to 64 Years | 4 (4.0%) | 43 (23.4%) |
| 65 to 74 Years | 18 (11.5%) | 0 (0.0%) |
| 75 Years and over | 0 (0.0%) | 6 (6.1%) |
| Total | 88 (8.5%) | 135 (13.0%) |
Income Above Poverty by Sex and Age in Leetonia
According to the poverty statistics in Leetonia, males aged 5 years and females aged 15 years are the age groups that are most secure financially, with 100.0% of males and 100.0% of females in these age groups living above the poverty line.
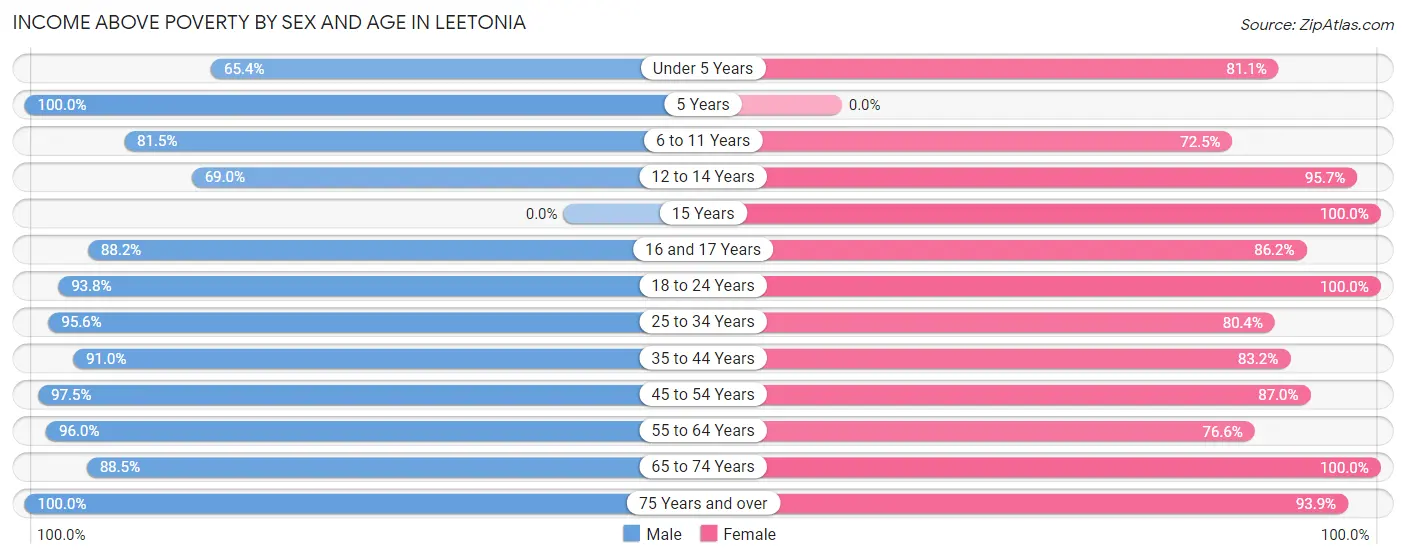
| Age Bracket | Male | Female |
| Under 5 Years | 34 (65.4%) | 30 (81.1%) |
| 5 Years | 7 (100.0%) | 0 (0.0%) |
| 6 to 11 Years | 53 (81.5%) | 29 (72.5%) |
| 12 to 14 Years | 20 (69.0%) | 44 (95.7%) |
| 15 Years | 0 (0.0%) | 46 (100.0%) |
| 16 and 17 Years | 15 (88.2%) | 25 (86.2%) |
| 18 to 24 Years | 90 (93.8%) | 74 (100.0%) |
| 25 to 34 Years | 108 (95.6%) | 86 (80.4%) |
| 35 to 44 Years | 101 (91.0%) | 104 (83.2%) |
| 45 to 54 Years | 156 (97.5%) | 80 (87.0%) |
| 55 to 64 Years | 96 (96.0%) | 141 (76.6%) |
| 65 to 74 Years | 138 (88.5%) | 153 (100.0%) |
| 75 Years and over | 129 (100.0%) | 93 (93.9%) |
| Total | 947 (91.5%) | 905 (87.0%) |
Income Below Poverty Among Married-Couple Families in Leetonia
The poverty statistics for married-couple families in Leetonia show that 6.5% or 25 of the total 386 families live below the poverty line. Families with 1 or 2 children have the highest poverty rate of 8.4%, comprising of 7 families. On the other hand, families with 3 or 4 children have the lowest poverty rate of 0.0%, which includes 0 families.
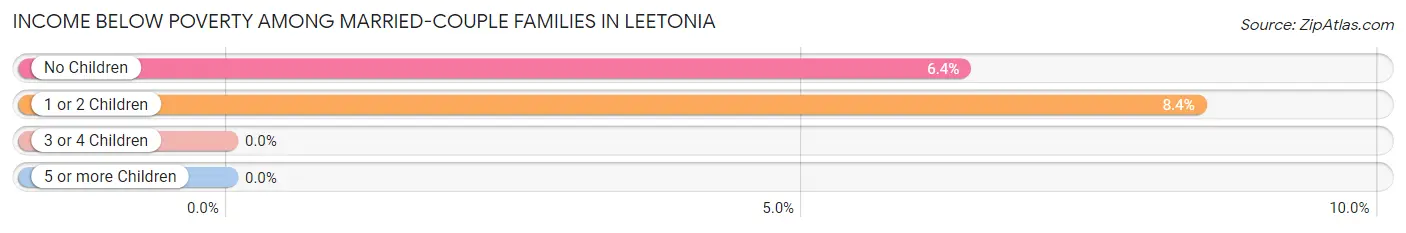
| Children | Above Poverty | Below Poverty |
| No Children | 264 (93.6%) | 18 (6.4%) |
| 1 or 2 Children | 76 (91.6%) | 7 (8.4%) |
| 3 or 4 Children | 21 (100.0%) | 0 (0.0%) |
| 5 or more Children | 0 (0.0%) | 0 (0.0%) |
| Total | 361 (93.5%) | 25 (6.5%) |
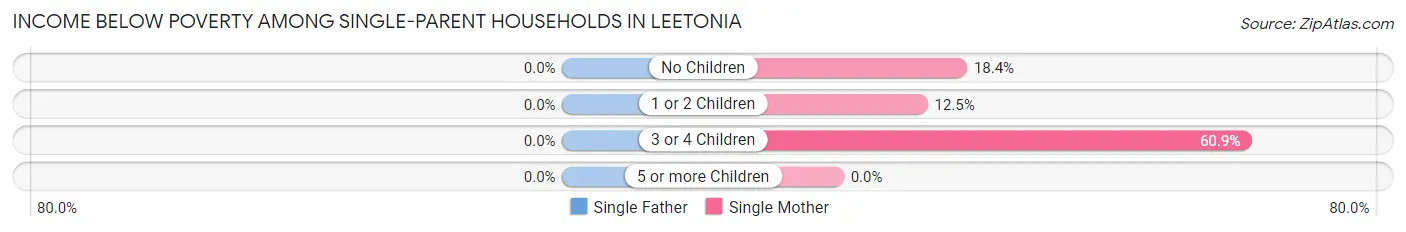
Income Below Poverty Among Single-Parent Households in Leetonia
| Children | Single Father | Single Mother |
| No Children | 0 (0.0%) | 9 (18.4%) |
| 1 or 2 Children | 0 (0.0%) | 7 (12.5%) |
| 3 or 4 Children | 0 (0.0%) | 14 (60.9%) |
| 5 or more Children | 0 (0.0%) | 0 (0.0%) |
| Total | 0 (0.0%) | 30 (23.4%) |
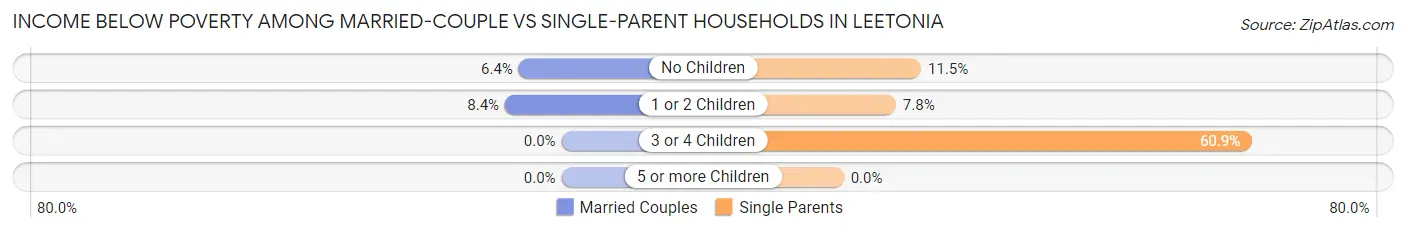
Income Below Poverty Among Married-Couple vs Single-Parent Households in Leetonia
The poverty data for Leetonia shows that 25 of the married-couple family households (6.5%) and 30 of the single-parent households (15.7%) are living below the poverty level. Within the married-couple family households, those with 1 or 2 children have the highest poverty rate, with 7 households (8.4%) falling below the poverty line. Among the single-parent households, those with 3 or 4 children have the highest poverty rate, with 14 household (60.9%) living below poverty.
| Children | Married-Couple Families | Single-Parent Households |
| No Children | 18 (6.4%) | 9 (11.5%) |
| 1 or 2 Children | 7 (8.4%) | 7 (7.8%) |
| 3 or 4 Children | 0 (0.0%) | 14 (60.9%) |
| 5 or more Children | 0 (0.0%) | 0 (0.0%) |
| Total | 25 (6.5%) | 30 (15.7%) |
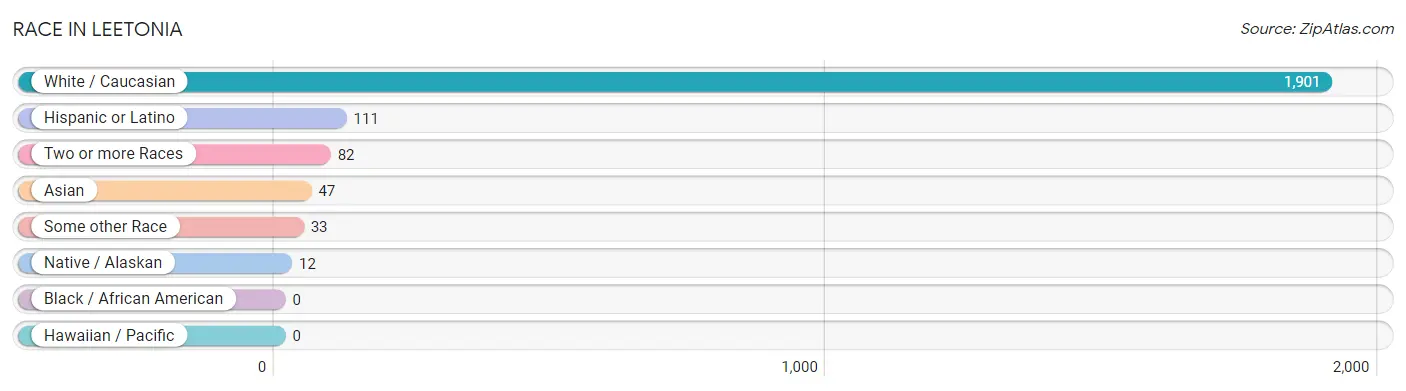
Race in Leetonia
The most populous races in Leetonia are White / Caucasian (1,901 | 91.6%), Hispanic or Latino (111 | 5.3%), and Two or more Races (82 | 4.0%).
| Race | # Population | % Population |
| Asian | 47 | 2.3% |
| Black / African American | 0 | 0.0% |
| Hawaiian / Pacific | 0 | 0.0% |
| Hispanic or Latino | 111 | 5.3% |
| Native / Alaskan | 12 | 0.6% |
| White / Caucasian | 1,901 | 91.6% |
| Two or more Races | 82 | 4.0% |
| Some other Race | 33 | 1.6% |
| Total | 2,075 | 100.0% |
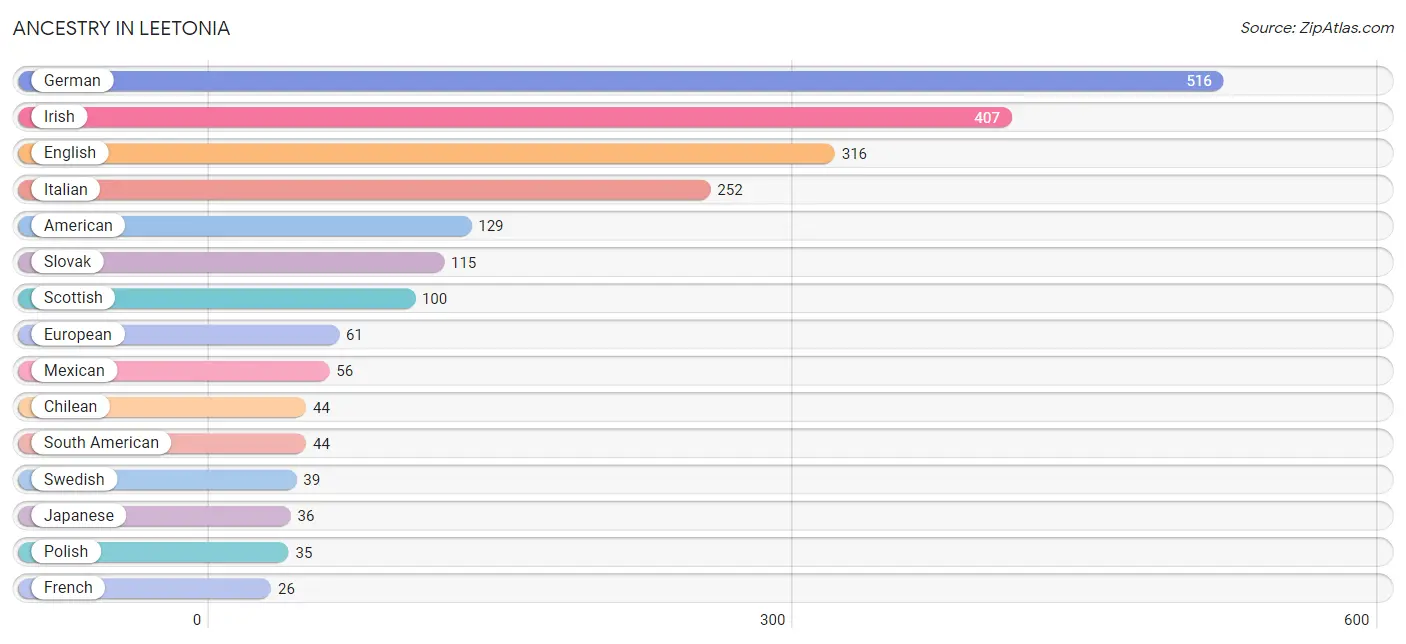
Ancestry in Leetonia
The most populous ancestries reported in Leetonia are German (516 | 24.9%), Irish (407 | 19.6%), English (316 | 15.2%), Italian (252 | 12.1%), and American (129 | 6.2%), together accounting for 78.1% of all Leetonia residents.
| Ancestry | # Population | % Population |
| American | 129 | 6.2% |
| Arab | 4 | 0.2% |
| Austrian | 4 | 0.2% |
| Bhutanese | 24 | 1.2% |
| Cherokee | 2 | 0.1% |
| Chilean | 44 | 2.1% |
| Croatian | 6 | 0.3% |
| Cuban | 11 | 0.5% |
| Dutch | 12 | 0.6% |
| English | 316 | 15.2% |
| European | 61 | 2.9% |
| French | 26 | 1.3% |
| German | 516 | 24.9% |
| Greek | 4 | 0.2% |
| Hungarian | 17 | 0.8% |
| Irish | 407 | 19.6% |
| Italian | 252 | 12.1% |
| Japanese | 36 | 1.7% |
| Lebanese | 4 | 0.2% |
| Mexican | 56 | 2.7% |
| Pennsylvania German | 4 | 0.2% |
| Polish | 35 | 1.7% |
| Romanian | 23 | 1.1% |
| Russian | 3 | 0.1% |
| Scotch-Irish | 10 | 0.5% |
| Scottish | 100 | 4.8% |
| Slovak | 115 | 5.5% |
| Slovene | 4 | 0.2% |
| South American | 44 | 2.1% |
| Swedish | 39 | 1.9% |
| Swiss | 7 | 0.3% |
| Ukrainian | 15 | 0.7% |
| Welsh | 6 | 0.3% |
| Yaqui | 12 | 0.6% | View All 34 Rows |
Immigrants in Leetonia
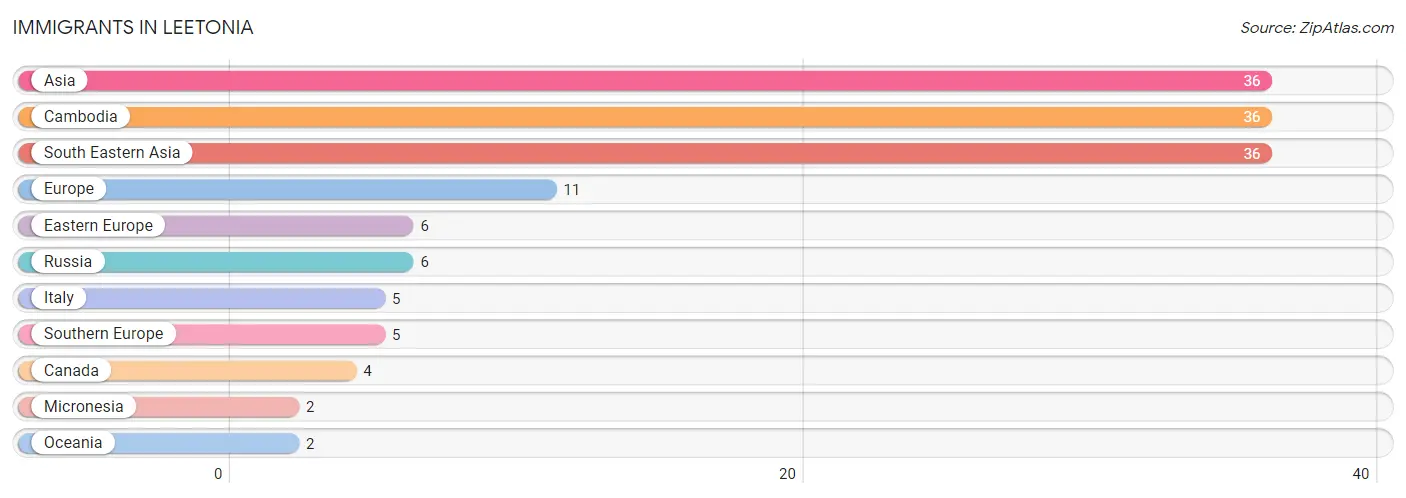
The most numerous immigrant groups reported in Leetonia came from Asia (36 | 1.7%), Cambodia (36 | 1.7%), South Eastern Asia (36 | 1.7%), Europe (11 | 0.5%), and Eastern Europe (6 | 0.3%), together accounting for 6.0% of all Leetonia residents.
| Immigration Origin | # Population | % Population |
| Asia | 36 | 1.7% |
| Cambodia | 36 | 1.7% |
| Canada | 4 | 0.2% |
| Eastern Europe | 6 | 0.3% |
| Europe | 11 | 0.5% |
| Italy | 5 | 0.2% |
| Micronesia | 2 | 0.1% |
| Oceania | 2 | 0.1% |
| Russia | 6 | 0.3% |
| South Eastern Asia | 36 | 1.7% |
| Southern Europe | 5 | 0.2% | View All 11 Rows |
Sex and Age in Leetonia
Sex and Age in Leetonia
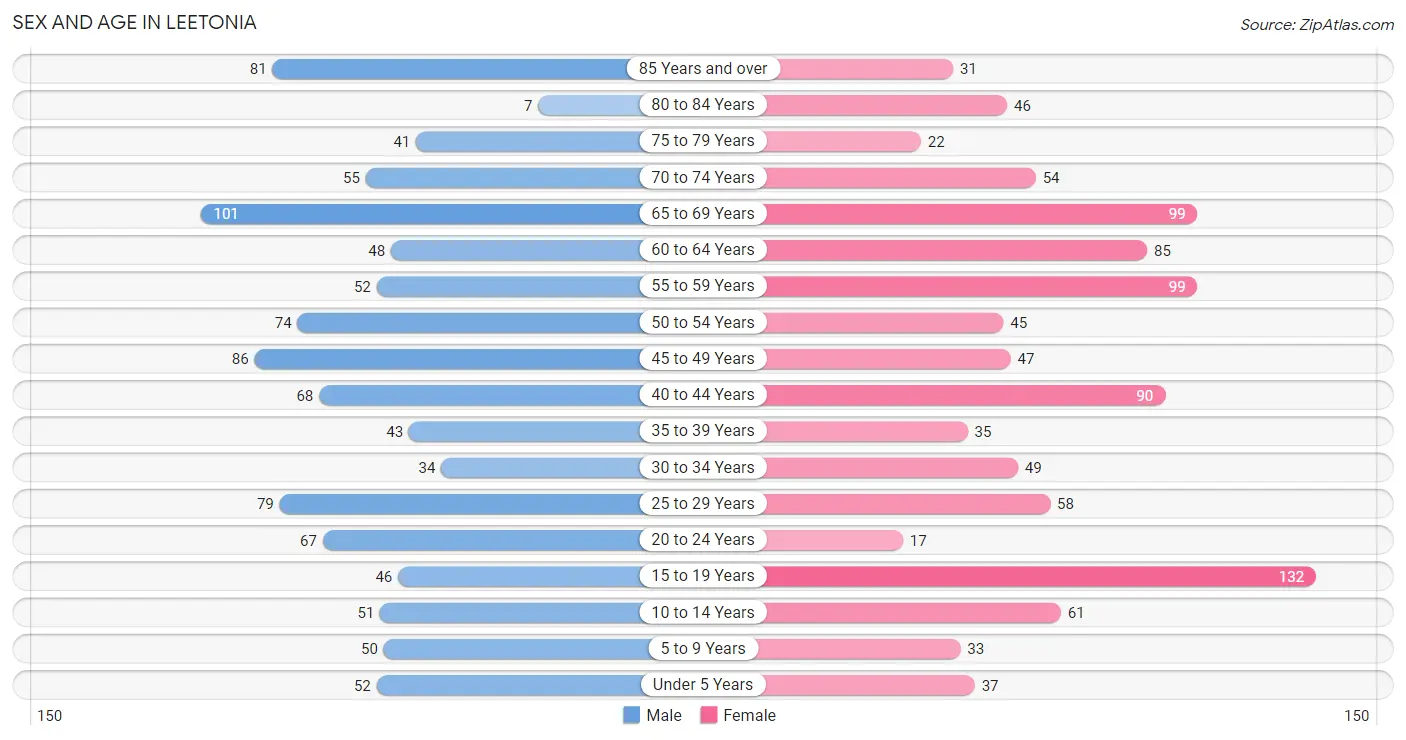
The most populous age groups in Leetonia are 65 to 69 Years (101 | 9.8%) for men and 15 to 19 Years (132 | 12.7%) for women.
| Age Bracket | Male | Female |
| Under 5 Years | 52 (5.0%) | 37 (3.6%) |
| 5 to 9 Years | 50 (4.8%) | 33 (3.2%) |
| 10 to 14 Years | 51 (4.9%) | 61 (5.9%) |
| 15 to 19 Years | 46 (4.4%) | 132 (12.7%) |
| 20 to 24 Years | 67 (6.5%) | 17 (1.6%) |
| 25 to 29 Years | 79 (7.6%) | 58 (5.6%) |
| 30 to 34 Years | 34 (3.3%) | 49 (4.7%) |
| 35 to 39 Years | 43 (4.2%) | 35 (3.4%) |
| 40 to 44 Years | 68 (6.6%) | 90 (8.6%) |
| 45 to 49 Years | 86 (8.3%) | 47 (4.5%) |
| 50 to 54 Years | 74 (7.1%) | 45 (4.3%) |
| 55 to 59 Years | 52 (5.0%) | 99 (9.5%) |
| 60 to 64 Years | 48 (4.6%) | 85 (8.2%) |
| 65 to 69 Years | 101 (9.8%) | 99 (9.5%) |
| 70 to 74 Years | 55 (5.3%) | 54 (5.2%) |
| 75 to 79 Years | 41 (4.0%) | 22 (2.1%) |
| 80 to 84 Years | 7 (0.7%) | 46 (4.4%) |
| 85 Years and over | 81 (7.8%) | 31 (3.0%) |
| Total | 1,035 (100.0%) | 1,040 (100.0%) |
Families and Households in Leetonia
Median Family Size in Leetonia
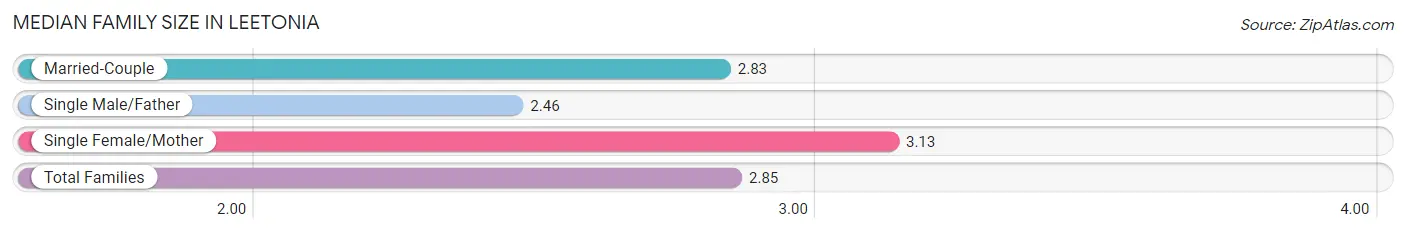
The median family size in Leetonia is 2.85 persons per family, with single female/mother families (128 | 22.2%) accounting for the largest median family size of 3.13 persons per family. On the other hand, single male/father families (63 | 10.9%) represent the smallest median family size with 2.46 persons per family.
| Family Type | # Families | Family Size |
| Married-Couple | 386 (66.9%) | 2.83 |
| Single Male/Father | 63 (10.9%) | 2.46 |
| Single Female/Mother | 128 (22.2%) | 3.13 |
| Total Families | 577 (100.0%) | 2.85 |
Median Household Size in Leetonia
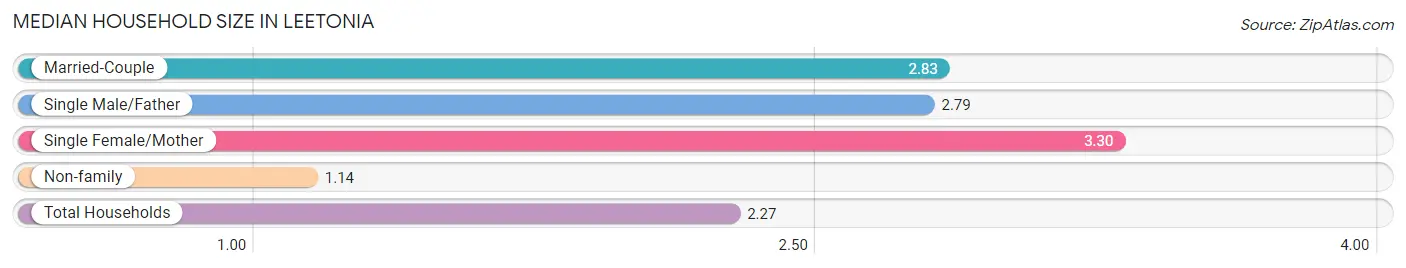
The median household size in Leetonia is 2.27 persons per household, with single female/mother households (128 | 14.0%) accounting for the largest median household size of 3.3 persons per household. non-family households (338 | 36.9%) represent the smallest median household size with 1.14 persons per household.
| Household Type | # Households | Household Size |
| Married-Couple | 386 (42.2%) | 2.83 |
| Single Male/Father | 63 (6.9%) | 2.79 |
| Single Female/Mother | 128 (14.0%) | 3.30 |
| Non-family | 338 (36.9%) | 1.14 |
| Total Households | 915 (100.0%) | 2.27 |
Household Size by Marriage Status in Leetonia
Out of a total of 915 households in Leetonia, 577 (63.1%) are family households, while 338 (36.9%) are nonfamily households. The most numerous type of family households are 2-person households, comprising 281, and the most common type of nonfamily households are 1-person households, comprising 296.
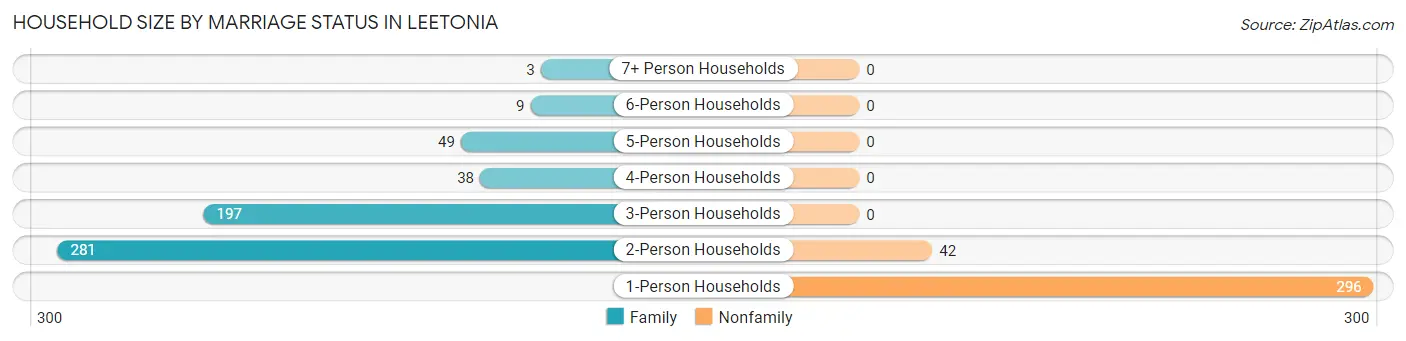
| Household Size | Family Households | Nonfamily Households |
| 1-Person Households | - | 296 (32.4%) |
| 2-Person Households | 281 (30.7%) | 42 (4.6%) |
| 3-Person Households | 197 (21.5%) | 0 (0.0%) |
| 4-Person Households | 38 (4.2%) | 0 (0.0%) |
| 5-Person Households | 49 (5.4%) | 0 (0.0%) |
| 6-Person Households | 9 (1.0%) | 0 (0.0%) |
| 7+ Person Households | 3 (0.3%) | 0 (0.0%) |
| Total | 577 (63.1%) | 338 (36.9%) |
Female Fertility in Leetonia
Fertility by Age in Leetonia
Average fertility rate in Leetonia is 33.0 births per 1,000 women. Women in the age bracket of 20 to 34 years have the highest fertility rate with 121.0 births per 1,000 women. Women in the age bracket of 20 to 34 years acount for 100.0% of all women with births.
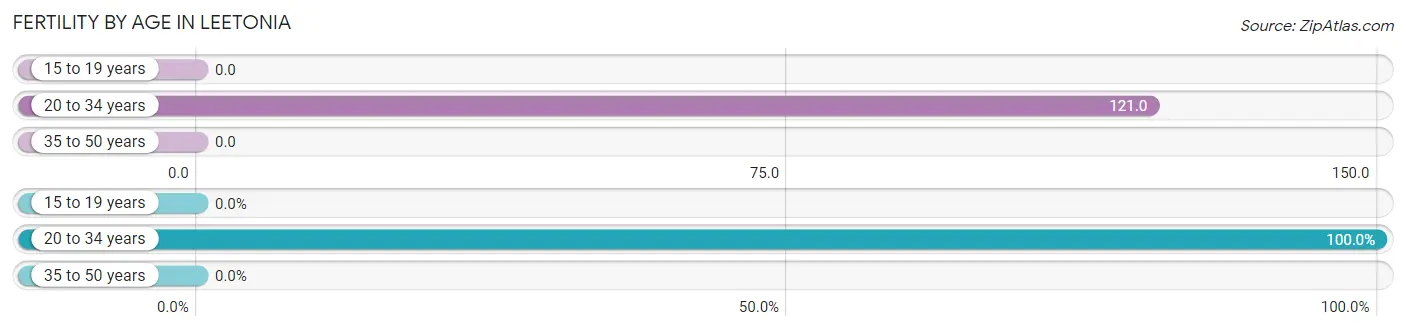
| Age Bracket | Women with Births | Births / 1,000 Women |
| 15 to 19 years | 0 (0.0%) | 0.0 |
| 20 to 34 years | 15 (100.0%) | 121.0 |
| 35 to 50 years | 0 (0.0%) | 0.0 |
| Total | 15 (100.0%) | 33.0 |
Fertility by Age by Marriage Status in Leetonia
33.3% of women with births (15) in Leetonia are married. The highest percentage of unmarried women with births falls into 20 to 34 years age bracket with 66.7% of them unmarried at the time of birth, while the lowest percentage of unmarried women with births belong to 20 to 34 years age bracket with 66.7% of them unmarried.
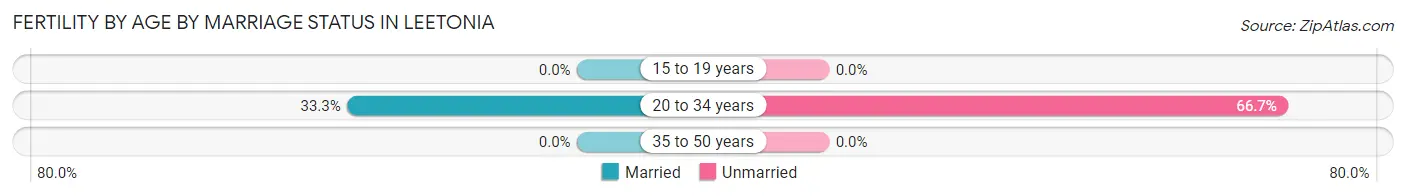
| Age Bracket | Married | Unmarried |
| 15 to 19 years | 0 (0.0%) | 0 (0.0%) |
| 20 to 34 years | 5 (33.3%) | 10 (66.7%) |
| 35 to 50 years | 0 (0.0%) | 0 (0.0%) |
| Total | 5 (33.3%) | 10 (66.7%) |
Fertility by Education in Leetonia
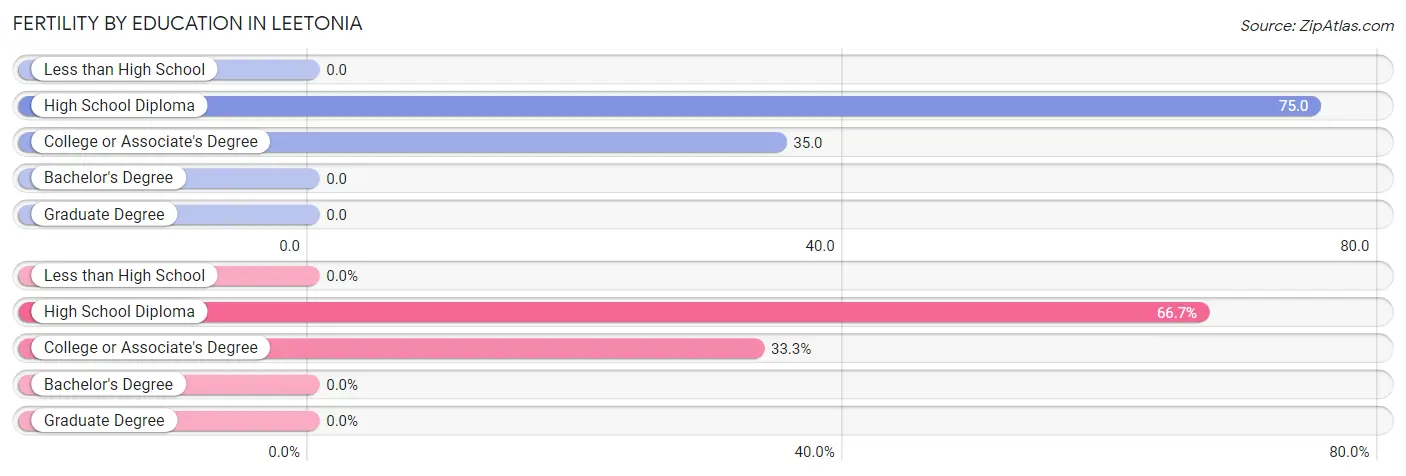
| Educational Attainment | Women with Births | Births / 1,000 Women |
| Less than High School | 0 (0.0%) | 0.0 |
| High School Diploma | 10 (66.7%) | 75.0 |
| College or Associate's Degree | 5 (33.3%) | 35.0 |
| Bachelor's Degree | 0 (0.0%) | 0.0 |
| Graduate Degree | 0 (0.0%) | 0.0 |
| Total | 15 (100.0%) | 33.0 |
Fertility by Education by Marriage Status in Leetonia
66.7% of women with births in Leetonia are unmarried. Women with the educational attainment of college or associate's degree are most likely to be married with 100.0% of them married at childbirth, while women with the educational attainment of high school diploma are least likely to be married with 100.0% of them unmarried at childbirth.
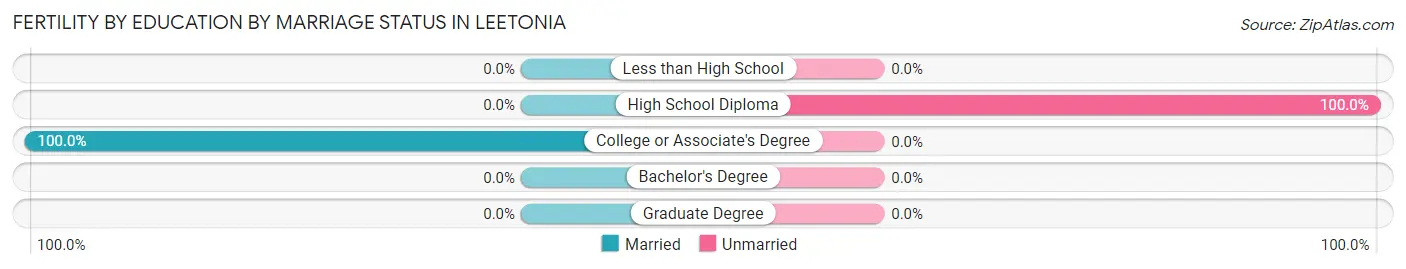
| Educational Attainment | Married | Unmarried |
| Less than High School | 0 (0.0%) | 0 (0.0%) |
| High School Diploma | 0 (0.0%) | 10 (100.0%) |
| College or Associate's Degree | 5 (100.0%) | 0 (0.0%) |
| Bachelor's Degree | 0 (0.0%) | 0 (0.0%) |
| Graduate Degree | 0 (0.0%) | 0 (0.0%) |
| Total | 5 (33.3%) | 10 (66.7%) |
Employment Characteristics in Leetonia
Employment by Class of Employer in Leetonia
Among the 956 employed individuals in Leetonia, private company employees (716 | 74.9%), not-for-profit organizations (93 | 9.7%), and local government employees (76 | 8.0%) make up the most common classes of employment.
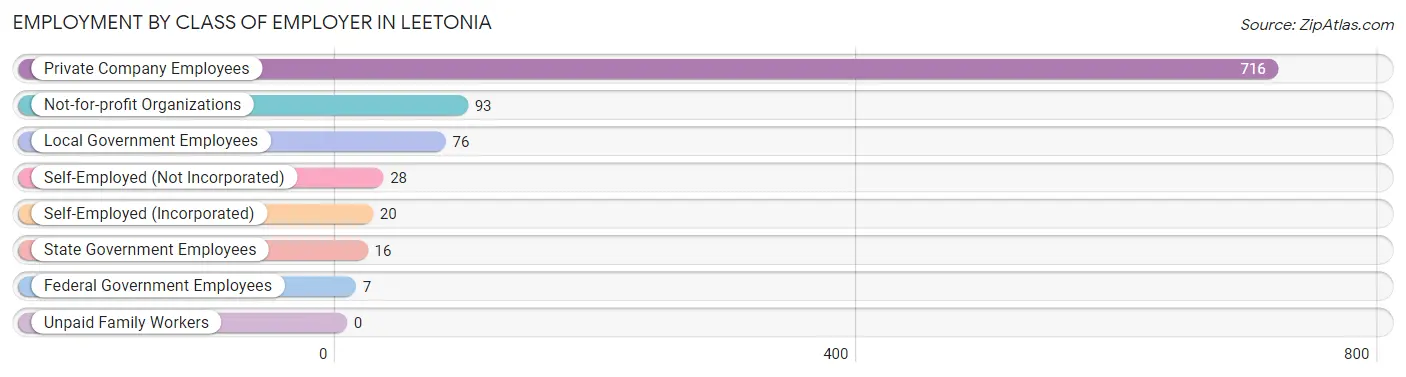
| Employer Class | # Employees | % Employees |
| Private Company Employees | 716 | 74.9% |
| Self-Employed (Incorporated) | 20 | 2.1% |
| Self-Employed (Not Incorporated) | 28 | 2.9% |
| Not-for-profit Organizations | 93 | 9.7% |
| Local Government Employees | 76 | 8.0% |
| State Government Employees | 16 | 1.7% |
| Federal Government Employees | 7 | 0.7% |
| Unpaid Family Workers | 0 | 0.0% |
| Total | 956 | 100.0% |
Employment Status by Age in Leetonia
According to the labor force statistics for Leetonia, out of the total population over 16 years of age (1,745), 59.7% or 1,042 individuals are in the labor force, with 7.9% or 82 of them unemployed. The age group with the highest labor force participation rate is 45 to 54 years, with 92.5% or 233 individuals in the labor force. Within the labor force, the 16 to 19 years age range has the highest percentage of unemployed individuals, with 27.1% or 23 of them being unemployed.
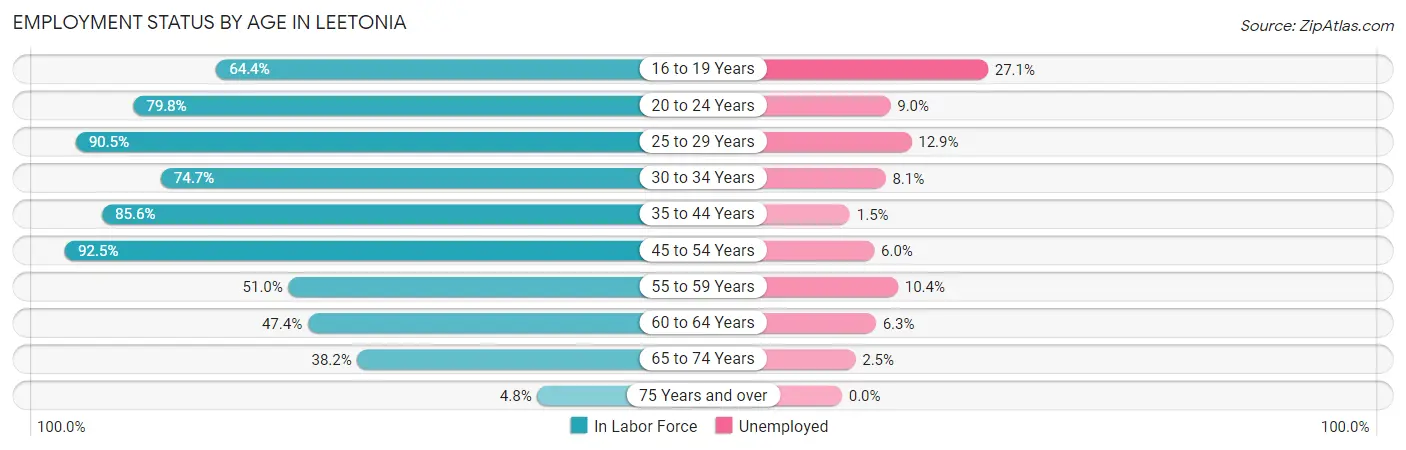
| Age Bracket | In Labor Force | Unemployed |
| 16 to 19 Years | 85 (64.4%) | 23 (27.1%) |
| 20 to 24 Years | 67 (79.8%) | 6 (9.0%) |
| 25 to 29 Years | 124 (90.5%) | 16 (12.9%) |
| 30 to 34 Years | 62 (74.7%) | 5 (8.1%) |
| 35 to 44 Years | 202 (85.6%) | 3 (1.5%) |
| 45 to 54 Years | 233 (92.5%) | 14 (6.0%) |
| 55 to 59 Years | 77 (51.0%) | 8 (10.4%) |
| 60 to 64 Years | 63 (47.4%) | 4 (6.3%) |
| 65 to 74 Years | 118 (38.2%) | 3 (2.5%) |
| 75 Years and over | 11 (4.8%) | 0 (0.0%) |
| Total | 1,042 (59.7%) | 82 (7.9%) |
Employment Status by Educational Attainment in Leetonia
According to labor force statistics for Leetonia, 76.7% of individuals (761) out of the total population between 25 and 64 years of age (992) are in the labor force, with 6.6% or 50 of them being unemployed. The group with the highest labor force participation rate are those with the educational attainment of bachelor's degree or higher, with 89.8% or 132 individuals in the labor force. Within the labor force, individuals with high school diploma education have the highest percentage of unemployment, with 11.4% or 38 of them being unemployed.
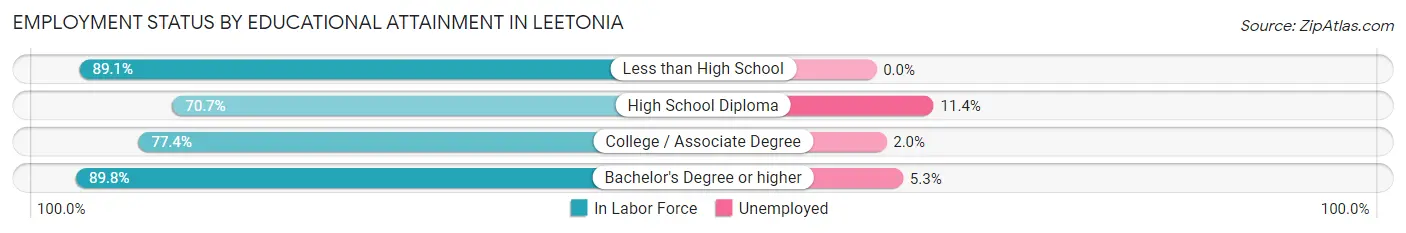
| Educational Attainment | In Labor Force | Unemployed |
| Less than High School | 49 (89.1%) | 0 (0.0%) |
| High School Diploma | 333 (70.7%) | 54 (11.4%) |
| College / Associate Degree | 247 (77.4%) | 6 (2.0%) |
| Bachelor's Degree or higher | 132 (89.8%) | 8 (5.3%) |
| Total | 761 (76.7%) | 65 (6.6%) |
Employment Occupations by Sex in Leetonia
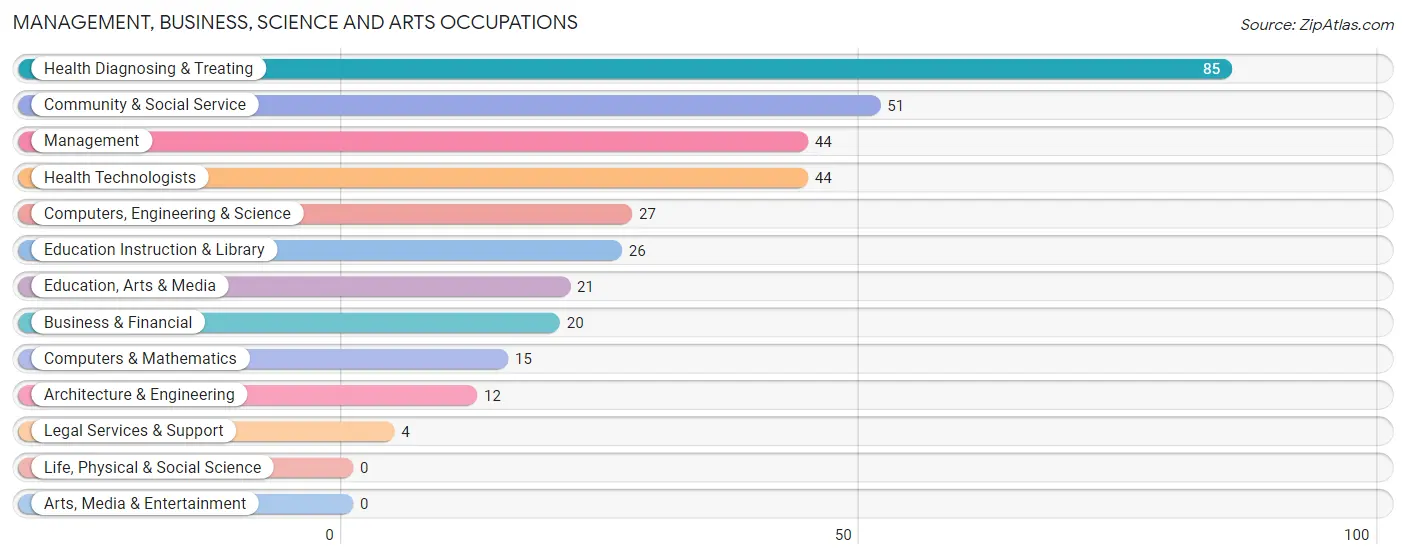
Management, Business, Science and Arts Occupations
The most common Management, Business, Science and Arts occupations in Leetonia are Health Diagnosing & Treating (85 | 8.8%), Community & Social Service (51 | 5.3%), Management (44 | 4.6%), Health Technologists (44 | 4.6%), and Computers, Engineering & Science (27 | 2.8%).
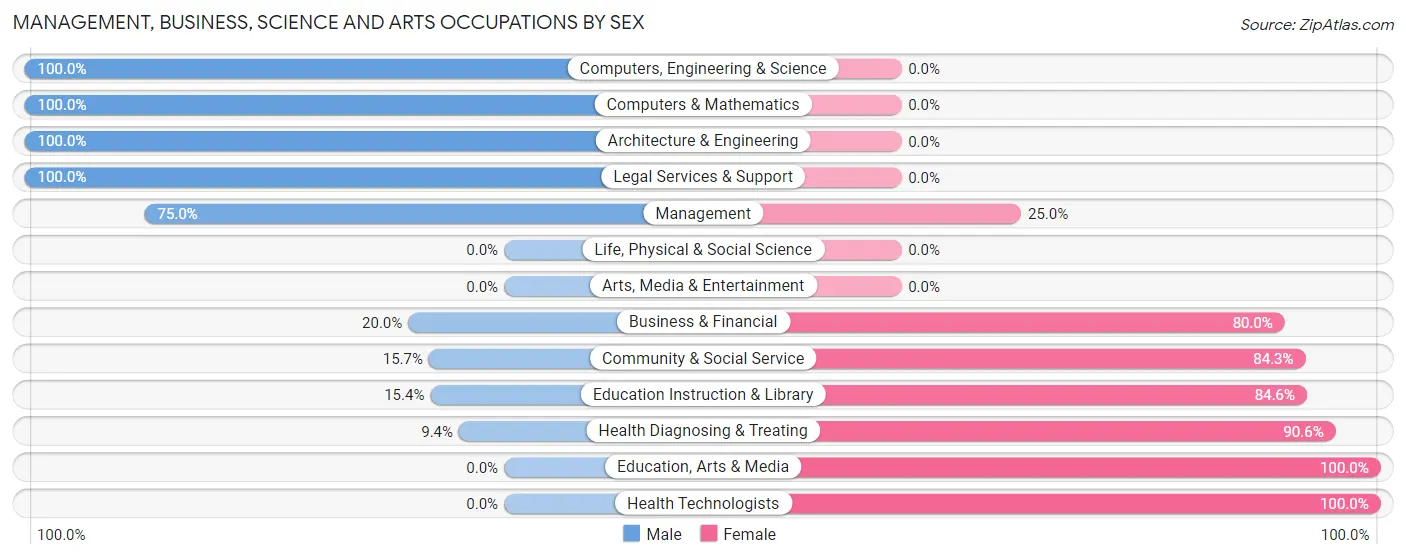
Management, Business, Science and Arts Occupations by Sex
Within the Management, Business, Science and Arts occupations in Leetonia, the most male-oriented occupations are Computers, Engineering & Science (100.0%), Computers & Mathematics (100.0%), and Architecture & Engineering (100.0%), while the most female-oriented occupations are Education, Arts & Media (100.0%), Health Technologists (100.0%), and Health Diagnosing & Treating (90.6%).
| Occupation | Male | Female |
| Management | 33 (75.0%) | 11 (25.0%) |
| Business & Financial | 4 (20.0%) | 16 (80.0%) |
| Computers, Engineering & Science | 27 (100.0%) | 0 (0.0%) |
| Computers & Mathematics | 15 (100.0%) | 0 (0.0%) |
| Architecture & Engineering | 12 (100.0%) | 0 (0.0%) |
| Life, Physical & Social Science | 0 (0.0%) | 0 (0.0%) |
| Community & Social Service | 8 (15.7%) | 43 (84.3%) |
| Education, Arts & Media | 0 (0.0%) | 21 (100.0%) |
| Legal Services & Support | 4 (100.0%) | 0 (0.0%) |
| Education Instruction & Library | 4 (15.4%) | 22 (84.6%) |
| Arts, Media & Entertainment | 0 (0.0%) | 0 (0.0%) |
| Health Diagnosing & Treating | 8 (9.4%) | 77 (90.6%) |
| Health Technologists | 0 (0.0%) | 44 (100.0%) |
| Total (Category) | 80 (35.2%) | 147 (64.8%) |
| Total (Overall) | 483 (50.3%) | 477 (49.7%) |
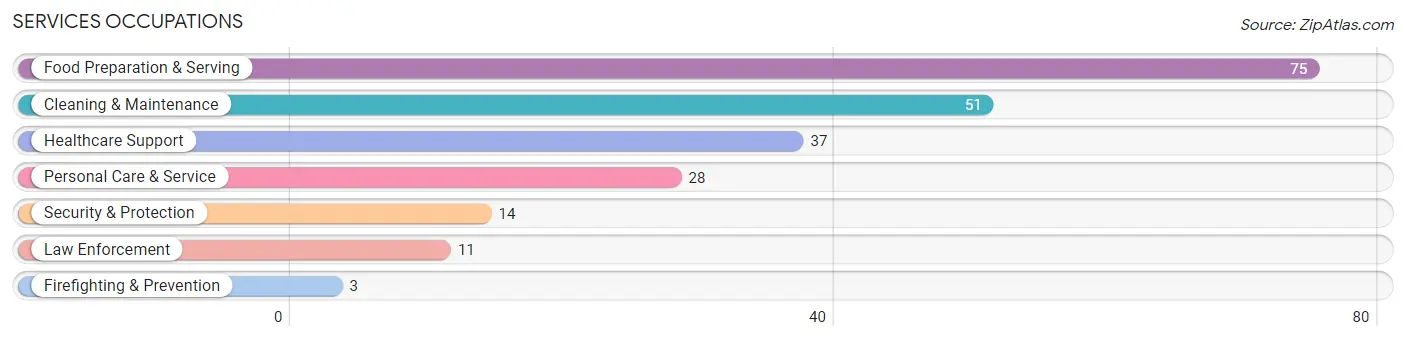
Services Occupations
The most common Services occupations in Leetonia are Food Preparation & Serving (75 | 7.8%), Cleaning & Maintenance (51 | 5.3%), Healthcare Support (37 | 3.8%), Personal Care & Service (28 | 2.9%), and Security & Protection (14 | 1.5%).
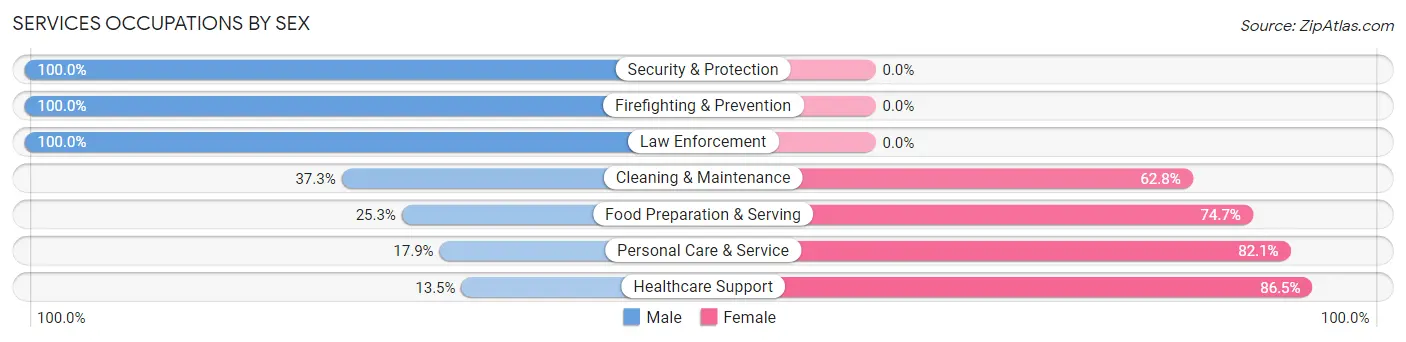
Services Occupations by Sex
Within the Services occupations in Leetonia, the most male-oriented occupations are Security & Protection (100.0%), Firefighting & Prevention (100.0%), and Law Enforcement (100.0%), while the most female-oriented occupations are Healthcare Support (86.5%), Personal Care & Service (82.1%), and Food Preparation & Serving (74.7%).
| Occupation | Male | Female |
| Healthcare Support | 5 (13.5%) | 32 (86.5%) |
| Security & Protection | 14 (100.0%) | 0 (0.0%) |
| Firefighting & Prevention | 3 (100.0%) | 0 (0.0%) |
| Law Enforcement | 11 (100.0%) | 0 (0.0%) |
| Food Preparation & Serving | 19 (25.3%) | 56 (74.7%) |
| Cleaning & Maintenance | 19 (37.2%) | 32 (62.7%) |
| Personal Care & Service | 5 (17.9%) | 23 (82.1%) |
| Total (Category) | 62 (30.2%) | 143 (69.8%) |
| Total (Overall) | 483 (50.3%) | 477 (49.7%) |
Sales and Office Occupations
The most common Sales and Office occupations in Leetonia are Sales & Related (114 | 11.9%), and Office & Administration (73 | 7.6%).
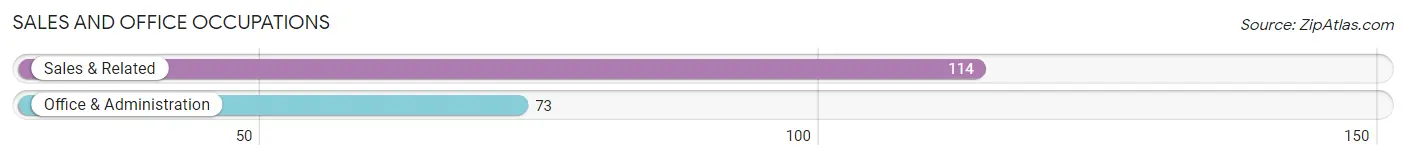
Sales and Office Occupations by Sex
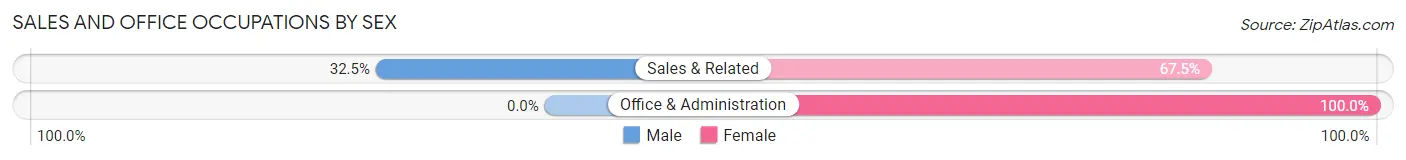
| Occupation | Male | Female |
| Sales & Related | 37 (32.5%) | 77 (67.5%) |
| Office & Administration | 0 (0.0%) | 73 (100.0%) |
| Total (Category) | 37 (19.8%) | 150 (80.2%) |
| Total (Overall) | 483 (50.3%) | 477 (49.7%) |
Natural Resources, Construction and Maintenance Occupations
The most common Natural Resources, Construction and Maintenance occupations in Leetonia are Construction & Extraction (78 | 8.1%), and Installation, Maintenance & Repair (42 | 4.4%).
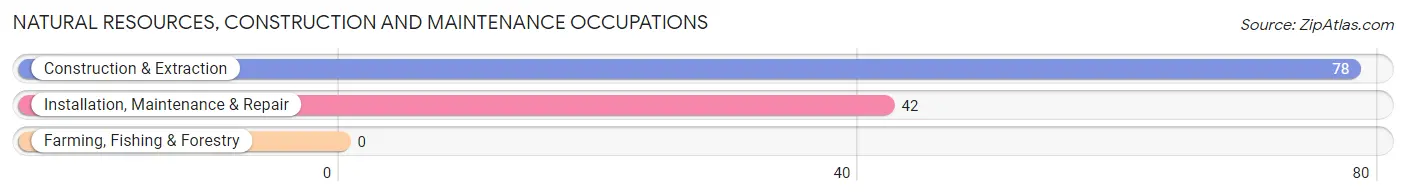
Natural Resources, Construction and Maintenance Occupations by Sex
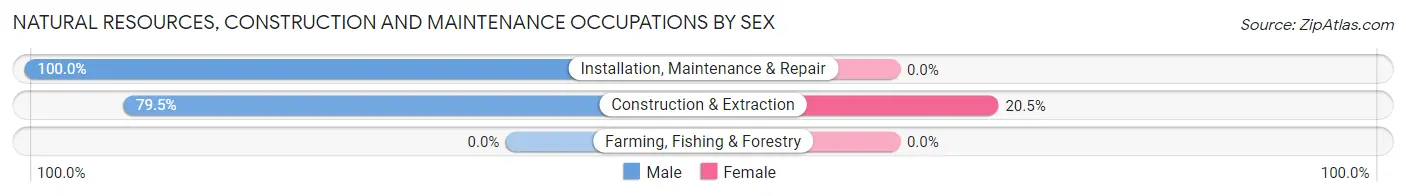
| Occupation | Male | Female |
| Farming, Fishing & Forestry | 0 (0.0%) | 0 (0.0%) |
| Construction & Extraction | 62 (79.5%) | 16 (20.5%) |
| Installation, Maintenance & Repair | 42 (100.0%) | 0 (0.0%) |
| Total (Category) | 104 (86.7%) | 16 (13.3%) |
| Total (Overall) | 483 (50.3%) | 477 (49.7%) |
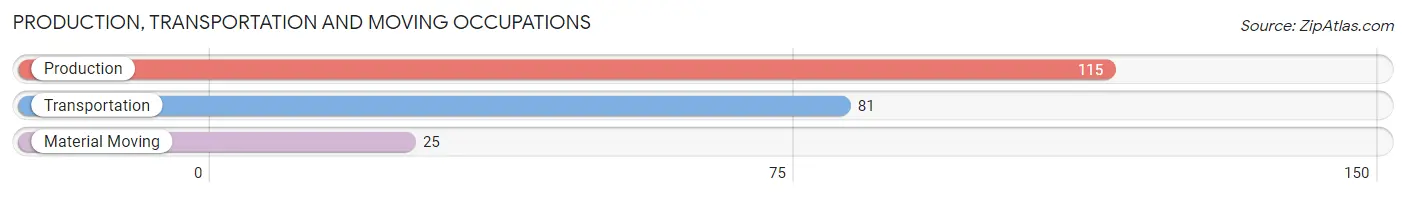
Production, Transportation and Moving Occupations
The most common Production, Transportation and Moving occupations in Leetonia are Production (115 | 12.0%), Transportation (81 | 8.4%), and Material Moving (25 | 2.6%).
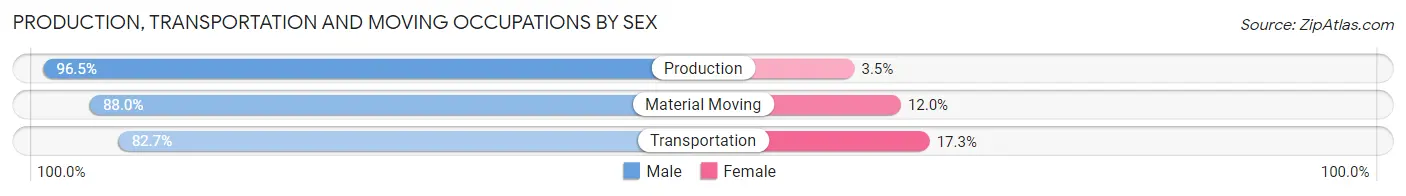
Production, Transportation and Moving Occupations by Sex
| Occupation | Male | Female |
| Production | 111 (96.5%) | 4 (3.5%) |
| Transportation | 67 (82.7%) | 14 (17.3%) |
| Material Moving | 22 (88.0%) | 3 (12.0%) |
| Total (Category) | 200 (90.5%) | 21 (9.5%) |
| Total (Overall) | 483 (50.3%) | 477 (49.7%) |
Employment Industries by Sex in Leetonia
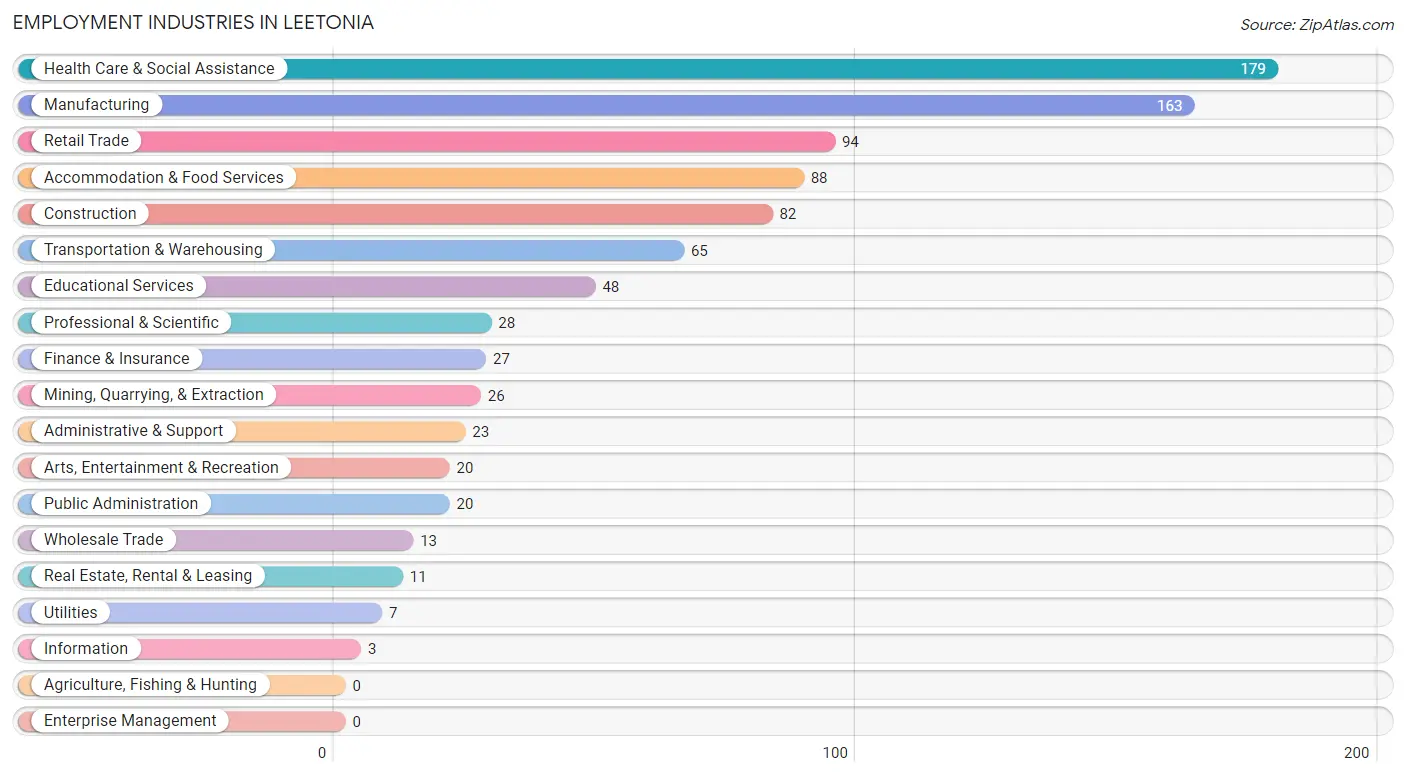
Employment Industries in Leetonia
The major employment industries in Leetonia include Health Care & Social Assistance (179 | 18.6%), Manufacturing (163 | 17.0%), Retail Trade (94 | 9.8%), Accommodation & Food Services (88 | 9.2%), and Construction (82 | 8.5%).
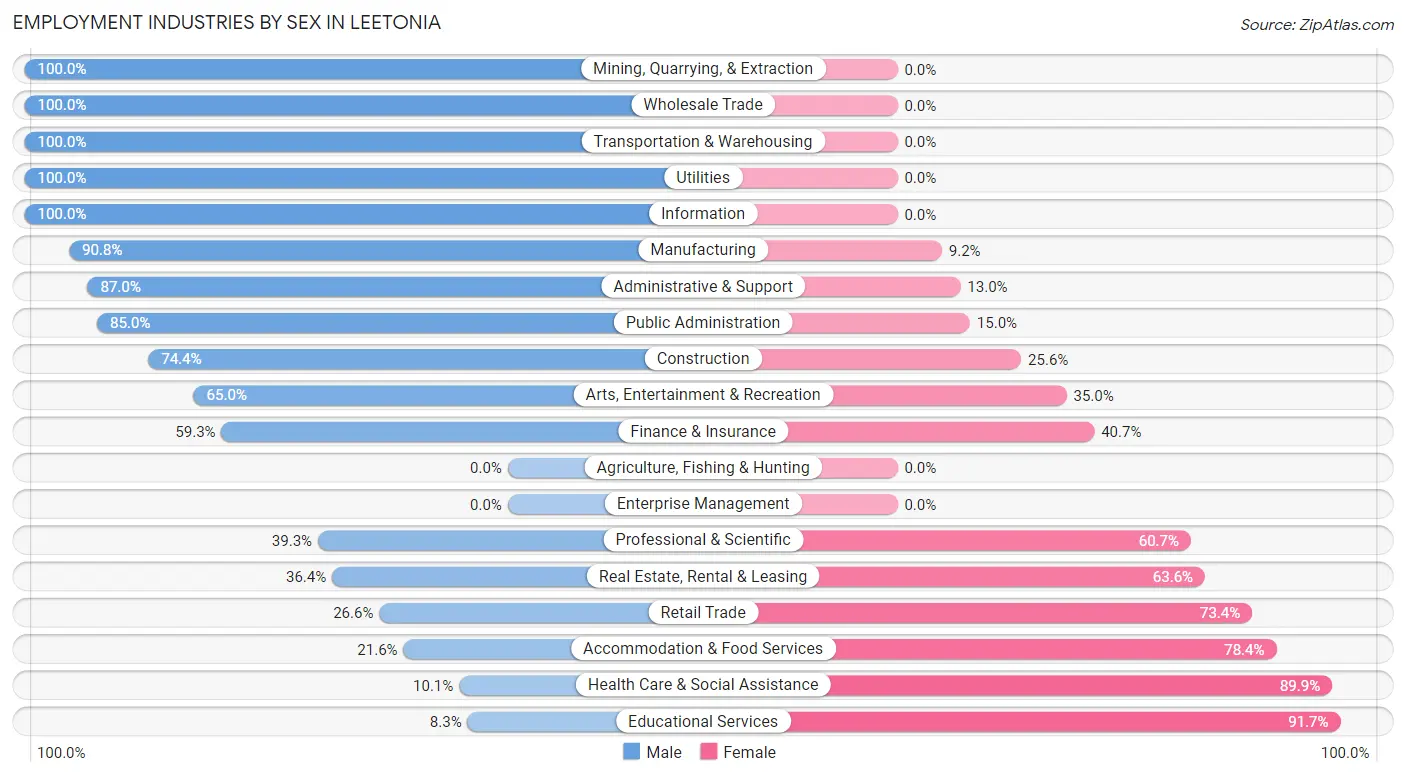
Employment Industries by Sex in Leetonia
The Leetonia industries that see more men than women are Mining, Quarrying, & Extraction (100.0%), Wholesale Trade (100.0%), and Transportation & Warehousing (100.0%), whereas the industries that tend to have a higher number of women are Educational Services (91.7%), Health Care & Social Assistance (89.9%), and Accommodation & Food Services (78.4%).
| Industry | Male | Female |
| Agriculture, Fishing & Hunting | 0 (0.0%) | 0 (0.0%) |
| Mining, Quarrying, & Extraction | 26 (100.0%) | 0 (0.0%) |
| Construction | 61 (74.4%) | 21 (25.6%) |
| Manufacturing | 148 (90.8%) | 15 (9.2%) |
| Wholesale Trade | 13 (100.0%) | 0 (0.0%) |
| Retail Trade | 25 (26.6%) | 69 (73.4%) |
| Transportation & Warehousing | 65 (100.0%) | 0 (0.0%) |
| Utilities | 7 (100.0%) | 0 (0.0%) |
| Information | 3 (100.0%) | 0 (0.0%) |
| Finance & Insurance | 16 (59.3%) | 11 (40.7%) |
| Real Estate, Rental & Leasing | 4 (36.4%) | 7 (63.6%) |
| Professional & Scientific | 11 (39.3%) | 17 (60.7%) |
| Enterprise Management | 0 (0.0%) | 0 (0.0%) |
| Administrative & Support | 20 (87.0%) | 3 (13.0%) |
| Educational Services | 4 (8.3%) | 44 (91.7%) |
| Health Care & Social Assistance | 18 (10.1%) | 161 (89.9%) |
| Arts, Entertainment & Recreation | 13 (65.0%) | 7 (35.0%) |
| Accommodation & Food Services | 19 (21.6%) | 69 (78.4%) |
| Public Administration | 17 (85.0%) | 3 (15.0%) |
| Total | 483 (50.3%) | 477 (49.7%) |
Education in Leetonia
School Enrollment in Leetonia
The most common levels of schooling among the 401 students in Leetonia are high school (151 | 37.7%), elementary school (78 | 19.5%), and middle school (76 | 19.0%).
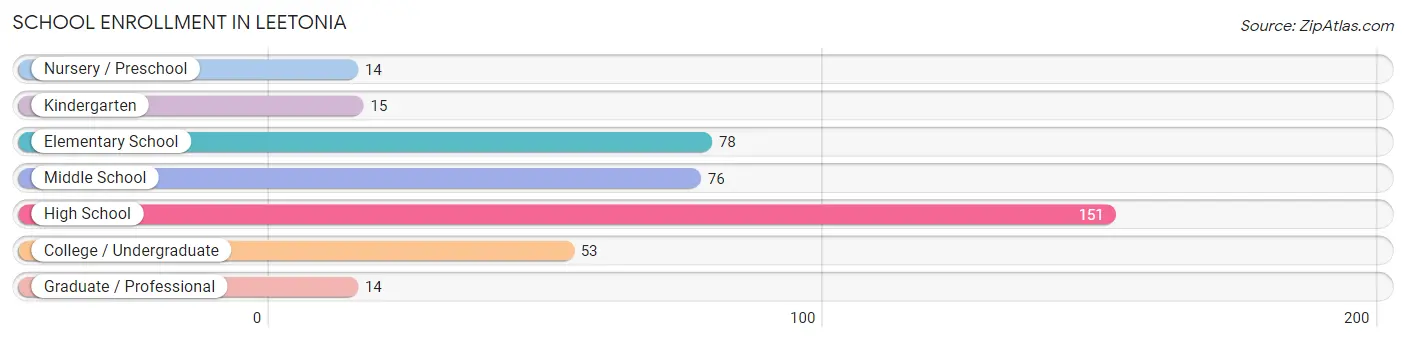
| School Level | # Students | % Students |
| Nursery / Preschool | 14 | 3.5% |
| Kindergarten | 15 | 3.7% |
| Elementary School | 78 | 19.5% |
| Middle School | 76 | 19.0% |
| High School | 151 | 37.7% |
| College / Undergraduate | 53 | 13.2% |
| Graduate / Professional | 14 | 3.5% |
| Total | 401 | 100.0% |
School Enrollment by Age by Funding Source in Leetonia
Out of a total of 401 students who are enrolled in schools in Leetonia, 19 (4.7%) attend a private institution, while the remaining 382 (95.3%) are enrolled in public schools. The age group of 10 to 14 year olds has the highest likelihood of being enrolled in private schools, with 19 (17.0% in the age bracket) enrolled. Conversely, the age group of 3 to 4 year olds has the lowest likelihood of being enrolled in a private school, with 11 (100.0% in the age bracket) attending a public institution.
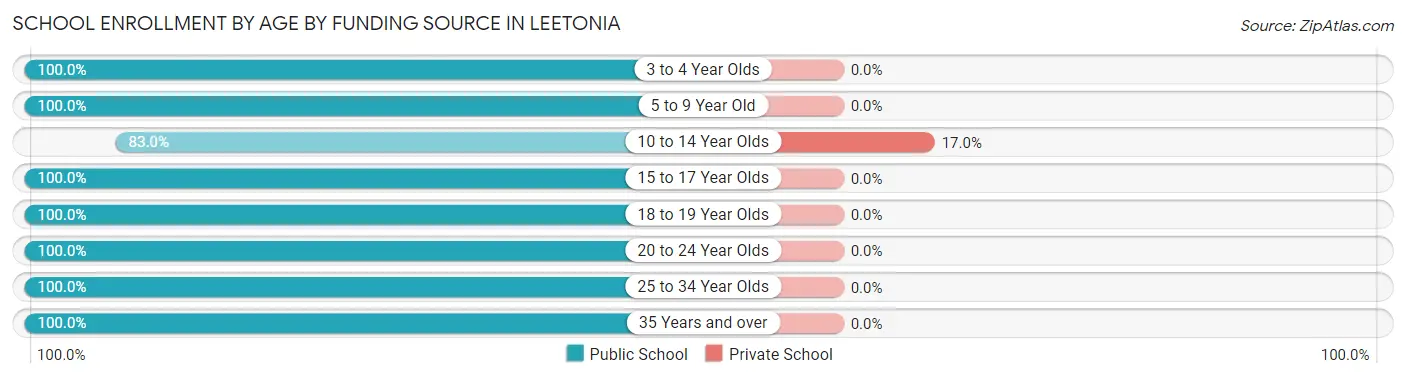
| Age Bracket | Public School | Private School |
| 3 to 4 Year Olds | 11 (100.0%) | 0 (0.0%) |
| 5 to 9 Year Old | 83 (100.0%) | 0 (0.0%) |
| 10 to 14 Year Olds | 93 (83.0%) | 19 (17.0%) |
| 15 to 17 Year Olds | 92 (100.0%) | 0 (0.0%) |
| 18 to 19 Year Olds | 59 (100.0%) | 0 (0.0%) |
| 20 to 24 Year Olds | 13 (100.0%) | 0 (0.0%) |
| 25 to 34 Year Olds | 14 (100.0%) | 0 (0.0%) |
| 35 Years and over | 17 (100.0%) | 0 (0.0%) |
| Total | 382 (95.3%) | 19 (4.7%) |
Educational Attainment by Field of Study in Leetonia
Education (65 | 30.1%), business (48 | 22.2%), science & technology (26 | 12.0%), psychology (18 | 8.3%), and social sciences (13 | 6.0%) are the most common fields of study among 216 individuals in Leetonia who have obtained a bachelor's degree or higher.
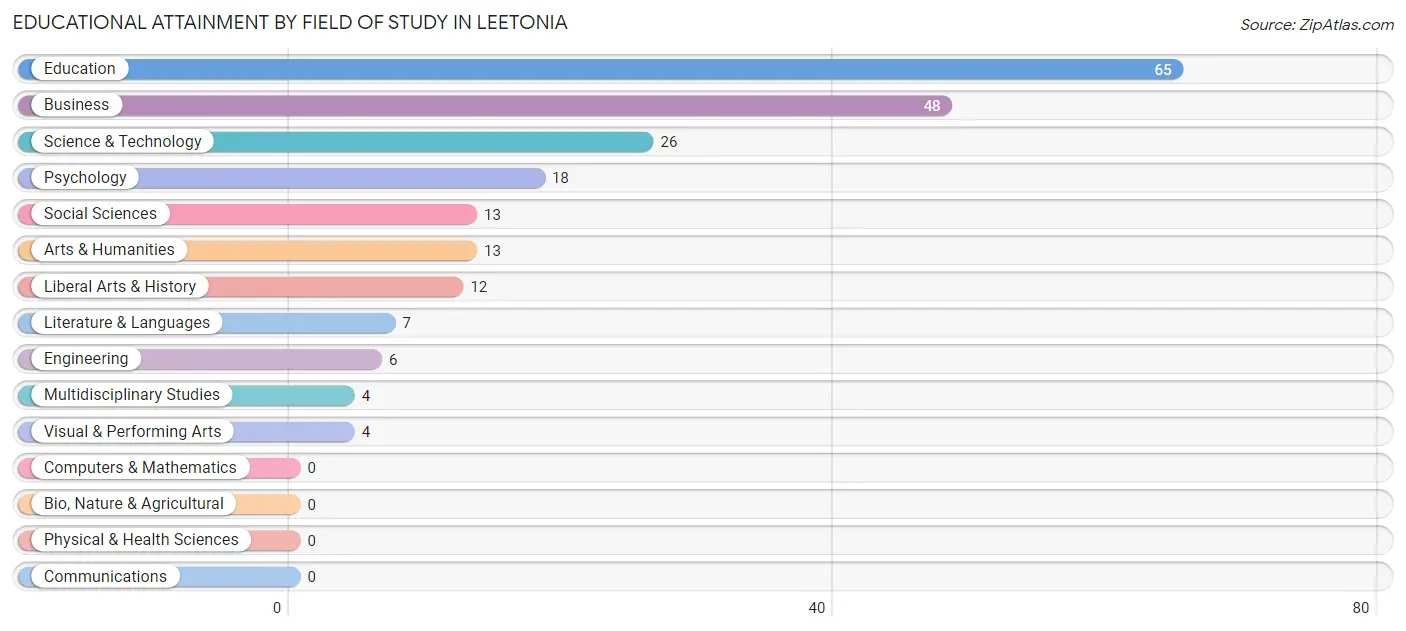
| Field of Study | # Graduates | % Graduates |
| Computers & Mathematics | 0 | 0.0% |
| Bio, Nature & Agricultural | 0 | 0.0% |
| Physical & Health Sciences | 0 | 0.0% |
| Psychology | 18 | 8.3% |
| Social Sciences | 13 | 6.0% |
| Engineering | 6 | 2.8% |
| Multidisciplinary Studies | 4 | 1.8% |
| Science & Technology | 26 | 12.0% |
| Business | 48 | 22.2% |
| Education | 65 | 30.1% |
| Literature & Languages | 7 | 3.2% |
| Liberal Arts & History | 12 | 5.6% |
| Visual & Performing Arts | 4 | 1.8% |
| Communications | 0 | 0.0% |
| Arts & Humanities | 13 | 6.0% |
| Total | 216 | 100.0% |
Transportation & Commute in Leetonia
Vehicle Availability by Sex in Leetonia
The most prevalent vehicle ownership categories in Leetonia are males with 2 vehicles (259, accounting for 54.1%) and females with 2 vehicles (226, making up 54.3%).
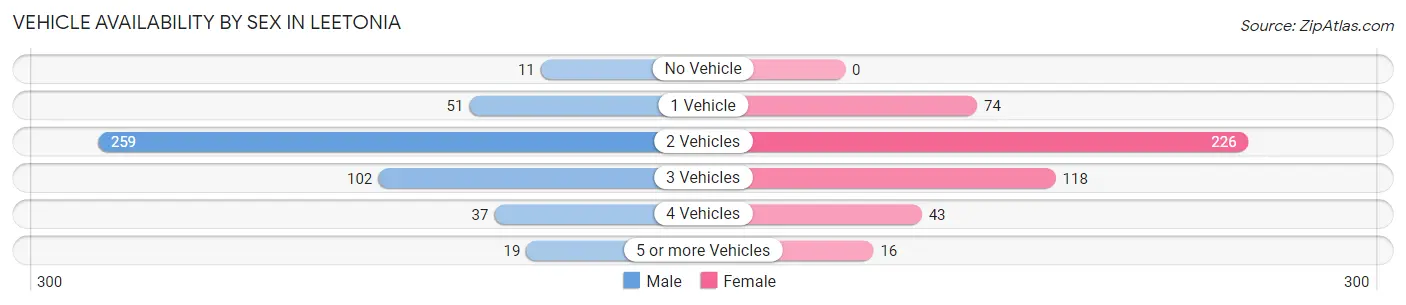
| Vehicles Available | Male | Female |
| No Vehicle | 11 (2.3%) | 0 (0.0%) |
| 1 Vehicle | 51 (10.6%) | 74 (15.5%) |
| 2 Vehicles | 259 (54.1%) | 226 (47.4%) |
| 3 Vehicles | 102 (21.3%) | 118 (24.7%) |
| 4 Vehicles | 37 (7.7%) | 43 (9.0%) |
| 5 or more Vehicles | 19 (4.0%) | 16 (3.4%) |
| Total | 479 (100.0%) | 477 (100.0%) |
Commute Time in Leetonia
The most frequently occuring commute durations in Leetonia are 10 to 14 minutes (187 commuters, 20.9%), 15 to 19 minutes (136 commuters, 15.2%), and 20 to 24 minutes (125 commuters, 14.0%).
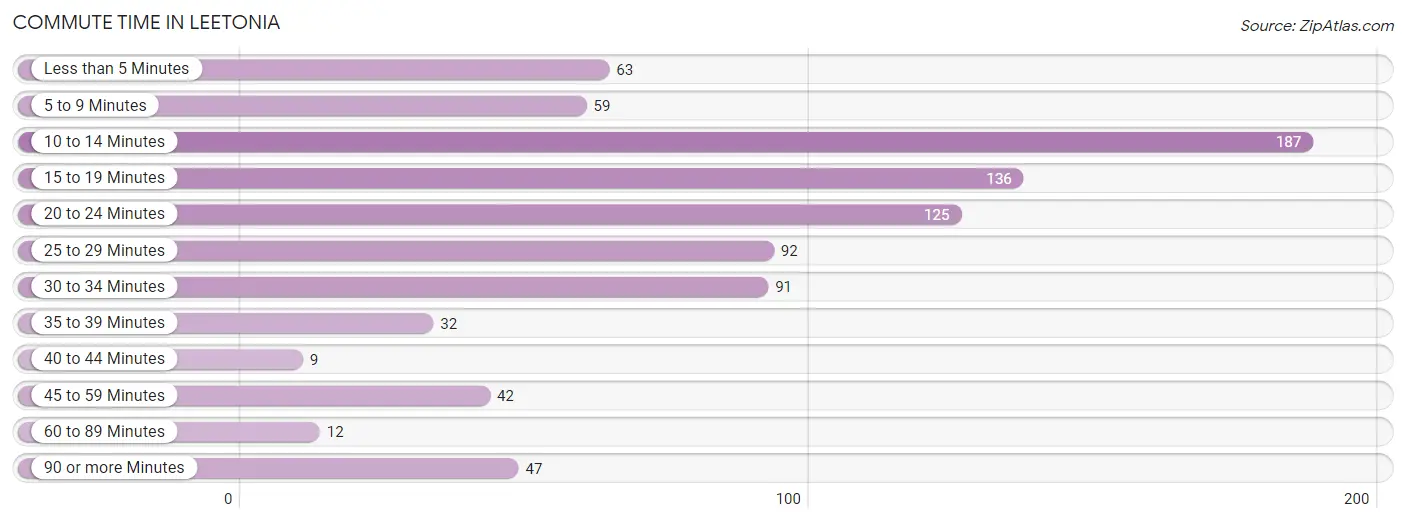
| Commute Time | # Commuters | % Commuters |
| Less than 5 Minutes | 63 | 7.0% |
| 5 to 9 Minutes | 59 | 6.6% |
| 10 to 14 Minutes | 187 | 20.9% |
| 15 to 19 Minutes | 136 | 15.2% |
| 20 to 24 Minutes | 125 | 14.0% |
| 25 to 29 Minutes | 92 | 10.3% |
| 30 to 34 Minutes | 91 | 10.2% |
| 35 to 39 Minutes | 32 | 3.6% |
| 40 to 44 Minutes | 9 | 1.0% |
| 45 to 59 Minutes | 42 | 4.7% |
| 60 to 89 Minutes | 12 | 1.3% |
| 90 or more Minutes | 47 | 5.2% |
Commute Time by Sex in Leetonia
The most common commute times in Leetonia are 20 to 24 minutes (97 commuters, 21.3%) for males and 10 to 14 minutes (128 commuters, 29.1%) for females.
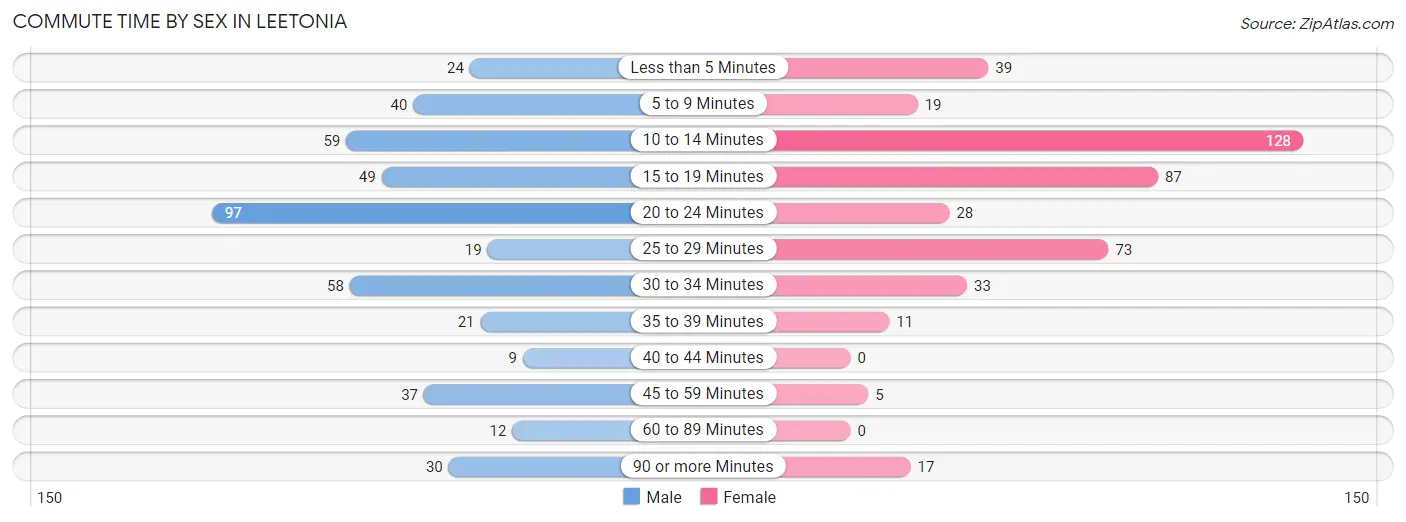
| Commute Time | Male | Female |
| Less than 5 Minutes | 24 (5.3%) | 39 (8.9%) |
| 5 to 9 Minutes | 40 (8.8%) | 19 (4.3%) |
| 10 to 14 Minutes | 59 (13.0%) | 128 (29.1%) |
| 15 to 19 Minutes | 49 (10.8%) | 87 (19.8%) |
| 20 to 24 Minutes | 97 (21.3%) | 28 (6.4%) |
| 25 to 29 Minutes | 19 (4.2%) | 73 (16.6%) |
| 30 to 34 Minutes | 58 (12.8%) | 33 (7.5%) |
| 35 to 39 Minutes | 21 (4.6%) | 11 (2.5%) |
| 40 to 44 Minutes | 9 (2.0%) | 0 (0.0%) |
| 45 to 59 Minutes | 37 (8.1%) | 5 (1.1%) |
| 60 to 89 Minutes | 12 (2.6%) | 0 (0.0%) |
| 90 or more Minutes | 30 (6.6%) | 17 (3.9%) |
Time of Departure to Work by Sex in Leetonia
The most frequent times of departure to work in Leetonia are 7:00 AM to 7:29 AM (83, 18.2%) for males and 6:30 AM to 6:59 AM (96, 21.8%) for females.
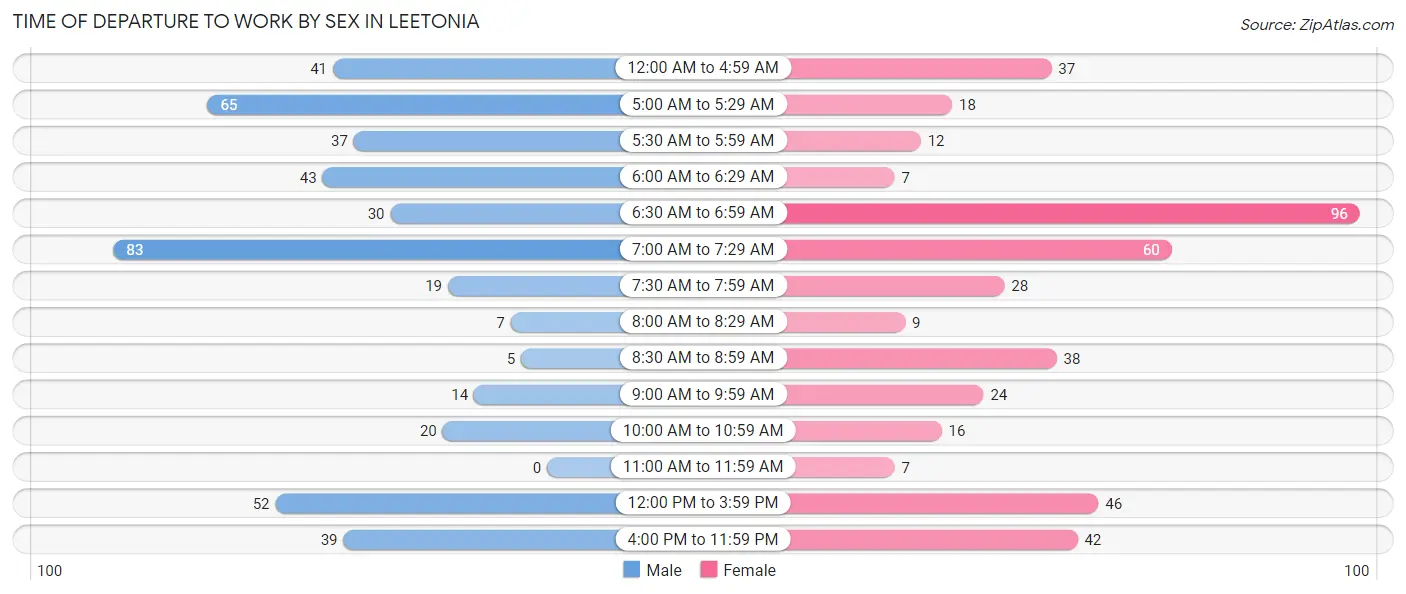
| Time of Departure | Male | Female |
| 12:00 AM to 4:59 AM | 41 (9.0%) | 37 (8.4%) |
| 5:00 AM to 5:29 AM | 65 (14.3%) | 18 (4.1%) |
| 5:30 AM to 5:59 AM | 37 (8.1%) | 12 (2.7%) |
| 6:00 AM to 6:29 AM | 43 (9.5%) | 7 (1.6%) |
| 6:30 AM to 6:59 AM | 30 (6.6%) | 96 (21.8%) |
| 7:00 AM to 7:29 AM | 83 (18.2%) | 60 (13.6%) |
| 7:30 AM to 7:59 AM | 19 (4.2%) | 28 (6.4%) |
| 8:00 AM to 8:29 AM | 7 (1.5%) | 9 (2.1%) |
| 8:30 AM to 8:59 AM | 5 (1.1%) | 38 (8.6%) |
| 9:00 AM to 9:59 AM | 14 (3.1%) | 24 (5.4%) |
| 10:00 AM to 10:59 AM | 20 (4.4%) | 16 (3.6%) |
| 11:00 AM to 11:59 AM | 0 (0.0%) | 7 (1.6%) |
| 12:00 PM to 3:59 PM | 52 (11.4%) | 46 (10.4%) |
| 4:00 PM to 11:59 PM | 39 (8.6%) | 42 (9.6%) |
| Total | 455 (100.0%) | 440 (100.0%) |
Housing Occupancy in Leetonia
Occupancy by Ownership in Leetonia
Of the total 915 dwellings in Leetonia, owner-occupied units account for 710 (77.6%), while renter-occupied units make up 205 (22.4%).
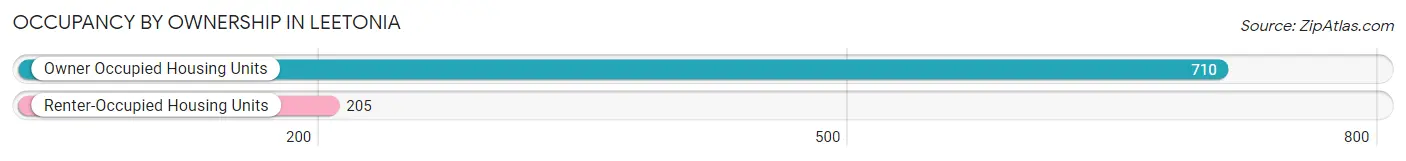
| Occupancy | # Housing Units | % Housing Units |
| Owner Occupied Housing Units | 710 | 77.6% |
| Renter-Occupied Housing Units | 205 | 22.4% |
| Total Occupied Housing Units | 915 | 100.0% |
Occupancy by Household Size in Leetonia
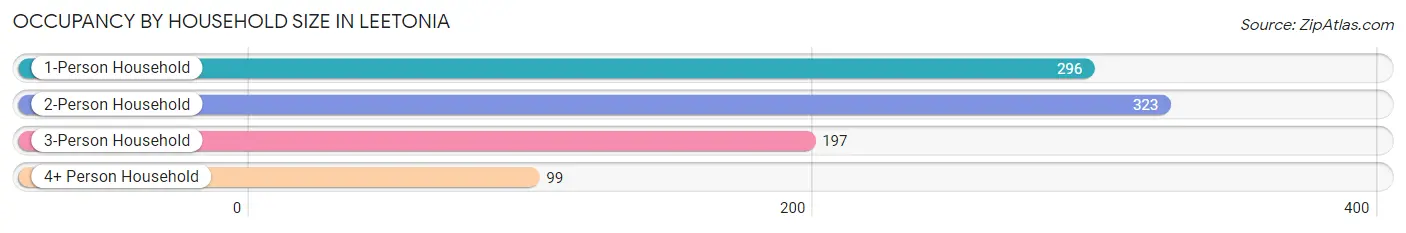
| Household Size | # Housing Units | % Housing Units |
| 1-Person Household | 296 | 32.4% |
| 2-Person Household | 323 | 35.3% |
| 3-Person Household | 197 | 21.5% |
| 4+ Person Household | 99 | 10.8% |
| Total Housing Units | 915 | 100.0% |
Occupancy by Ownership by Household Size in Leetonia
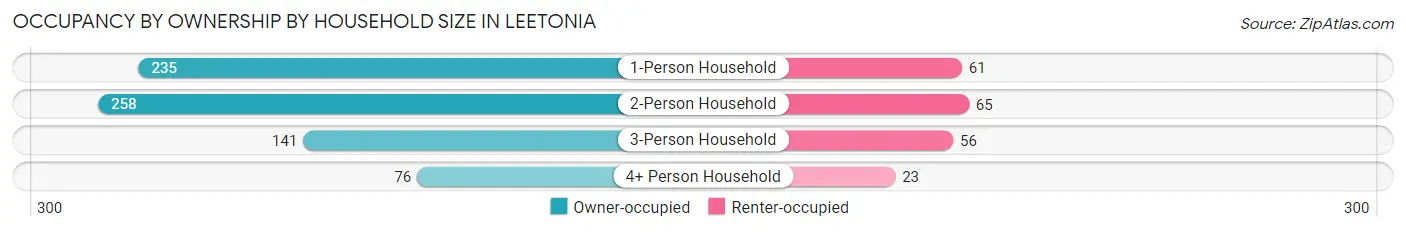
| Household Size | Owner-occupied | Renter-occupied |
| 1-Person Household | 235 (79.4%) | 61 (20.6%) |
| 2-Person Household | 258 (79.9%) | 65 (20.1%) |
| 3-Person Household | 141 (71.6%) | 56 (28.4%) |
| 4+ Person Household | 76 (76.8%) | 23 (23.2%) |
| Total Housing Units | 710 (77.6%) | 205 (22.4%) |
Occupancy by Educational Attainment in Leetonia
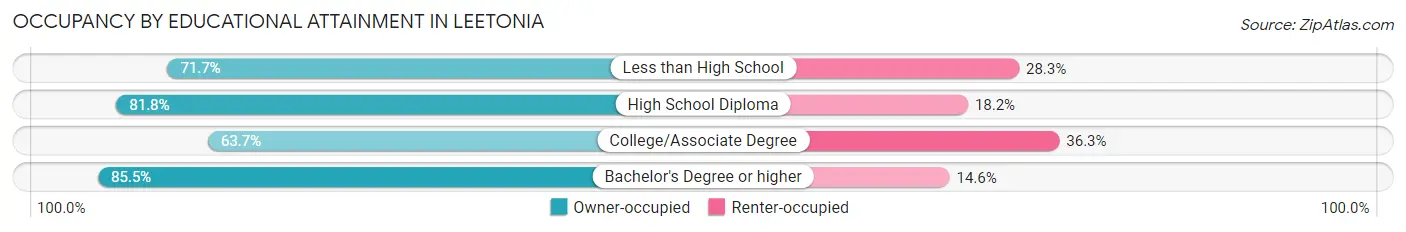
| Household Size | Owner-occupied | Renter-occupied |
| Less than High School | 43 (71.7%) | 17 (28.3%) |
| High School Diploma | 391 (81.8%) | 87 (18.2%) |
| College/Associate Degree | 135 (63.7%) | 77 (36.3%) |
| Bachelor's Degree or higher | 141 (85.5%) | 24 (14.5%) |
Occupancy by Age of Householder in Leetonia
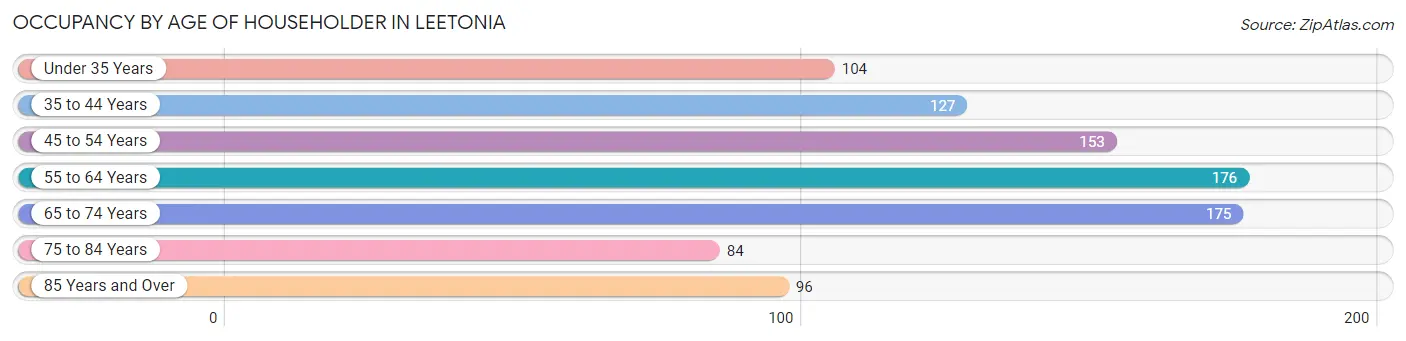
| Age Bracket | # Households | % Households |
| Under 35 Years | 104 | 11.4% |
| 35 to 44 Years | 127 | 13.9% |
| 45 to 54 Years | 153 | 16.7% |
| 55 to 64 Years | 176 | 19.2% |
| 65 to 74 Years | 175 | 19.1% |
| 75 to 84 Years | 84 | 9.2% |
| 85 Years and Over | 96 | 10.5% |
| Total | 915 | 100.0% |
Housing Finances in Leetonia
Median Income by Occupancy in Leetonia
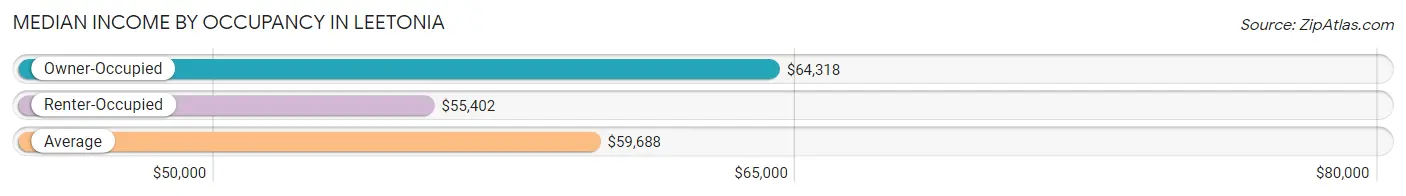
| Occupancy Type | # Households | Median Income |
| Owner-Occupied | 710 (77.6%) | $64,318 |
| Renter-Occupied | 205 (22.4%) | $55,402 |
| Average | 915 (100.0%) | $59,688 |
Occupancy by Householder Income Bracket in Leetonia
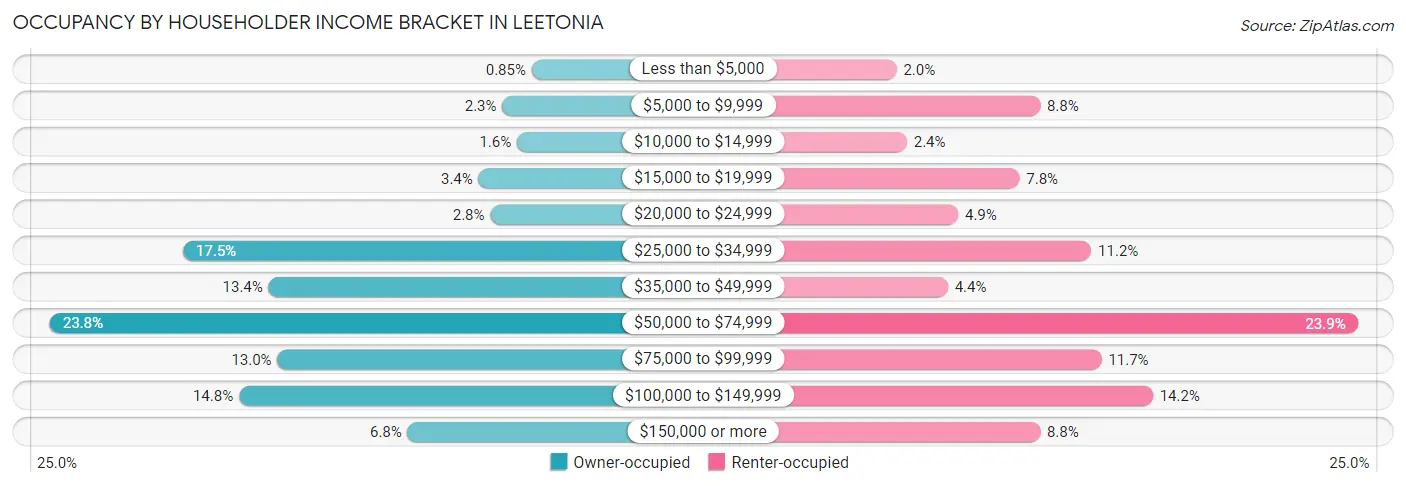
| Income Bracket | Owner-occupied | Renter-occupied |
| Less than $5,000 | 6 (0.9%) | 4 (1.9%) |
| $5,000 to $9,999 | 16 (2.2%) | 18 (8.8%) |
| $10,000 to $14,999 | 11 (1.5%) | 5 (2.4%) |
| $15,000 to $19,999 | 24 (3.4%) | 16 (7.8%) |
| $20,000 to $24,999 | 20 (2.8%) | 10 (4.9%) |
| $25,000 to $34,999 | 124 (17.5%) | 23 (11.2%) |
| $35,000 to $49,999 | 95 (13.4%) | 9 (4.4%) |
| $50,000 to $74,999 | 169 (23.8%) | 49 (23.9%) |
| $75,000 to $99,999 | 92 (13.0%) | 24 (11.7%) |
| $100,000 to $149,999 | 105 (14.8%) | 29 (14.1%) |
| $150,000 or more | 48 (6.8%) | 18 (8.8%) |
| Total | 710 (100.0%) | 205 (100.0%) |
Monthly Housing Cost Tiers in Leetonia
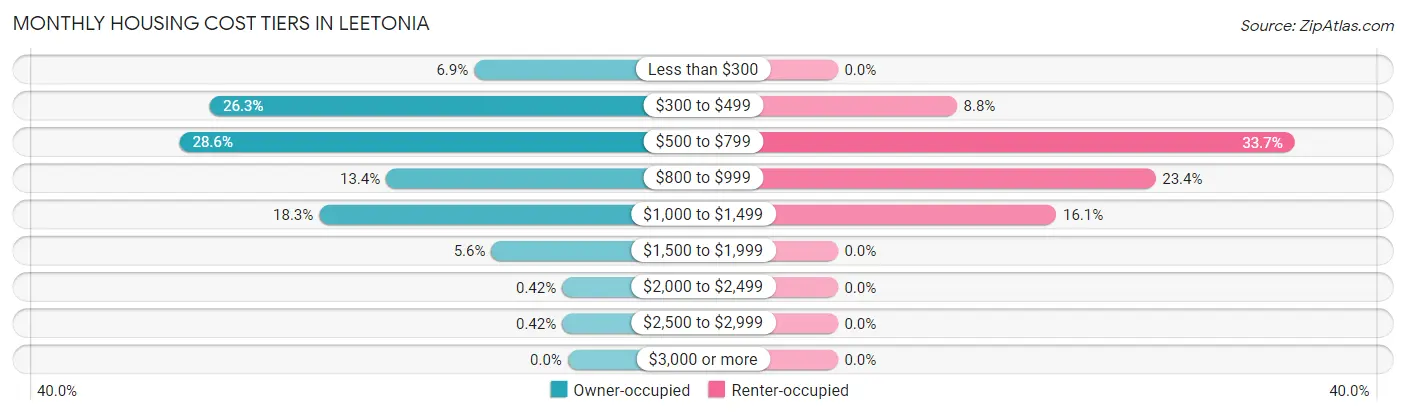
| Monthly Cost | Owner-occupied | Renter-occupied |
| Less than $300 | 49 (6.9%) | 0 (0.0%) |
| $300 to $499 | 187 (26.3%) | 18 (8.8%) |
| $500 to $799 | 203 (28.6%) | 69 (33.7%) |
| $800 to $999 | 95 (13.4%) | 48 (23.4%) |
| $1,000 to $1,499 | 130 (18.3%) | 33 (16.1%) |
| $1,500 to $1,999 | 40 (5.6%) | 0 (0.0%) |
| $2,000 to $2,499 | 3 (0.4%) | 0 (0.0%) |
| $2,500 to $2,999 | 3 (0.4%) | 0 (0.0%) |
| $3,000 or more | 0 (0.0%) | 0 (0.0%) |
| Total | 710 (100.0%) | 205 (100.0%) |
Physical Housing Characteristics in Leetonia
Housing Structures in Leetonia
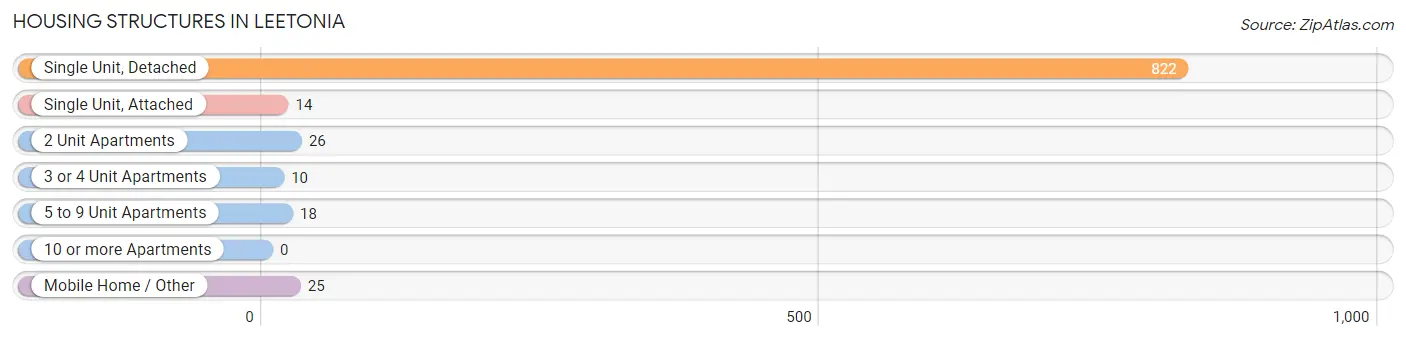
| Structure Type | # Housing Units | % Housing Units |
| Single Unit, Detached | 822 | 89.8% |
| Single Unit, Attached | 14 | 1.5% |
| 2 Unit Apartments | 26 | 2.8% |
| 3 or 4 Unit Apartments | 10 | 1.1% |
| 5 to 9 Unit Apartments | 18 | 2.0% |
| 10 or more Apartments | 0 | 0.0% |
| Mobile Home / Other | 25 | 2.7% |
| Total | 915 | 100.0% |
Housing Structures by Occupancy in Leetonia
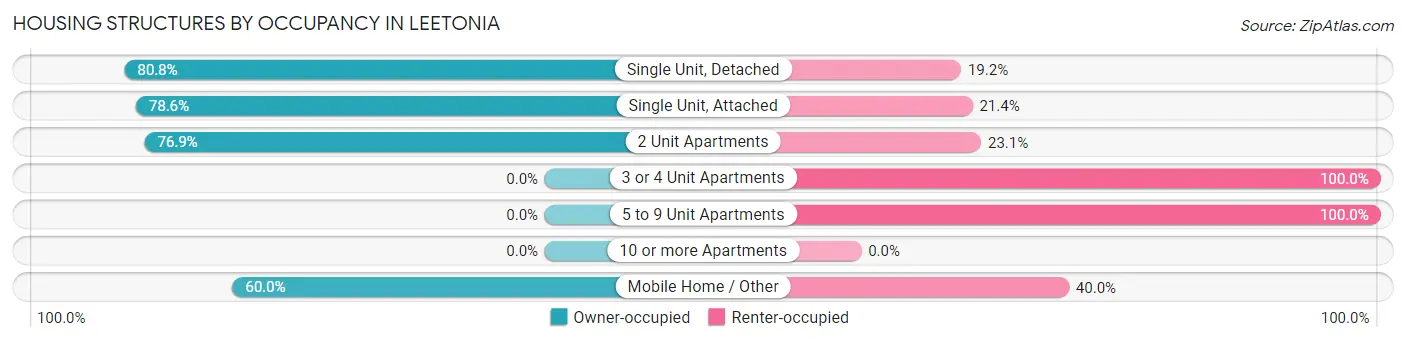
| Structure Type | Owner-occupied | Renter-occupied |
| Single Unit, Detached | 664 (80.8%) | 158 (19.2%) |
| Single Unit, Attached | 11 (78.6%) | 3 (21.4%) |
| 2 Unit Apartments | 20 (76.9%) | 6 (23.1%) |
| 3 or 4 Unit Apartments | 0 (0.0%) | 10 (100.0%) |
| 5 to 9 Unit Apartments | 0 (0.0%) | 18 (100.0%) |
| 10 or more Apartments | 0 (0.0%) | 0 (0.0%) |
| Mobile Home / Other | 15 (60.0%) | 10 (40.0%) |
| Total | 710 (77.6%) | 205 (22.4%) |
Housing Structures by Number of Rooms in Leetonia
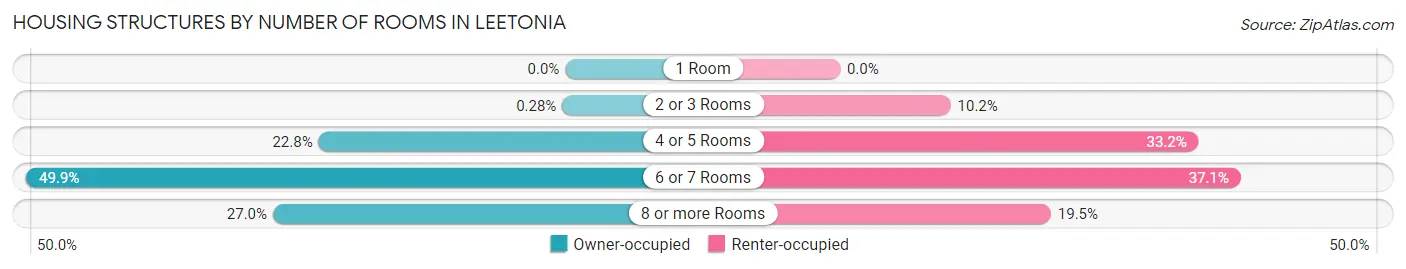
| Number of Rooms | Owner-occupied | Renter-occupied |
| 1 Room | 0 (0.0%) | 0 (0.0%) |
| 2 or 3 Rooms | 2 (0.3%) | 21 (10.2%) |
| 4 or 5 Rooms | 162 (22.8%) | 68 (33.2%) |
| 6 or 7 Rooms | 354 (49.9%) | 76 (37.1%) |
| 8 or more Rooms | 192 (27.0%) | 40 (19.5%) |
| Total | 710 (100.0%) | 205 (100.0%) |
Housing Structure by Heating Type in Leetonia
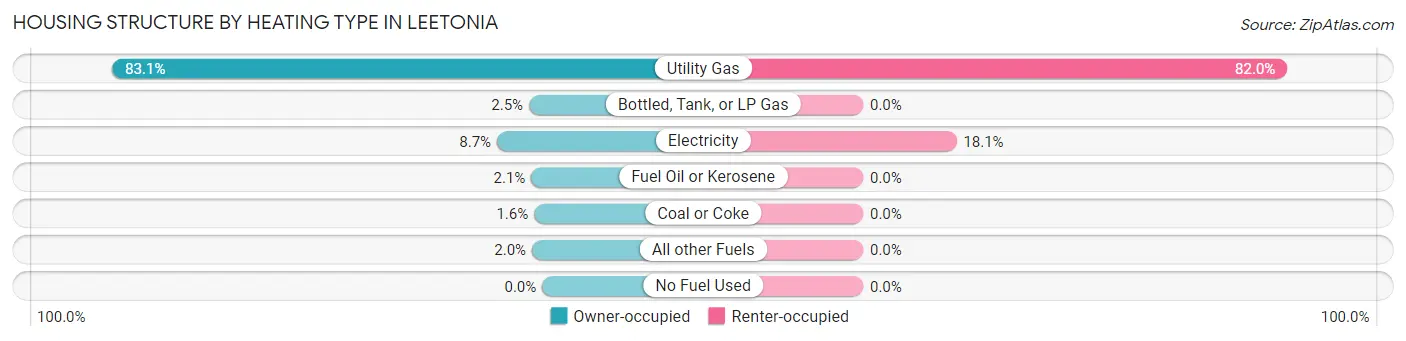
| Heating Type | Owner-occupied | Renter-occupied |
| Utility Gas | 590 (83.1%) | 168 (82.0%) |
| Bottled, Tank, or LP Gas | 18 (2.5%) | 0 (0.0%) |
| Electricity | 62 (8.7%) | 37 (18.0%) |
| Fuel Oil or Kerosene | 15 (2.1%) | 0 (0.0%) |
| Coal or Coke | 11 (1.5%) | 0 (0.0%) |
| All other Fuels | 14 (2.0%) | 0 (0.0%) |
| No Fuel Used | 0 (0.0%) | 0 (0.0%) |
| Total | 710 (100.0%) | 205 (100.0%) |
Household Vehicle Usage in Leetonia
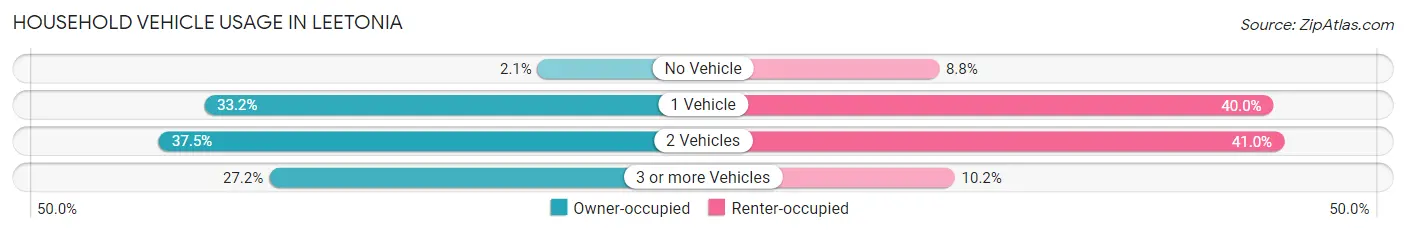
| Vehicles per Household | Owner-occupied | Renter-occupied |
| No Vehicle | 15 (2.1%) | 18 (8.8%) |
| 1 Vehicle | 236 (33.2%) | 82 (40.0%) |
| 2 Vehicles | 266 (37.5%) | 84 (41.0%) |
| 3 or more Vehicles | 193 (27.2%) | 21 (10.2%) |
| Total | 710 (100.0%) | 205 (100.0%) |
Real Estate & Mortgages in Leetonia
Real Estate and Mortgage Overview in Leetonia
| Characteristic | Without Mortgage | With Mortgage |
| Housing Units | 324 | 386 |
| Median Property Value | $87,500 | $98,800 |
| Median Household Income | $43,026 | $19 |
| Monthly Housing Costs | $369 | $0 |
| Real Estate Taxes | $1,170 | $6 |
Property Value by Mortgage Status in Leetonia
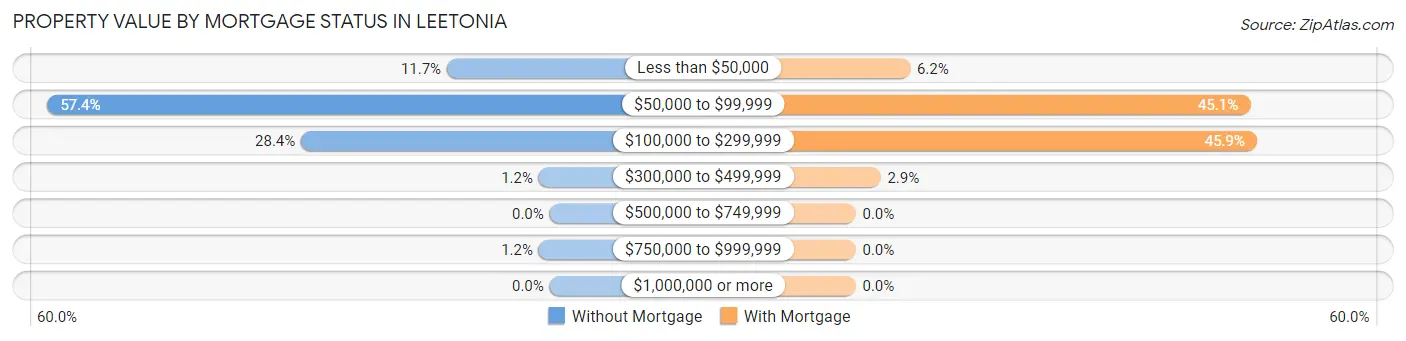
| Property Value | Without Mortgage | With Mortgage |
| Less than $50,000 | 38 (11.7%) | 24 (6.2%) |
| $50,000 to $99,999 | 186 (57.4%) | 174 (45.1%) |
| $100,000 to $299,999 | 92 (28.4%) | 177 (45.9%) |
| $300,000 to $499,999 | 4 (1.2%) | 11 (2.9%) |
| $500,000 to $749,999 | 0 (0.0%) | 0 (0.0%) |
| $750,000 to $999,999 | 4 (1.2%) | 0 (0.0%) |
| $1,000,000 or more | 0 (0.0%) | 0 (0.0%) |
| Total | 324 (100.0%) | 386 (100.0%) |
Household Income by Mortgage Status in Leetonia
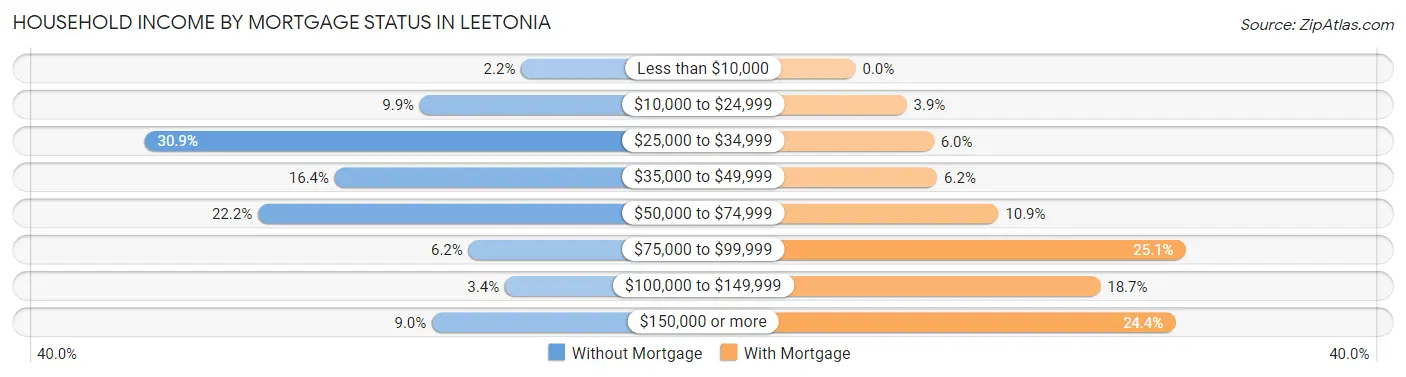
| Household Income | Without Mortgage | With Mortgage |
| Less than $10,000 | 7 (2.2%) | 0 (0.0%) |
| $10,000 to $24,999 | 32 (9.9%) | 15 (3.9%) |
| $25,000 to $34,999 | 100 (30.9%) | 23 (6.0%) |
| $35,000 to $49,999 | 53 (16.4%) | 24 (6.2%) |
| $50,000 to $74,999 | 72 (22.2%) | 42 (10.9%) |
| $75,000 to $99,999 | 20 (6.2%) | 97 (25.1%) |
| $100,000 to $149,999 | 11 (3.4%) | 72 (18.6%) |
| $150,000 or more | 29 (8.9%) | 94 (24.3%) |
| Total | 324 (100.0%) | 386 (100.0%) |
Property Value to Household Income Ratio in Leetonia
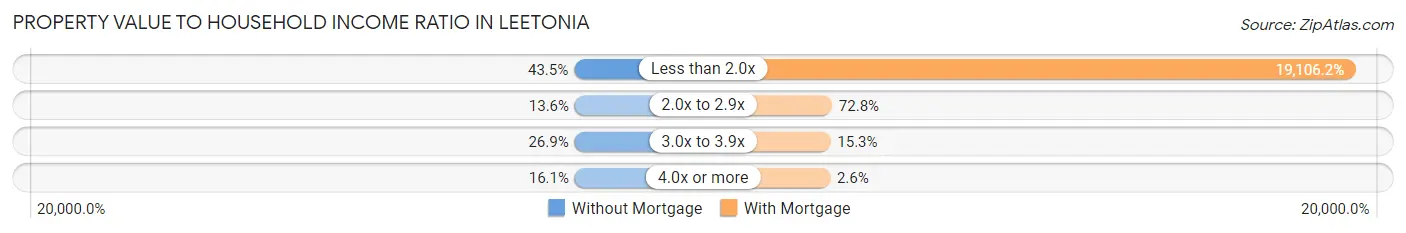
| Value-to-Income Ratio | Without Mortgage | With Mortgage |
| Less than 2.0x | 141 (43.5%) | 73,750 (19,106.2%) |
| 2.0x to 2.9x | 44 (13.6%) | 281 (72.8%) |
| 3.0x to 3.9x | 87 (26.9%) | 59 (15.3%) |
| 4.0x or more | 52 (16.1%) | 10 (2.6%) |
| Total | 324 (100.0%) | 386 (100.0%) |
Real Estate Taxes by Mortgage Status in Leetonia
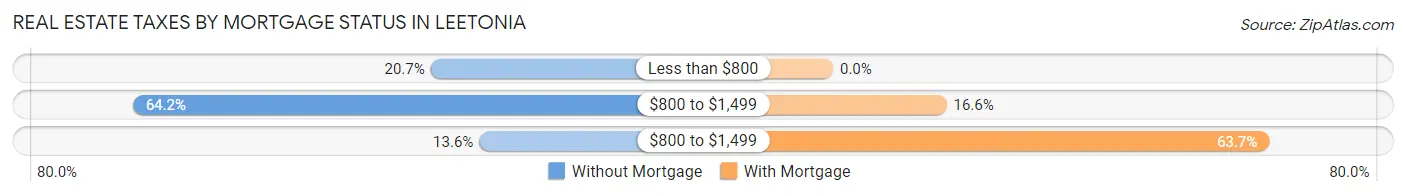
| Property Taxes | Without Mortgage | With Mortgage |
| Less than $800 | 67 (20.7%) | 0 (0.0%) |
| $800 to $1,499 | 208 (64.2%) | 64 (16.6%) |
| $800 to $1,499 | 44 (13.6%) | 246 (63.7%) |
| Total | 324 (100.0%) | 386 (100.0%) |
Health & Disability in Leetonia
Health Insurance Coverage by Age in Leetonia
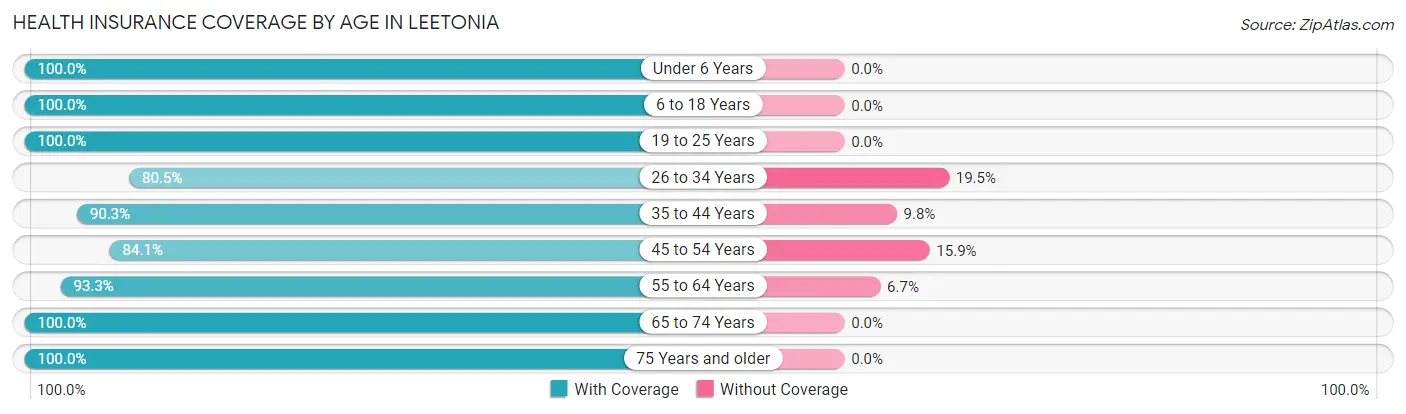
| Age Bracket | With Coverage | Without Coverage |
| Under 6 Years | 104 (100.0%) | 0 (0.0%) |
| 6 to 18 Years | 315 (100.0%) | 0 (0.0%) |
| 19 to 25 Years | 152 (100.0%) | 0 (0.0%) |
| 26 to 34 Years | 157 (80.5%) | 38 (19.5%) |
| 35 to 44 Years | 213 (90.2%) | 23 (9.8%) |
| 45 to 54 Years | 212 (84.1%) | 40 (15.9%) |
| 55 to 64 Years | 265 (93.3%) | 19 (6.7%) |
| 65 to 74 Years | 309 (100.0%) | 0 (0.0%) |
| 75 Years and older | 228 (100.0%) | 0 (0.0%) |
| Total | 1,955 (94.2%) | 120 (5.8%) |
Health Insurance Coverage by Citizenship Status in Leetonia
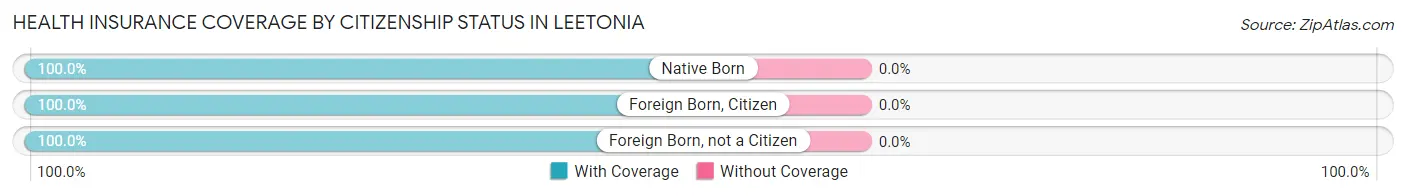
| Citizenship Status | With Coverage | Without Coverage |
| Native Born | 104 (100.0%) | 0 (0.0%) |
| Foreign Born, Citizen | 315 (100.0%) | 0 (0.0%) |
| Foreign Born, not a Citizen | 152 (100.0%) | 0 (0.0%) |
Health Insurance Coverage by Household Income in Leetonia
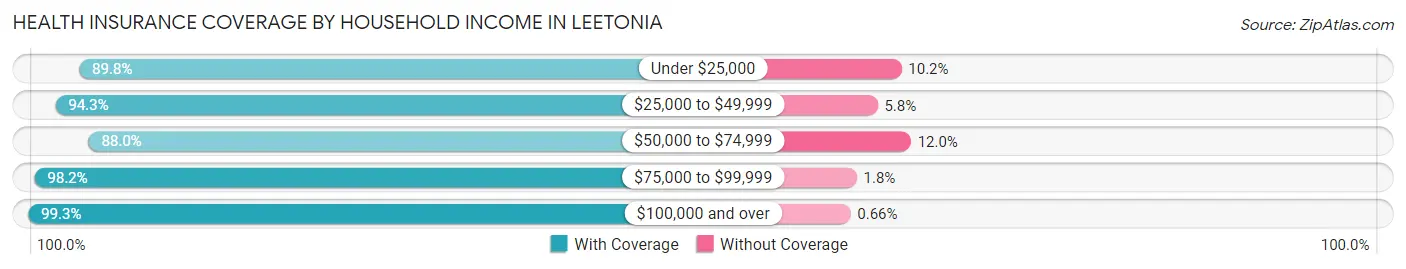
| Household Income | With Coverage | Without Coverage |
| Under $25,000 | 202 (89.8%) | 23 (10.2%) |
| $25,000 to $49,999 | 426 (94.3%) | 26 (5.8%) |
| $50,000 to $74,999 | 456 (88.0%) | 62 (12.0%) |
| $75,000 to $99,999 | 267 (98.2%) | 5 (1.8%) |
| $100,000 and over | 604 (99.3%) | 4 (0.7%) |
Public vs Private Health Insurance Coverage by Age in Leetonia
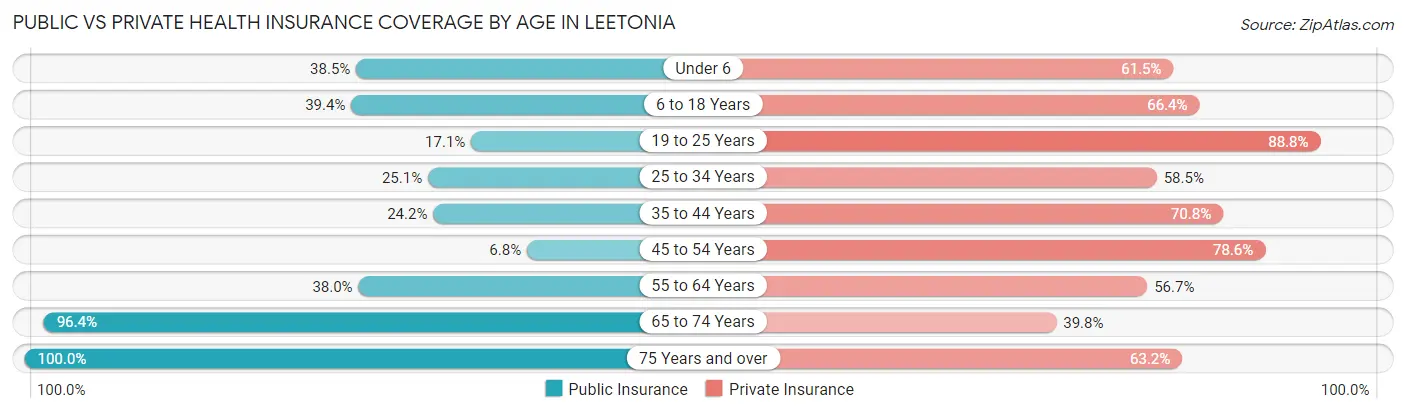
| Age Bracket | Public Insurance | Private Insurance |
| Under 6 | 40 (38.5%) | 64 (61.5%) |
| 6 to 18 Years | 124 (39.4%) | 209 (66.3%) |
| 19 to 25 Years | 26 (17.1%) | 135 (88.8%) |
| 25 to 34 Years | 49 (25.1%) | 114 (58.5%) |
| 35 to 44 Years | 57 (24.1%) | 167 (70.8%) |
| 45 to 54 Years | 17 (6.8%) | 198 (78.6%) |
| 55 to 64 Years | 108 (38.0%) | 161 (56.7%) |
| 65 to 74 Years | 298 (96.4%) | 123 (39.8%) |
| 75 Years and over | 228 (100.0%) | 144 (63.2%) |
| Total | 947 (45.6%) | 1,315 (63.4%) |
Disability Status by Sex by Age in Leetonia
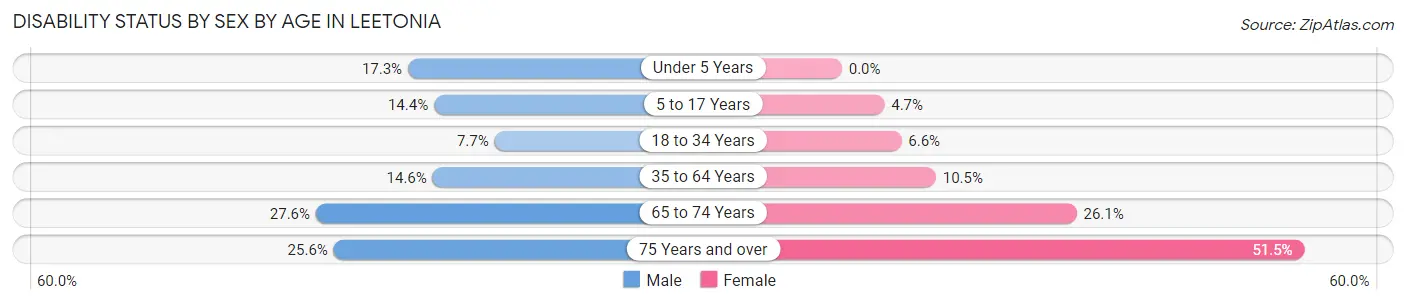
| Age Bracket | Male | Female |
| Under 5 Years | 9 (17.3%) | 0 (0.0%) |
| 5 to 17 Years | 17 (14.4%) | 8 (4.7%) |
| 18 to 34 Years | 16 (7.7%) | 12 (6.6%) |
| 35 to 64 Years | 54 (14.6%) | 42 (10.5%) |
| 65 to 74 Years | 43 (27.6%) | 40 (26.1%) |
| 75 Years and over | 33 (25.6%) | 51 (51.5%) |
Disability Class by Sex by Age in Leetonia
Disability Class: Hearing Difficulty
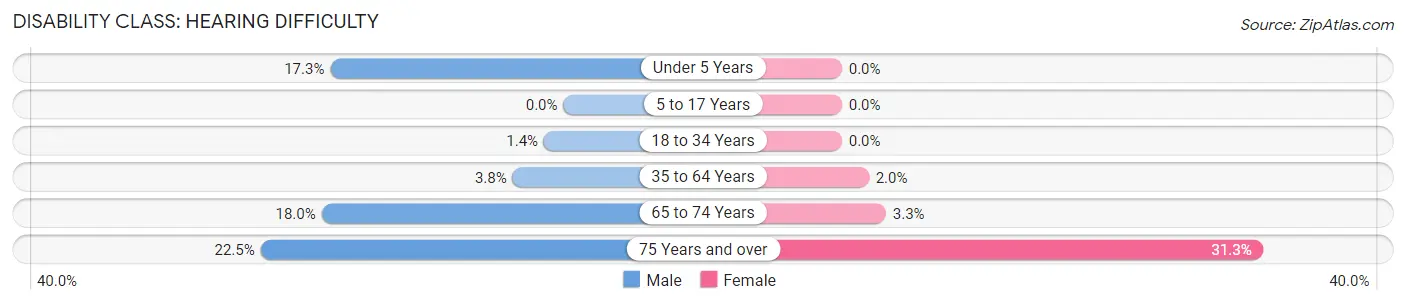
| Age Bracket | Male | Female |
| Under 5 Years | 9 (17.3%) | 0 (0.0%) |
| 5 to 17 Years | 0 (0.0%) | 0 (0.0%) |
| 18 to 34 Years | 3 (1.4%) | 0 (0.0%) |
| 35 to 64 Years | 14 (3.8%) | 8 (2.0%) |
| 65 to 74 Years | 28 (17.9%) | 5 (3.3%) |
| 75 Years and over | 29 (22.5%) | 31 (31.3%) |
Disability Class: Vision Difficulty
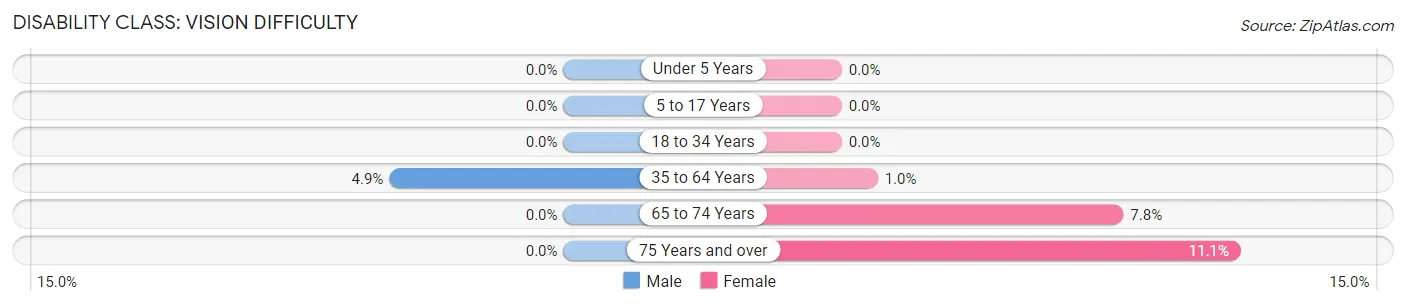
| Age Bracket | Male | Female |
| Under 5 Years | 0 (0.0%) | 0 (0.0%) |
| 5 to 17 Years | 0 (0.0%) | 0 (0.0%) |
| 18 to 34 Years | 0 (0.0%) | 0 (0.0%) |
| 35 to 64 Years | 18 (4.9%) | 4 (1.0%) |
| 65 to 74 Years | 0 (0.0%) | 12 (7.8%) |
| 75 Years and over | 0 (0.0%) | 11 (11.1%) |
Disability Class: Cognitive Difficulty
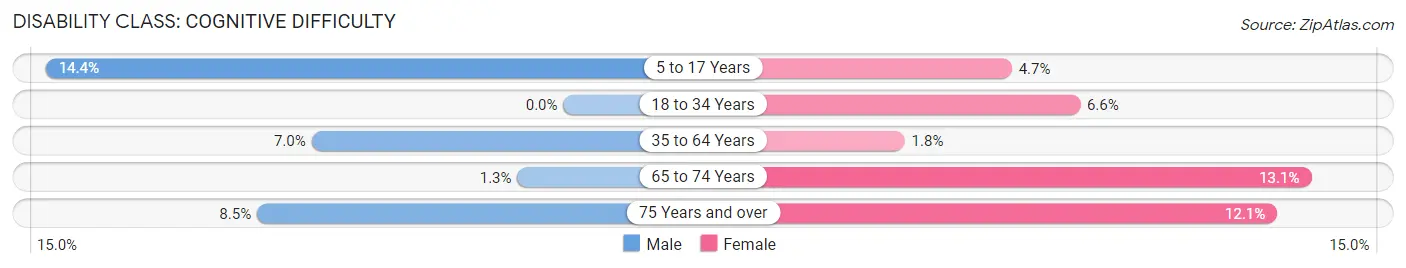
| Age Bracket | Male | Female |
| 5 to 17 Years | 17 (14.4%) | 8 (4.7%) |
| 18 to 34 Years | 0 (0.0%) | 12 (6.6%) |
| 35 to 64 Years | 26 (7.0%) | 7 (1.8%) |
| 65 to 74 Years | 2 (1.3%) | 20 (13.1%) |
| 75 Years and over | 11 (8.5%) | 12 (12.1%) |
Disability Class: Ambulatory Difficulty
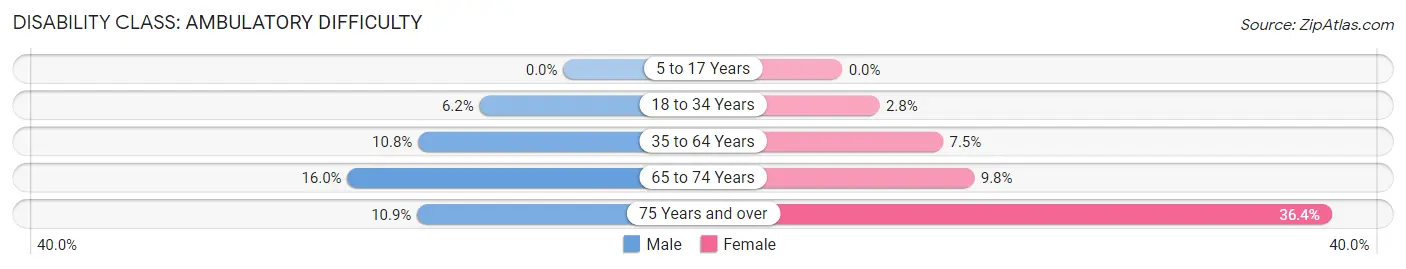
| Age Bracket | Male | Female |
| 5 to 17 Years | 0 (0.0%) | 0 (0.0%) |
| 18 to 34 Years | 13 (6.2%) | 5 (2.8%) |
| 35 to 64 Years | 40 (10.8%) | 30 (7.5%) |
| 65 to 74 Years | 25 (16.0%) | 15 (9.8%) |
| 75 Years and over | 14 (10.8%) | 36 (36.4%) |
Disability Class: Self-Care Difficulty
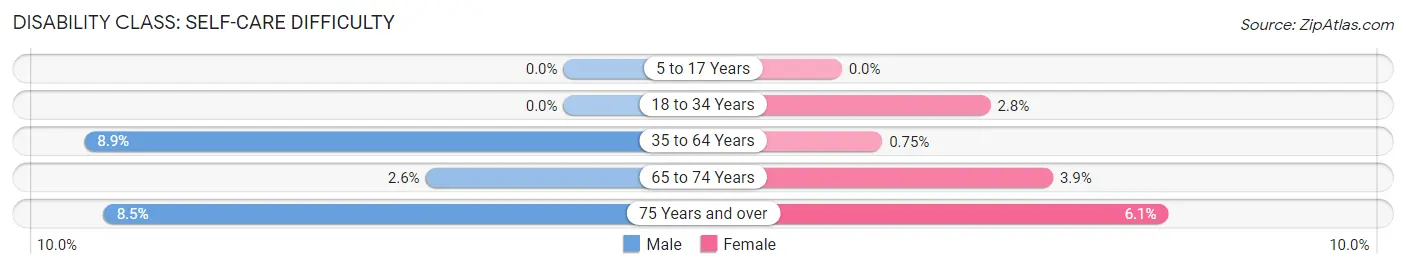
| Age Bracket | Male | Female |
| 5 to 17 Years | 0 (0.0%) | 0 (0.0%) |
| 18 to 34 Years | 0 (0.0%) | 5 (2.8%) |
| 35 to 64 Years | 33 (8.9%) | 3 (0.7%) |
| 65 to 74 Years | 4 (2.6%) | 6 (3.9%) |
| 75 Years and over | 11 (8.5%) | 6 (6.1%) |
Technology Access in Leetonia
Computing Device Access in Leetonia
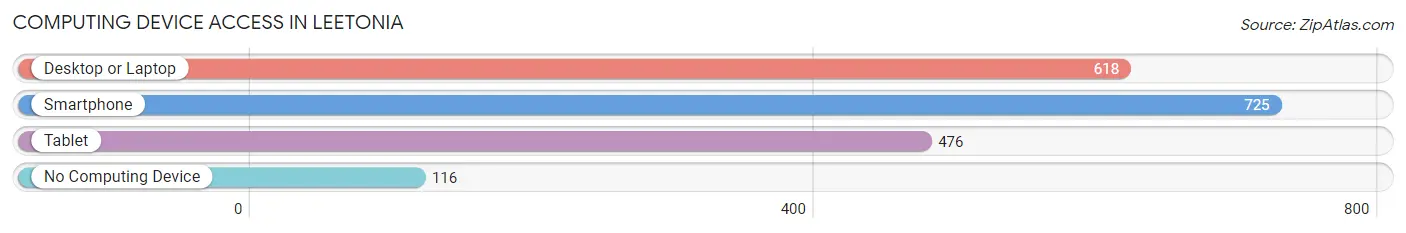
| Device Type | # Households | % Households |
| Desktop or Laptop | 618 | 67.5% |
| Smartphone | 725 | 79.2% |
| Tablet | 476 | 52.0% |
| No Computing Device | 116 | 12.7% |
| Total | 915 | 100.0% |
Internet Access in Leetonia
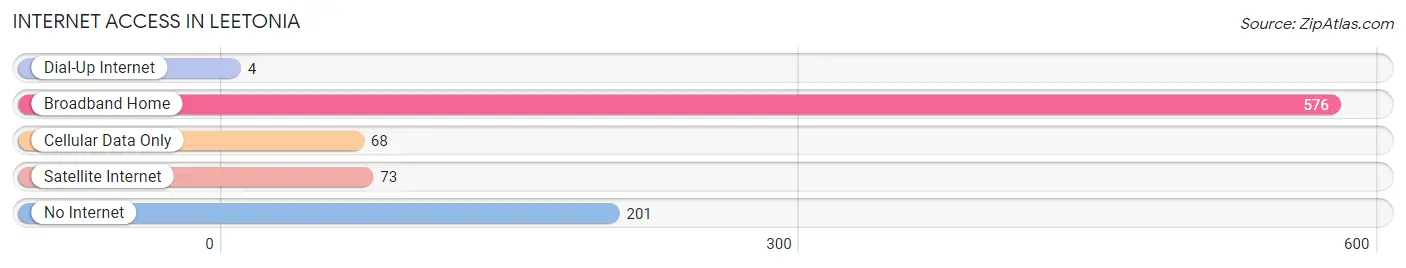
| Internet Type | # Households | % Households |
| Dial-Up Internet | 4 | 0.4% |
| Broadband Home | 576 | 62.9% |
| Cellular Data Only | 68 | 7.4% |
| Satellite Internet | 73 | 8.0% |
| No Internet | 201 | 22.0% |
| Total | 915 | 100.0% |
Leetonia Summary
Leetonia is a village located in the county of Columbiana in the state of Ohio. It is situated in the northeastern part of the state, about 25 miles southeast of Youngstown. The village has a population of 1,945 people, according to the 2010 census.
History
Leetonia was founded in 1815 by John Leet, a Revolutionary War veteran. The village was originally known as Leet’s Town, but the name was changed to Leetonia in 1837. The village was incorporated in 1867.
Leetonia was a small farming community until the late 19th century, when the railroad arrived. This brought new industry to the area, including a steel mill, a brickyard, and a sawmill. The village also became a center for coal mining.
Geography
Leetonia is located in the northeastern part of Ohio, about 25 miles southeast of Youngstown. The village is situated in the Mahoning Valley, which is part of the larger Appalachian Plateau. The village is surrounded by rolling hills and wooded areas.
The village is located on the banks of the Little Beaver Creek, which flows through the village. The creek is a tributary of the Mahoning River, which flows through the Mahoning Valley.
The village has a total area of 1.2 square miles, all of which is land. The village is located at an elevation of 1,068 feet above sea level.
Economy
Leetonia’s economy is largely based on manufacturing and agriculture. The village is home to several manufacturing companies, including a steel mill, a brickyard, and a sawmill. The village is also home to several agricultural businesses, including a dairy farm and a produce farm.
The village is also home to several small businesses including restaurants shops and services
Demographics
According to the 2010 census, Leetonia has a population of 1,945 people. The population is spread out with 49.3% male and 50.7% female. The median age is 43.7 years.
The racial makeup of the village is 97.2% White, 0.7% African American, 0.2% Native American, 0.2% Asian, 0.2% from other races, and 1.7% from two or more races. Hispanic or Latino of any race make up 0.7% of the population.
The median household income is $41,964, and the median family income is $50,000. The per capita income is $20,945. About 11.2% of the population is below the poverty line.
Common Questions
What is Per Capita Income in Leetonia?
Per Capita income in Leetonia is $30,581.
What is the Median Family Income in Leetonia?
Median Family Income in Leetonia is $70,664.
What is the Median Household income in Leetonia?
Median Household Income in Leetonia is $59,688.
What is Income or Wage Gap in Leetonia?
Income or Wage Gap in Leetonia is 41.1%.
Women in Leetonia earn 58.9 cents for every dollar earned by a man.
What is Family Income Deficit in Leetonia?
Family Income Deficit in Leetonia is $11,887.
Families that are below poverty line in Leetonia earn $11,887 less on average than the poverty threshold level.
What is Inequality or Gini Index in Leetonia?
Inequality or Gini Index in Leetonia is 0.38.
What is the Total Population of Leetonia?
Total Population of Leetonia is 2,075.
What is the Total Male Population of Leetonia?
Total Male Population of Leetonia is 1,035.
What is the Total Female Population of Leetonia?
Total Female Population of Leetonia is 1,040.
What is the Ratio of Males per 100 Females in Leetonia?
There are 99.52 Males per 100 Females in Leetonia.
What is the Ratio of Females per 100 Males in Leetonia?
There are 100.48 Females per 100 Males in Leetonia.
What is the Median Population Age in Leetonia?
Median Population Age in Leetonia is 46.6 Years.
What is the Average Family Size in Leetonia
Average Family Size in Leetonia is 2.9 People.
What is the Average Household Size in Leetonia
Average Household Size in Leetonia is 2.3 People.
How Large is the Labor Force in Leetonia?
There are 1,042 People in the Labor Forcein in Leetonia.
What is the Percentage of People in the Labor Force in Leetonia?
59.7% of People are in the Labor Force in Leetonia.
What is the Unemployment Rate in Leetonia?
Unemployment Rate in Leetonia is 7.9%.