Nome, AK Map & Demographics
Nome Map
Nome Overview
$41,722
PER CAPITA INCOME
$125,250
AVG FAMILY INCOME
$103,542
AVG HOUSEHOLD INCOME
0.2%
WAGE / INCOME GAP [ % ]
99.8¢/ $1
WAGE / INCOME GAP [ $ ]
0.38
INEQUALITY / GINI INDEX
3,710
TOTAL POPULATION
1,858
MALE POPULATION
1,852
FEMALE POPULATION
100.32
MALES / 100 FEMALES
99.68
FEMALES / 100 MALES
31.0
MEDIAN AGE
3.5
AVG FAMILY SIZE
2.9
AVG HOUSEHOLD SIZE
2,004
LABOR FORCE [ PEOPLE ]
74.4%
PERCENT IN LABOR FORCE
8.4%
UNEMPLOYMENT RATE
Nome Zip Codes
Nome Area Codes
Income in Nome
Income Overview in Nome
Per Capita Income in Nome is $41,722, while median incomes of families and households are $125,250 and $103,542 respectively.
| Characteristic | Number | Measure |
| Per Capita Income | 3,710 | $41,722 |
| Median Family Income | 747 | $125,250 |
| Mean Family Income | 747 | $137,916 |
| Median Household Income | 1,173 | $103,542 |
| Mean Household Income | 1,173 | $120,859 |
| Income Deficit | 747 | $0 |
| Wage / Income Gap (%) | 3,710 | 0.19% |
| Wage / Income Gap ($) | 3,710 | 99.81¢ per $1 |
| Gini / Inequality Index | 3,710 | 0.38 |
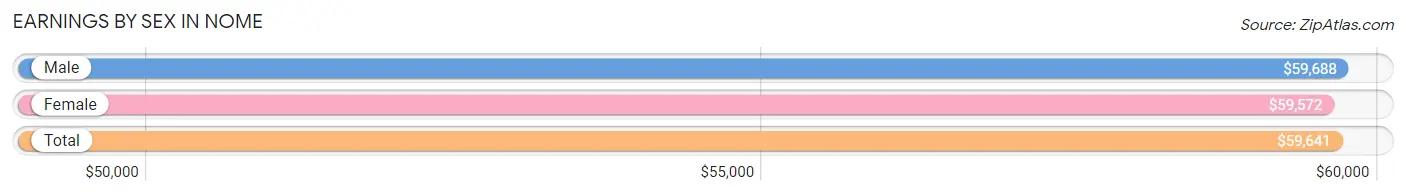
Earnings by Sex in Nome
Average Earnings in Nome are $59,641, $59,688 for men and $59,572 for women, a difference of 0.2%.
| Sex | Number | Average Earnings |
| Male | 1,102 (52.0%) | $59,688 |
| Female | 1,019 (48.0%) | $59,572 |
| Total | 2,121 (100.0%) | $59,641 |
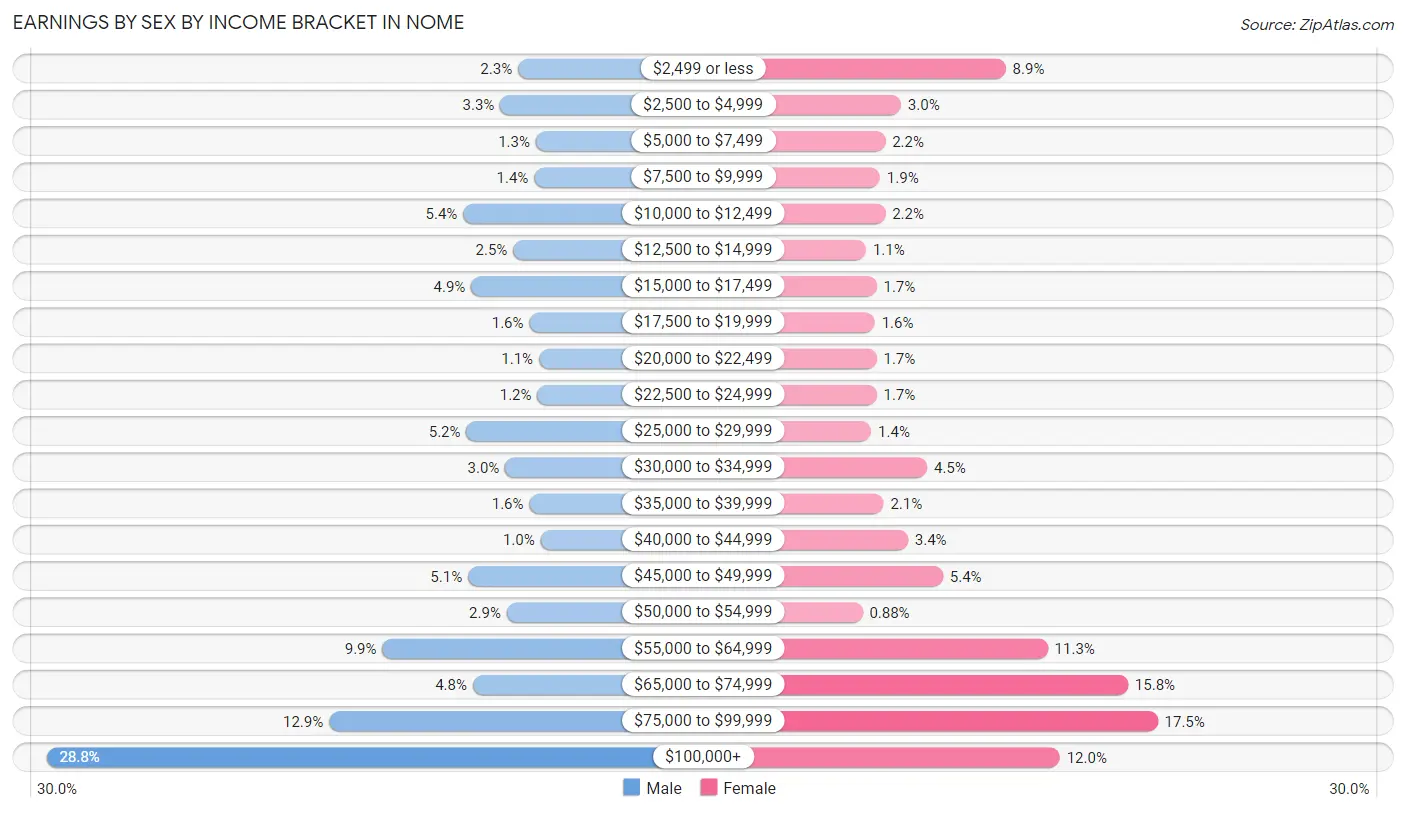
Earnings by Sex by Income Bracket in Nome
The most common earnings brackets in Nome are $100,000+ for men (317 | 28.8%) and $75,000 to $99,999 for women (178 | 17.5%).
| Income | Male | Female |
| $2,499 or less | 25 (2.3%) | 91 (8.9%) |
| $2,500 to $4,999 | 36 (3.3%) | 31 (3.0%) |
| $5,000 to $7,499 | 14 (1.3%) | 22 (2.2%) |
| $7,500 to $9,999 | 15 (1.4%) | 19 (1.9%) |
| $10,000 to $12,499 | 59 (5.3%) | 22 (2.2%) |
| $12,500 to $14,999 | 28 (2.5%) | 11 (1.1%) |
| $15,000 to $17,499 | 54 (4.9%) | 17 (1.7%) |
| $17,500 to $19,999 | 18 (1.6%) | 16 (1.6%) |
| $20,000 to $22,499 | 12 (1.1%) | 17 (1.7%) |
| $22,500 to $24,999 | 13 (1.2%) | 17 (1.7%) |
| $25,000 to $29,999 | 57 (5.2%) | 14 (1.4%) |
| $30,000 to $34,999 | 33 (3.0%) | 46 (4.5%) |
| $35,000 to $39,999 | 18 (1.6%) | 21 (2.1%) |
| $40,000 to $44,999 | 11 (1.0%) | 35 (3.4%) |
| $45,000 to $49,999 | 56 (5.1%) | 55 (5.4%) |
| $50,000 to $54,999 | 32 (2.9%) | 9 (0.9%) |
| $55,000 to $64,999 | 109 (9.9%) | 115 (11.3%) |
| $65,000 to $74,999 | 53 (4.8%) | 161 (15.8%) |
| $75,000 to $99,999 | 142 (12.9%) | 178 (17.5%) |
| $100,000+ | 317 (28.8%) | 122 (12.0%) |
| Total | 1,102 (100.0%) | 1,019 (100.0%) |
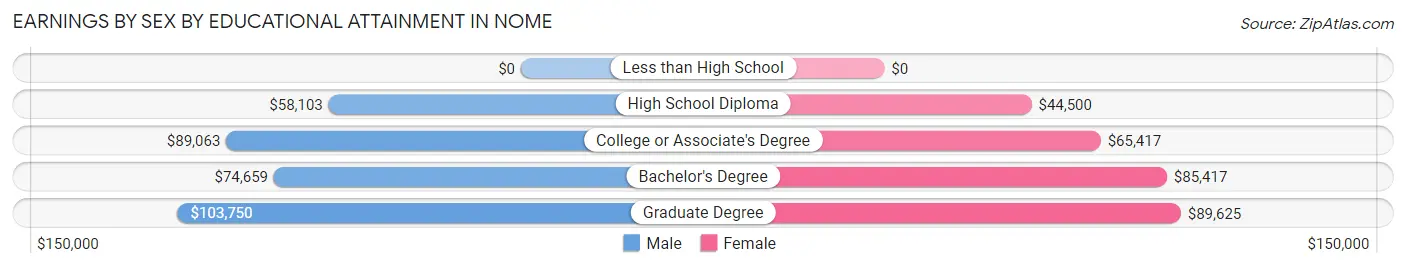
Earnings by Sex by Educational Attainment in Nome
Average earnings in Nome are $73,672 for men and $66,833 for women, a difference of 9.3%. Men with an educational attainment of graduate degree enjoy the highest average annual earnings of $103,750, while those with high school diploma education earn the least with $58,103. Women with an educational attainment of graduate degree earn the most with the average annual earnings of $89,625, while those with high school diploma education have the smallest earnings of $44,500.
| Educational Attainment | Male Income | Female Income |
| Less than High School | - | - |
| High School Diploma | $58,103 | $44,500 |
| College or Associate's Degree | $89,063 | $65,417 |
| Bachelor's Degree | $74,659 | $85,417 |
| Graduate Degree | $103,750 | $89,625 |
| Total | $73,672 | $66,833 |
Family Income in Nome
Family Income Brackets in Nome
According to the Nome family income data, there are 177 families falling into the $100,000 to $149,999 income range, which is the most common income bracket and makes up 23.7% of all families. Conversely, the $10,000 to $14,999 income bracket is the least frequent group with only 3 families (0.4%) belonging to this category.
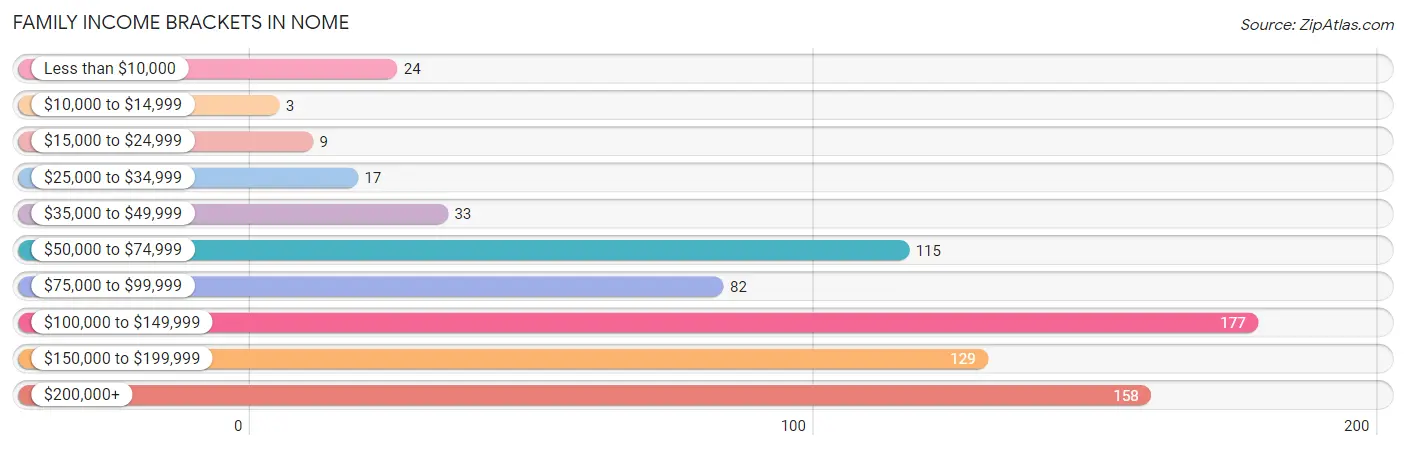
| Income Bracket | # Families | % Families |
| Less than $10,000 | 24 | 3.2% |
| $10,000 to $14,999 | 3 | 0.4% |
| $15,000 to $24,999 | 9 | 1.2% |
| $25,000 to $34,999 | 17 | 2.3% |
| $35,000 to $49,999 | 33 | 4.4% |
| $50,000 to $74,999 | 115 | 15.4% |
| $75,000 to $99,999 | 82 | 11.0% |
| $100,000 to $149,999 | 177 | 23.7% |
| $150,000 to $199,999 | 129 | 17.3% |
| $200,000+ | 158 | 21.2% |
Family Income by Famaliy Size in Nome
6-person families (63 | 8.4%) account for the highest median family income in Nome with $199,375 per family, while 2-person families (266 | 35.6%) have the highest median income of $53,125 per family member.
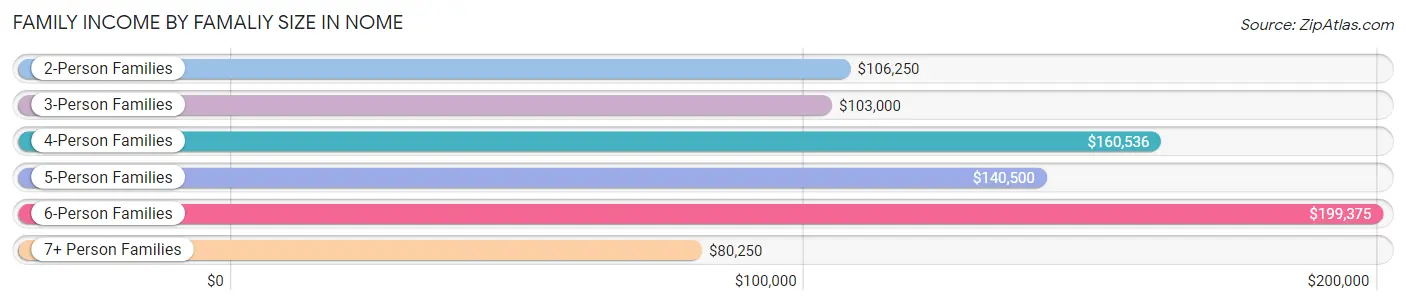
| Income Bracket | # Families | Median Income |
| 2-Person Families | 266 (35.6%) | $106,250 |
| 3-Person Families | 138 (18.5%) | $103,000 |
| 4-Person Families | 131 (17.5%) | $160,536 |
| 5-Person Families | 108 (14.5%) | $140,500 |
| 6-Person Families | 63 (8.4%) | $199,375 |
| 7+ Person Families | 41 (5.5%) | $80,250 |
| Total | 747 (100.0%) | $125,250 |
Family Income by Number of Earners in Nome
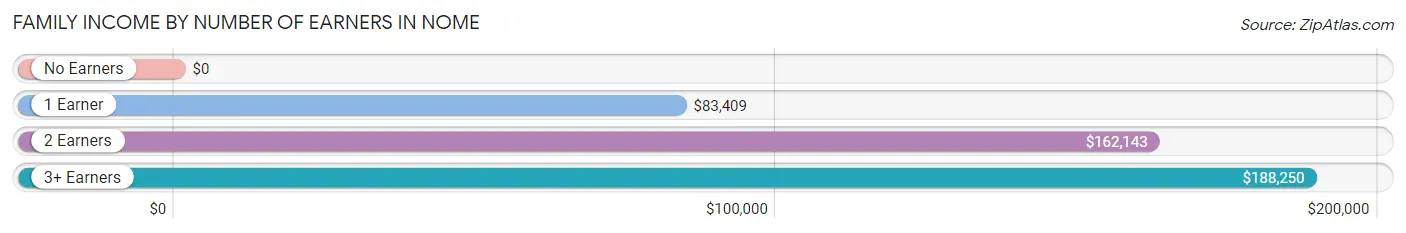
| Number of Earners | # Families | Median Income |
| No Earners | 26 (3.5%) | $0 |
| 1 Earner | 272 (36.4%) | $83,409 |
| 2 Earners | 318 (42.6%) | $162,143 |
| 3+ Earners | 131 (17.5%) | $188,250 |
| Total | 747 (100.0%) | $125,250 |
Household Income in Nome
Household Income Brackets in Nome
With 282 households falling in the category, the $100,000 to $149,999 income range is the most frequent in Nome, accounting for 24.0% of all households. In contrast, only 9 households (0.8%) fall into the $10,000 to $14,999 income bracket, making it the least populous group.
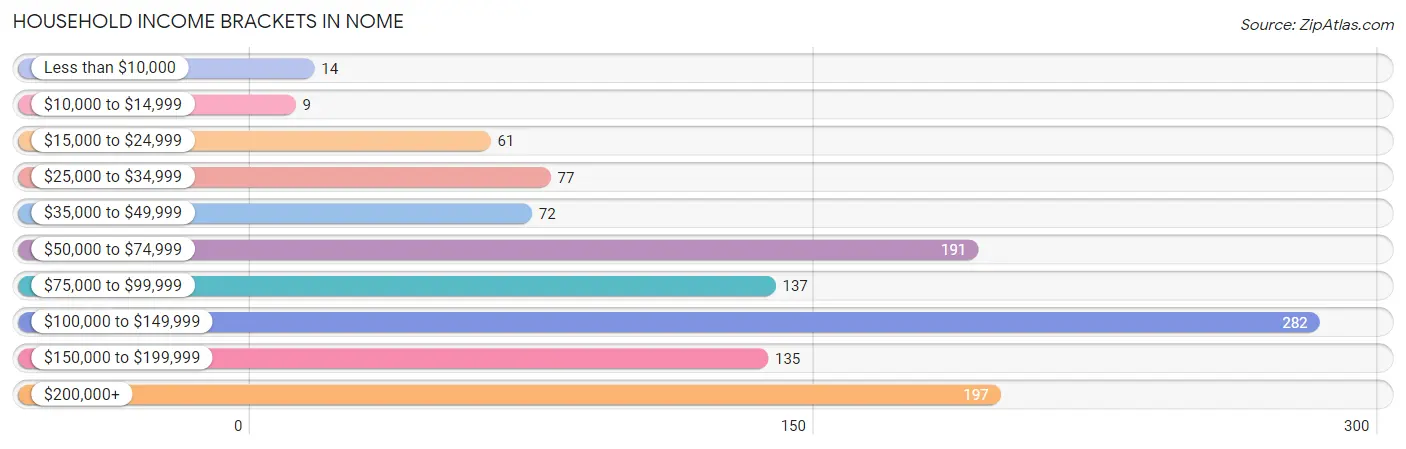
| Income Bracket | # Households | % Households |
| Less than $10,000 | 14 | 1.2% |
| $10,000 to $14,999 | 9 | 0.8% |
| $15,000 to $24,999 | 61 | 5.2% |
| $25,000 to $34,999 | 77 | 6.6% |
| $35,000 to $49,999 | 72 | 6.1% |
| $50,000 to $74,999 | 191 | 16.3% |
| $75,000 to $99,999 | 137 | 11.7% |
| $100,000 to $149,999 | 282 | 24.0% |
| $150,000 to $199,999 | 135 | 11.5% |
| $200,000+ | 197 | 16.8% |
Household Income by Householder Age in Nome
The median household income in Nome is $103,542, with the highest median household income of $122,500 found in the 45 to 64 years age bracket for the primary householder. A total of 544 households (46.4%) fall into this category. Meanwhile, the 65+ years age bracket for the primary householder has the lowest median household income of $54,464, with 145 households (12.4%) in this group.
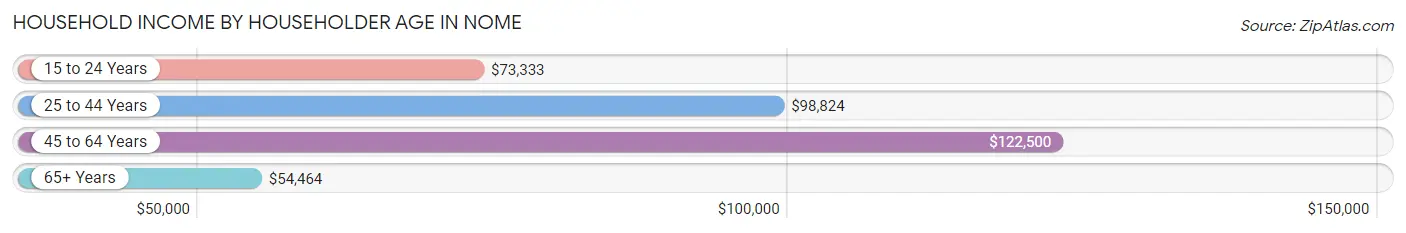
| Income Bracket | # Households | Median Income |
| 15 to 24 Years | 36 (3.1%) | $73,333 |
| 25 to 44 Years | 448 (38.2%) | $98,824 |
| 45 to 64 Years | 544 (46.4%) | $122,500 |
| 65+ Years | 145 (12.4%) | $54,464 |
| Total | 1,173 (100.0%) | $103,542 |
Poverty in Nome
Income Below Poverty by Sex and Age in Nome
With 4.5% poverty level for males and 7.6% for females among the residents of Nome, 15 year old males and 15 year old females are the most vulnerable to poverty, with 3 males (13.6%) and 5 females (19.2%) in their respective age groups living below the poverty level.
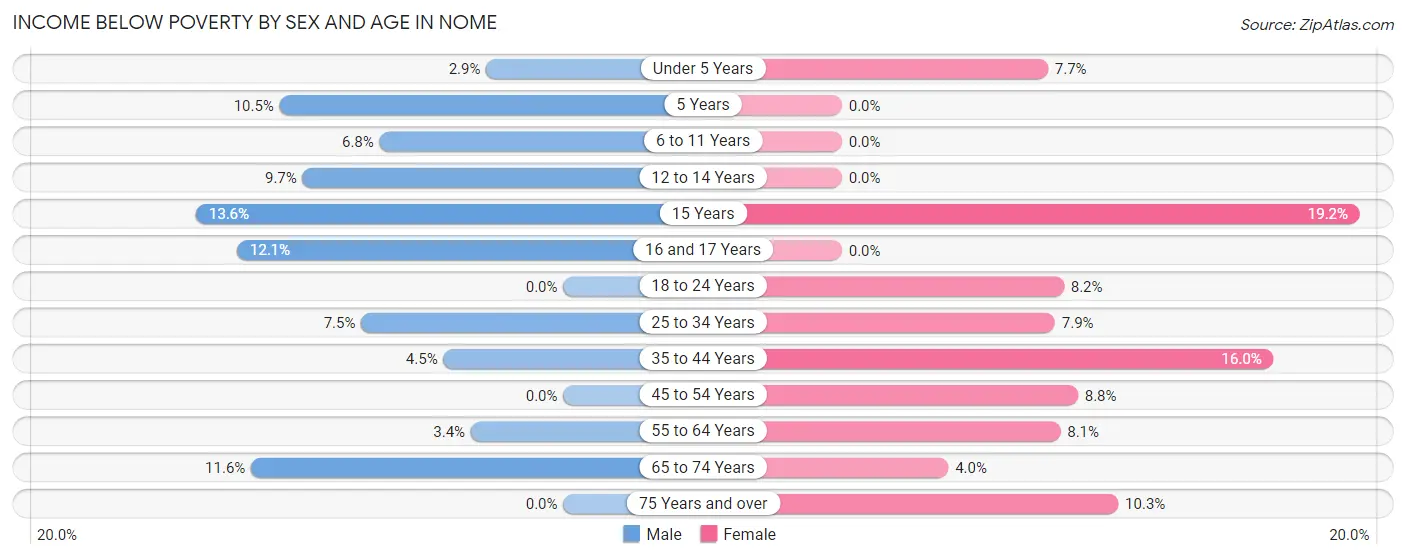
| Age Bracket | Male | Female |
| Under 5 Years | 4 (2.9%) | 14 (7.6%) |
| 5 Years | 2 (10.5%) | 0 (0.0%) |
| 6 to 11 Years | 12 (6.8%) | 0 (0.0%) |
| 12 to 14 Years | 9 (9.7%) | 0 (0.0%) |
| 15 Years | 3 (13.6%) | 5 (19.2%) |
| 16 and 17 Years | 4 (12.1%) | 0 (0.0%) |
| 18 to 24 Years | 0 (0.0%) | 14 (8.2%) |
| 25 to 34 Years | 15 (7.5%) | 25 (7.9%) |
| 35 to 44 Years | 11 (4.4%) | 38 (16.0%) |
| 45 to 54 Years | 0 (0.0%) | 19 (8.8%) |
| 55 to 64 Years | 7 (3.4%) | 15 (8.1%) |
| 65 to 74 Years | 8 (11.6%) | 3 (4.0%) |
| 75 Years and over | 0 (0.0%) | 4 (10.3%) |
| Total | 75 (4.5%) | 137 (7.6%) |
Income Above Poverty by Sex and Age in Nome
According to the poverty statistics in Nome, males aged 18 to 24 years and females aged 5 years are the age groups that are most secure financially, with 100.0% of males and 100.0% of females in these age groups living above the poverty line.
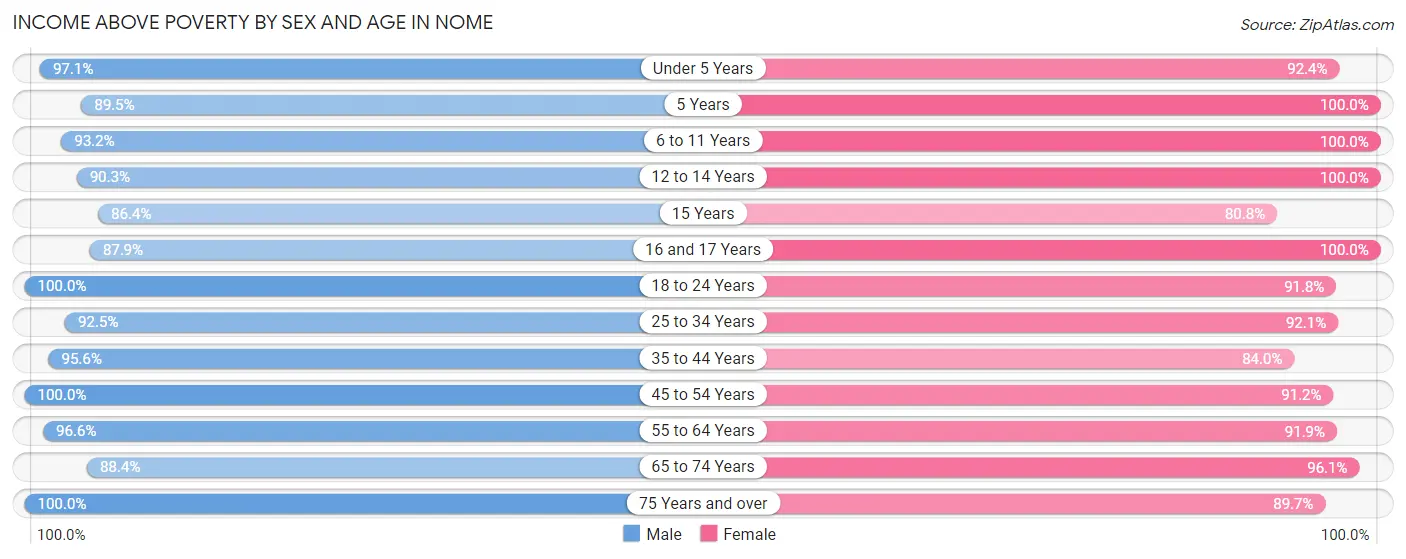
| Age Bracket | Male | Female |
| Under 5 Years | 136 (97.1%) | 169 (92.3%) |
| 5 Years | 17 (89.5%) | 19 (100.0%) |
| 6 to 11 Years | 164 (93.2%) | 172 (100.0%) |
| 12 to 14 Years | 84 (90.3%) | 76 (100.0%) |
| 15 Years | 19 (86.4%) | 21 (80.8%) |
| 16 and 17 Years | 29 (87.9%) | 74 (100.0%) |
| 18 to 24 Years | 181 (100.0%) | 156 (91.8%) |
| 25 to 34 Years | 185 (92.5%) | 291 (92.1%) |
| 35 to 44 Years | 236 (95.6%) | 199 (84.0%) |
| 45 to 54 Years | 270 (100.0%) | 198 (91.2%) |
| 55 to 64 Years | 197 (96.6%) | 170 (91.9%) |
| 65 to 74 Years | 61 (88.4%) | 73 (96.1%) |
| 75 Years and over | 20 (100.0%) | 35 (89.7%) |
| Total | 1,599 (95.5%) | 1,653 (92.3%) |
Income Below Poverty Among Married-Couple Families in Nome
The poverty statistics for married-couple families in Nome show that 1.7% or 7 of the total 424 families live below the poverty line. Families with no children have the highest poverty rate of 4.4%, comprising of 7 families. On the other hand, families with 1 or 2 children have the lowest poverty rate of 0.0%, which includes 0 families.
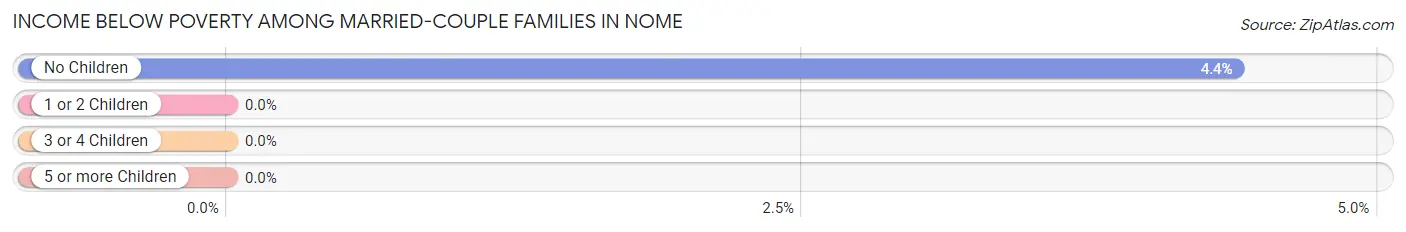
| Children | Above Poverty | Below Poverty |
| No Children | 153 (95.6%) | 7 (4.4%) |
| 1 or 2 Children | 155 (100.0%) | 0 (0.0%) |
| 3 or 4 Children | 97 (100.0%) | 0 (0.0%) |
| 5 or more Children | 12 (100.0%) | 0 (0.0%) |
| Total | 417 (98.4%) | 7 (1.7%) |
Income Below Poverty Among Single-Parent Households in Nome
According to the poverty data in Nome, 10.2% or 11 single-father households and 8.4% or 18 single-mother households are living below the poverty line. Among single-father households, those with 1 or 2 children have the highest poverty rate, with 11 households (15.7%) experiencing poverty. Likewise, among single-mother households, those with 3 or 4 children have the highest poverty rate, with 6 households (27.3%) falling below the poverty line.
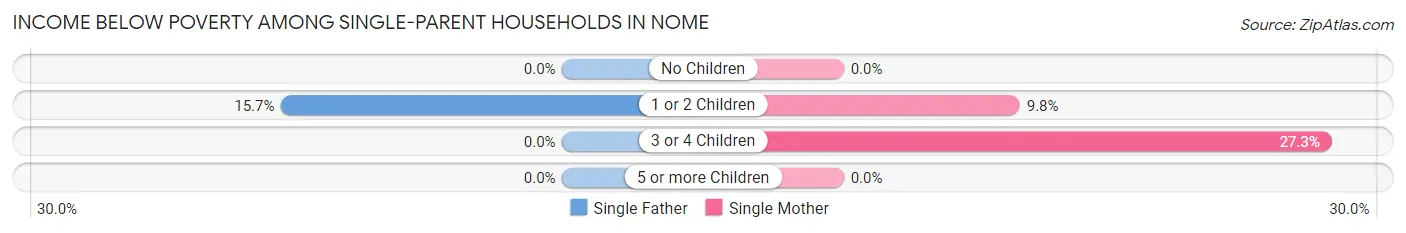
| Children | Single Father | Single Mother |
| No Children | 0 (0.0%) | 0 (0.0%) |
| 1 or 2 Children | 11 (15.7%) | 12 (9.8%) |
| 3 or 4 Children | 0 (0.0%) | 6 (27.3%) |
| 5 or more Children | 0 (0.0%) | 0 (0.0%) |
| Total | 11 (10.2%) | 18 (8.4%) |
Income Below Poverty Among Married-Couple vs Single-Parent Households in Nome
The poverty data for Nome shows that 7 of the married-couple family households (1.7%) and 29 of the single-parent households (9.0%) are living below the poverty level. Within the married-couple family households, those with no children have the highest poverty rate, with 7 households (4.4%) falling below the poverty line. Among the single-parent households, those with 3 or 4 children have the highest poverty rate, with 6 household (17.1%) living below poverty.
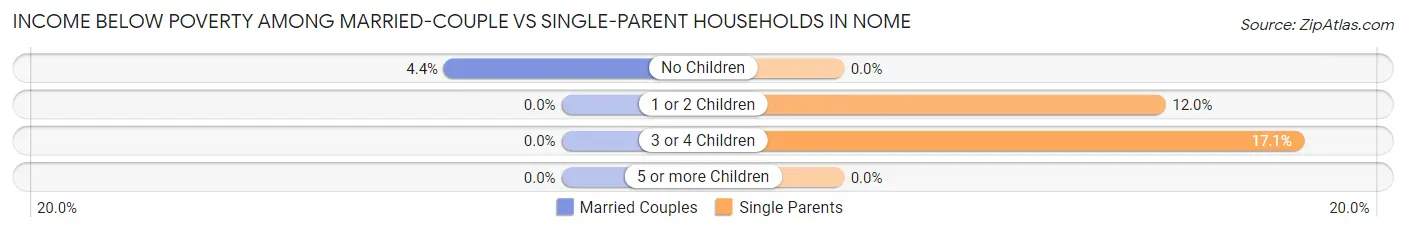
| Children | Married-Couple Families | Single-Parent Households |
| No Children | 7 (4.4%) | 0 (0.0%) |
| 1 or 2 Children | 0 (0.0%) | 23 (12.0%) |
| 3 or 4 Children | 0 (0.0%) | 6 (17.1%) |
| 5 or more Children | 0 (0.0%) | 0 (0.0%) |
| Total | 7 (1.7%) | 29 (9.0%) |
Race in Nome
The most populous races in Nome are Native / Alaskan (1,990 | 53.6%), White / Caucasian (993 | 26.8%), and Two or more Races (527 | 14.2%).
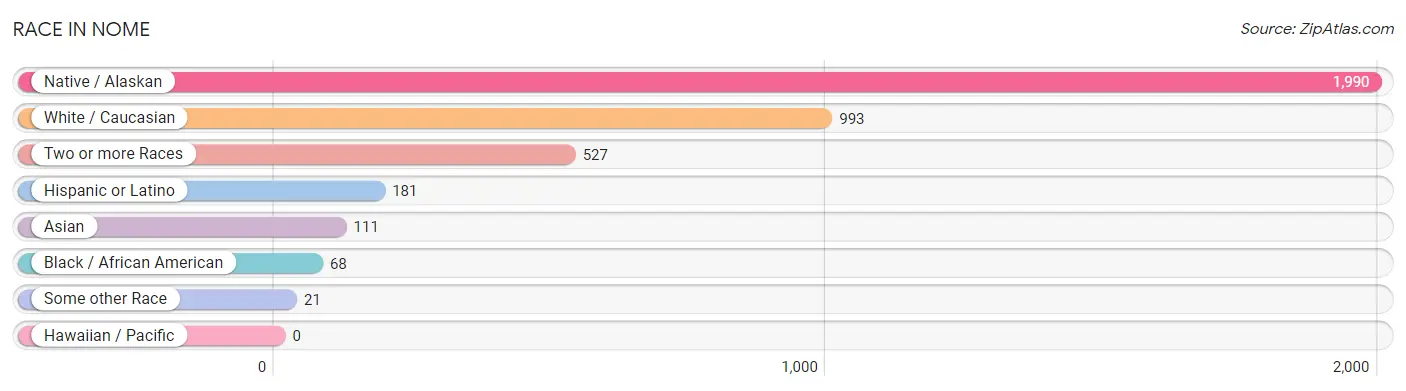
| Race | # Population | % Population |
| Asian | 111 | 3.0% |
| Black / African American | 68 | 1.8% |
| Hawaiian / Pacific | 0 | 0.0% |
| Hispanic or Latino | 181 | 4.9% |
| Native / Alaskan | 1,990 | 53.6% |
| White / Caucasian | 993 | 26.8% |
| Two or more Races | 527 | 14.2% |
| Some other Race | 21 | 0.6% |
| Total | 3,710 | 100.0% |
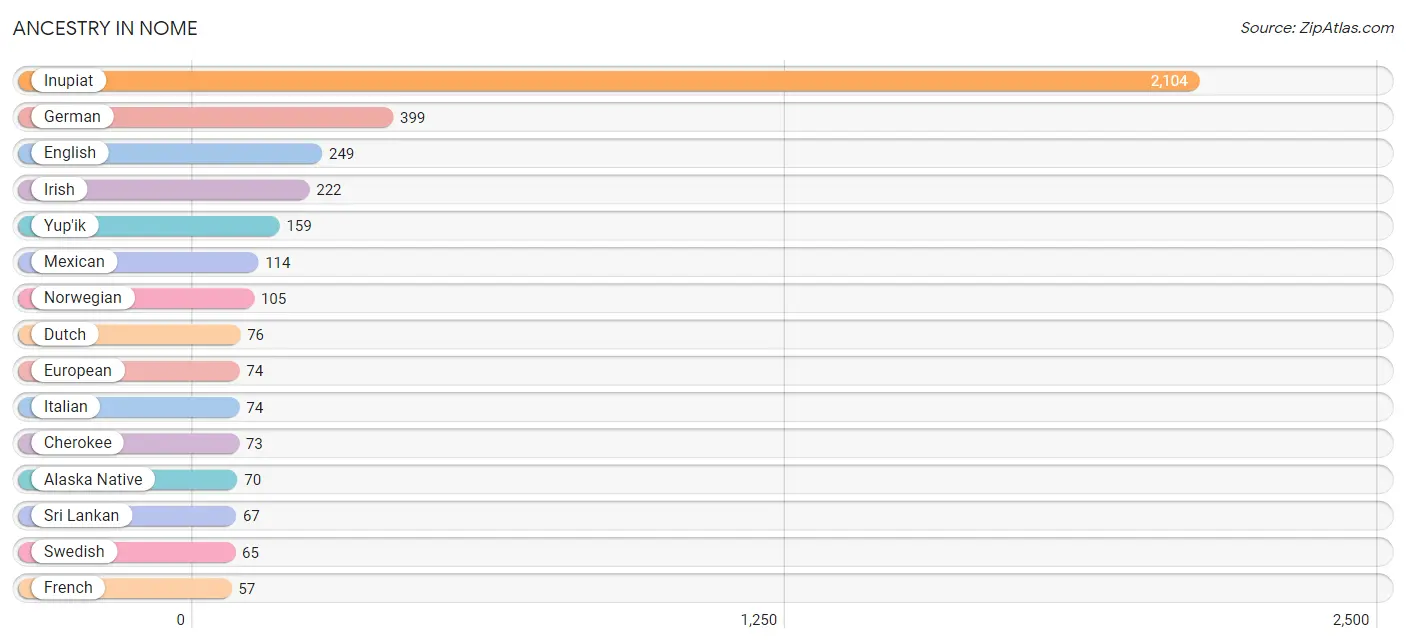
Ancestry in Nome
The most populous ancestries reported in Nome are Inupiat (2,104 | 56.7%), German (399 | 10.7%), English (249 | 6.7%), Irish (222 | 6.0%), and Yup'ik (159 | 4.3%), together accounting for 84.4% of all Nome residents.
| Ancestry | # Population | % Population |
| African | 18 | 0.5% |
| Alaska Native | 70 | 1.9% |
| Alaskan Athabascan | 7 | 0.2% |
| Aleut | 1 | 0.0% |
| American | 21 | 0.6% |
| Apache | 4 | 0.1% |
| Arab | 3 | 0.1% |
| Austrian | 6 | 0.2% |
| British | 25 | 0.7% |
| Burmese | 51 | 1.4% |
| Central American | 33 | 0.9% |
| Cherokee | 73 | 2.0% |
| Choctaw | 5 | 0.1% |
| Danish | 44 | 1.2% |
| Dutch | 76 | 2.1% |
| Eastern European | 1 | 0.0% |
| Egyptian | 3 | 0.1% |
| English | 249 | 6.7% |
| Estonian | 4 | 0.1% |
| European | 74 | 2.0% |
| Finnish | 11 | 0.3% |
| French | 57 | 1.5% |
| French Canadian | 5 | 0.1% |
| German | 399 | 10.7% |
| Haitian | 22 | 0.6% |
| Indian (Asian) | 11 | 0.3% |
| Inupiat | 2,104 | 56.7% |
| Irish | 222 | 6.0% |
| Israeli | 1 | 0.0% |
| Italian | 74 | 2.0% |
| Jamaican | 21 | 0.6% |
| Japanese | 33 | 0.9% |
| Korean | 22 | 0.6% |
| Latvian | 4 | 0.1% |
| Lithuanian | 6 | 0.2% |
| Mexican | 114 | 3.1% |
| Native Hawaiian | 5 | 0.1% |
| Norwegian | 105 | 2.8% |
| Pakistani | 6 | 0.2% |
| Polish | 24 | 0.6% |
| Puerto Rican | 20 | 0.5% |
| Russian | 43 | 1.2% |
| Salvadoran | 33 | 0.9% |
| Samoan | 1 | 0.0% |
| Scandinavian | 31 | 0.8% |
| Scotch-Irish | 16 | 0.4% |
| Scottish | 30 | 0.8% |
| South American | 4 | 0.1% |
| Spaniard | 3 | 0.1% |
| Sri Lankan | 67 | 1.8% |
| Subsaharan African | 28 | 0.7% |
| Swedish | 65 | 1.8% |
| Thai | 9 | 0.2% |
| Tlingit-Haida | 6 | 0.2% |
| Venezuelan | 4 | 0.1% |
| Welsh | 4 | 0.1% |
| Yup'ik | 159 | 4.3% | View All 57 Rows |
Immigrants in Nome
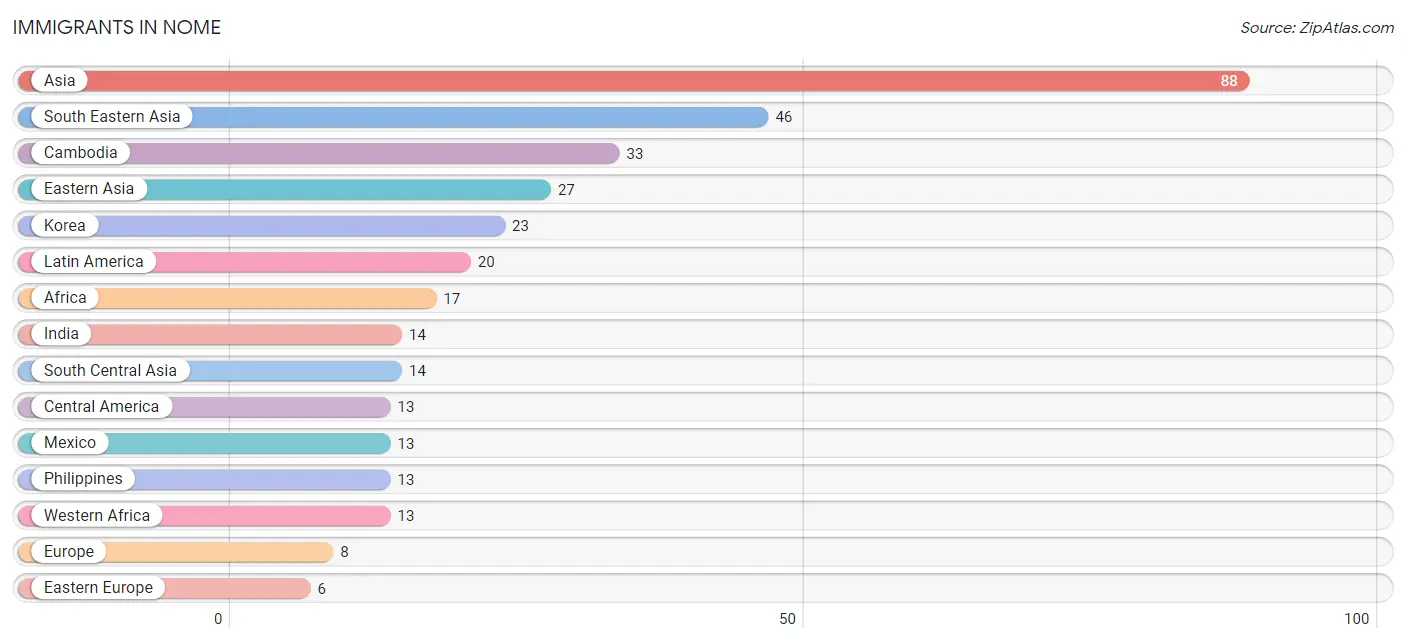
The most numerous immigrant groups reported in Nome came from Asia (88 | 2.4%), South Eastern Asia (46 | 1.2%), Cambodia (33 | 0.9%), Eastern Asia (27 | 0.7%), and Korea (23 | 0.6%), together accounting for 5.8% of all Nome residents.
| Immigration Origin | # Population | % Population |
| Africa | 17 | 0.5% |
| Asia | 88 | 2.4% |
| Austria | 2 | 0.1% |
| Brazil | 2 | 0.1% |
| Cambodia | 33 | 0.9% |
| Caribbean | 5 | 0.1% |
| Central America | 13 | 0.4% |
| China | 4 | 0.1% |
| Eastern Asia | 27 | 0.7% |
| Eastern Europe | 6 | 0.2% |
| Egypt | 3 | 0.1% |
| Europe | 8 | 0.2% |
| Ghana | 6 | 0.2% |
| India | 14 | 0.4% |
| Israel | 1 | 0.0% |
| Jamaica | 5 | 0.1% |
| Korea | 23 | 0.6% |
| Latin America | 20 | 0.5% |
| Lithuania | 3 | 0.1% |
| Mexico | 13 | 0.4% |
| Morocco | 1 | 0.0% |
| Northern Africa | 4 | 0.1% |
| Philippines | 13 | 0.4% |
| Russia | 2 | 0.1% |
| South America | 2 | 0.1% |
| South Central Asia | 14 | 0.4% |
| South Eastern Asia | 46 | 1.2% |
| Western Africa | 13 | 0.4% |
| Western Asia | 1 | 0.0% |
| Western Europe | 2 | 0.1% | View All 30 Rows |
Sex and Age in Nome
Sex and Age in Nome
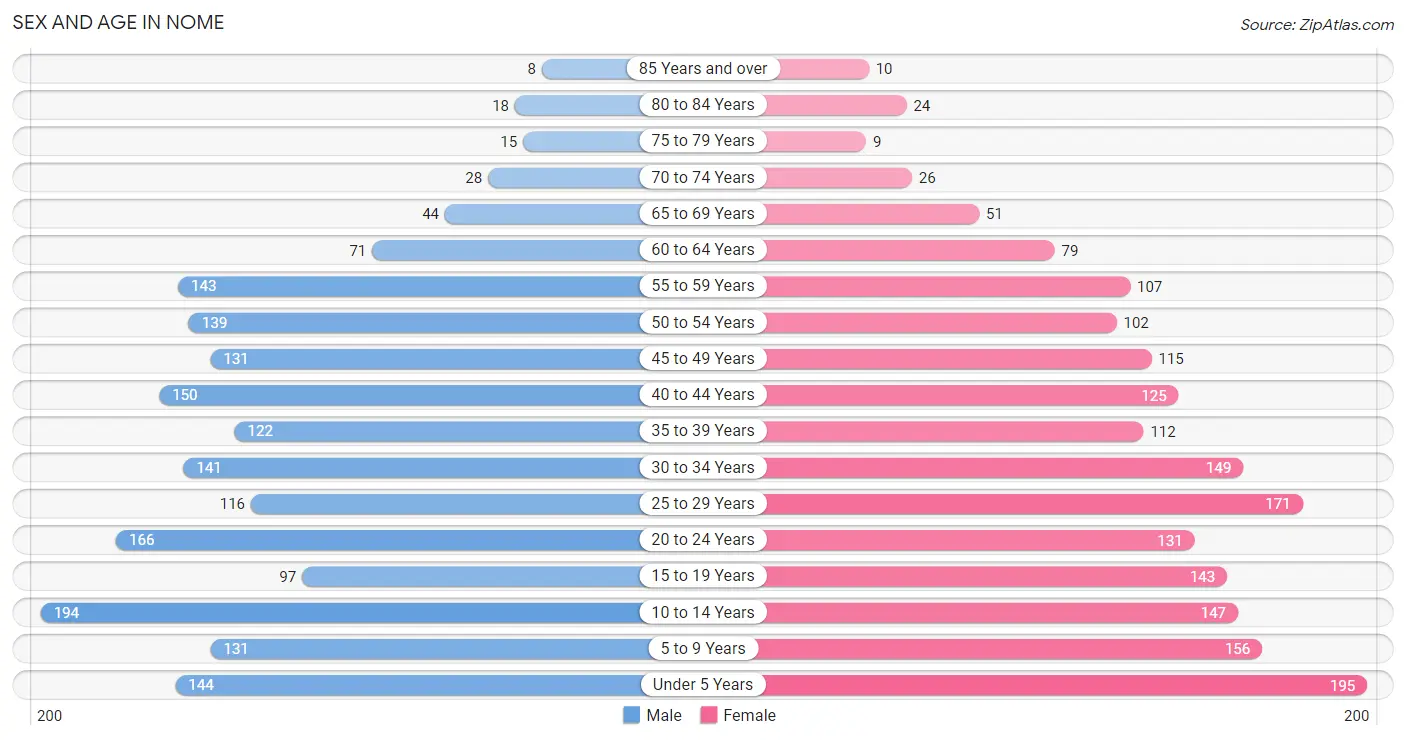
The most populous age groups in Nome are 10 to 14 Years (194 | 10.4%) for men and Under 5 Years (195 | 10.5%) for women.
| Age Bracket | Male | Female |
| Under 5 Years | 144 (7.7%) | 195 (10.5%) |
| 5 to 9 Years | 131 (7.0%) | 156 (8.4%) |
| 10 to 14 Years | 194 (10.4%) | 147 (7.9%) |
| 15 to 19 Years | 97 (5.2%) | 143 (7.7%) |
| 20 to 24 Years | 166 (8.9%) | 131 (7.1%) |
| 25 to 29 Years | 116 (6.2%) | 171 (9.2%) |
| 30 to 34 Years | 141 (7.6%) | 149 (8.1%) |
| 35 to 39 Years | 122 (6.6%) | 112 (6.0%) |
| 40 to 44 Years | 150 (8.1%) | 125 (6.8%) |
| 45 to 49 Years | 131 (7.0%) | 115 (6.2%) |
| 50 to 54 Years | 139 (7.5%) | 102 (5.5%) |
| 55 to 59 Years | 143 (7.7%) | 107 (5.8%) |
| 60 to 64 Years | 71 (3.8%) | 79 (4.3%) |
| 65 to 69 Years | 44 (2.4%) | 51 (2.8%) |
| 70 to 74 Years | 28 (1.5%) | 26 (1.4%) |
| 75 to 79 Years | 15 (0.8%) | 9 (0.5%) |
| 80 to 84 Years | 18 (1.0%) | 24 (1.3%) |
| 85 Years and over | 8 (0.4%) | 10 (0.5%) |
| Total | 1,858 (100.0%) | 1,852 (100.0%) |
Families and Households in Nome
Median Family Size in Nome
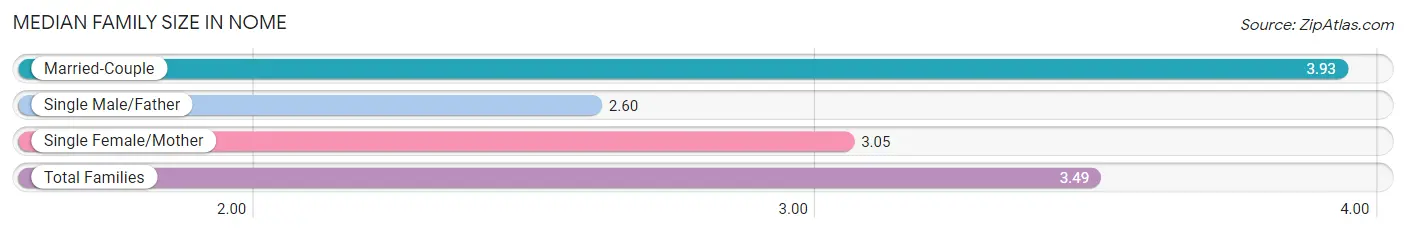
The median family size in Nome is 3.49 persons per family, with married-couple families (424 | 56.8%) accounting for the largest median family size of 3.93 persons per family. On the other hand, single male/father families (108 | 14.5%) represent the smallest median family size with 2.60 persons per family.
| Family Type | # Families | Family Size |
| Married-Couple | 424 (56.8%) | 3.93 |
| Single Male/Father | 108 (14.5%) | 2.60 |
| Single Female/Mother | 215 (28.8%) | 3.05 |
| Total Families | 747 (100.0%) | 3.49 |
Median Household Size in Nome
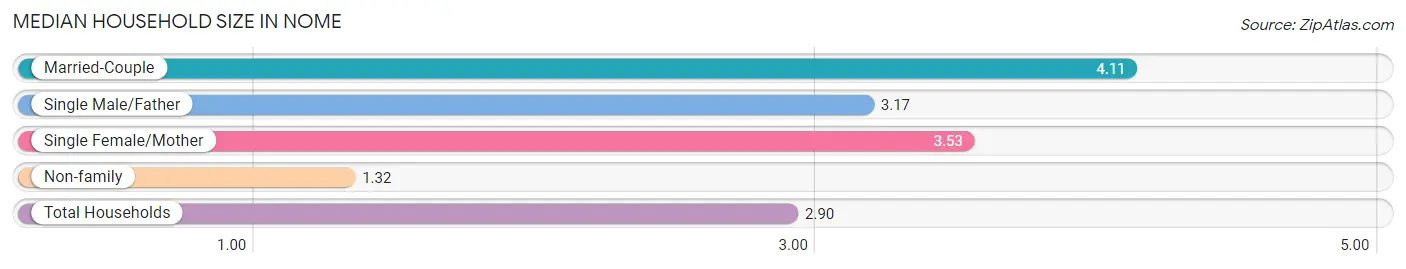
The median household size in Nome is 2.90 persons per household, with married-couple households (424 | 36.1%) accounting for the largest median household size of 4.11 persons per household. non-family households (426 | 36.3%) represent the smallest median household size with 1.32 persons per household.
| Household Type | # Households | Household Size |
| Married-Couple | 424 (36.1%) | 4.11 |
| Single Male/Father | 108 (9.2%) | 3.17 |
| Single Female/Mother | 215 (18.3%) | 3.53 |
| Non-family | 426 (36.3%) | 1.32 |
| Total Households | 1,173 (100.0%) | 2.90 |
Household Size by Marriage Status in Nome
Out of a total of 1,173 households in Nome, 747 (63.7%) are family households, while 426 (36.3%) are nonfamily households. The most numerous type of family households are 2-person households, comprising 201, and the most common type of nonfamily households are 1-person households, comprising 323.
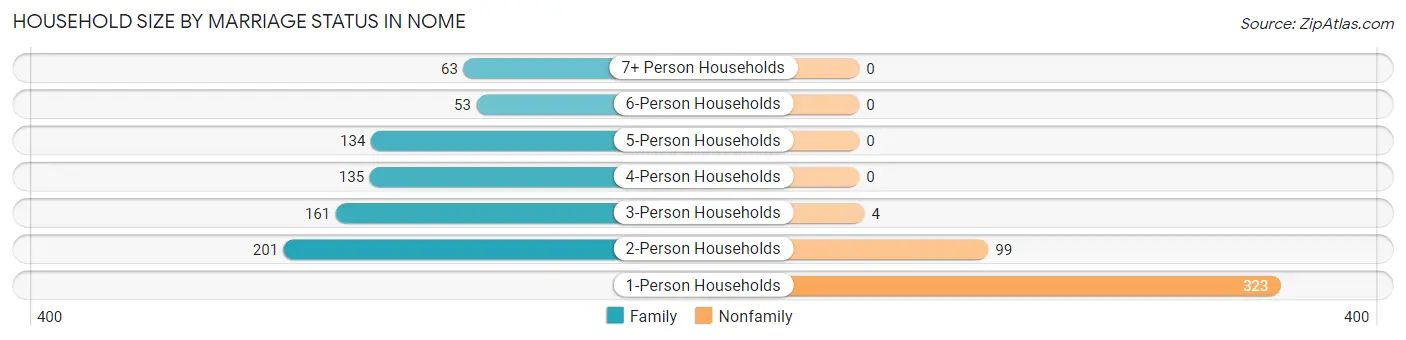
| Household Size | Family Households | Nonfamily Households |
| 1-Person Households | - | 323 (27.5%) |
| 2-Person Households | 201 (17.1%) | 99 (8.4%) |
| 3-Person Households | 161 (13.7%) | 4 (0.3%) |
| 4-Person Households | 135 (11.5%) | 0 (0.0%) |
| 5-Person Households | 134 (11.4%) | 0 (0.0%) |
| 6-Person Households | 53 (4.5%) | 0 (0.0%) |
| 7+ Person Households | 63 (5.4%) | 0 (0.0%) |
| Total | 747 (63.7%) | 426 (36.3%) |
Female Fertility in Nome
Fertility by Age in Nome
Average fertility rate in Nome is 53.0 births per 1,000 women. Women in the age bracket of 20 to 34 years have the highest fertility rate with 93.0 births per 1,000 women. Women in the age bracket of 20 to 34 years acount for 80.8% of all women with births.
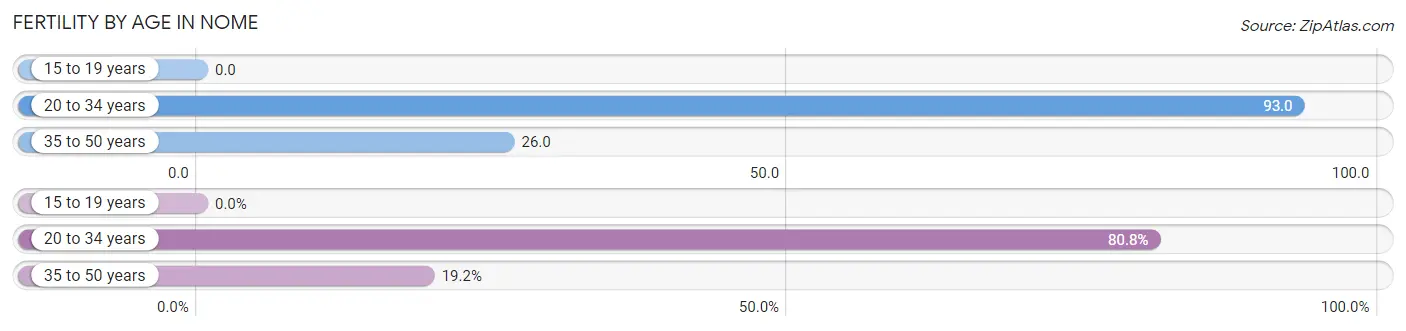
| Age Bracket | Women with Births | Births / 1,000 Women |
| 15 to 19 years | 0 (0.0%) | 0.0 |
| 20 to 34 years | 42 (80.8%) | 93.0 |
| 35 to 50 years | 10 (19.2%) | 26.0 |
| Total | 52 (100.0%) | 53.0 |
Fertility by Age by Marriage Status in Nome
40.4% of women with births (52) in Nome are married. The highest percentage of unmarried women with births falls into 20 to 34 years age bracket with 64.3% of them unmarried at the time of birth, while the lowest percentage of unmarried women with births belong to 35 to 50 years age bracket with 40.0% of them unmarried.
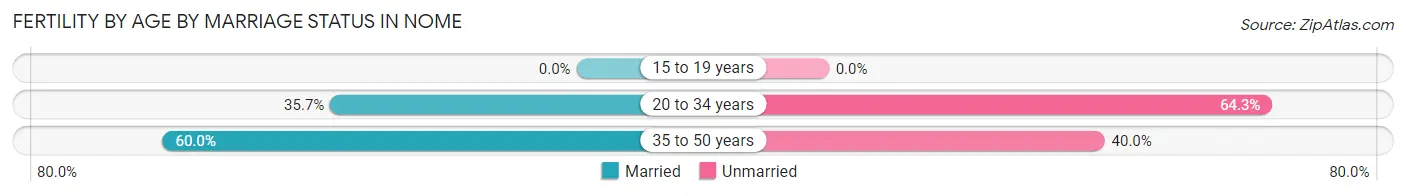
| Age Bracket | Married | Unmarried |
| 15 to 19 years | 0 (0.0%) | 0 (0.0%) |
| 20 to 34 years | 15 (35.7%) | 27 (64.3%) |
| 35 to 50 years | 6 (60.0%) | 4 (40.0%) |
| Total | 21 (40.4%) | 31 (59.6%) |
Fertility by Education in Nome
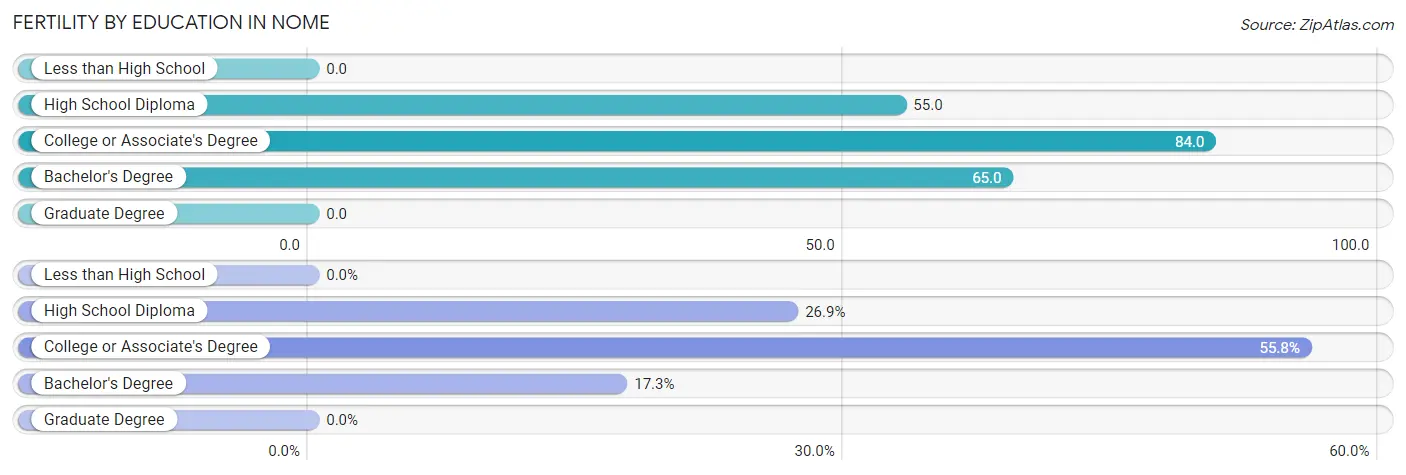
| Educational Attainment | Women with Births | Births / 1,000 Women |
| Less than High School | 0 (0.0%) | 0.0 |
| High School Diploma | 14 (26.9%) | 55.0 |
| College or Associate's Degree | 29 (55.8%) | 84.0 |
| Bachelor's Degree | 9 (17.3%) | 65.0 |
| Graduate Degree | 0 (0.0%) | 0.0 |
| Total | 52 (100.0%) | 53.0 |
Fertility by Education by Marriage Status in Nome
59.6% of women with births in Nome are unmarried. Women with the educational attainment of college or associate's degree are most likely to be married with 55.2% of them married at childbirth, while women with the educational attainment of high school diploma are least likely to be married with 92.9% of them unmarried at childbirth.
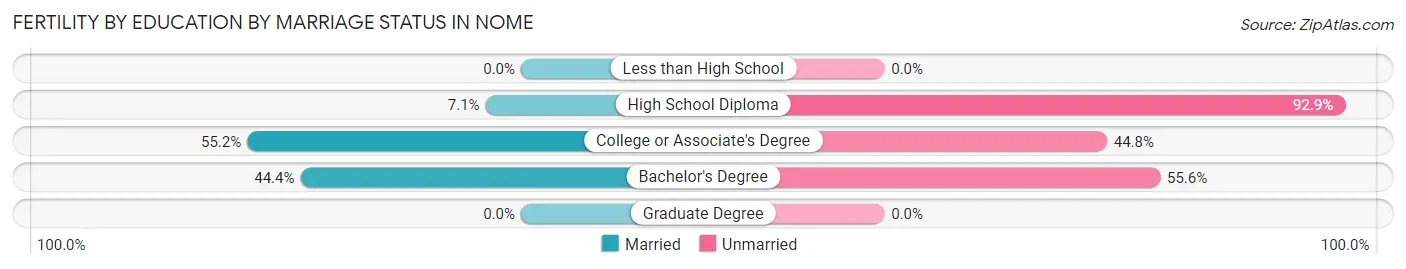
| Educational Attainment | Married | Unmarried |
| Less than High School | 0 (0.0%) | 0 (0.0%) |
| High School Diploma | 1 (7.1%) | 13 (92.9%) |
| College or Associate's Degree | 16 (55.2%) | 13 (44.8%) |
| Bachelor's Degree | 4 (44.4%) | 5 (55.6%) |
| Graduate Degree | 0 (0.0%) | 0 (0.0%) |
| Total | 21 (40.4%) | 31 (59.6%) |
Employment Characteristics in Nome
Employment by Class of Employer in Nome
Among the 1,757 employed individuals in Nome, private company employees (540 | 30.7%), not-for-profit organizations (535 | 30.4%), and state government employees (299 | 17.0%) make up the most common classes of employment.
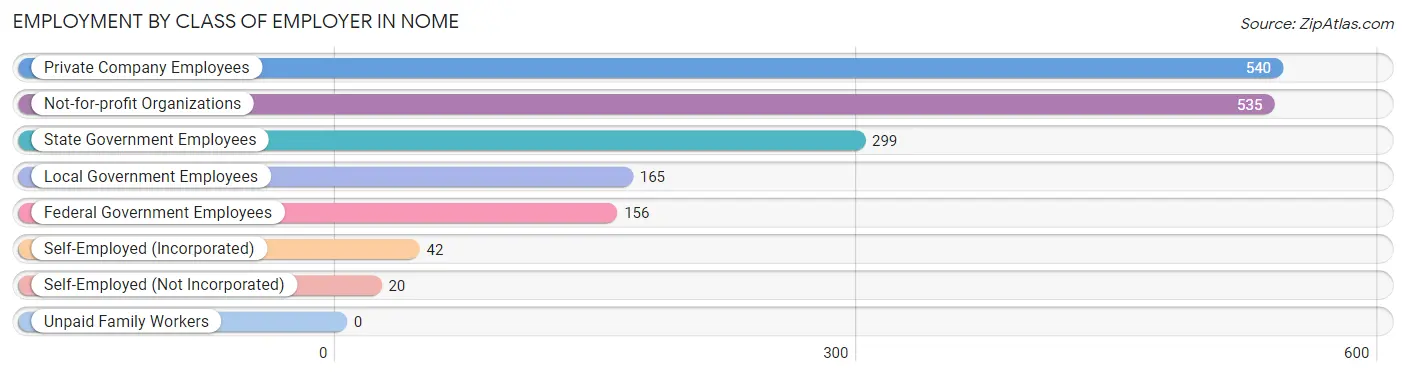
| Employer Class | # Employees | % Employees |
| Private Company Employees | 540 | 30.7% |
| Self-Employed (Incorporated) | 42 | 2.4% |
| Self-Employed (Not Incorporated) | 20 | 1.1% |
| Not-for-profit Organizations | 535 | 30.4% |
| Local Government Employees | 165 | 9.4% |
| State Government Employees | 299 | 17.0% |
| Federal Government Employees | 156 | 8.9% |
| Unpaid Family Workers | 0 | 0.0% |
| Total | 1,757 | 100.0% |
Employment Status by Age in Nome
According to the labor force statistics for Nome, out of the total population over 16 years of age (2,694), 74.4% or 2,004 individuals are in the labor force, with 8.4% or 168 of them unemployed. The age group with the highest labor force participation rate is 35 to 44 years, with 87.4% or 445 individuals in the labor force. Within the labor force, the 20 to 24 years age range has the highest percentage of unemployed individuals, with 21.3% or 54 of them being unemployed.
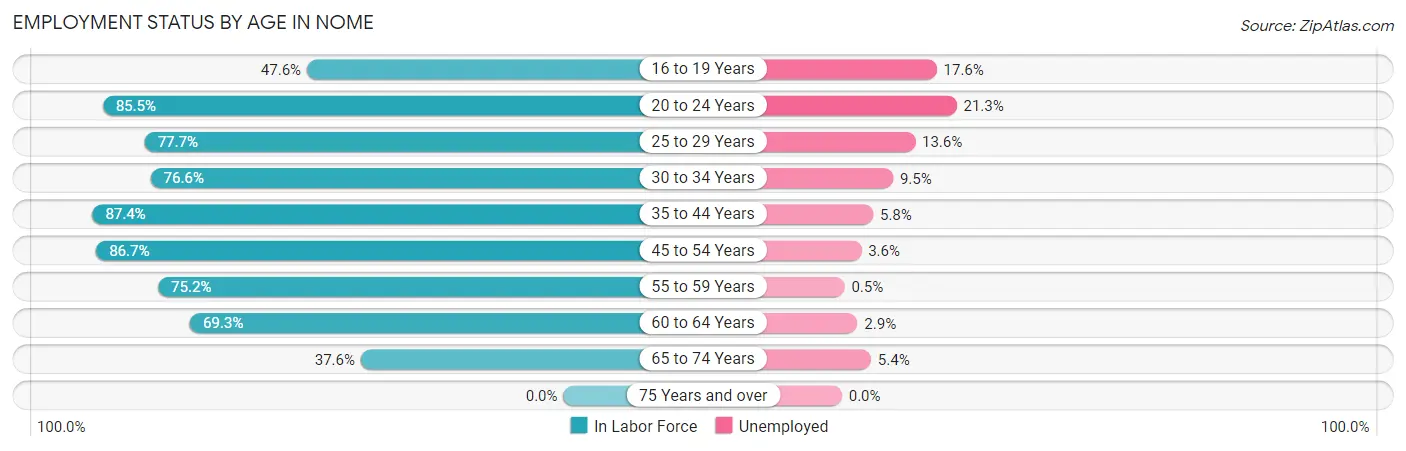
| Age Bracket | In Labor Force | Unemployed |
| 16 to 19 Years | 91 (47.6%) | 16 (17.6%) |
| 20 to 24 Years | 254 (85.5%) | 54 (21.3%) |
| 25 to 29 Years | 223 (77.7%) | 30 (13.6%) |
| 30 to 34 Years | 222 (76.6%) | 21 (9.5%) |
| 35 to 44 Years | 445 (87.4%) | 26 (5.8%) |
| 45 to 54 Years | 422 (86.7%) | 15 (3.6%) |
| 55 to 59 Years | 188 (75.2%) | 1 (0.5%) |
| 60 to 64 Years | 104 (69.3%) | 3 (2.9%) |
| 65 to 74 Years | 56 (37.6%) | 3 (5.4%) |
| 75 Years and over | 0 (0.0%) | 0 (0.0%) |
| Total | 2,004 (74.4%) | 168 (8.4%) |
Employment Status by Educational Attainment in Nome
According to labor force statistics for Nome, 81.3% of individuals (1,604) out of the total population between 25 and 64 years of age (1,973) are in the labor force, with 6.0% or 96 of them being unemployed. The group with the highest labor force participation rate are those with the educational attainment of bachelor's degree or higher, with 97.5% or 500 individuals in the labor force. Within the labor force, individuals with high school diploma education have the highest percentage of unemployment, with 11.2% or 55 of them being unemployed.
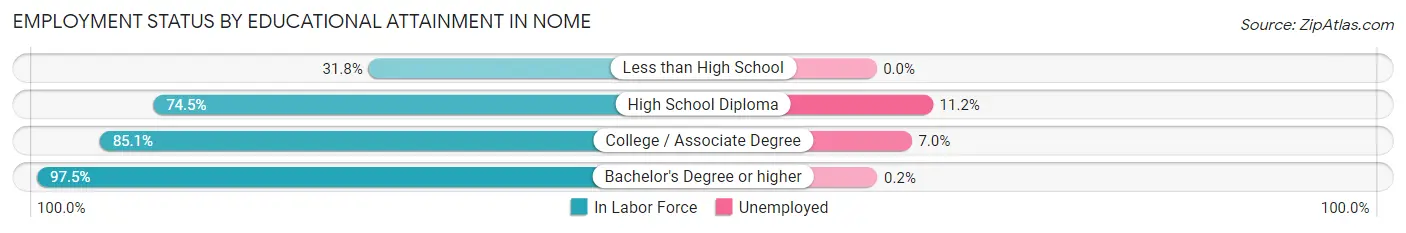
| Educational Attainment | In Labor Force | Unemployed |
| Less than High School | 41 (31.8%) | 0 (0.0%) |
| High School Diploma | 490 (74.5%) | 74 (11.2%) |
| College / Associate Degree | 573 (85.1%) | 47 (7.0%) |
| Bachelor's Degree or higher | 500 (97.5%) | 1 (0.2%) |
| Total | 1,604 (81.3%) | 118 (6.0%) |
Employment Occupations by Sex in Nome
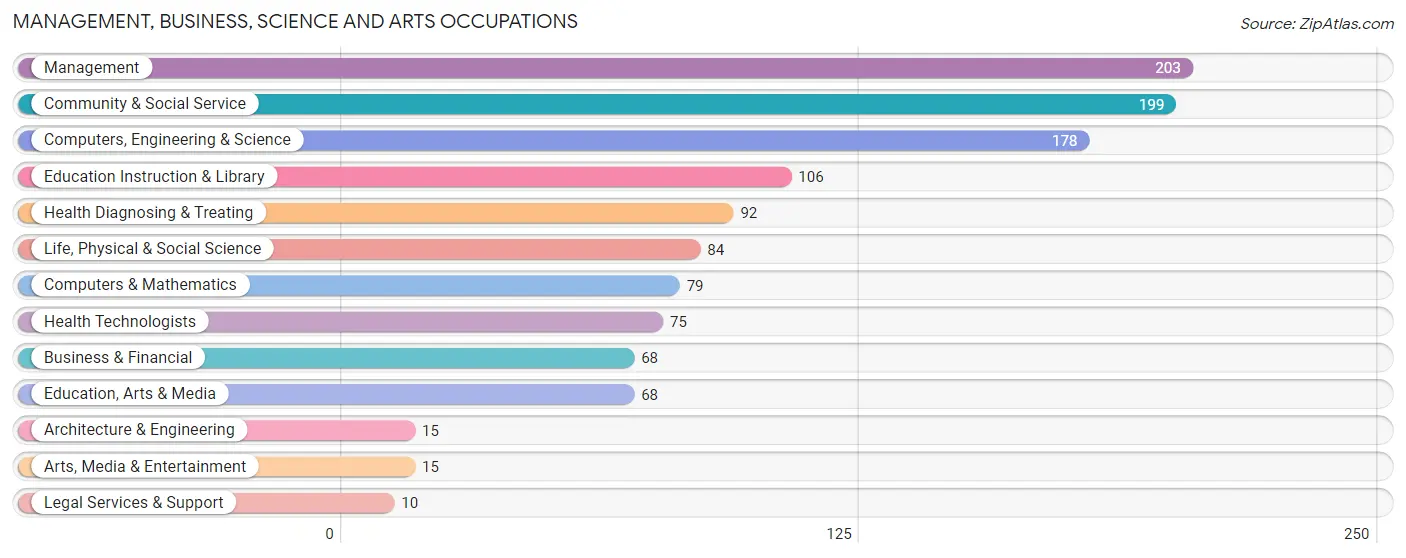
Management, Business, Science and Arts Occupations
The most common Management, Business, Science and Arts occupations in Nome are Management (203 | 11.1%), Community & Social Service (199 | 10.8%), Computers, Engineering & Science (178 | 9.7%), Education Instruction & Library (106 | 5.8%), and Health Diagnosing & Treating (92 | 5.0%).
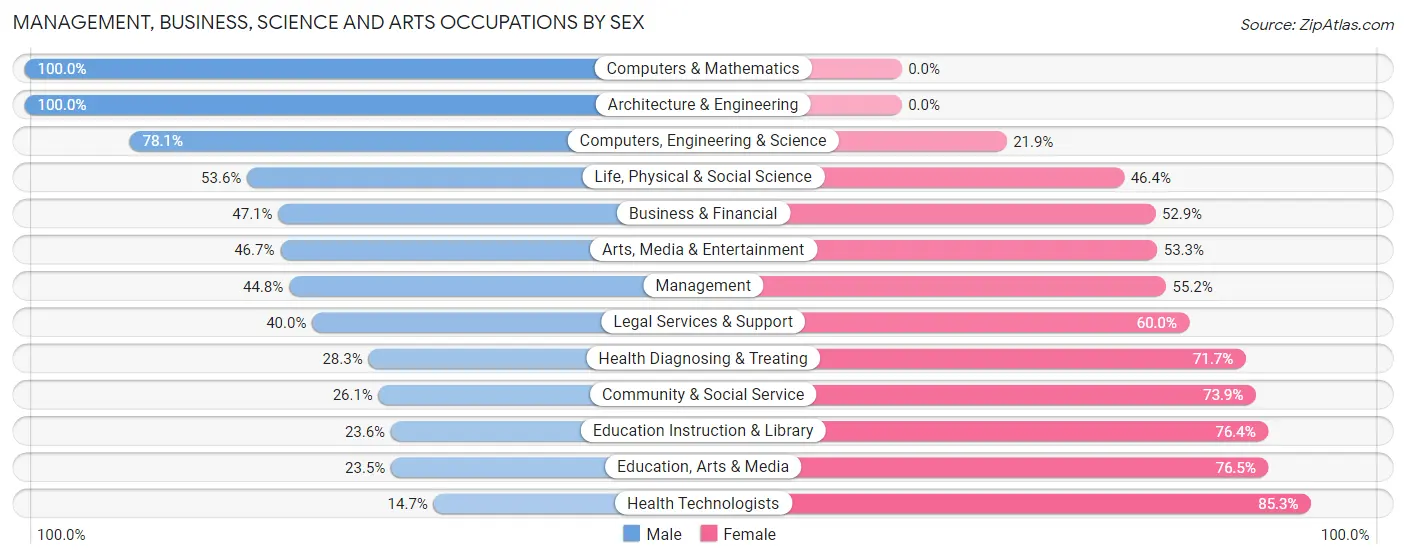
Management, Business, Science and Arts Occupations by Sex
Within the Management, Business, Science and Arts occupations in Nome, the most male-oriented occupations are Computers & Mathematics (100.0%), Architecture & Engineering (100.0%), and Computers, Engineering & Science (78.1%), while the most female-oriented occupations are Health Technologists (85.3%), Education, Arts & Media (76.5%), and Education Instruction & Library (76.4%).
| Occupation | Male | Female |
| Management | 91 (44.8%) | 112 (55.2%) |
| Business & Financial | 32 (47.1%) | 36 (52.9%) |
| Computers, Engineering & Science | 139 (78.1%) | 39 (21.9%) |
| Computers & Mathematics | 79 (100.0%) | 0 (0.0%) |
| Architecture & Engineering | 15 (100.0%) | 0 (0.0%) |
| Life, Physical & Social Science | 45 (53.6%) | 39 (46.4%) |
| Community & Social Service | 52 (26.1%) | 147 (73.9%) |
| Education, Arts & Media | 16 (23.5%) | 52 (76.5%) |
| Legal Services & Support | 4 (40.0%) | 6 (60.0%) |
| Education Instruction & Library | 25 (23.6%) | 81 (76.4%) |
| Arts, Media & Entertainment | 7 (46.7%) | 8 (53.3%) |
| Health Diagnosing & Treating | 26 (28.3%) | 66 (71.7%) |
| Health Technologists | 11 (14.7%) | 64 (85.3%) |
| Total (Category) | 340 (46.0%) | 400 (54.0%) |
| Total (Overall) | 932 (50.8%) | 902 (49.2%) |
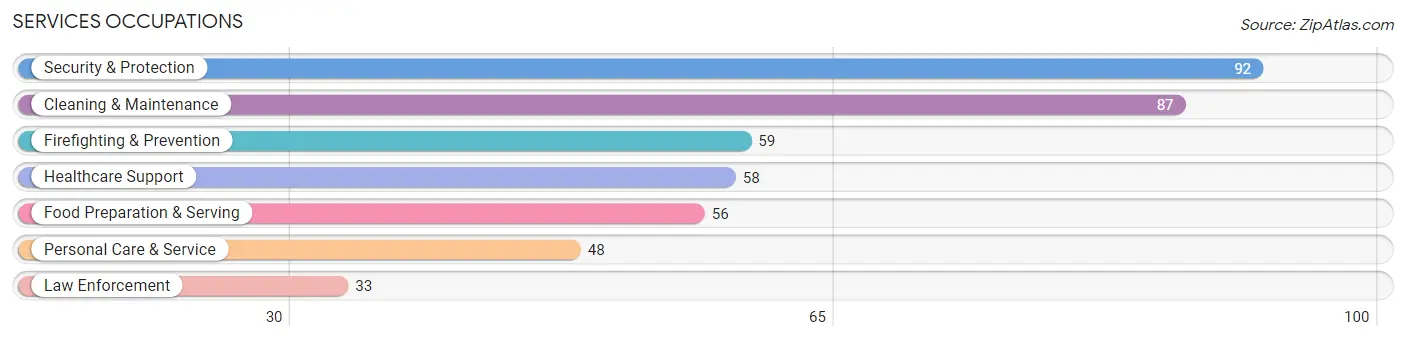
Services Occupations
The most common Services occupations in Nome are Security & Protection (92 | 5.0%), Cleaning & Maintenance (87 | 4.7%), Firefighting & Prevention (59 | 3.2%), Healthcare Support (58 | 3.2%), and Food Preparation & Serving (56 | 3.0%).
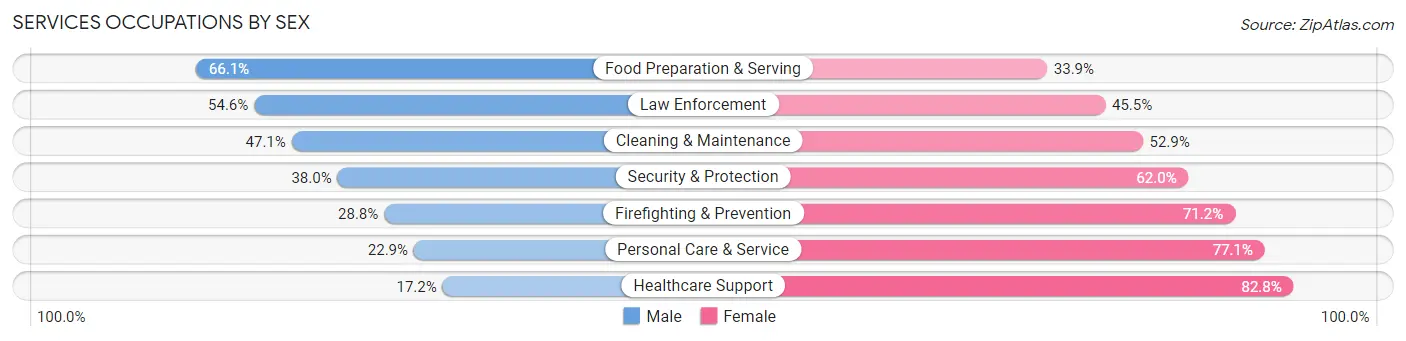
Services Occupations by Sex
Within the Services occupations in Nome, the most male-oriented occupations are Food Preparation & Serving (66.1%), Law Enforcement (54.5%), and Cleaning & Maintenance (47.1%), while the most female-oriented occupations are Healthcare Support (82.8%), Personal Care & Service (77.1%), and Firefighting & Prevention (71.2%).
| Occupation | Male | Female |
| Healthcare Support | 10 (17.2%) | 48 (82.8%) |
| Security & Protection | 35 (38.0%) | 57 (62.0%) |
| Firefighting & Prevention | 17 (28.8%) | 42 (71.2%) |
| Law Enforcement | 18 (54.5%) | 15 (45.5%) |
| Food Preparation & Serving | 37 (66.1%) | 19 (33.9%) |
| Cleaning & Maintenance | 41 (47.1%) | 46 (52.9%) |
| Personal Care & Service | 11 (22.9%) | 37 (77.1%) |
| Total (Category) | 134 (39.3%) | 207 (60.7%) |
| Total (Overall) | 932 (50.8%) | 902 (49.2%) |
Sales and Office Occupations
The most common Sales and Office occupations in Nome are Office & Administration (328 | 17.9%), and Sales & Related (85 | 4.6%).
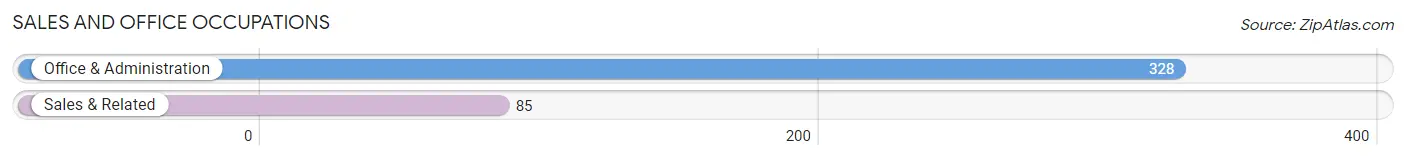
Sales and Office Occupations by Sex
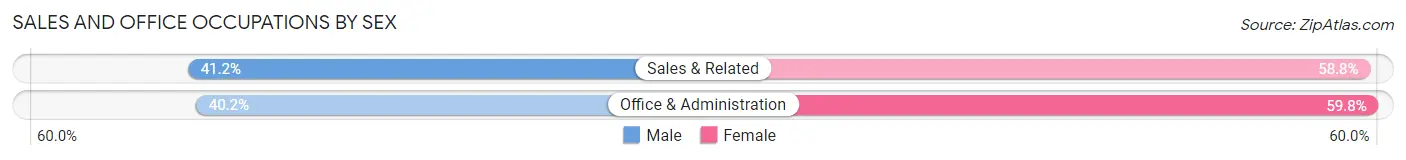
| Occupation | Male | Female |
| Sales & Related | 35 (41.2%) | 50 (58.8%) |
| Office & Administration | 132 (40.2%) | 196 (59.8%) |
| Total (Category) | 167 (40.4%) | 246 (59.6%) |
| Total (Overall) | 932 (50.8%) | 902 (49.2%) |
Natural Resources, Construction and Maintenance Occupations
The most common Natural Resources, Construction and Maintenance occupations in Nome are Installation, Maintenance & Repair (95 | 5.2%), and Construction & Extraction (80 | 4.4%).
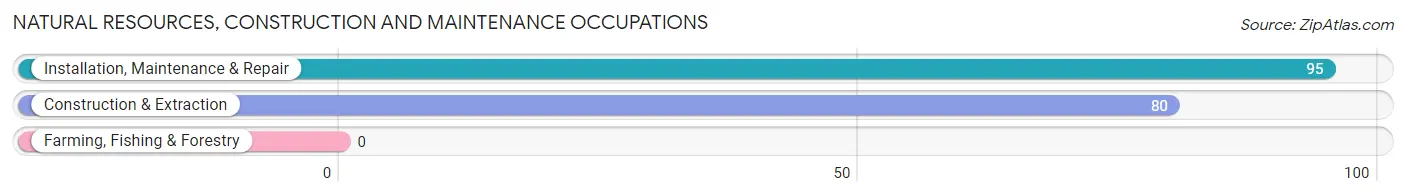
Natural Resources, Construction and Maintenance Occupations by Sex
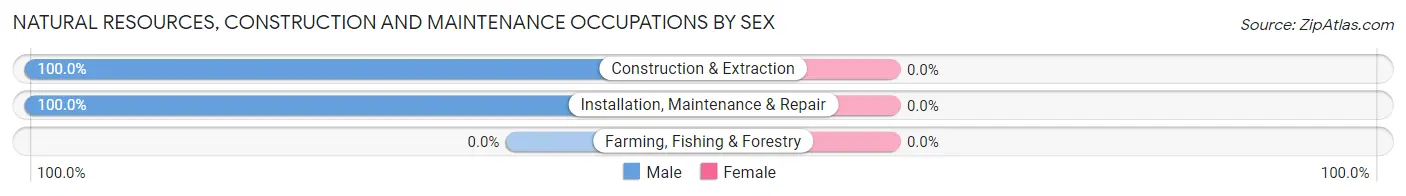
| Occupation | Male | Female |
| Farming, Fishing & Forestry | 0 (0.0%) | 0 (0.0%) |
| Construction & Extraction | 80 (100.0%) | 0 (0.0%) |
| Installation, Maintenance & Repair | 95 (100.0%) | 0 (0.0%) |
| Total (Category) | 175 (100.0%) | 0 (0.0%) |
| Total (Overall) | 932 (50.8%) | 902 (49.2%) |
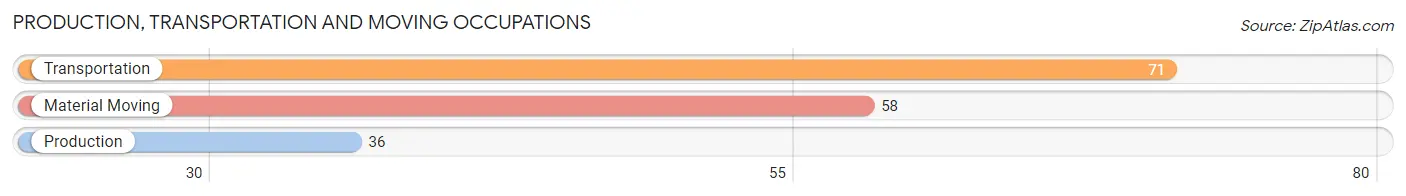
Production, Transportation and Moving Occupations
The most common Production, Transportation and Moving occupations in Nome are Transportation (71 | 3.9%), Material Moving (58 | 3.2%), and Production (36 | 2.0%).
Production, Transportation and Moving Occupations by Sex
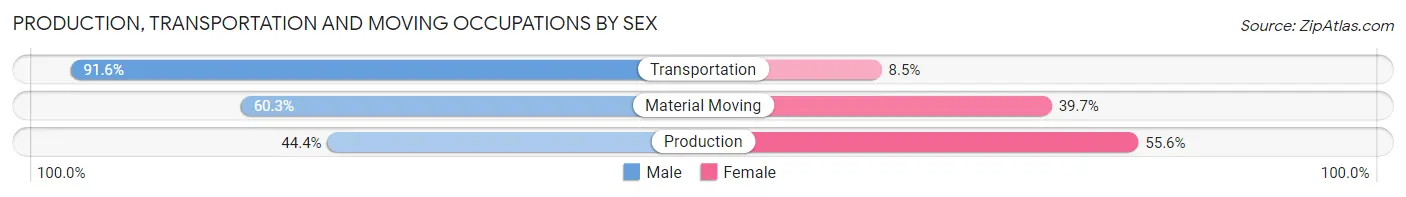
| Occupation | Male | Female |
| Production | 16 (44.4%) | 20 (55.6%) |
| Transportation | 65 (91.5%) | 6 (8.5%) |
| Material Moving | 35 (60.3%) | 23 (39.7%) |
| Total (Category) | 116 (70.3%) | 49 (29.7%) |
| Total (Overall) | 932 (50.8%) | 902 (49.2%) |
Employment Industries by Sex in Nome
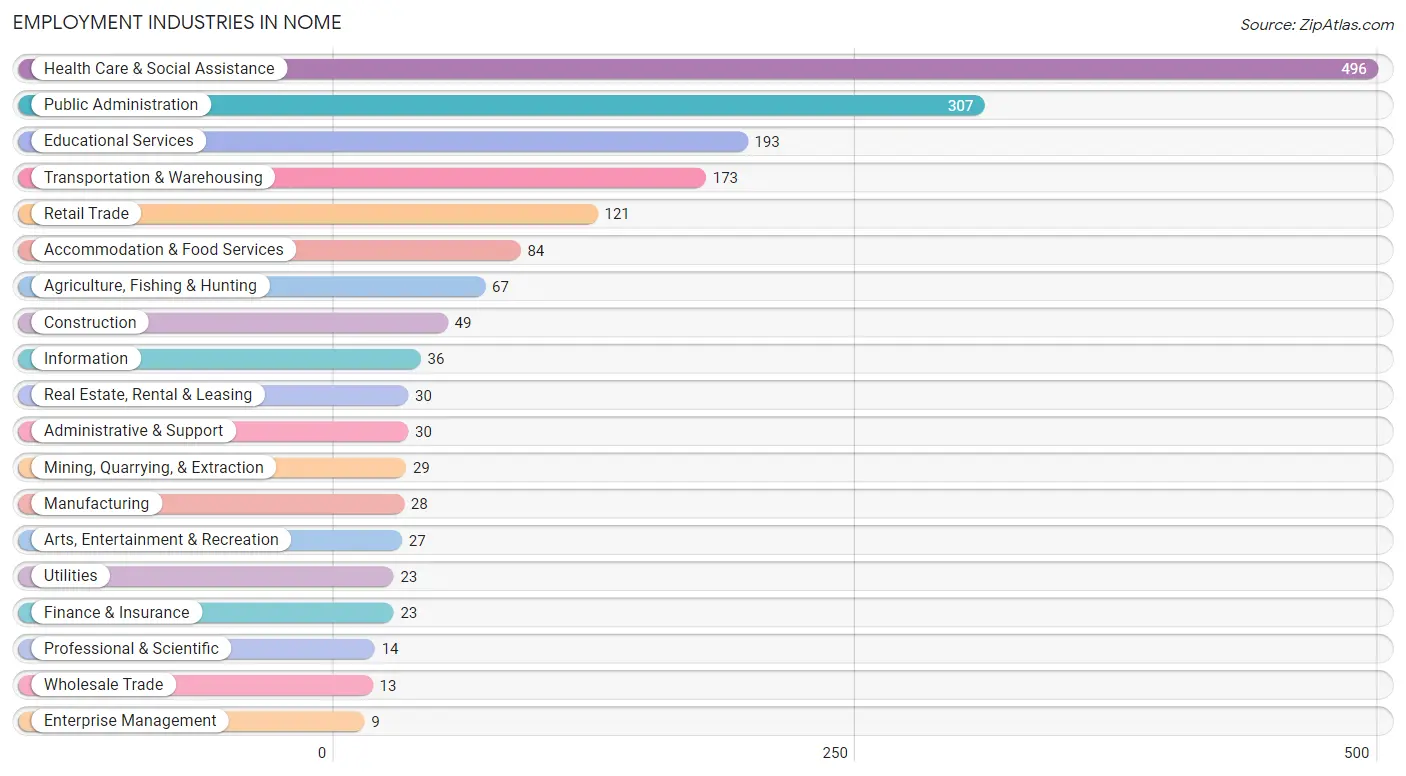
Employment Industries in Nome
The major employment industries in Nome include Health Care & Social Assistance (496 | 27.0%), Public Administration (307 | 16.7%), Educational Services (193 | 10.5%), Transportation & Warehousing (173 | 9.4%), and Retail Trade (121 | 6.6%).
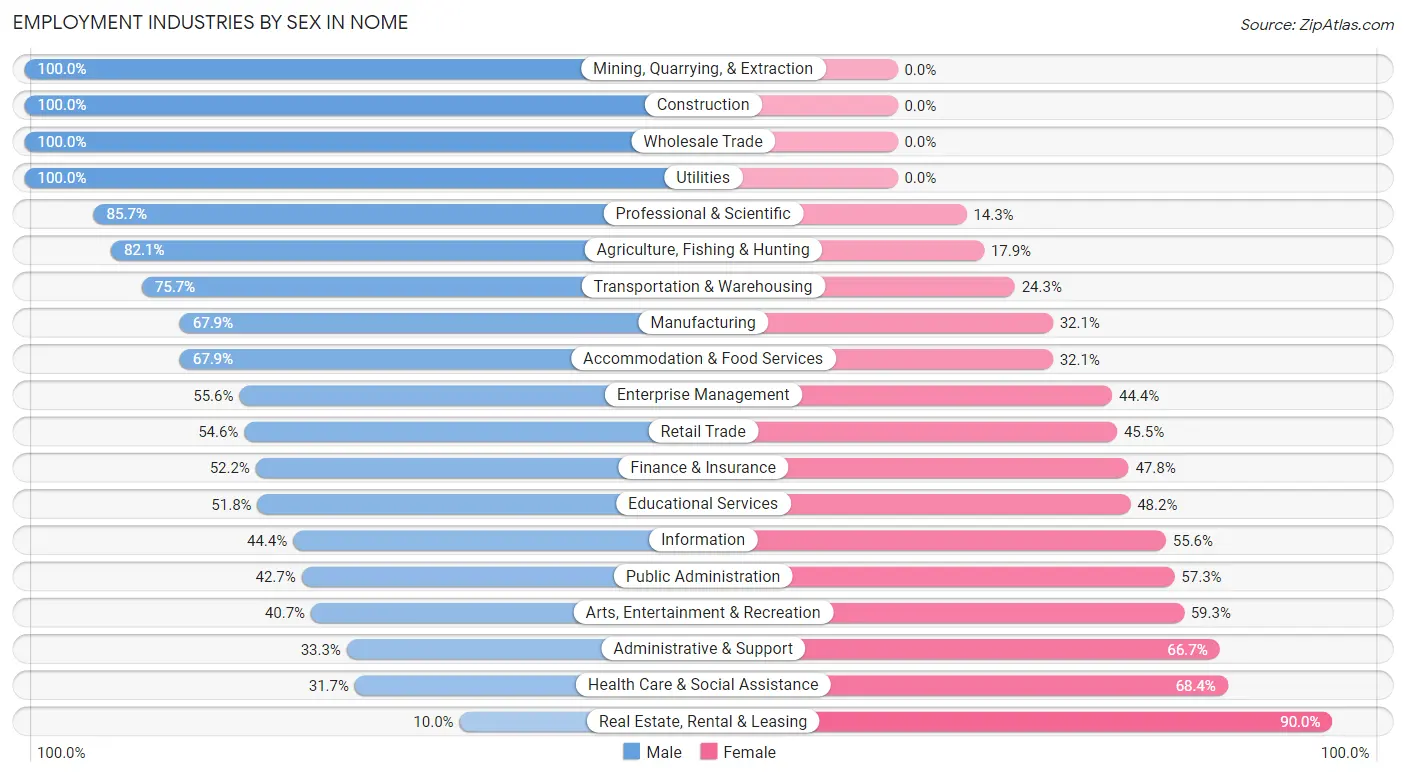
Employment Industries by Sex in Nome
The Nome industries that see more men than women are Mining, Quarrying, & Extraction (100.0%), Construction (100.0%), and Wholesale Trade (100.0%), whereas the industries that tend to have a higher number of women are Real Estate, Rental & Leasing (90.0%), Health Care & Social Assistance (68.3%), and Administrative & Support (66.7%).
| Industry | Male | Female |
| Agriculture, Fishing & Hunting | 55 (82.1%) | 12 (17.9%) |
| Mining, Quarrying, & Extraction | 29 (100.0%) | 0 (0.0%) |
| Construction | 49 (100.0%) | 0 (0.0%) |
| Manufacturing | 19 (67.9%) | 9 (32.1%) |
| Wholesale Trade | 13 (100.0%) | 0 (0.0%) |
| Retail Trade | 66 (54.5%) | 55 (45.5%) |
| Transportation & Warehousing | 131 (75.7%) | 42 (24.3%) |
| Utilities | 23 (100.0%) | 0 (0.0%) |
| Information | 16 (44.4%) | 20 (55.6%) |
| Finance & Insurance | 12 (52.2%) | 11 (47.8%) |
| Real Estate, Rental & Leasing | 3 (10.0%) | 27 (90.0%) |
| Professional & Scientific | 12 (85.7%) | 2 (14.3%) |
| Enterprise Management | 5 (55.6%) | 4 (44.4%) |
| Administrative & Support | 10 (33.3%) | 20 (66.7%) |
| Educational Services | 100 (51.8%) | 93 (48.2%) |
| Health Care & Social Assistance | 157 (31.7%) | 339 (68.3%) |
| Arts, Entertainment & Recreation | 11 (40.7%) | 16 (59.3%) |
| Accommodation & Food Services | 57 (67.9%) | 27 (32.1%) |
| Public Administration | 131 (42.7%) | 176 (57.3%) |
| Total | 932 (50.8%) | 902 (49.2%) |
Education in Nome
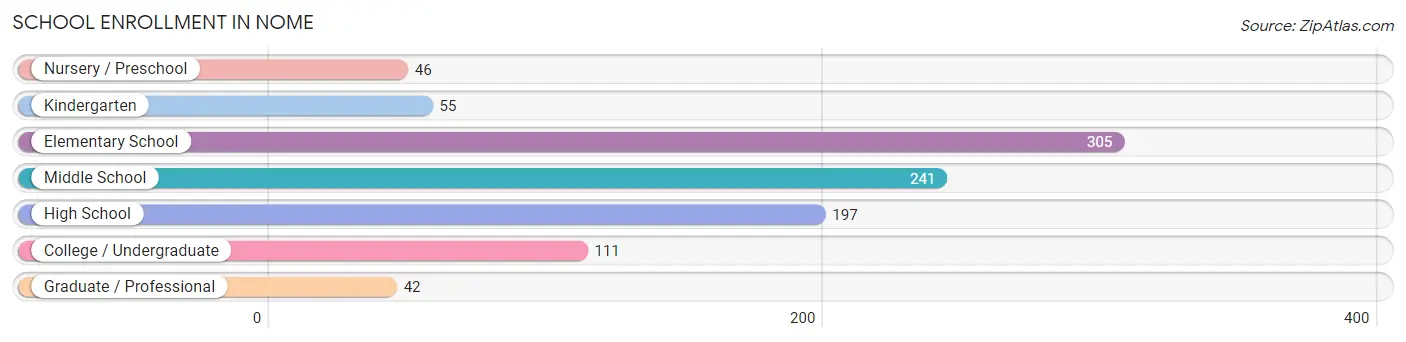
School Enrollment in Nome
The most common levels of schooling among the 997 students in Nome are elementary school (305 | 30.6%), middle school (241 | 24.2%), and high school (197 | 19.8%).
| School Level | # Students | % Students |
| Nursery / Preschool | 46 | 4.6% |
| Kindergarten | 55 | 5.5% |
| Elementary School | 305 | 30.6% |
| Middle School | 241 | 24.2% |
| High School | 197 | 19.8% |
| College / Undergraduate | 111 | 11.1% |
| Graduate / Professional | 42 | 4.2% |
| Total | 997 | 100.0% |
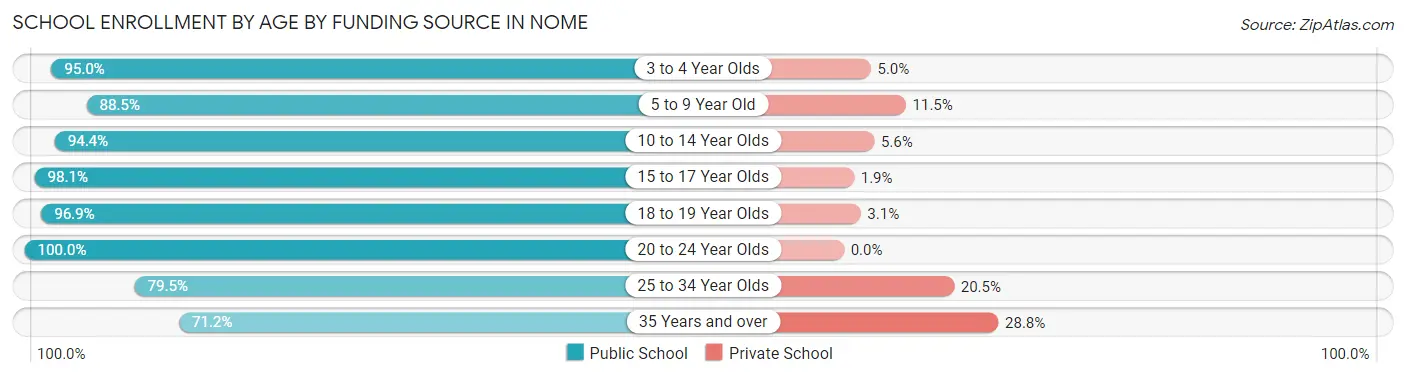
School Enrollment by Age by Funding Source in Nome
Out of a total of 997 students who are enrolled in schools in Nome, 87 (8.7%) attend a private institution, while the remaining 910 (91.3%) are enrolled in public schools. The age group of 35 years and over has the highest likelihood of being enrolled in private schools, with 21 (28.8% in the age bracket) enrolled. Conversely, the age group of 20 to 24 year olds has the lowest likelihood of being enrolled in a private school, with 30 (100.0% in the age bracket) attending a public institution.
| Age Bracket | Public School | Private School |
| 3 to 4 Year Olds | 38 (95.0%) | 2 (5.0%) |
| 5 to 9 Year Old | 253 (88.5%) | 33 (11.5%) |
| 10 to 14 Year Olds | 318 (94.4%) | 19 (5.6%) |
| 15 to 17 Year Olds | 157 (98.1%) | 3 (1.9%) |
| 18 to 19 Year Olds | 31 (96.9%) | 1 (3.1%) |
| 20 to 24 Year Olds | 30 (100.0%) | 0 (0.0%) |
| 25 to 34 Year Olds | 31 (79.5%) | 8 (20.5%) |
| 35 Years and over | 52 (71.2%) | 21 (28.8%) |
| Total | 910 (91.3%) | 87 (8.7%) |
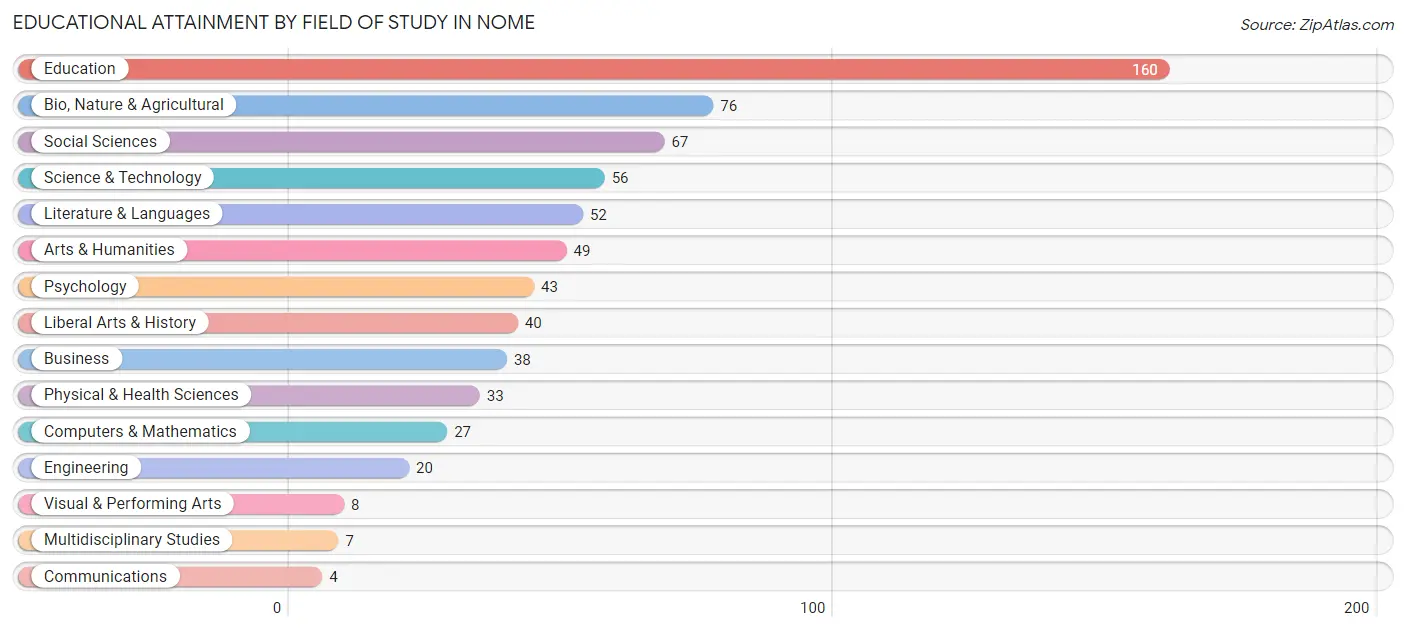
Educational Attainment by Field of Study in Nome
Education (160 | 23.5%), bio, nature & agricultural (76 | 11.2%), social sciences (67 | 9.9%), science & technology (56 | 8.2%), and literature & languages (52 | 7.6%) are the most common fields of study among 680 individuals in Nome who have obtained a bachelor's degree or higher.
| Field of Study | # Graduates | % Graduates |
| Computers & Mathematics | 27 | 4.0% |
| Bio, Nature & Agricultural | 76 | 11.2% |
| Physical & Health Sciences | 33 | 4.9% |
| Psychology | 43 | 6.3% |
| Social Sciences | 67 | 9.9% |
| Engineering | 20 | 2.9% |
| Multidisciplinary Studies | 7 | 1.0% |
| Science & Technology | 56 | 8.2% |
| Business | 38 | 5.6% |
| Education | 160 | 23.5% |
| Literature & Languages | 52 | 7.6% |
| Liberal Arts & History | 40 | 5.9% |
| Visual & Performing Arts | 8 | 1.2% |
| Communications | 4 | 0.6% |
| Arts & Humanities | 49 | 7.2% |
| Total | 680 | 100.0% |
Transportation & Commute in Nome
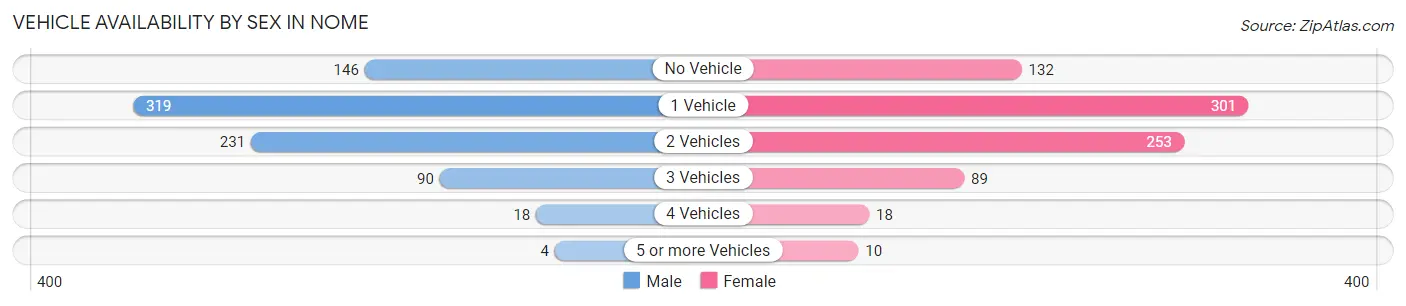
Vehicle Availability by Sex in Nome
The most prevalent vehicle ownership categories in Nome are males with 1 vehicle (319, accounting for 39.5%) and females with 1 vehicle (301, making up 39.7%).
| Vehicles Available | Male | Female |
| No Vehicle | 146 (18.1%) | 132 (16.4%) |
| 1 Vehicle | 319 (39.5%) | 301 (37.5%) |
| 2 Vehicles | 231 (28.6%) | 253 (31.5%) |
| 3 Vehicles | 90 (11.1%) | 89 (11.1%) |
| 4 Vehicles | 18 (2.2%) | 18 (2.2%) |
| 5 or more Vehicles | 4 (0.5%) | 10 (1.3%) |
| Total | 808 (100.0%) | 803 (100.0%) |
Commute Time in Nome
The most frequently occuring commute durations in Nome are less than 5 minutes (663 commuters, 40.4%), 5 to 9 minutes (585 commuters, 35.7%), and 10 to 14 minutes (184 commuters, 11.2%).
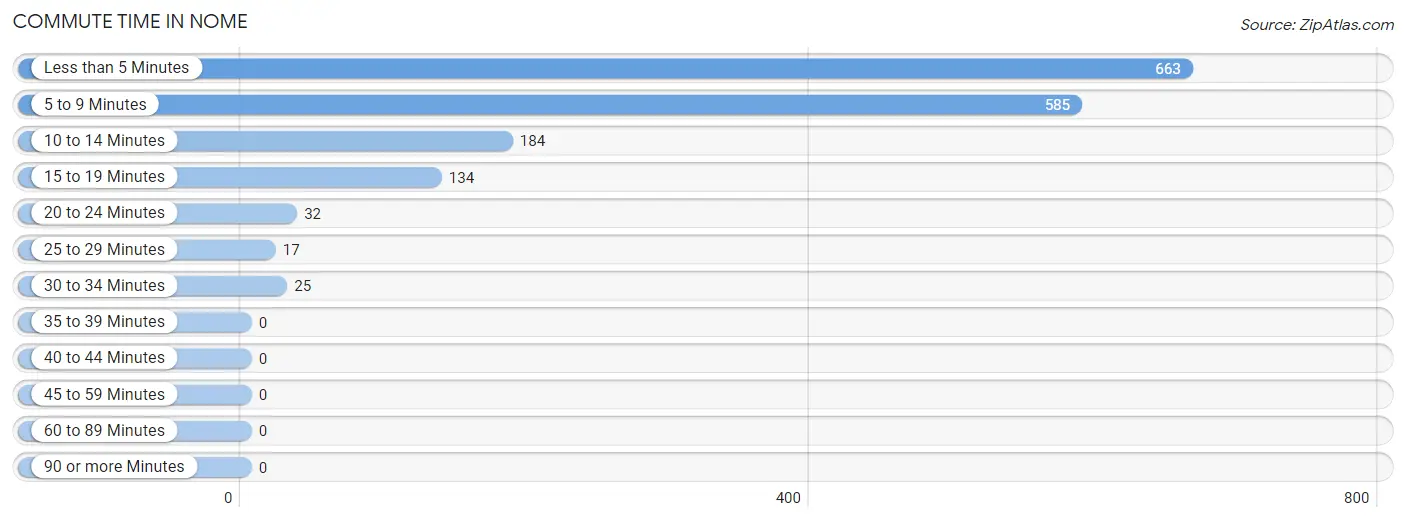
| Commute Time | # Commuters | % Commuters |
| Less than 5 Minutes | 663 | 40.4% |
| 5 to 9 Minutes | 585 | 35.7% |
| 10 to 14 Minutes | 184 | 11.2% |
| 15 to 19 Minutes | 134 | 8.2% |
| 20 to 24 Minutes | 32 | 1.9% |
| 25 to 29 Minutes | 17 | 1.0% |
| 30 to 34 Minutes | 25 | 1.5% |
| 35 to 39 Minutes | 0 | 0.0% |
| 40 to 44 Minutes | 0 | 0.0% |
| 45 to 59 Minutes | 0 | 0.0% |
| 60 to 89 Minutes | 0 | 0.0% |
| 90 or more Minutes | 0 | 0.0% |
Commute Time by Sex in Nome
The most common commute times in Nome are less than 5 minutes (365 commuters, 42.6%) for males and less than 5 minutes (298 commuters, 38.1%) for females.
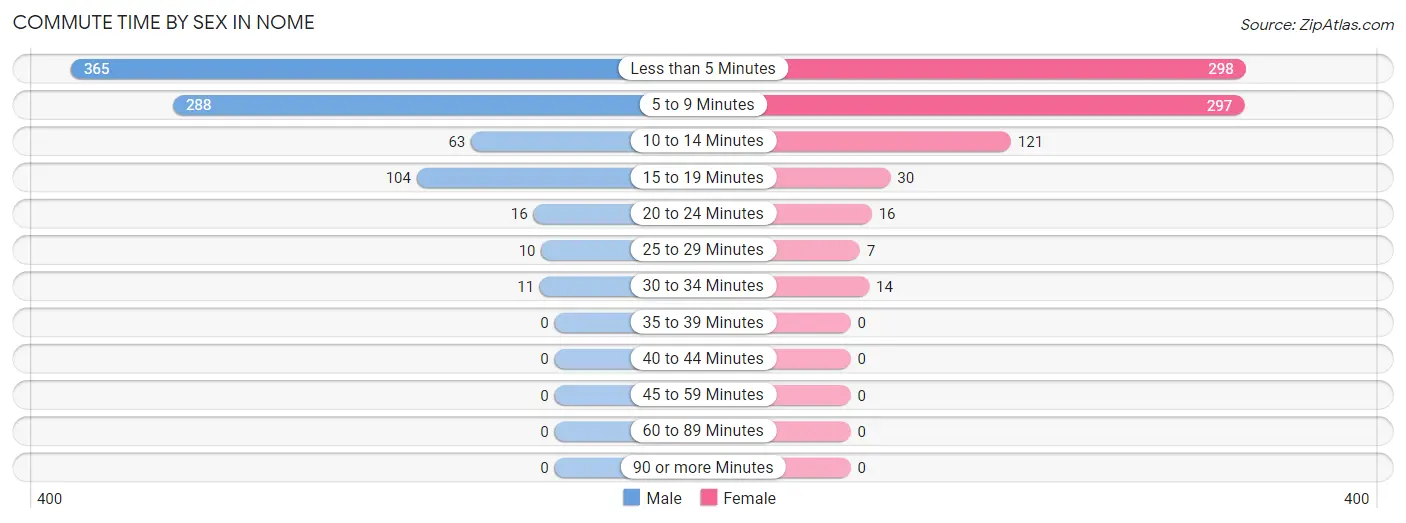
| Commute Time | Male | Female |
| Less than 5 Minutes | 365 (42.6%) | 298 (38.1%) |
| 5 to 9 Minutes | 288 (33.6%) | 297 (37.9%) |
| 10 to 14 Minutes | 63 (7.3%) | 121 (15.4%) |
| 15 to 19 Minutes | 104 (12.1%) | 30 (3.8%) |
| 20 to 24 Minutes | 16 (1.9%) | 16 (2.0%) |
| 25 to 29 Minutes | 10 (1.2%) | 7 (0.9%) |
| 30 to 34 Minutes | 11 (1.3%) | 14 (1.8%) |
| 35 to 39 Minutes | 0 (0.0%) | 0 (0.0%) |
| 40 to 44 Minutes | 0 (0.0%) | 0 (0.0%) |
| 45 to 59 Minutes | 0 (0.0%) | 0 (0.0%) |
| 60 to 89 Minutes | 0 (0.0%) | 0 (0.0%) |
| 90 or more Minutes | 0 (0.0%) | 0 (0.0%) |
Time of Departure to Work by Sex in Nome
The most frequent times of departure to work in Nome are 7:30 AM to 7:59 AM (282, 32.9%) for males and 7:30 AM to 7:59 AM (267, 34.1%) for females.
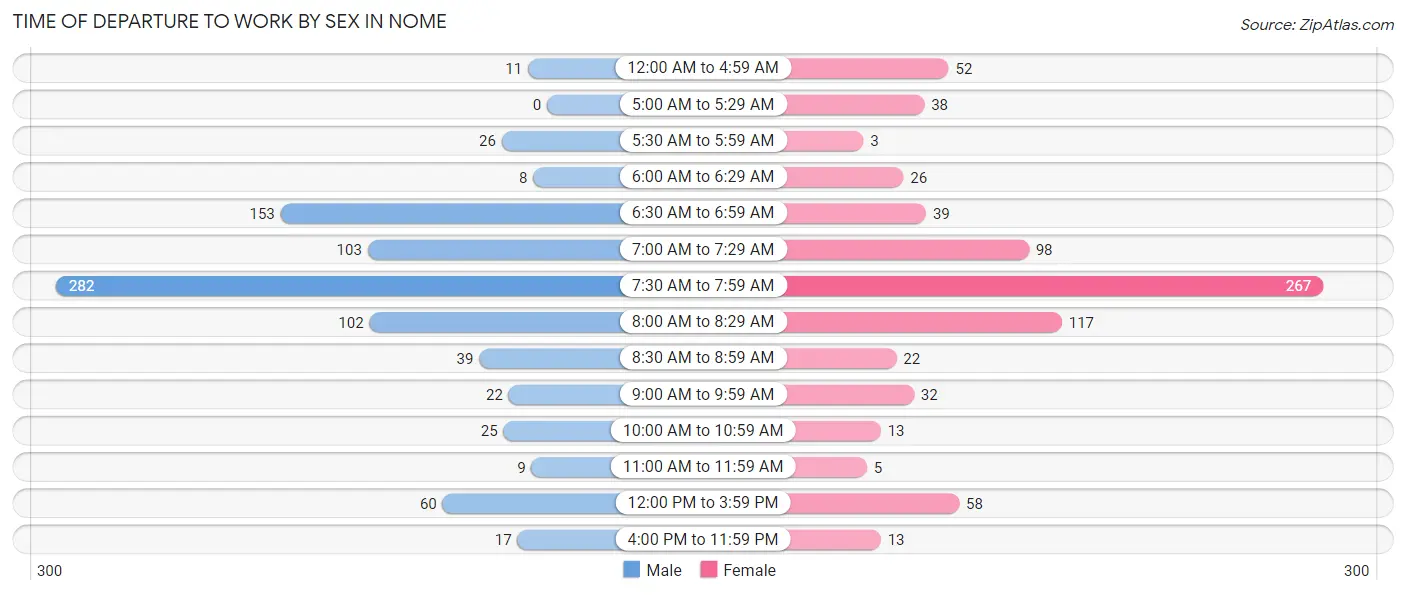
| Time of Departure | Male | Female |
| 12:00 AM to 4:59 AM | 11 (1.3%) | 52 (6.6%) |
| 5:00 AM to 5:29 AM | 0 (0.0%) | 38 (4.9%) |
| 5:30 AM to 5:59 AM | 26 (3.0%) | 3 (0.4%) |
| 6:00 AM to 6:29 AM | 8 (0.9%) | 26 (3.3%) |
| 6:30 AM to 6:59 AM | 153 (17.8%) | 39 (5.0%) |
| 7:00 AM to 7:29 AM | 103 (12.0%) | 98 (12.5%) |
| 7:30 AM to 7:59 AM | 282 (32.9%) | 267 (34.1%) |
| 8:00 AM to 8:29 AM | 102 (11.9%) | 117 (14.9%) |
| 8:30 AM to 8:59 AM | 39 (4.5%) | 22 (2.8%) |
| 9:00 AM to 9:59 AM | 22 (2.6%) | 32 (4.1%) |
| 10:00 AM to 10:59 AM | 25 (2.9%) | 13 (1.7%) |
| 11:00 AM to 11:59 AM | 9 (1.1%) | 5 (0.6%) |
| 12:00 PM to 3:59 PM | 60 (7.0%) | 58 (7.4%) |
| 4:00 PM to 11:59 PM | 17 (2.0%) | 13 (1.7%) |
| Total | 857 (100.0%) | 783 (100.0%) |
Housing Occupancy in Nome
Occupancy by Ownership in Nome
Of the total 1,173 dwellings in Nome, owner-occupied units account for 548 (46.7%), while renter-occupied units make up 625 (53.3%).
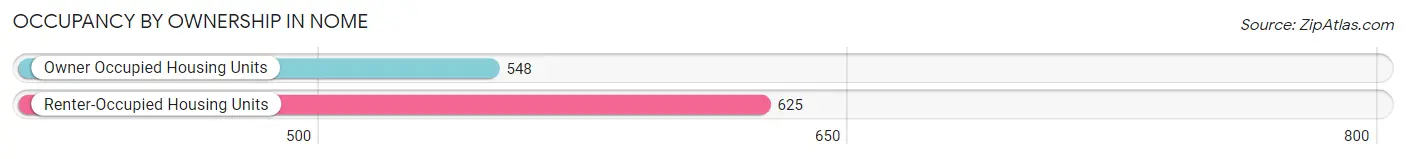
| Occupancy | # Housing Units | % Housing Units |
| Owner Occupied Housing Units | 548 | 46.7% |
| Renter-Occupied Housing Units | 625 | 53.3% |
| Total Occupied Housing Units | 1,173 | 100.0% |
Occupancy by Household Size in Nome
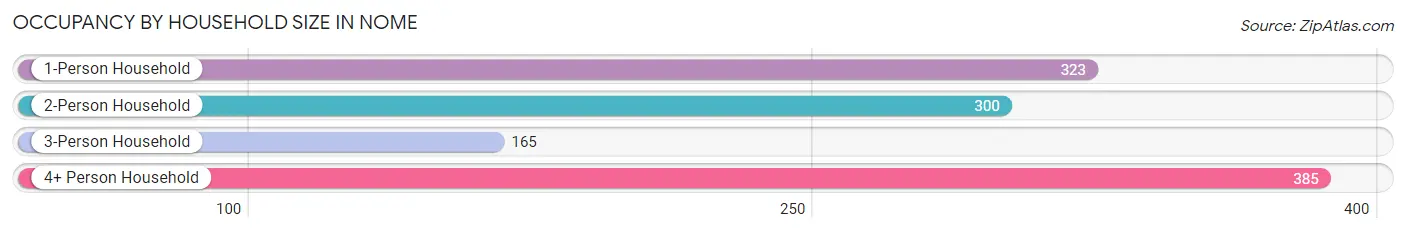
| Household Size | # Housing Units | % Housing Units |
| 1-Person Household | 323 | 27.5% |
| 2-Person Household | 300 | 25.6% |
| 3-Person Household | 165 | 14.1% |
| 4+ Person Household | 385 | 32.8% |
| Total Housing Units | 1,173 | 100.0% |
Occupancy by Ownership by Household Size in Nome
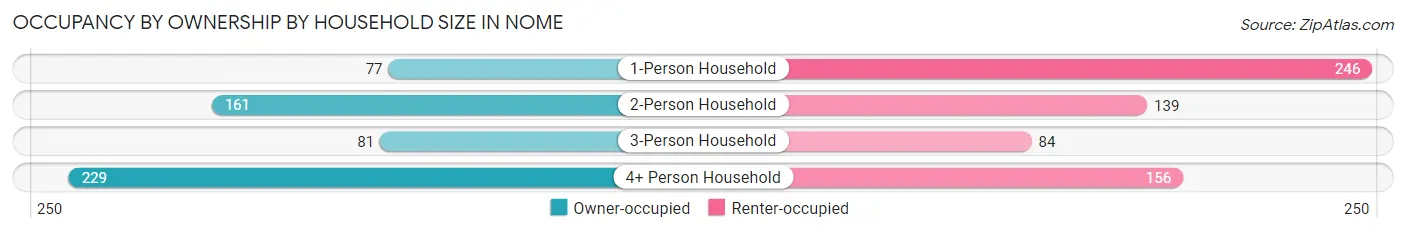
| Household Size | Owner-occupied | Renter-occupied |
| 1-Person Household | 77 (23.8%) | 246 (76.2%) |
| 2-Person Household | 161 (53.7%) | 139 (46.3%) |
| 3-Person Household | 81 (49.1%) | 84 (50.9%) |
| 4+ Person Household | 229 (59.5%) | 156 (40.5%) |
| Total Housing Units | 548 (46.7%) | 625 (53.3%) |
Occupancy by Educational Attainment in Nome
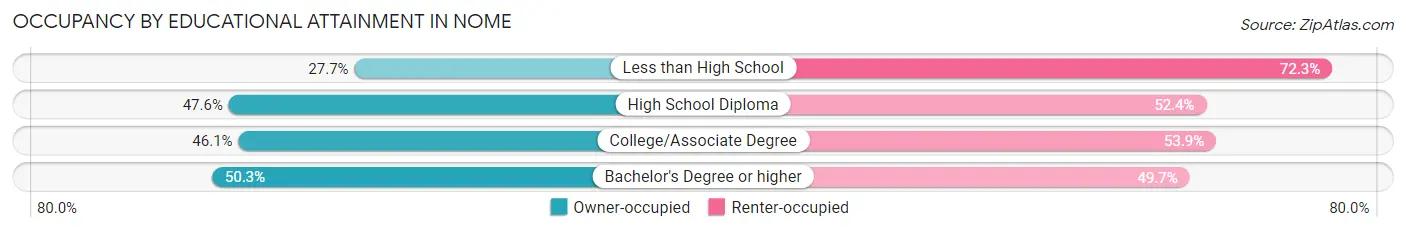
| Household Size | Owner-occupied | Renter-occupied |
| Less than High School | 18 (27.7%) | 47 (72.3%) |
| High School Diploma | 150 (47.6%) | 165 (52.4%) |
| College/Associate Degree | 206 (46.1%) | 241 (53.9%) |
| Bachelor's Degree or higher | 174 (50.3%) | 172 (49.7%) |
Occupancy by Age of Householder in Nome
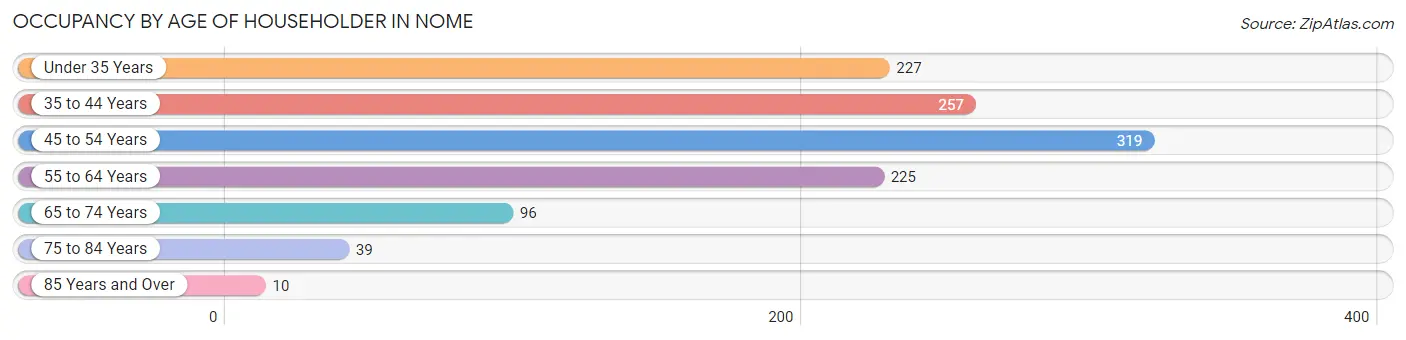
| Age Bracket | # Households | % Households |
| Under 35 Years | 227 | 19.4% |
| 35 to 44 Years | 257 | 21.9% |
| 45 to 54 Years | 319 | 27.2% |
| 55 to 64 Years | 225 | 19.2% |
| 65 to 74 Years | 96 | 8.2% |
| 75 to 84 Years | 39 | 3.3% |
| 85 Years and Over | 10 | 0.9% |
| Total | 1,173 | 100.0% |
Housing Finances in Nome
Median Income by Occupancy in Nome
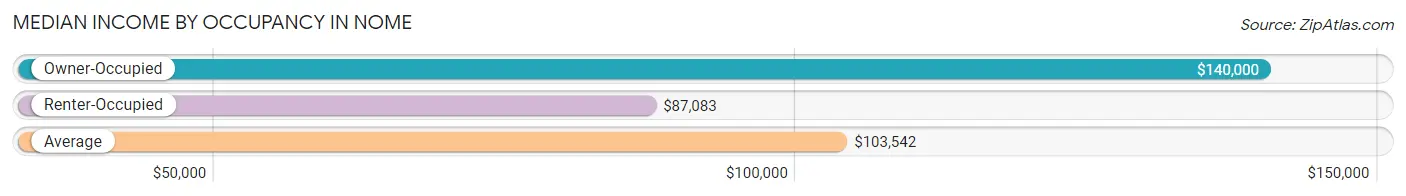
| Occupancy Type | # Households | Median Income |
| Owner-Occupied | 548 (46.7%) | $140,000 |
| Renter-Occupied | 625 (53.3%) | $87,083 |
| Average | 1,173 (100.0%) | $103,542 |
Occupancy by Householder Income Bracket in Nome
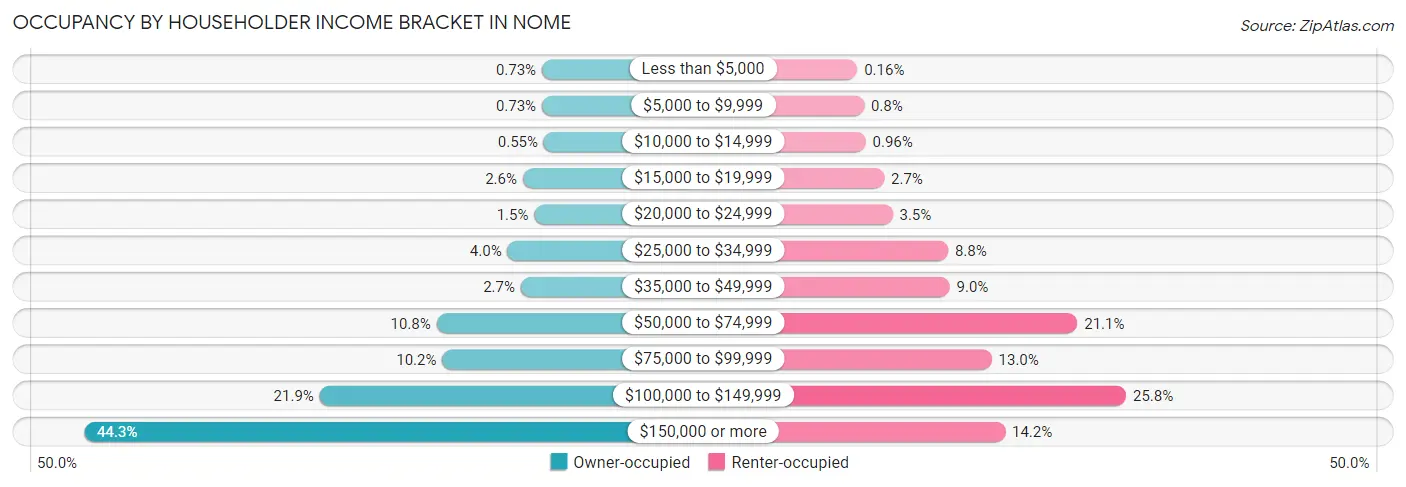
| Income Bracket | Owner-occupied | Renter-occupied |
| Less than $5,000 | 4 (0.7%) | 1 (0.2%) |
| $5,000 to $9,999 | 4 (0.7%) | 5 (0.8%) |
| $10,000 to $14,999 | 3 (0.5%) | 6 (1.0%) |
| $15,000 to $19,999 | 14 (2.5%) | 17 (2.7%) |
| $20,000 to $24,999 | 8 (1.5%) | 22 (3.5%) |
| $25,000 to $34,999 | 22 (4.0%) | 55 (8.8%) |
| $35,000 to $49,999 | 15 (2.7%) | 56 (9.0%) |
| $50,000 to $74,999 | 59 (10.8%) | 132 (21.1%) |
| $75,000 to $99,999 | 56 (10.2%) | 81 (13.0%) |
| $100,000 to $149,999 | 120 (21.9%) | 161 (25.8%) |
| $150,000 or more | 243 (44.3%) | 89 (14.2%) |
| Total | 548 (100.0%) | 625 (100.0%) |
Monthly Housing Cost Tiers in Nome
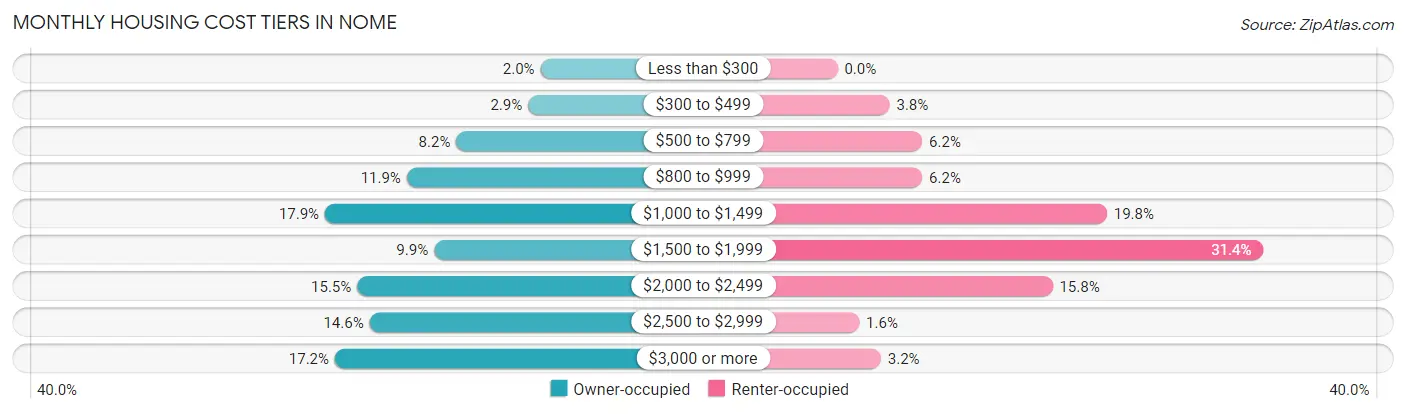
| Monthly Cost | Owner-occupied | Renter-occupied |
| Less than $300 | 11 (2.0%) | 0 (0.0%) |
| $300 to $499 | 16 (2.9%) | 24 (3.8%) |
| $500 to $799 | 45 (8.2%) | 39 (6.2%) |
| $800 to $999 | 65 (11.9%) | 39 (6.2%) |
| $1,000 to $1,499 | 98 (17.9%) | 124 (19.8%) |
| $1,500 to $1,999 | 54 (9.9%) | 196 (31.4%) |
| $2,000 to $2,499 | 85 (15.5%) | 99 (15.8%) |
| $2,500 to $2,999 | 80 (14.6%) | 10 (1.6%) |
| $3,000 or more | 94 (17.2%) | 20 (3.2%) |
| Total | 548 (100.0%) | 625 (100.0%) |
Physical Housing Characteristics in Nome
Housing Structures in Nome
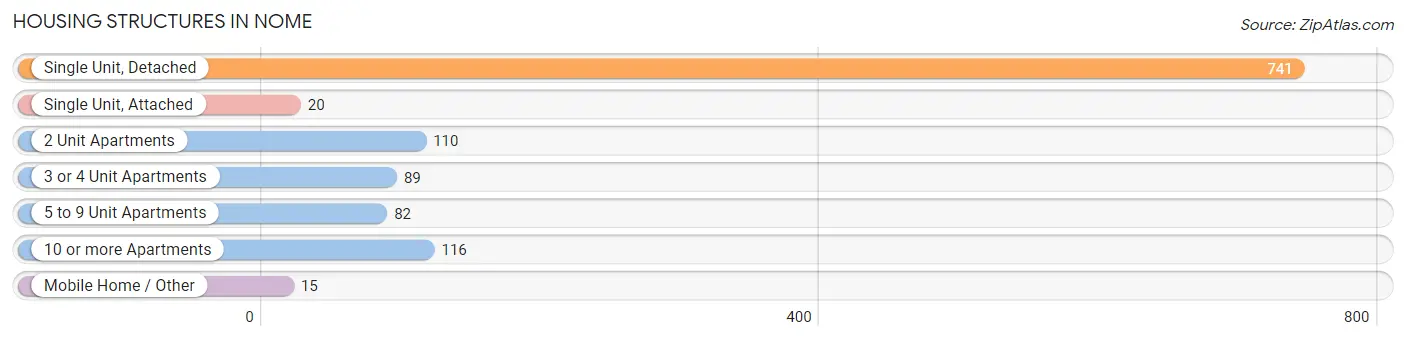
| Structure Type | # Housing Units | % Housing Units |
| Single Unit, Detached | 741 | 63.2% |
| Single Unit, Attached | 20 | 1.7% |
| 2 Unit Apartments | 110 | 9.4% |
| 3 or 4 Unit Apartments | 89 | 7.6% |
| 5 to 9 Unit Apartments | 82 | 7.0% |
| 10 or more Apartments | 116 | 9.9% |
| Mobile Home / Other | 15 | 1.3% |
| Total | 1,173 | 100.0% |
Housing Structures by Occupancy in Nome
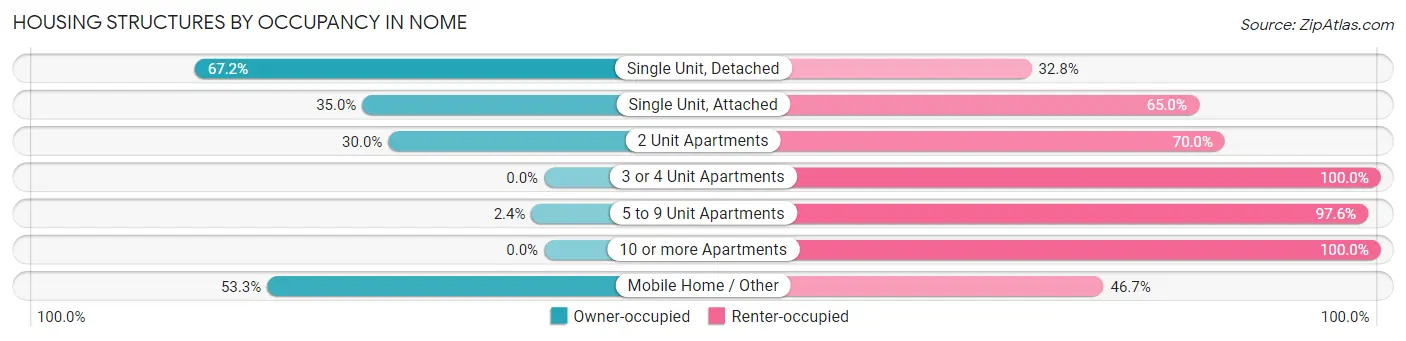
| Structure Type | Owner-occupied | Renter-occupied |
| Single Unit, Detached | 498 (67.2%) | 243 (32.8%) |
| Single Unit, Attached | 7 (35.0%) | 13 (65.0%) |
| 2 Unit Apartments | 33 (30.0%) | 77 (70.0%) |
| 3 or 4 Unit Apartments | 0 (0.0%) | 89 (100.0%) |
| 5 to 9 Unit Apartments | 2 (2.4%) | 80 (97.6%) |
| 10 or more Apartments | 0 (0.0%) | 116 (100.0%) |
| Mobile Home / Other | 8 (53.3%) | 7 (46.7%) |
| Total | 548 (46.7%) | 625 (53.3%) |
Housing Structures by Number of Rooms in Nome
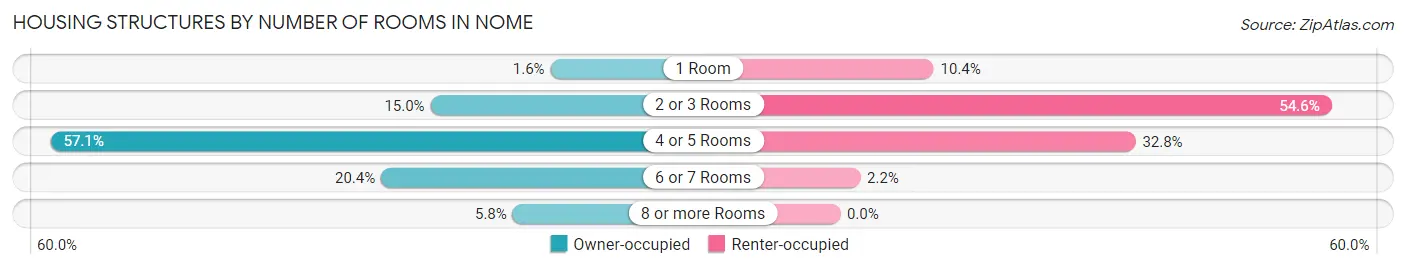
| Number of Rooms | Owner-occupied | Renter-occupied |
| 1 Room | 9 (1.6%) | 65 (10.4%) |
| 2 or 3 Rooms | 82 (15.0%) | 341 (54.6%) |
| 4 or 5 Rooms | 313 (57.1%) | 205 (32.8%) |
| 6 or 7 Rooms | 112 (20.4%) | 14 (2.2%) |
| 8 or more Rooms | 32 (5.8%) | 0 (0.0%) |
| Total | 548 (100.0%) | 625 (100.0%) |
Housing Structure by Heating Type in Nome
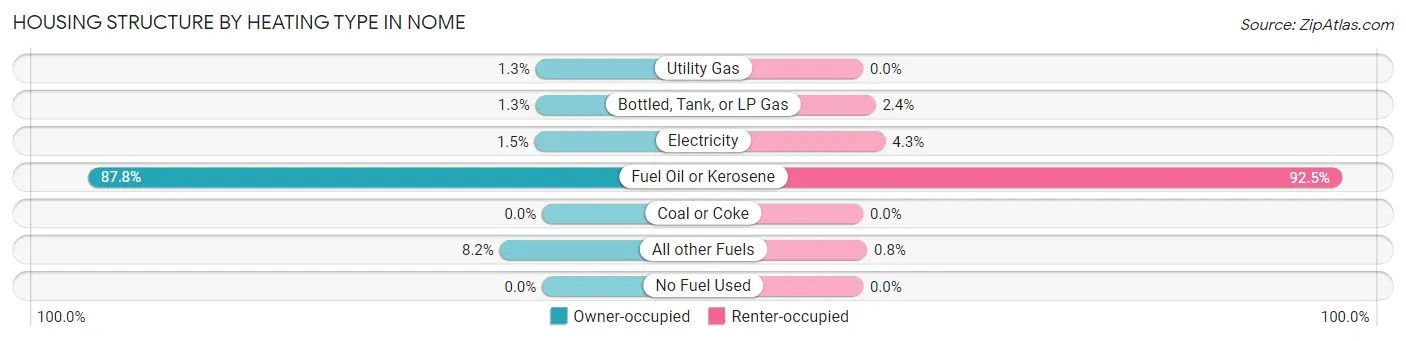
| Heating Type | Owner-occupied | Renter-occupied |
| Utility Gas | 7 (1.3%) | 0 (0.0%) |
| Bottled, Tank, or LP Gas | 7 (1.3%) | 15 (2.4%) |
| Electricity | 8 (1.5%) | 27 (4.3%) |
| Fuel Oil or Kerosene | 481 (87.8%) | 578 (92.5%) |
| Coal or Coke | 0 (0.0%) | 0 (0.0%) |
| All other Fuels | 45 (8.2%) | 5 (0.8%) |
| No Fuel Used | 0 (0.0%) | 0 (0.0%) |
| Total | 548 (100.0%) | 625 (100.0%) |
Household Vehicle Usage in Nome
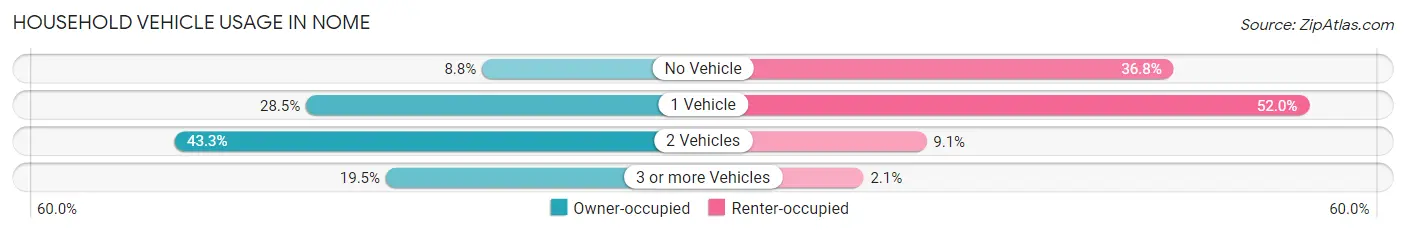
| Vehicles per Household | Owner-occupied | Renter-occupied |
| No Vehicle | 48 (8.8%) | 230 (36.8%) |
| 1 Vehicle | 156 (28.5%) | 325 (52.0%) |
| 2 Vehicles | 237 (43.2%) | 57 (9.1%) |
| 3 or more Vehicles | 107 (19.5%) | 13 (2.1%) |
| Total | 548 (100.0%) | 625 (100.0%) |
Real Estate & Mortgages in Nome
Real Estate and Mortgage Overview in Nome
| Characteristic | Without Mortgage | With Mortgage |
| Housing Units | 186 | 362 |
| Median Property Value | $278,000 | $367,400 |
| Median Household Income | $105,250 | $182 |
| Monthly Housing Costs | $850 | $94 |
| Real Estate Taxes | $2,355 | $14 |
Property Value by Mortgage Status in Nome
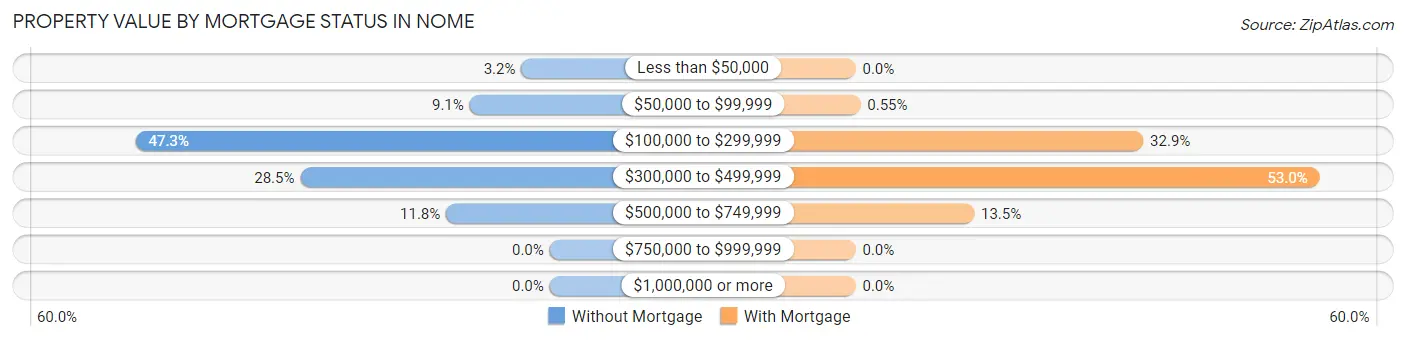
| Property Value | Without Mortgage | With Mortgage |
| Less than $50,000 | 6 (3.2%) | 0 (0.0%) |
| $50,000 to $99,999 | 17 (9.1%) | 2 (0.5%) |
| $100,000 to $299,999 | 88 (47.3%) | 119 (32.9%) |
| $300,000 to $499,999 | 53 (28.5%) | 192 (53.0%) |
| $500,000 to $749,999 | 22 (11.8%) | 49 (13.5%) |
| $750,000 to $999,999 | 0 (0.0%) | 0 (0.0%) |
| $1,000,000 or more | 0 (0.0%) | 0 (0.0%) |
| Total | 186 (100.0%) | 362 (100.0%) |
Household Income by Mortgage Status in Nome
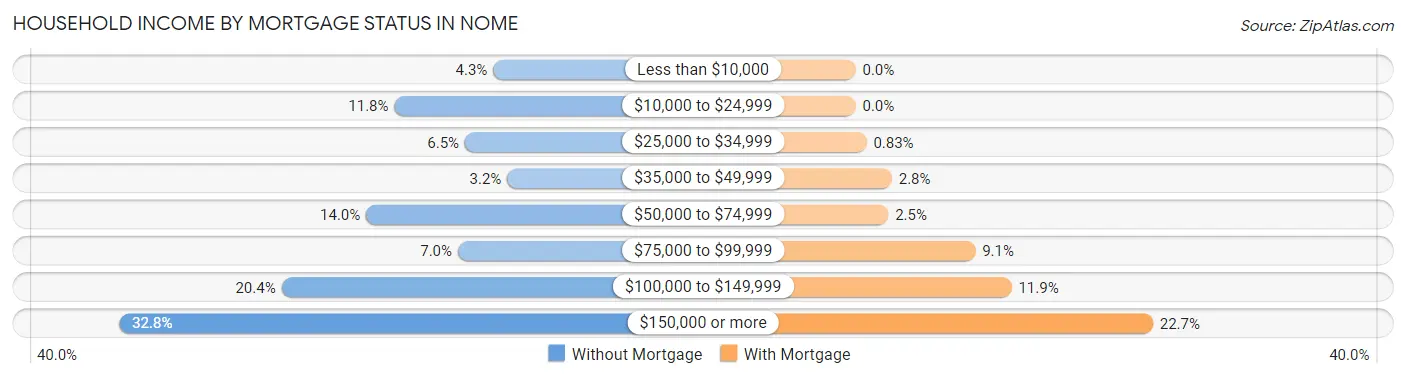
| Household Income | Without Mortgage | With Mortgage |
| Less than $10,000 | 8 (4.3%) | 0 (0.0%) |
| $10,000 to $24,999 | 22 (11.8%) | 0 (0.0%) |
| $25,000 to $34,999 | 12 (6.5%) | 3 (0.8%) |
| $35,000 to $49,999 | 6 (3.2%) | 10 (2.8%) |
| $50,000 to $74,999 | 26 (14.0%) | 9 (2.5%) |
| $75,000 to $99,999 | 13 (7.0%) | 33 (9.1%) |
| $100,000 to $149,999 | 38 (20.4%) | 43 (11.9%) |
| $150,000 or more | 61 (32.8%) | 82 (22.7%) |
| Total | 186 (100.0%) | 362 (100.0%) |
Property Value to Household Income Ratio in Nome
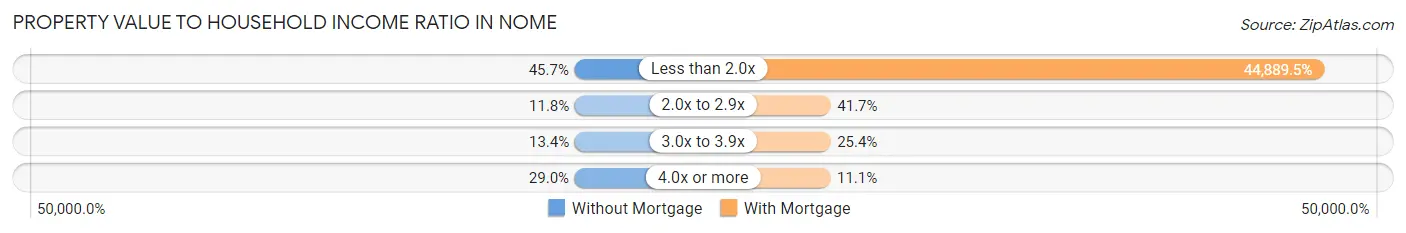
| Value-to-Income Ratio | Without Mortgage | With Mortgage |
| Less than 2.0x | 85 (45.7%) | 162,500 (44,889.5%) |
| 2.0x to 2.9x | 22 (11.8%) | 151 (41.7%) |
| 3.0x to 3.9x | 25 (13.4%) | 92 (25.4%) |
| 4.0x or more | 54 (29.0%) | 40 (11.1%) |
| Total | 186 (100.0%) | 362 (100.0%) |
Real Estate Taxes by Mortgage Status in Nome
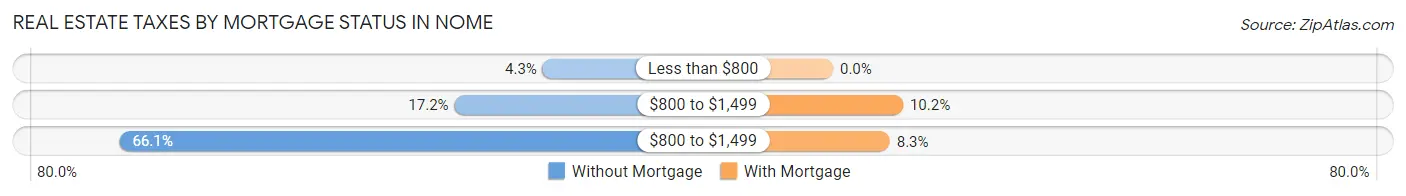
| Property Taxes | Without Mortgage | With Mortgage |
| Less than $800 | 8 (4.3%) | 0 (0.0%) |
| $800 to $1,499 | 32 (17.2%) | 37 (10.2%) |
| $800 to $1,499 | 123 (66.1%) | 30 (8.3%) |
| Total | 186 (100.0%) | 362 (100.0%) |
Health & Disability in Nome
Health Insurance Coverage by Age in Nome
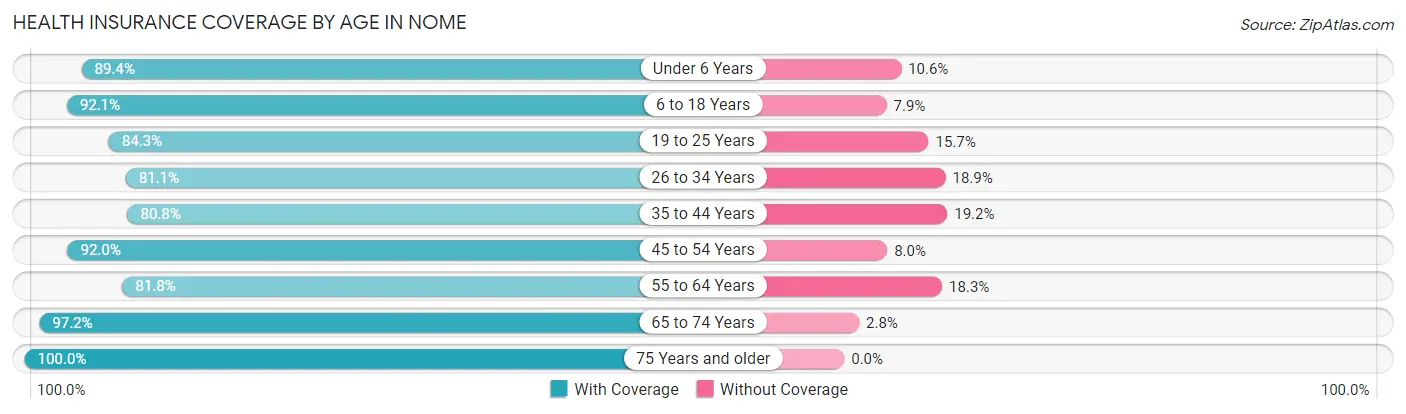
| Age Bracket | With Coverage | Without Coverage |
| Under 6 Years | 337 (89.4%) | 40 (10.6%) |
| 6 to 18 Years | 712 (92.1%) | 61 (7.9%) |
| 19 to 25 Years | 311 (84.3%) | 58 (15.7%) |
| 26 to 34 Years | 378 (81.1%) | 88 (18.9%) |
| 35 to 44 Years | 391 (80.8%) | 93 (19.2%) |
| 45 to 54 Years | 448 (92.0%) | 39 (8.0%) |
| 55 to 64 Years | 318 (81.8%) | 71 (18.2%) |
| 65 to 74 Years | 141 (97.2%) | 4 (2.8%) |
| 75 Years and older | 59 (100.0%) | 0 (0.0%) |
| Total | 3,095 (87.2%) | 454 (12.8%) |
Health Insurance Coverage by Citizenship Status in Nome
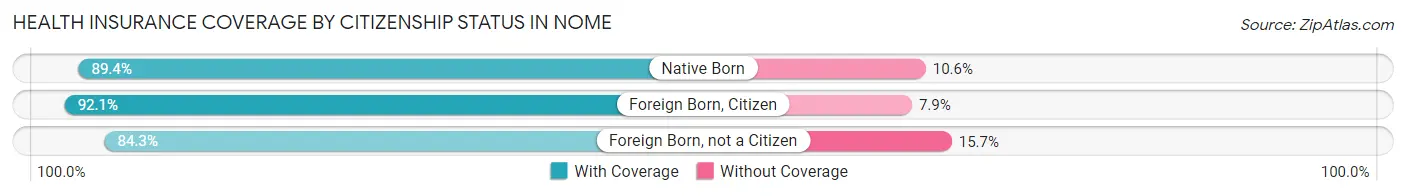
| Citizenship Status | With Coverage | Without Coverage |
| Native Born | 337 (89.4%) | 40 (10.6%) |
| Foreign Born, Citizen | 712 (92.1%) | 61 (7.9%) |
| Foreign Born, not a Citizen | 311 (84.3%) | 58 (15.7%) |
Health Insurance Coverage by Household Income in Nome
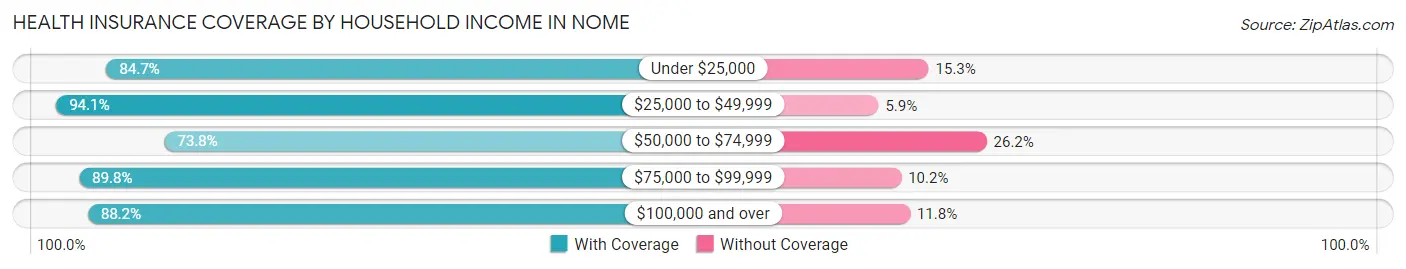
| Household Income | With Coverage | Without Coverage |
| Under $25,000 | 127 (84.7%) | 23 (15.3%) |
| $25,000 to $49,999 | 222 (94.1%) | 14 (5.9%) |
| $50,000 to $74,999 | 341 (73.8%) | 121 (26.2%) |
| $75,000 to $99,999 | 352 (89.8%) | 40 (10.2%) |
| $100,000 and over | 1,907 (88.2%) | 256 (11.8%) |
Public vs Private Health Insurance Coverage by Age in Nome
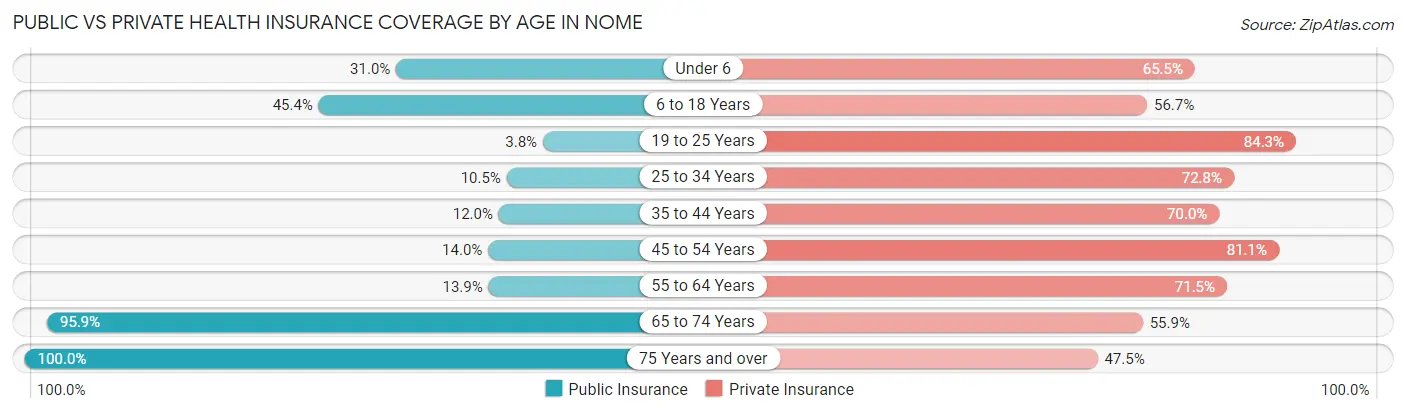
| Age Bracket | Public Insurance | Private Insurance |
| Under 6 | 117 (31.0%) | 247 (65.5%) |
| 6 to 18 Years | 351 (45.4%) | 438 (56.7%) |
| 19 to 25 Years | 14 (3.8%) | 311 (84.3%) |
| 25 to 34 Years | 49 (10.5%) | 339 (72.8%) |
| 35 to 44 Years | 58 (12.0%) | 339 (70.0%) |
| 45 to 54 Years | 68 (14.0%) | 395 (81.1%) |
| 55 to 64 Years | 54 (13.9%) | 278 (71.5%) |
| 65 to 74 Years | 139 (95.9%) | 81 (55.9%) |
| 75 Years and over | 59 (100.0%) | 28 (47.5%) |
| Total | 909 (25.6%) | 2,456 (69.2%) |
Disability Status by Sex by Age in Nome
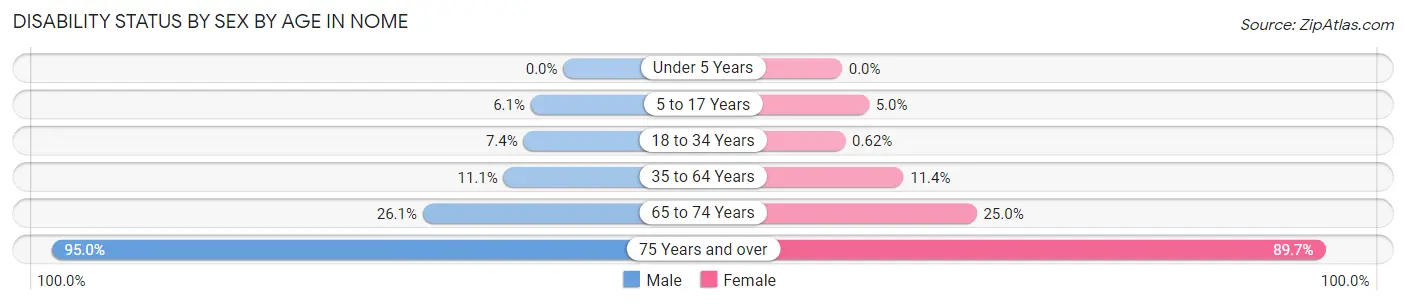
| Age Bracket | Male | Female |
| Under 5 Years | 0 (0.0%) | 0 (0.0%) |
| 5 to 17 Years | 23 (6.0%) | 20 (5.0%) |
| 18 to 34 Years | 28 (7.4%) | 3 (0.6%) |
| 35 to 64 Years | 80 (11.1%) | 73 (11.4%) |
| 65 to 74 Years | 18 (26.1%) | 19 (25.0%) |
| 75 Years and over | 19 (95.0%) | 35 (89.7%) |
Disability Class by Sex by Age in Nome
Disability Class: Hearing Difficulty
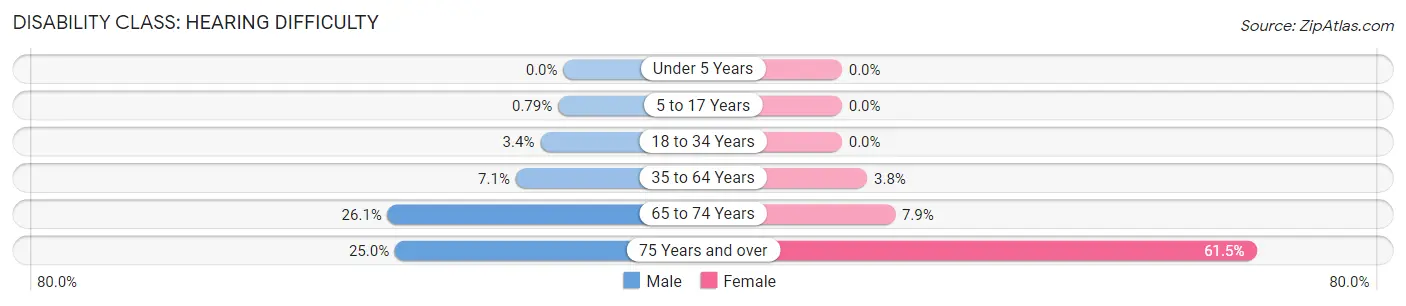
| Age Bracket | Male | Female |
| Under 5 Years | 0 (0.0%) | 0 (0.0%) |
| 5 to 17 Years | 3 (0.8%) | 0 (0.0%) |
| 18 to 34 Years | 13 (3.4%) | 0 (0.0%) |
| 35 to 64 Years | 51 (7.1%) | 24 (3.8%) |
| 65 to 74 Years | 18 (26.1%) | 6 (7.9%) |
| 75 Years and over | 5 (25.0%) | 24 (61.5%) |
Disability Class: Vision Difficulty
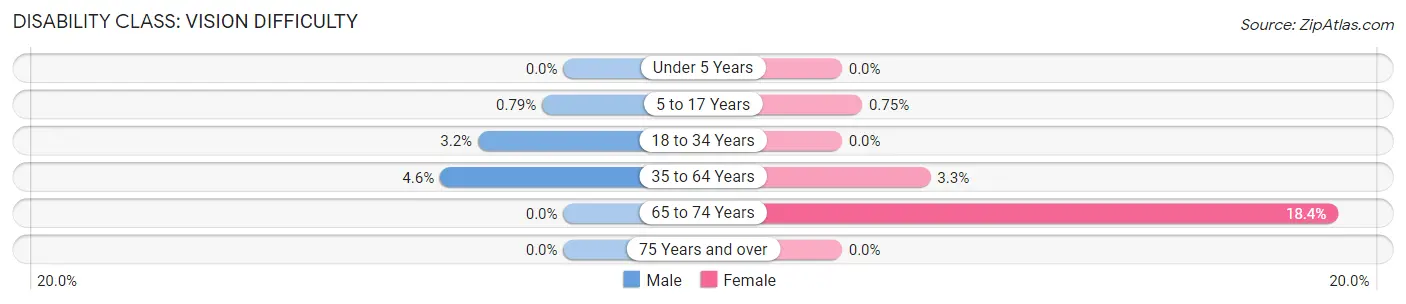
| Age Bracket | Male | Female |
| Under 5 Years | 0 (0.0%) | 0 (0.0%) |
| 5 to 17 Years | 3 (0.8%) | 3 (0.7%) |
| 18 to 34 Years | 12 (3.2%) | 0 (0.0%) |
| 35 to 64 Years | 33 (4.6%) | 21 (3.3%) |
| 65 to 74 Years | 0 (0.0%) | 14 (18.4%) |
| 75 Years and over | 0 (0.0%) | 0 (0.0%) |
Disability Class: Cognitive Difficulty
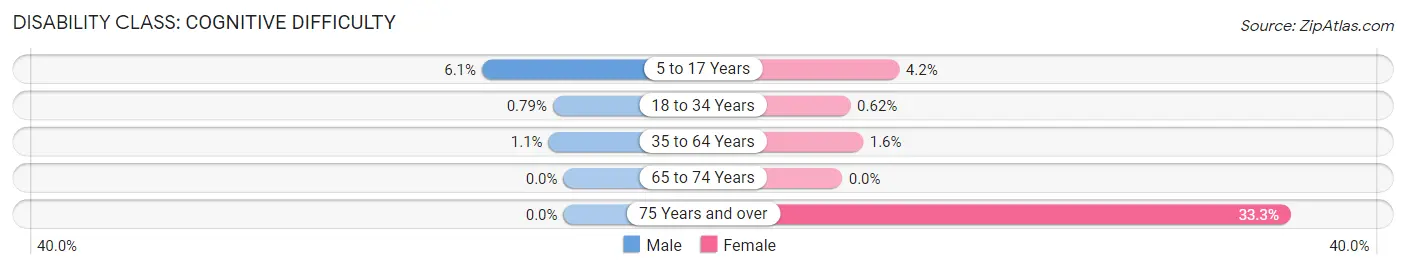
| Age Bracket | Male | Female |
| 5 to 17 Years | 23 (6.0%) | 17 (4.2%) |
| 18 to 34 Years | 3 (0.8%) | 3 (0.6%) |
| 35 to 64 Years | 8 (1.1%) | 10 (1.6%) |
| 65 to 74 Years | 0 (0.0%) | 0 (0.0%) |
| 75 Years and over | 0 (0.0%) | 13 (33.3%) |
Disability Class: Ambulatory Difficulty
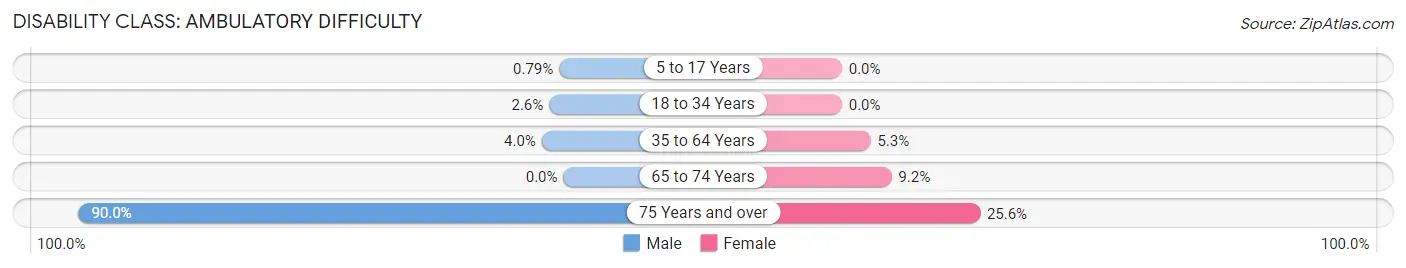
| Age Bracket | Male | Female |
| 5 to 17 Years | 3 (0.8%) | 0 (0.0%) |
| 18 to 34 Years | 10 (2.6%) | 0 (0.0%) |
| 35 to 64 Years | 29 (4.0%) | 34 (5.3%) |
| 65 to 74 Years | 0 (0.0%) | 7 (9.2%) |
| 75 Years and over | 18 (90.0%) | 10 (25.6%) |
Disability Class: Self-Care Difficulty
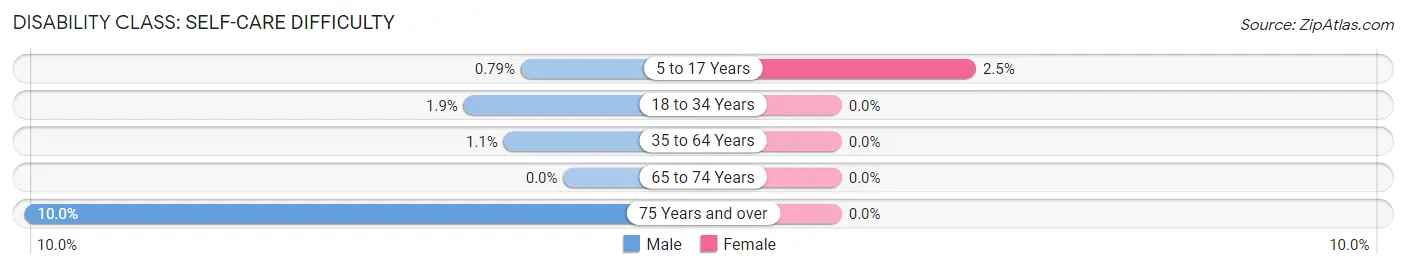
| Age Bracket | Male | Female |
| 5 to 17 Years | 3 (0.8%) | 10 (2.5%) |
| 18 to 34 Years | 7 (1.8%) | 0 (0.0%) |
| 35 to 64 Years | 8 (1.1%) | 0 (0.0%) |
| 65 to 74 Years | 0 (0.0%) | 0 (0.0%) |
| 75 Years and over | 2 (10.0%) | 0 (0.0%) |
Technology Access in Nome
Computing Device Access in Nome
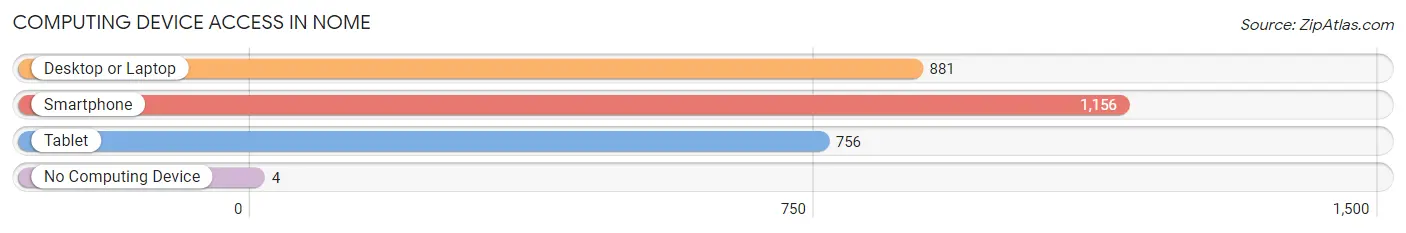
| Device Type | # Households | % Households |
| Desktop or Laptop | 881 | 75.1% |
| Smartphone | 1,156 | 98.6% |
| Tablet | 756 | 64.4% |
| No Computing Device | 4 | 0.3% |
| Total | 1,173 | 100.0% |
Internet Access in Nome
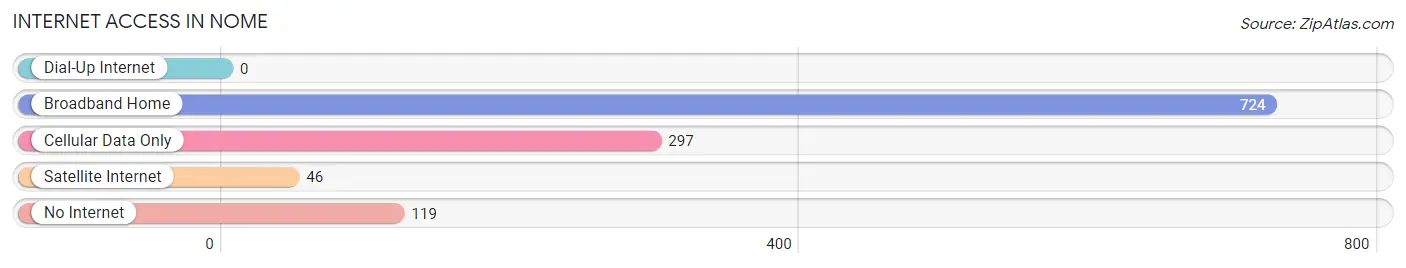
| Internet Type | # Households | % Households |
| Dial-Up Internet | 0 | 0.0% |
| Broadband Home | 724 | 61.7% |
| Cellular Data Only | 297 | 25.3% |
| Satellite Internet | 46 | 3.9% |
| No Internet | 119 | 10.1% |
| Total | 1,173 | 100.0% |
Nome Summary
Nome, Alaska is a city located in the western region of the state, on the Seward Peninsula. It is the largest city in the region, with a population of 3,788 as of the 2010 census. The city is located on the Bering Sea, and is the westernmost city in the United States.
History
The area around Nome has been inhabited for thousands of years by the Inupiat people. The first Europeans to visit the area were Russian explorers in the late 18th century. In 1898, gold was discovered in the area, and a gold rush ensued. Thousands of prospectors flocked to the area, and the city of Nome was founded in 1901. The city quickly grew, and by 1910, it had a population of over 10,000.
The gold rush was short-lived, however, and by the 1920s, the population had declined to just over 4,000. The city continued to decline until World War II, when the military established a base in the area. This brought an influx of people and money to the area, and the population began to grow again.
Geography
Nome is located on the Seward Peninsula, in the western region of Alaska. It is situated on the Bering Sea, and is the westernmost city in the United States. The city is located on a flat plain, and is surrounded by mountains. The climate is subarctic, with cold winters and mild summers.
Economy
The economy of Nome is largely based on fishing, mining, and tourism. Fishing is the largest industry in the area, with salmon, crab, and halibut being the main catches. Mining is also important, with gold, silver, and other minerals being mined in the area. Tourism is also a major industry, with visitors coming to the area to experience the unique culture and scenery.
Demographics
As of the 2010 census, the population of Nome was 3,788. The racial makeup of the city was 75.3% White, 11.2% Native American, 5.3% Asian, 4.2% from other races, and 4.0% from two or more races. The median household income was $50,945, and the median family income was $60,945. The per capita income was $25,945.
Nome is a unique city, with a rich history and culture. It is a great place to visit, and offers a variety of activities and attractions. The economy is largely based on fishing, mining, and tourism, and the population is diverse and welcoming. Nome is a great place to live, work, and visit.
Common Questions
What is Per Capita Income in Nome?
Per Capita income in Nome is $41,722.
What is the Median Family Income in Nome?
Median Family Income in Nome is $125,250.
What is the Median Household income in Nome?
Median Household Income in Nome is $103,542.
What is Income or Wage Gap in Nome?
Income or Wage Gap in Nome is 0.2%.
Women in Nome earn 99.8 cents for every dollar earned by a man.
What is Inequality or Gini Index in Nome?
Inequality or Gini Index in Nome is 0.38.
What is the Total Population of Nome?
Total Population of Nome is 3,710.
What is the Total Male Population of Nome?
Total Male Population of Nome is 1,858.
What is the Total Female Population of Nome?
Total Female Population of Nome is 1,852.
What is the Ratio of Males per 100 Females in Nome?
There are 100.32 Males per 100 Females in Nome.
What is the Ratio of Females per 100 Males in Nome?
There are 99.68 Females per 100 Males in Nome.
What is the Median Population Age in Nome?
Median Population Age in Nome is 31.0 Years.
What is the Average Family Size in Nome
Average Family Size in Nome is 3.5 People.
What is the Average Household Size in Nome
Average Household Size in Nome is 2.9 People.
How Large is the Labor Force in Nome?
There are 2,004 People in the Labor Forcein in Nome.
What is the Percentage of People in the Labor Force in Nome?
74.4% of People are in the Labor Force in Nome.
What is the Unemployment Rate in Nome?
Unemployment Rate in Nome is 8.4%.