Laporte, CO Map & Demographics
Laporte Map
Laporte Overview
$37,947
PER CAPITA INCOME
$80,903
AVG FAMILY INCOME
$69,732
AVG HOUSEHOLD INCOME
40.0%
WAGE / INCOME GAP [ % ]
60.0¢/ $1
WAGE / INCOME GAP [ $ ]
0.39
INEQUALITY / GINI INDEX
2,233
TOTAL POPULATION
1,100
MALE POPULATION
1,133
FEMALE POPULATION
97.09
MALES / 100 FEMALES
103.00
FEMALES / 100 MALES
49.3
MEDIAN AGE
2.4
AVG FAMILY SIZE
2.1
AVG HOUSEHOLD SIZE
1,296
LABOR FORCE [ PEOPLE ]
67.0%
PERCENT IN LABOR FORCE
3.4%
UNEMPLOYMENT RATE
Laporte Zip Codes
Laporte Area Codes
Income in Laporte
Income Overview in Laporte
Per Capita Income in Laporte is $37,947, while median incomes of families and households are $80,903 and $69,732 respectively.
| Characteristic | Number | Measure |
| Per Capita Income | 2,233 | $37,947 |
| Median Family Income | 669 | $80,903 |
| Mean Family Income | 669 | $91,435 |
| Median Household Income | 1,082 | $69,732 |
| Mean Household Income | 1,082 | $83,639 |
| Income Deficit | 669 | $0 |
| Wage / Income Gap (%) | 2,233 | 39.97% |
| Wage / Income Gap ($) | 2,233 | 60.03¢ per $1 |
| Gini / Inequality Index | 2,233 | 0.39 |
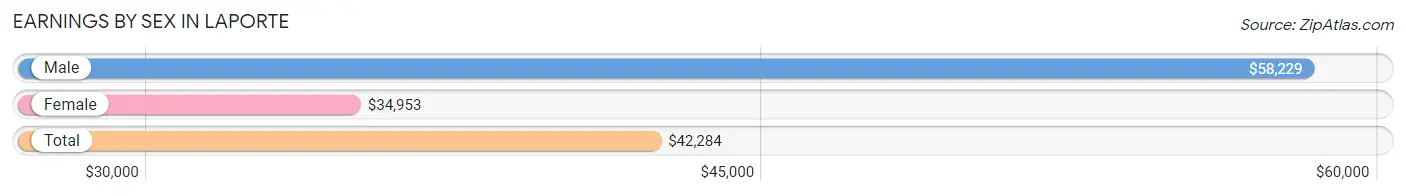
Earnings by Sex in Laporte
Average Earnings in Laporte are $42,284, $58,229 for men and $34,953 for women, a difference of 40.0%.
| Sex | Number | Average Earnings |
| Male | 743 (56.1%) | $58,229 |
| Female | 582 (43.9%) | $34,953 |
| Total | 1,325 (100.0%) | $42,284 |
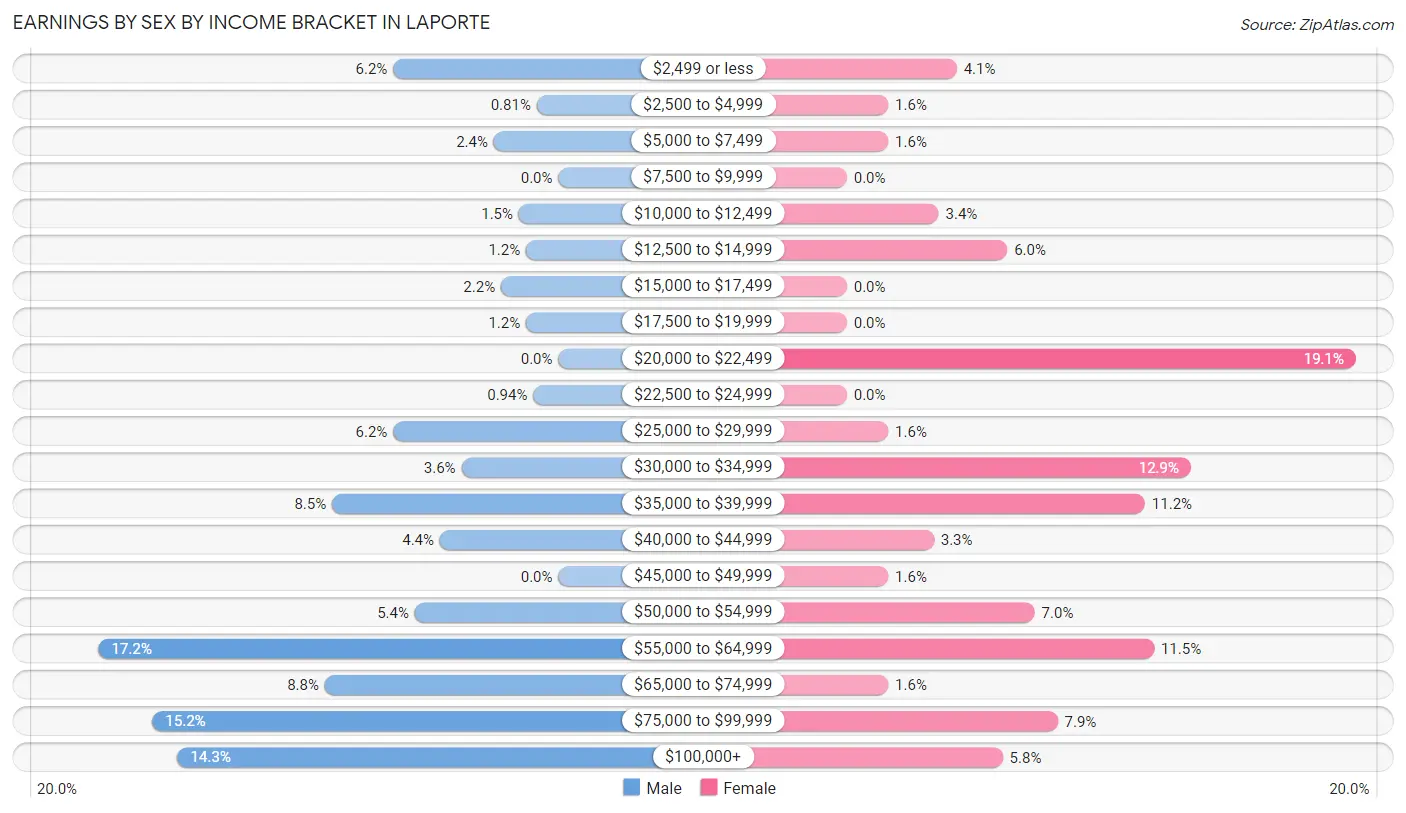
Earnings by Sex by Income Bracket in Laporte
The most common earnings brackets in Laporte are $55,000 to $64,999 for men (128 | 17.2%) and $20,000 to $22,499 for women (111 | 19.1%).
| Income | Male | Female |
| $2,499 or less | 46 (6.2%) | 24 (4.1%) |
| $2,500 to $4,999 | 6 (0.8%) | 9 (1.5%) |
| $5,000 to $7,499 | 18 (2.4%) | 9 (1.5%) |
| $7,500 to $9,999 | 0 (0.0%) | 0 (0.0%) |
| $10,000 to $12,499 | 11 (1.5%) | 20 (3.4%) |
| $12,500 to $14,999 | 9 (1.2%) | 35 (6.0%) |
| $15,000 to $17,499 | 16 (2.1%) | 0 (0.0%) |
| $17,500 to $19,999 | 9 (1.2%) | 0 (0.0%) |
| $20,000 to $22,499 | 0 (0.0%) | 111 (19.1%) |
| $22,500 to $24,999 | 7 (0.9%) | 0 (0.0%) |
| $25,000 to $29,999 | 46 (6.2%) | 9 (1.5%) |
| $30,000 to $34,999 | 27 (3.6%) | 75 (12.9%) |
| $35,000 to $39,999 | 63 (8.5%) | 65 (11.2%) |
| $40,000 to $44,999 | 33 (4.4%) | 19 (3.3%) |
| $45,000 to $49,999 | 0 (0.0%) | 9 (1.5%) |
| $50,000 to $54,999 | 40 (5.4%) | 41 (7.0%) |
| $55,000 to $64,999 | 128 (17.2%) | 67 (11.5%) |
| $65,000 to $74,999 | 65 (8.7%) | 9 (1.5%) |
| $75,000 to $99,999 | 113 (15.2%) | 46 (7.9%) |
| $100,000+ | 106 (14.3%) | 34 (5.8%) |
| Total | 743 (100.0%) | 582 (100.0%) |
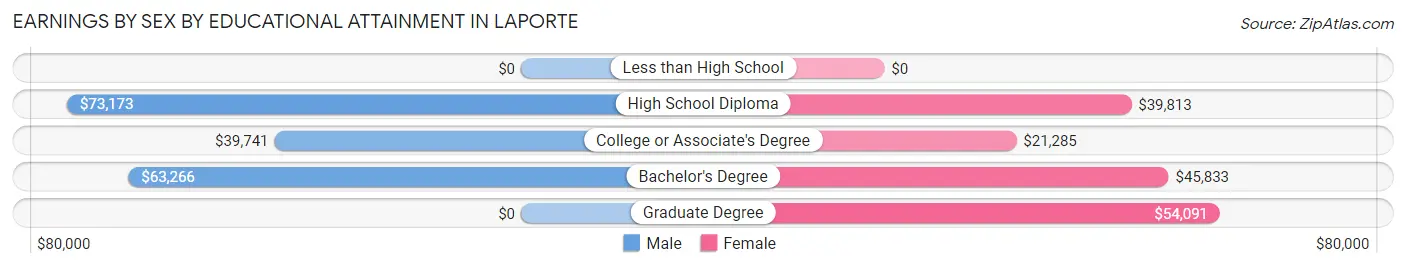
Earnings by Sex by Educational Attainment in Laporte
Average earnings in Laporte are $58,229 for men and $38,430 for women, a difference of 34.0%. Men with an educational attainment of high school diploma enjoy the highest average annual earnings of $73,173, while those with college or associate's degree education earn the least with $39,741. Women with an educational attainment of graduate degree earn the most with the average annual earnings of $54,091, while those with college or associate's degree education have the smallest earnings of $21,285.
| Educational Attainment | Male Income | Female Income |
| Less than High School | - | - |
| High School Diploma | $73,173 | $39,813 |
| College or Associate's Degree | $39,741 | $21,285 |
| Bachelor's Degree | $63,266 | $45,833 |
| Graduate Degree | - | - |
| Total | $58,229 | $38,430 |
Family Income in Laporte
Family Income Brackets in Laporte
According to the Laporte family income data, there are 166 families falling into the $100,000 to $149,999 income range, which is the most common income bracket and makes up 24.8% of all families.
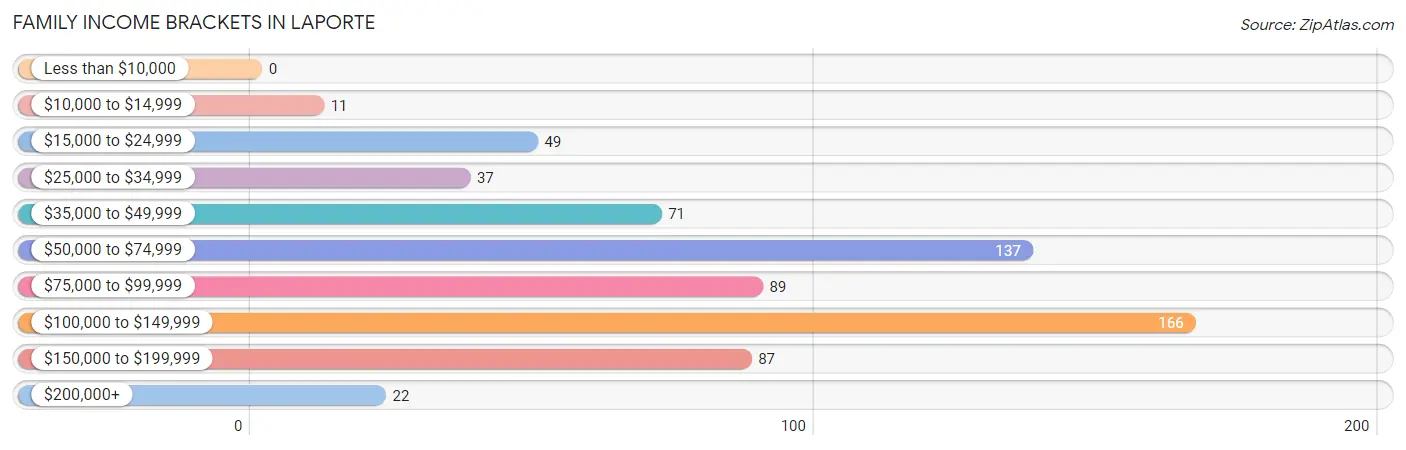
| Income Bracket | # Families | % Families |
| Less than $10,000 | 0 | 0.0% |
| $10,000 to $14,999 | 11 | 1.6% |
| $15,000 to $24,999 | 49 | 7.3% |
| $25,000 to $34,999 | 37 | 5.5% |
| $35,000 to $49,999 | 71 | 10.6% |
| $50,000 to $74,999 | 137 | 20.5% |
| $75,000 to $99,999 | 89 | 13.3% |
| $100,000 to $149,999 | 166 | 24.8% |
| $150,000 to $199,999 | 87 | 13.0% |
| $200,000+ | 22 | 3.3% |
Family Income by Famaliy Size in Laporte
3-person families (131 | 19.6%) account for the highest median family income in Laporte with $114,837 per family, while 3-person families (131 | 19.6%) have the highest median income of $38,279 per family member.
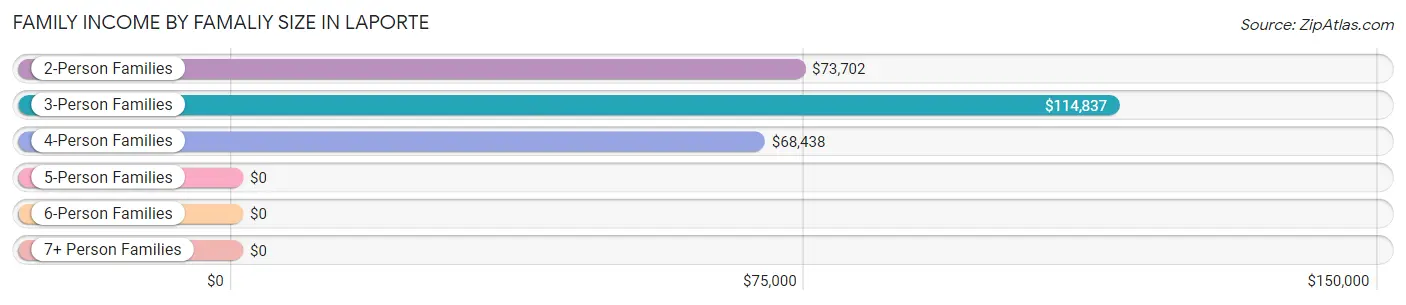
| Income Bracket | # Families | Median Income |
| 2-Person Families | 441 (65.9%) | $73,702 |
| 3-Person Families | 131 (19.6%) | $114,837 |
| 4-Person Families | 46 (6.9%) | $68,438 |
| 5-Person Families | 51 (7.6%) | $0 |
| 6-Person Families | 0 (0.0%) | $0 |
| 7+ Person Families | 0 (0.0%) | $0 |
| Total | 669 (100.0%) | $80,903 |
Family Income by Number of Earners in Laporte
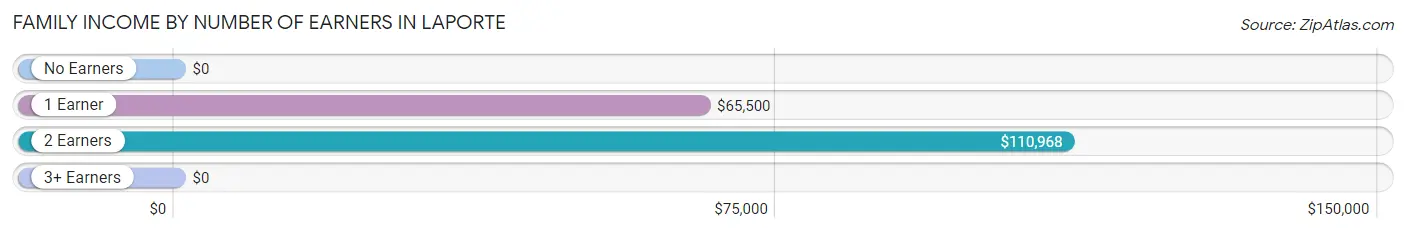
| Number of Earners | # Families | Median Income |
| No Earners | 54 (8.1%) | $0 |
| 1 Earner | 304 (45.4%) | $65,500 |
| 2 Earners | 302 (45.1%) | $110,968 |
| 3+ Earners | 9 (1.3%) | $0 |
| Total | 669 (100.0%) | $80,903 |
Household Income in Laporte
Household Income Brackets in Laporte
With 201 households falling in the category, the $50,000 to $74,999 income range is the most frequent in Laporte, accounting for 18.6% of all households. In contrast, only 23 households (2.1%) fall into the $10,000 to $14,999 income bracket, making it the least populous group.
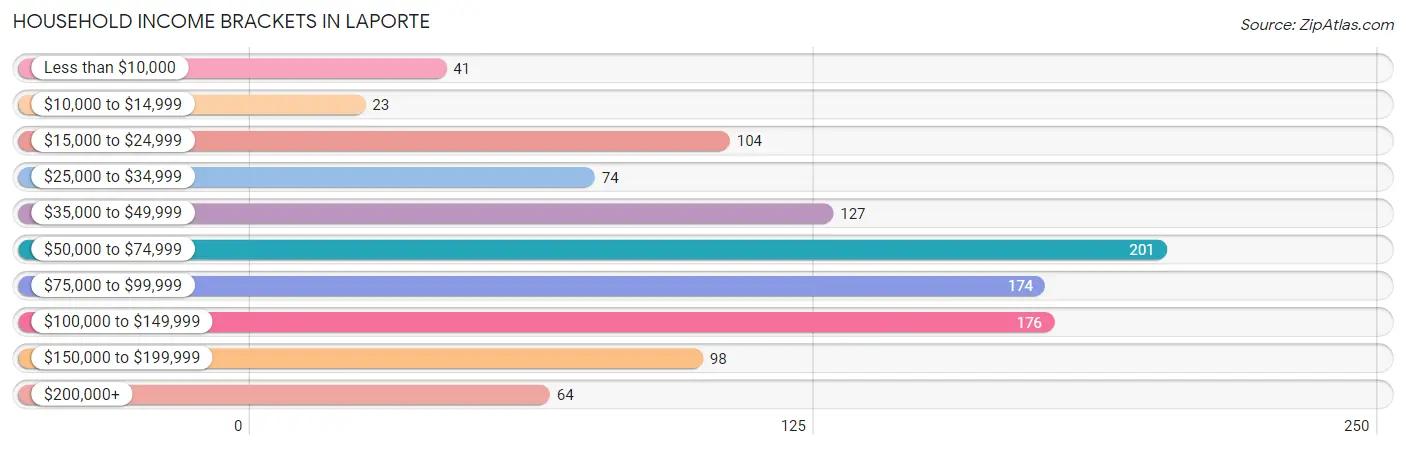
| Income Bracket | # Households | % Households |
| Less than $10,000 | 41 | 3.8% |
| $10,000 to $14,999 | 23 | 2.1% |
| $15,000 to $24,999 | 104 | 9.6% |
| $25,000 to $34,999 | 74 | 6.8% |
| $35,000 to $49,999 | 127 | 11.7% |
| $50,000 to $74,999 | 201 | 18.6% |
| $75,000 to $99,999 | 174 | 16.1% |
| $100,000 to $149,999 | 176 | 16.3% |
| $150,000 to $199,999 | 98 | 9.1% |
| $200,000+ | 64 | 5.9% |
Household Income by Householder Age in Laporte
The median household income in Laporte is $69,732, with the highest median household income of $80,764 found in the 25 to 44 years age bracket for the primary householder. A total of 328 households (30.3%) fall into this category. Meanwhile, the 15 to 24 years age bracket for the primary householder has the lowest median household income of $0, with 68 households (6.3%) in this group.
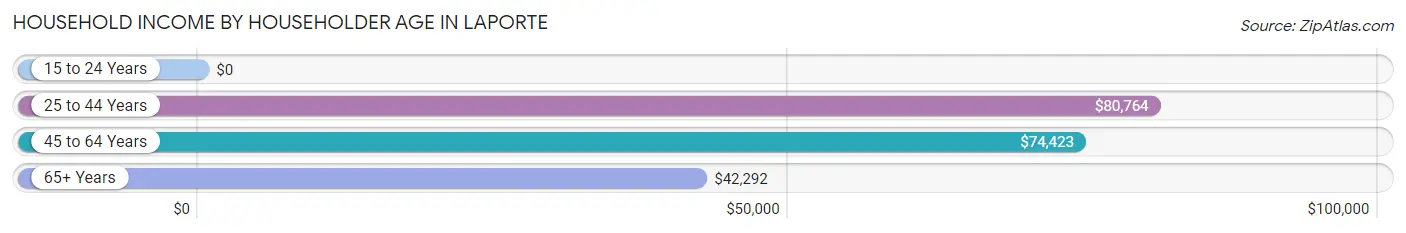
| Income Bracket | # Households | Median Income |
| 15 to 24 Years | 68 (6.3%) | $0 |
| 25 to 44 Years | 328 (30.3%) | $80,764 |
| 45 to 64 Years | 422 (39.0%) | $74,423 |
| 65+ Years | 264 (24.4%) | $42,292 |
| Total | 1,082 (100.0%) | $69,732 |
Poverty in Laporte
Income Below Poverty by Sex and Age in Laporte
With 8.8% poverty level for males and 7.7% for females among the residents of Laporte, 65 to 74 year old males and 55 to 64 year old females are the most vulnerable to poverty, with 47 males (25.8%) and 51 females (22.8%) in their respective age groups living below the poverty level.
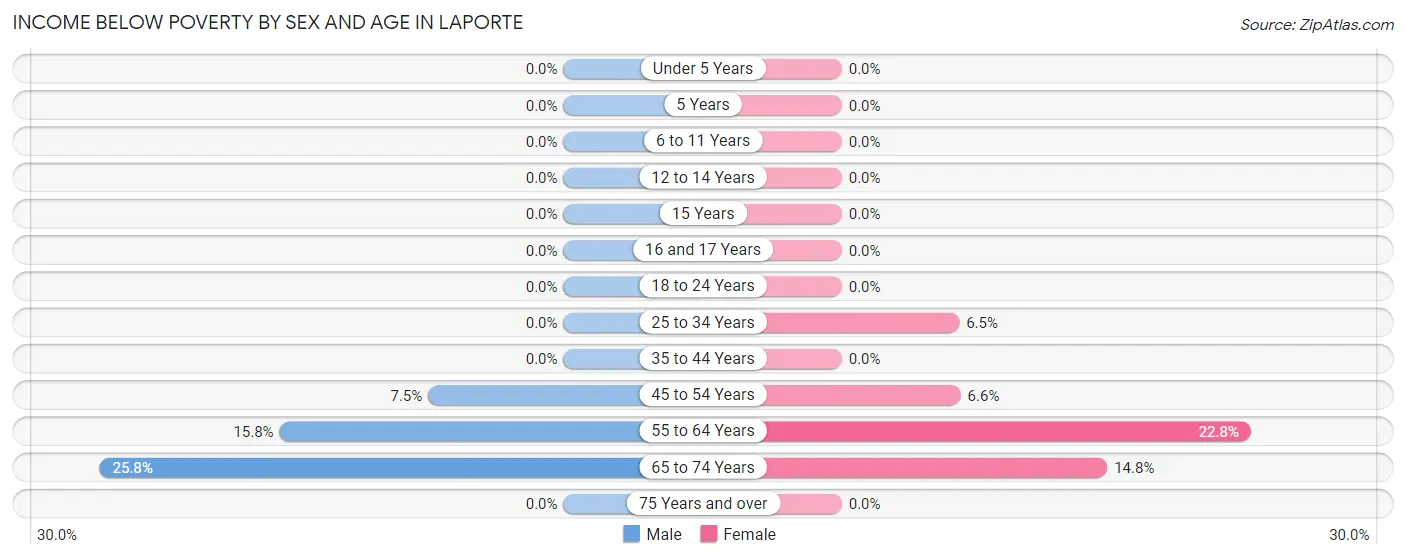
| Age Bracket | Male | Female |
| Under 5 Years | 0 (0.0%) | 0 (0.0%) |
| 5 Years | 0 (0.0%) | 0 (0.0%) |
| 6 to 11 Years | 0 (0.0%) | 0 (0.0%) |
| 12 to 14 Years | 0 (0.0%) | 0 (0.0%) |
| 15 Years | 0 (0.0%) | 0 (0.0%) |
| 16 and 17 Years | 0 (0.0%) | 0 (0.0%) |
| 18 to 24 Years | 0 (0.0%) | 0 (0.0%) |
| 25 to 34 Years | 0 (0.0%) | 10 (6.5%) |
| 35 to 44 Years | 0 (0.0%) | 0 (0.0%) |
| 45 to 54 Years | 7 (7.5%) | 9 (6.6%) |
| 55 to 64 Years | 43 (15.8%) | 51 (22.8%) |
| 65 to 74 Years | 47 (25.8%) | 17 (14.8%) |
| 75 Years and over | 0 (0.0%) | 0 (0.0%) |
| Total | 97 (8.8%) | 87 (7.7%) |
Income Above Poverty by Sex and Age in Laporte
According to the poverty statistics in Laporte, males aged under 5 years and females aged 5 years are the age groups that are most secure financially, with 100.0% of males and 100.0% of females in these age groups living above the poverty line.
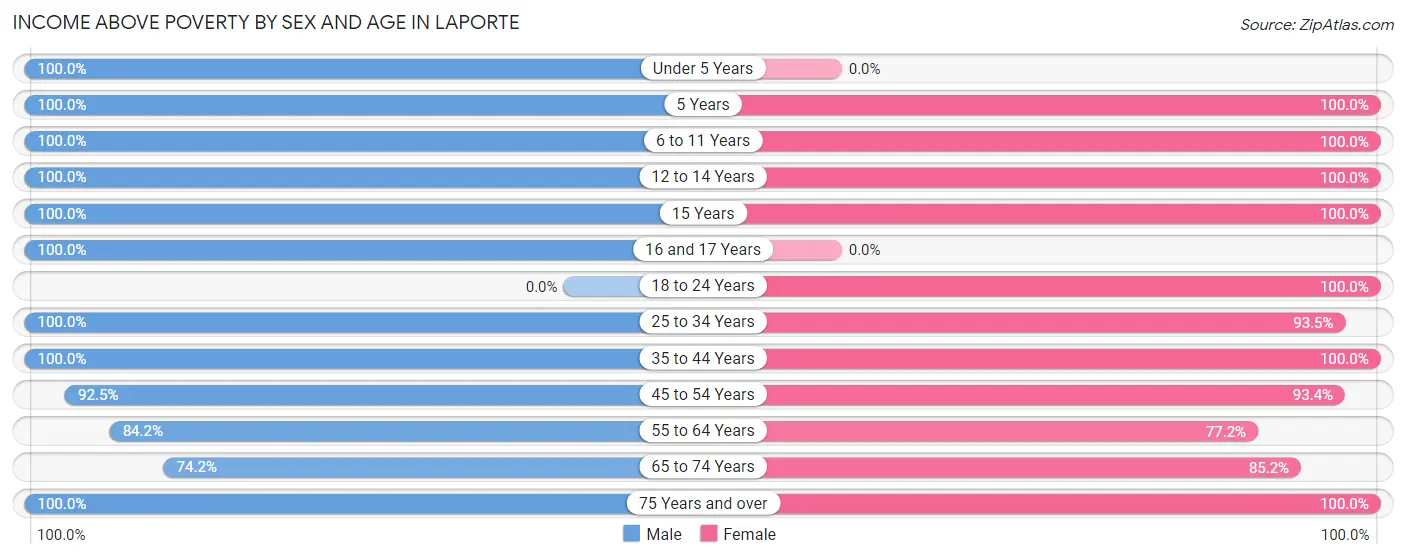
| Age Bracket | Male | Female |
| Under 5 Years | 38 (100.0%) | 0 (0.0%) |
| 5 Years | 10 (100.0%) | 10 (100.0%) |
| 6 to 11 Years | 36 (100.0%) | 90 (100.0%) |
| 12 to 14 Years | 10 (100.0%) | 37 (100.0%) |
| 15 Years | 34 (100.0%) | 33 (100.0%) |
| 16 and 17 Years | 40 (100.0%) | 0 (0.0%) |
| 18 to 24 Years | 0 (0.0%) | 89 (100.0%) |
| 25 to 34 Years | 140 (100.0%) | 143 (93.5%) |
| 35 to 44 Years | 162 (100.0%) | 170 (100.0%) |
| 45 to 54 Years | 86 (92.5%) | 127 (93.4%) |
| 55 to 64 Years | 229 (84.2%) | 173 (77.2%) |
| 65 to 74 Years | 135 (74.2%) | 98 (85.2%) |
| 75 Years and over | 83 (100.0%) | 76 (100.0%) |
| Total | 1,003 (91.2%) | 1,046 (92.3%) |
Income Below Poverty Among Married-Couple Families in Laporte
The poverty statistics for married-couple families in Laporte show that 6.7% or 38 of the total 569 families live below the poverty line. Families with no children have the highest poverty rate of 8.3%, comprising of 38 families. On the other hand, families with 1 or 2 children have the lowest poverty rate of 0.0%, which includes 0 families.
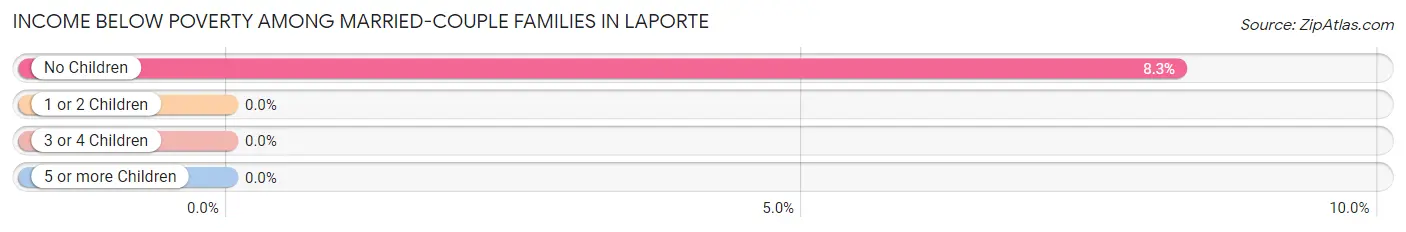
| Children | Above Poverty | Below Poverty |
| No Children | 422 (91.7%) | 38 (8.3%) |
| 1 or 2 Children | 58 (100.0%) | 0 (0.0%) |
| 3 or 4 Children | 51 (100.0%) | 0 (0.0%) |
| 5 or more Children | 0 (0.0%) | 0 (0.0%) |
| Total | 531 (93.3%) | 38 (6.7%) |
Income Below Poverty Among Single-Parent Households in Laporte
| Children | Single Father | Single Mother |
| No Children | 0 (0.0%) | 0 (0.0%) |
| 1 or 2 Children | 0 (0.0%) | 0 (0.0%) |
| 3 or 4 Children | 0 (0.0%) | 0 (0.0%) |
| 5 or more Children | 0 (0.0%) | 0 (0.0%) |
| Total | 0 (0.0%) | 0 (0.0%) |
Income Below Poverty Among Married-Couple vs Single-Parent Households in Laporte
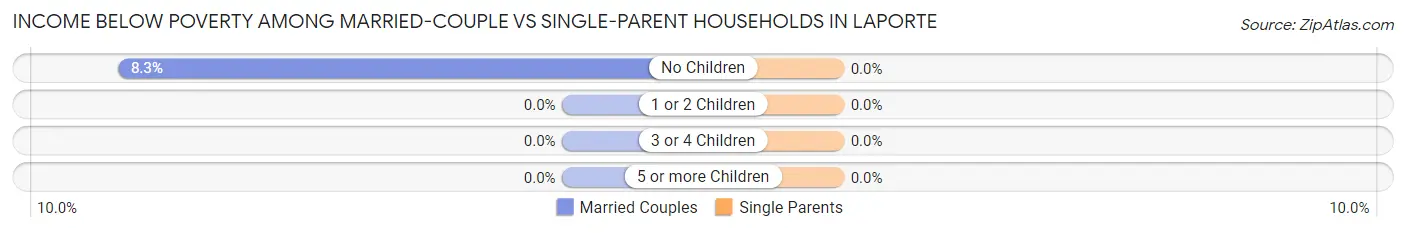
| Children | Married-Couple Families | Single-Parent Households |
| No Children | 38 (8.3%) | 0 (0.0%) |
| 1 or 2 Children | 0 (0.0%) | 0 (0.0%) |
| 3 or 4 Children | 0 (0.0%) | 0 (0.0%) |
| 5 or more Children | 0 (0.0%) | 0 (0.0%) |
| Total | 38 (6.7%) | 0 (0.0%) |
Race in Laporte
The most populous races in Laporte are White / Caucasian (2,049 | 91.8%), Hispanic or Latino (397 | 17.8%), and Two or more Races (88 | 3.9%).
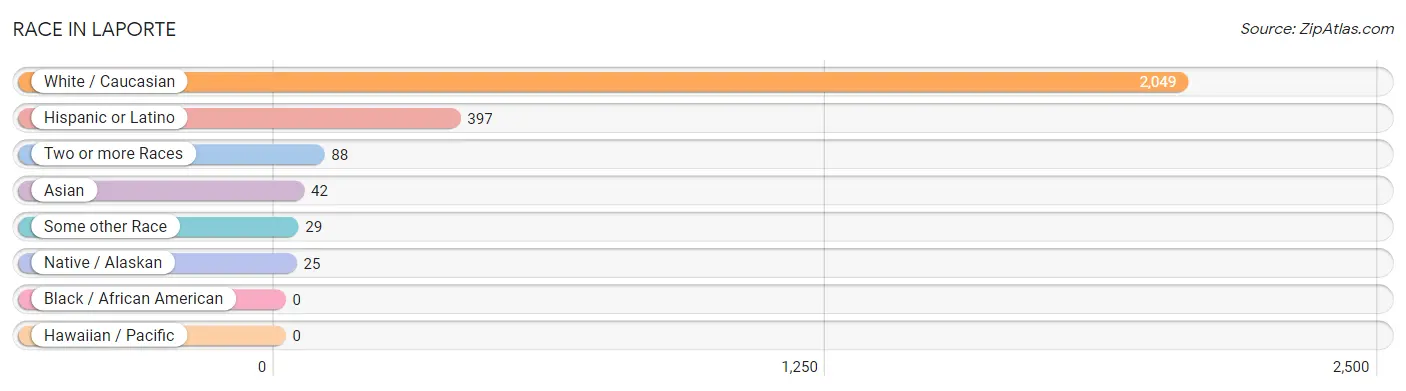
| Race | # Population | % Population |
| Asian | 42 | 1.9% |
| Black / African American | 0 | 0.0% |
| Hawaiian / Pacific | 0 | 0.0% |
| Hispanic or Latino | 397 | 17.8% |
| Native / Alaskan | 25 | 1.1% |
| White / Caucasian | 2,049 | 91.8% |
| Two or more Races | 88 | 3.9% |
| Some other Race | 29 | 1.3% |
| Total | 2,233 | 100.0% |
Ancestry in Laporte
The most populous ancestries reported in Laporte are English (458 | 20.5%), German (451 | 20.2%), Mexican (347 | 15.5%), Irish (336 | 15.0%), and Italian (252 | 11.3%), together accounting for 82.6% of all Laporte residents.
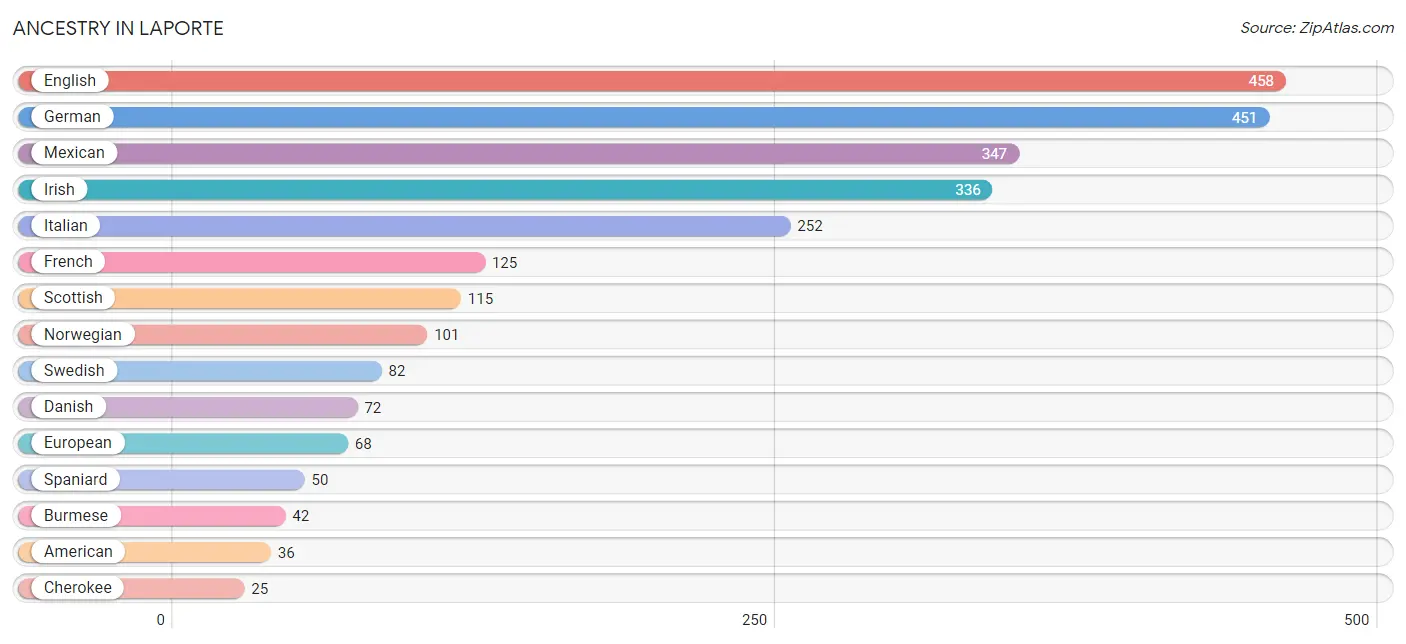
| Ancestry | # Population | % Population |
| American | 36 | 1.6% |
| Australian | 9 | 0.4% |
| Burmese | 42 | 1.9% |
| Cherokee | 25 | 1.1% |
| Czech | 25 | 1.1% |
| Danish | 72 | 3.2% |
| Dutch | 19 | 0.9% |
| English | 458 | 20.5% |
| European | 68 | 3.0% |
| Finnish | 9 | 0.4% |
| French | 125 | 5.6% |
| German | 451 | 20.2% |
| Greek | 5 | 0.2% |
| Irish | 336 | 15.0% |
| Italian | 252 | 11.3% |
| Mexican | 347 | 15.5% |
| Norwegian | 101 | 4.5% |
| Scotch-Irish | 12 | 0.5% |
| Scottish | 115 | 5.1% |
| Spaniard | 50 | 2.2% |
| Swedish | 82 | 3.7% |
| Swiss | 17 | 0.8% | View All 22 Rows |
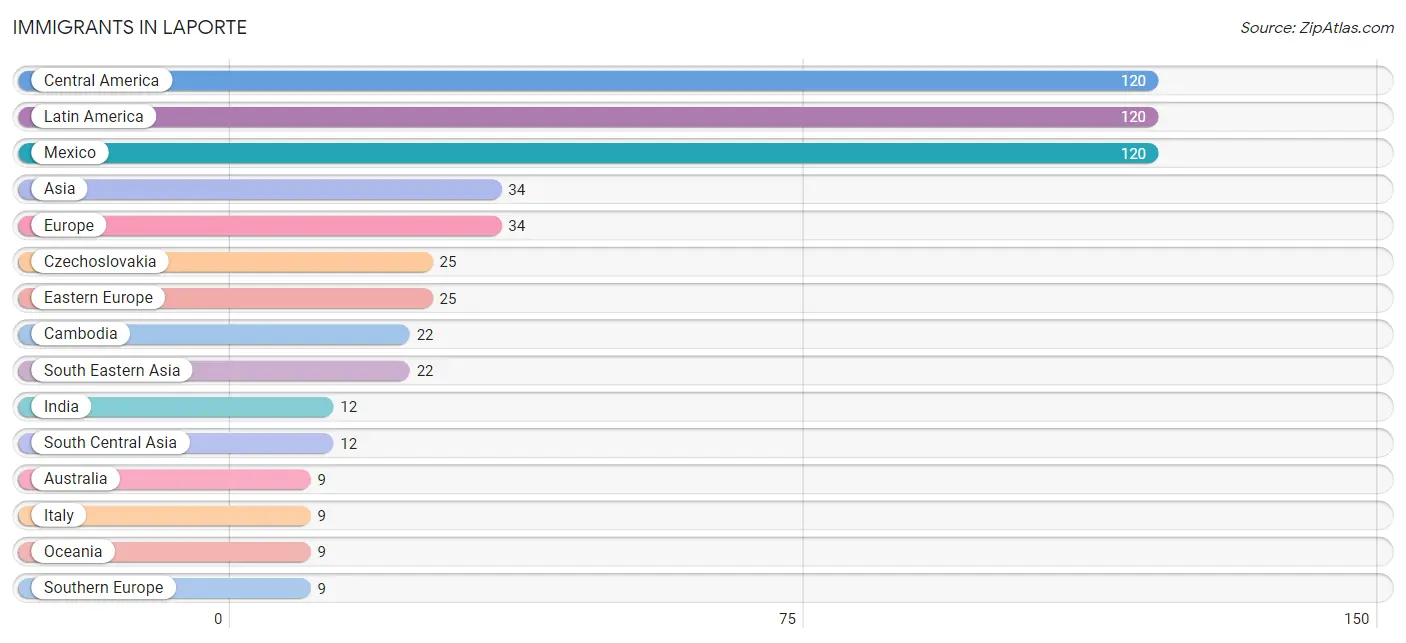
Immigrants in Laporte
The most numerous immigrant groups reported in Laporte came from Central America (120 | 5.4%), Latin America (120 | 5.4%), Mexico (120 | 5.4%), Asia (34 | 1.5%), and Europe (34 | 1.5%), together accounting for 19.1% of all Laporte residents.
| Immigration Origin | # Population | % Population |
| Asia | 34 | 1.5% |
| Australia | 9 | 0.4% |
| Cambodia | 22 | 1.0% |
| Central America | 120 | 5.4% |
| Czechoslovakia | 25 | 1.1% |
| Eastern Europe | 25 | 1.1% |
| Europe | 34 | 1.5% |
| India | 12 | 0.5% |
| Italy | 9 | 0.4% |
| Latin America | 120 | 5.4% |
| Mexico | 120 | 5.4% |
| Oceania | 9 | 0.4% |
| South Central Asia | 12 | 0.5% |
| South Eastern Asia | 22 | 1.0% |
| Southern Europe | 9 | 0.4% | View All 15 Rows |
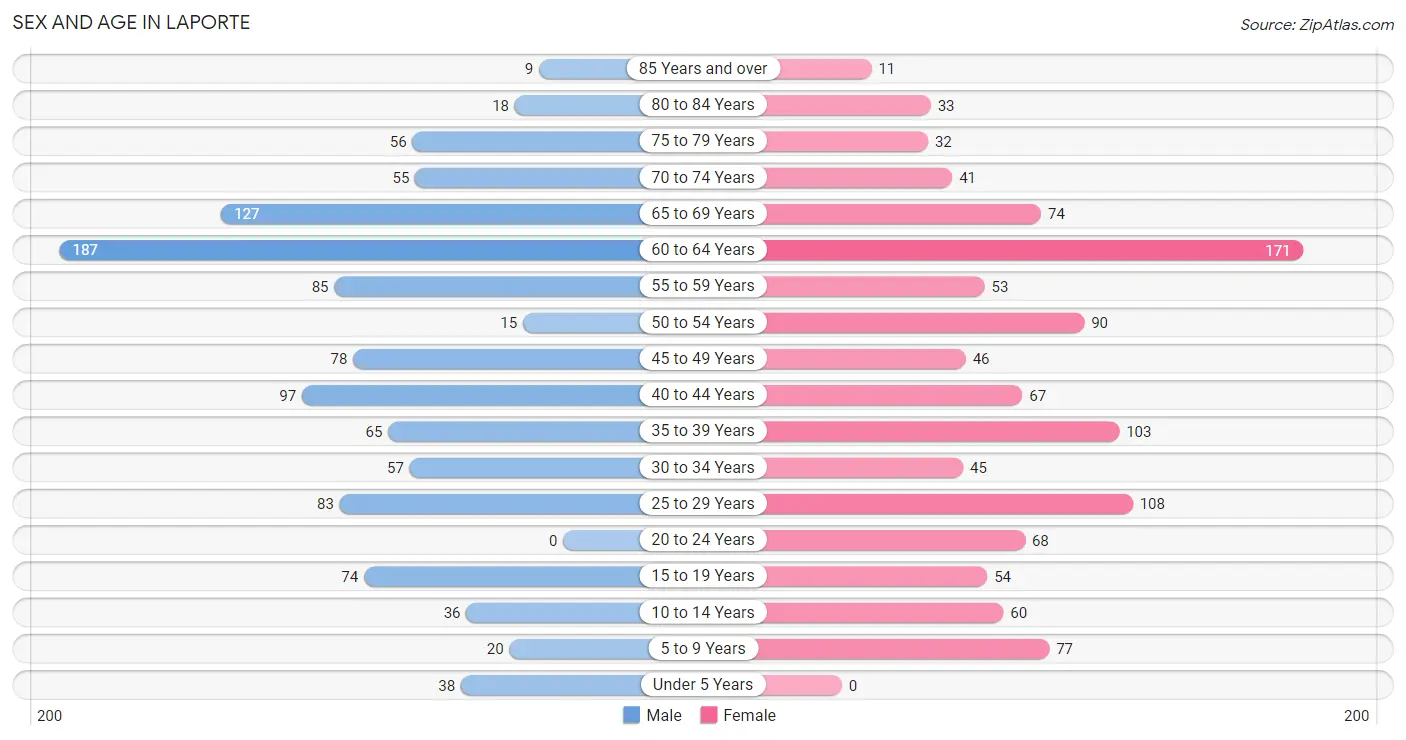
Sex and Age in Laporte
Sex and Age in Laporte
The most populous age groups in Laporte are 60 to 64 Years (187 | 17.0%) for men and 60 to 64 Years (171 | 15.1%) for women.
| Age Bracket | Male | Female |
| Under 5 Years | 38 (3.5%) | 0 (0.0%) |
| 5 to 9 Years | 20 (1.8%) | 77 (6.8%) |
| 10 to 14 Years | 36 (3.3%) | 60 (5.3%) |
| 15 to 19 Years | 74 (6.7%) | 54 (4.8%) |
| 20 to 24 Years | 0 (0.0%) | 68 (6.0%) |
| 25 to 29 Years | 83 (7.5%) | 108 (9.5%) |
| 30 to 34 Years | 57 (5.2%) | 45 (4.0%) |
| 35 to 39 Years | 65 (5.9%) | 103 (9.1%) |
| 40 to 44 Years | 97 (8.8%) | 67 (5.9%) |
| 45 to 49 Years | 78 (7.1%) | 46 (4.1%) |
| 50 to 54 Years | 15 (1.4%) | 90 (7.9%) |
| 55 to 59 Years | 85 (7.7%) | 53 (4.7%) |
| 60 to 64 Years | 187 (17.0%) | 171 (15.1%) |
| 65 to 69 Years | 127 (11.6%) | 74 (6.5%) |
| 70 to 74 Years | 55 (5.0%) | 41 (3.6%) |
| 75 to 79 Years | 56 (5.1%) | 32 (2.8%) |
| 80 to 84 Years | 18 (1.6%) | 33 (2.9%) |
| 85 Years and over | 9 (0.8%) | 11 (1.0%) |
| Total | 1,100 (100.0%) | 1,133 (100.0%) |
Families and Households in Laporte
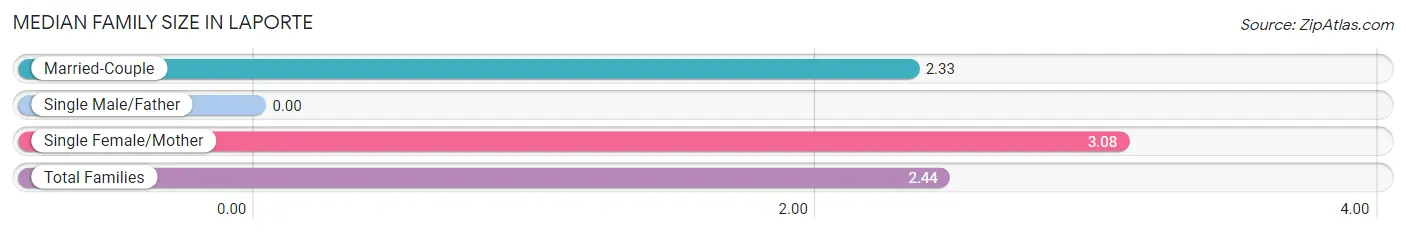
Median Family Size in Laporte
| Family Type | # Families | Family Size |
| Married-Couple | 569 (85.1%) | 2.33 |
| Single Male/Father | 0 (0.0%) | - |
| Single Female/Mother | 100 (14.9%) | 3.08 |
| Total Families | 669 (100.0%) | 2.44 |
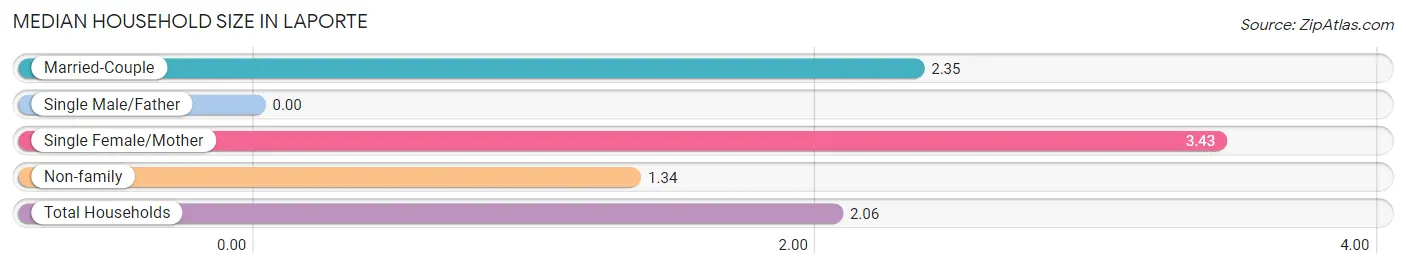
Median Household Size in Laporte
| Household Type | # Households | Household Size |
| Married-Couple | 569 (52.6%) | 2.35 |
| Single Male/Father | 0 (0.0%) | - |
| Single Female/Mother | 100 (9.2%) | 3.43 |
| Non-family | 413 (38.2%) | 1.34 |
| Total Households | 1,082 (100.0%) | 2.06 |
Household Size by Marriage Status in Laporte
Out of a total of 1,082 households in Laporte, 669 (61.8%) are family households, while 413 (38.2%) are nonfamily households. The most numerous type of family households are 2-person households, comprising 429, and the most common type of nonfamily households are 1-person households, comprising 233.
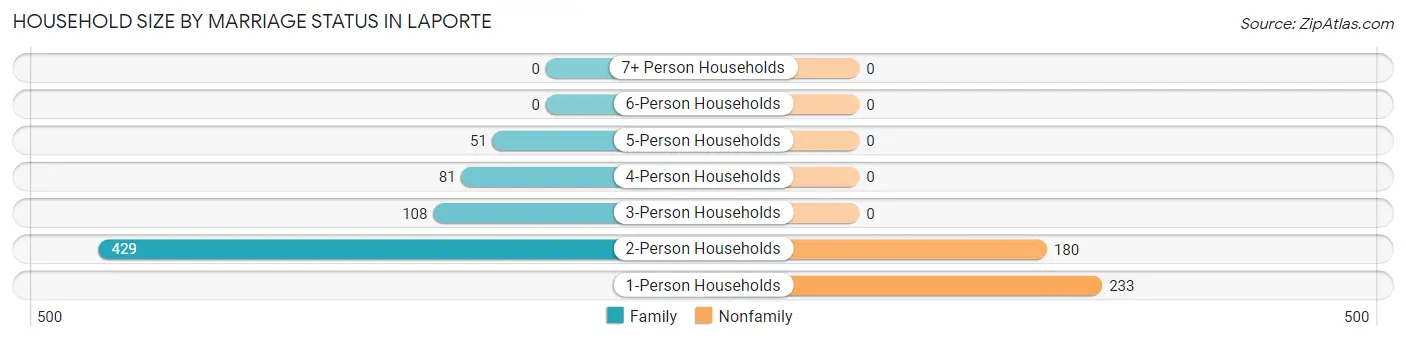
| Household Size | Family Households | Nonfamily Households |
| 1-Person Households | - | 233 (21.5%) |
| 2-Person Households | 429 (39.7%) | 180 (16.6%) |
| 3-Person Households | 108 (10.0%) | 0 (0.0%) |
| 4-Person Households | 81 (7.5%) | 0 (0.0%) |
| 5-Person Households | 51 (4.7%) | 0 (0.0%) |
| 6-Person Households | 0 (0.0%) | 0 (0.0%) |
| 7+ Person Households | 0 (0.0%) | 0 (0.0%) |
| Total | 669 (61.8%) | 413 (38.2%) |
Female Fertility in Laporte
Fertility by Age in Laporte
| Age Bracket | Women with Births | Births / 1,000 Women |
| 15 to 19 years | 0 (0.0%) | 0.0 |
| 20 to 34 years | 0 (0.0%) | 0.0 |
| 35 to 50 years | 0 (0.0%) | 0.0 |
| Total | 0 (0.0%) | 0.0 |
Fertility by Age by Marriage Status in Laporte
| Age Bracket | Married | Unmarried |
| 15 to 19 years | 0 (0.0%) | 0 (0.0%) |
| 20 to 34 years | 0 (0.0%) | 0 (0.0%) |
| 35 to 50 years | 0 (0.0%) | 0 (0.0%) |
| Total | 0 (0.0%) | 0 (0.0%) |
Fertility by Education in Laporte
| Educational Attainment | Women with Births | Births / 1,000 Women |
| Less than High School | 0 (0.0%) | 0.0 |
| High School Diploma | 0 (0.0%) | 0.0 |
| College or Associate's Degree | 0 (0.0%) | 0.0 |
| Bachelor's Degree | 0 (0.0%) | 0.0 |
| Graduate Degree | 0 (0.0%) | 0.0 |
| Total | 0 (0.0%) | 0.0 |
Fertility by Education by Marriage Status in Laporte
| Educational Attainment | Married | Unmarried |
| Less than High School | 0 (0.0%) | 0 (0.0%) |
| High School Diploma | 0 (0.0%) | 0 (0.0%) |
| College or Associate's Degree | 0 (0.0%) | 0 (0.0%) |
| Bachelor's Degree | 0 (0.0%) | 0 (0.0%) |
| Graduate Degree | 0 (0.0%) | 0 (0.0%) |
| Total | 0 (0.0%) | 0 (0.0%) |
Employment Characteristics in Laporte
Employment by Class of Employer in Laporte
Among the 1,213 employed individuals in Laporte, private company employees (918 | 75.7%), local government employees (81 | 6.7%), and not-for-profit organizations (72 | 5.9%) make up the most common classes of employment.
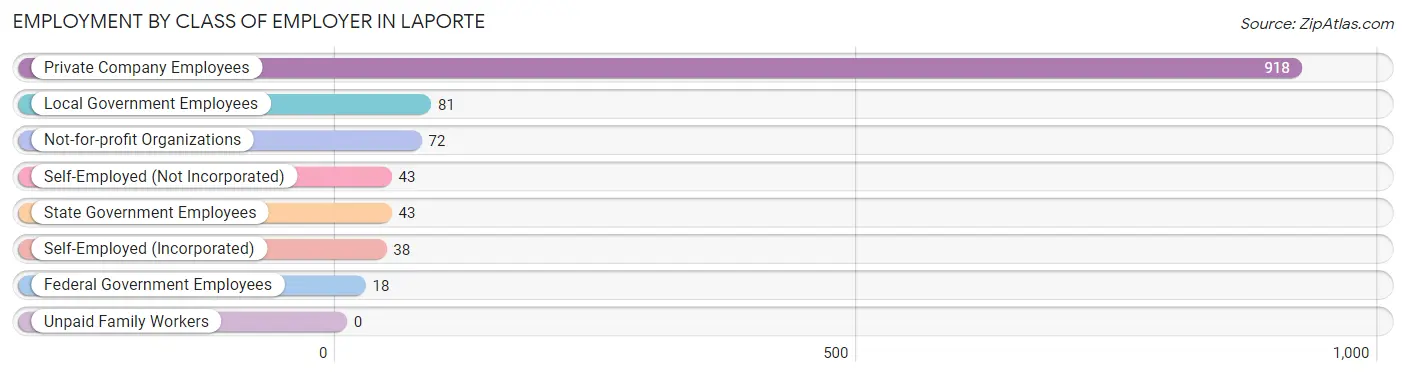
| Employer Class | # Employees | % Employees |
| Private Company Employees | 918 | 75.7% |
| Self-Employed (Incorporated) | 38 | 3.1% |
| Self-Employed (Not Incorporated) | 43 | 3.5% |
| Not-for-profit Organizations | 72 | 5.9% |
| Local Government Employees | 81 | 6.7% |
| State Government Employees | 43 | 3.5% |
| Federal Government Employees | 18 | 1.5% |
| Unpaid Family Workers | 0 | 0.0% |
| Total | 1,213 | 100.0% |
Employment Status by Age in Laporte
According to the labor force statistics for Laporte, out of the total population over 16 years of age (1,935), 67.0% or 1,296 individuals are in the labor force, with 3.4% or 44 of them unemployed. The age group with the highest labor force participation rate is 20 to 24 years, with 100.0% or 68 individuals in the labor force. Within the labor force, the 60 to 64 years age range has the highest percentage of unemployed individuals, with 10.4% or 25 of them being unemployed.
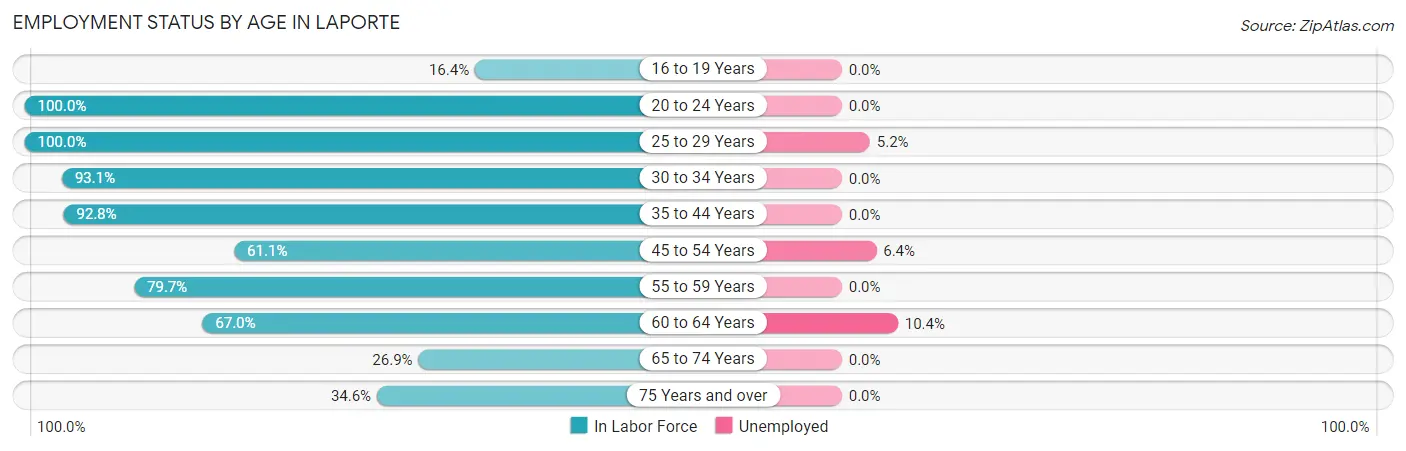
| Age Bracket | In Labor Force | Unemployed |
| 16 to 19 Years | 10 (16.4%) | 0 (0.0%) |
| 20 to 24 Years | 68 (100.0%) | 0 (0.0%) |
| 25 to 29 Years | 191 (100.0%) | 10 (5.2%) |
| 30 to 34 Years | 95 (93.1%) | 0 (0.0%) |
| 35 to 44 Years | 308 (92.8%) | 0 (0.0%) |
| 45 to 54 Years | 140 (61.1%) | 9 (6.4%) |
| 55 to 59 Years | 110 (79.7%) | 0 (0.0%) |
| 60 to 64 Years | 240 (67.0%) | 25 (10.4%) |
| 65 to 74 Years | 80 (26.9%) | 0 (0.0%) |
| 75 Years and over | 55 (34.6%) | 0 (0.0%) |
| Total | 1,296 (67.0%) | 44 (3.4%) |
Employment Status by Educational Attainment in Laporte
According to labor force statistics for Laporte, 80.3% of individuals (1,084) out of the total population between 25 and 64 years of age (1,350) are in the labor force, with 4.1% or 44 of them being unemployed. The group with the highest labor force participation rate are those with the educational attainment of less than high school, with 93.5% or 101 individuals in the labor force. Within the labor force, individuals with less than high school education have the highest percentage of unemployment, with 34.7% or 35 of them being unemployed.

| Educational Attainment | In Labor Force | Unemployed |
| Less than High School | 101 (93.5%) | 37 (34.7%) |
| High School Diploma | 254 (83.6%) | 0 (0.0%) |
| College / Associate Degree | 325 (67.3%) | 0 (0.0%) |
| Bachelor's Degree or higher | 404 (88.8%) | 10 (2.2%) |
| Total | 1,084 (80.3%) | 55 (4.1%) |
Employment Occupations by Sex in Laporte
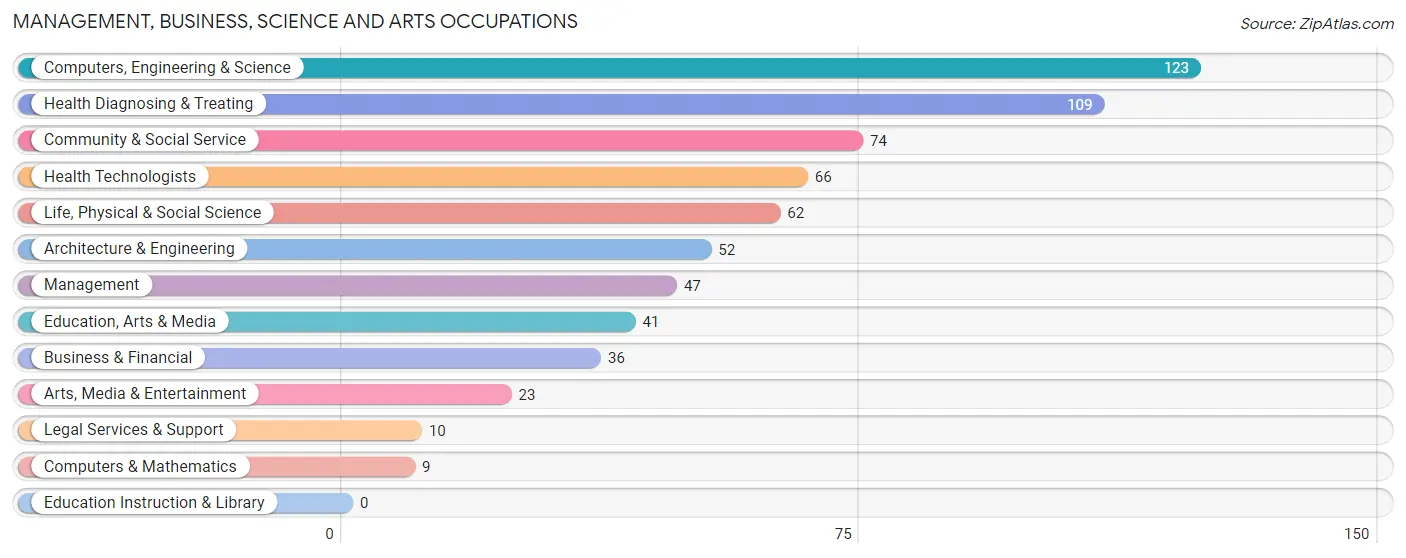
Management, Business, Science and Arts Occupations
The most common Management, Business, Science and Arts occupations in Laporte are Computers, Engineering & Science (123 | 9.8%), Health Diagnosing & Treating (109 | 8.7%), Community & Social Service (74 | 5.9%), Health Technologists (66 | 5.3%), and Life, Physical & Social Science (62 | 5.0%).
Management, Business, Science and Arts Occupations by Sex
Within the Management, Business, Science and Arts occupations in Laporte, the most male-oriented occupations are Business & Financial (100.0%), Computers & Mathematics (100.0%), and Management (83.0%), while the most female-oriented occupations are Community & Social Service (100.0%), Education, Arts & Media (100.0%), and Legal Services & Support (100.0%).
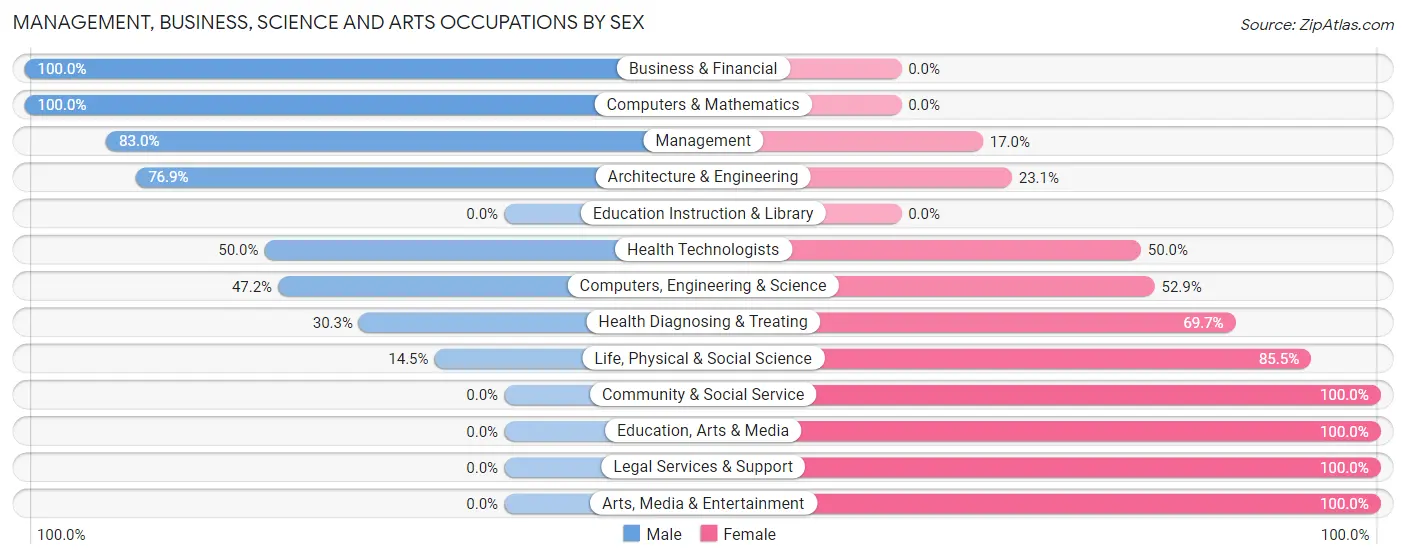
| Occupation | Male | Female |
| Management | 39 (83.0%) | 8 (17.0%) |
| Business & Financial | 36 (100.0%) | 0 (0.0%) |
| Computers, Engineering & Science | 58 (47.1%) | 65 (52.8%) |
| Computers & Mathematics | 9 (100.0%) | 0 (0.0%) |
| Architecture & Engineering | 40 (76.9%) | 12 (23.1%) |
| Life, Physical & Social Science | 9 (14.5%) | 53 (85.5%) |
| Community & Social Service | 0 (0.0%) | 74 (100.0%) |
| Education, Arts & Media | 0 (0.0%) | 41 (100.0%) |
| Legal Services & Support | 0 (0.0%) | 10 (100.0%) |
| Education Instruction & Library | 0 (0.0%) | 0 (0.0%) |
| Arts, Media & Entertainment | 0 (0.0%) | 23 (100.0%) |
| Health Diagnosing & Treating | 33 (30.3%) | 76 (69.7%) |
| Health Technologists | 33 (50.0%) | 33 (50.0%) |
| Total (Category) | 166 (42.7%) | 223 (57.3%) |
| Total (Overall) | 714 (57.0%) | 539 (43.0%) |
Services Occupations
The most common Services occupations in Laporte are Healthcare Support (69 | 5.5%), Cleaning & Maintenance (44 | 3.5%), Food Preparation & Serving (25 | 2.0%), Personal Care & Service (18 | 1.4%), and Security & Protection (14 | 1.1%).
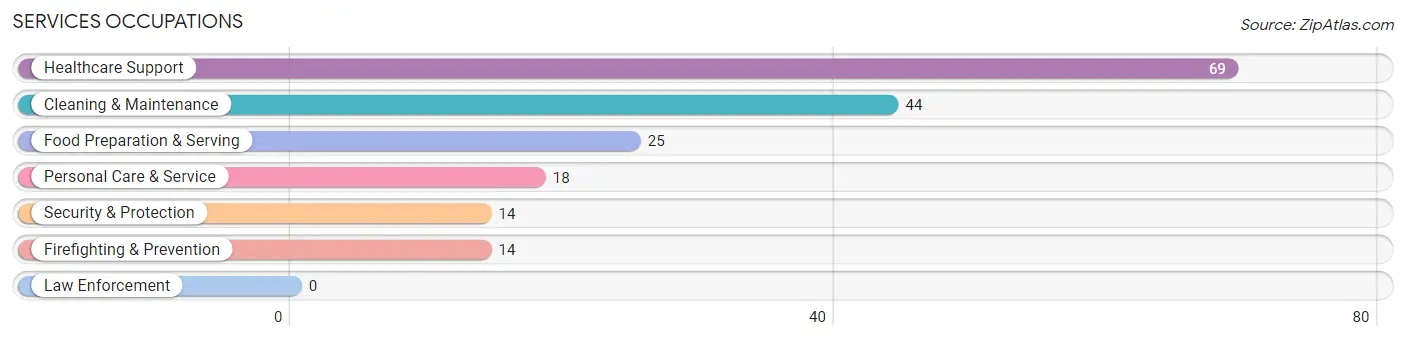
Services Occupations by Sex
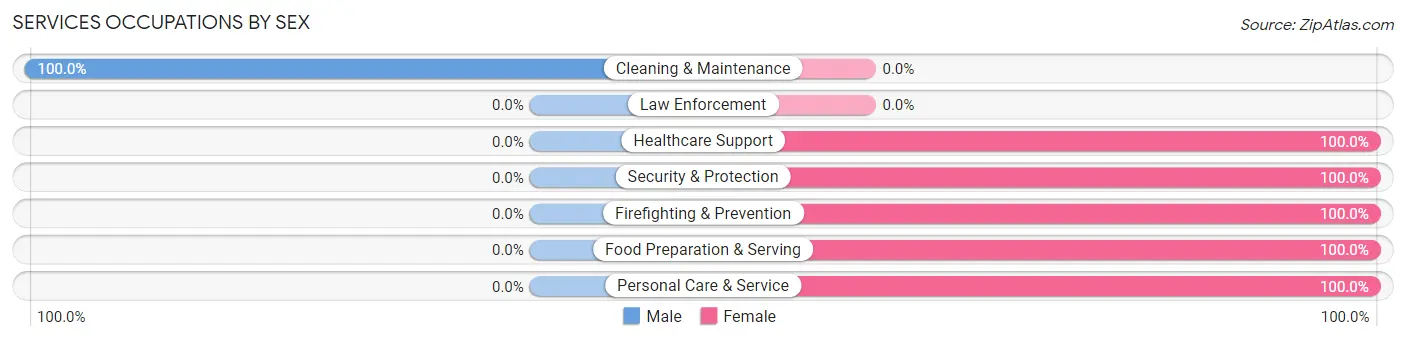
| Occupation | Male | Female |
| Healthcare Support | 0 (0.0%) | 69 (100.0%) |
| Security & Protection | 0 (0.0%) | 14 (100.0%) |
| Firefighting & Prevention | 0 (0.0%) | 14 (100.0%) |
| Law Enforcement | 0 (0.0%) | 0 (0.0%) |
| Food Preparation & Serving | 0 (0.0%) | 25 (100.0%) |
| Cleaning & Maintenance | 44 (100.0%) | 0 (0.0%) |
| Personal Care & Service | 0 (0.0%) | 18 (100.0%) |
| Total (Category) | 44 (25.9%) | 126 (74.1%) |
| Total (Overall) | 714 (57.0%) | 539 (43.0%) |
Sales and Office Occupations
The most common Sales and Office occupations in Laporte are Office & Administration (126 | 10.1%), and Sales & Related (63 | 5.0%).

Sales and Office Occupations by Sex

| Occupation | Male | Female |
| Sales & Related | 9 (14.3%) | 54 (85.7%) |
| Office & Administration | 49 (38.9%) | 77 (61.1%) |
| Total (Category) | 58 (30.7%) | 131 (69.3%) |
| Total (Overall) | 714 (57.0%) | 539 (43.0%) |
Natural Resources, Construction and Maintenance Occupations
The most common Natural Resources, Construction and Maintenance occupations in Laporte are Construction & Extraction (214 | 17.1%), and Installation, Maintenance & Repair (86 | 6.9%).
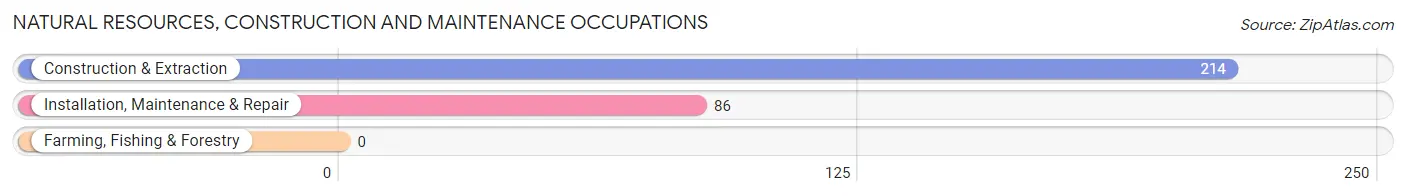
Natural Resources, Construction and Maintenance Occupations by Sex

| Occupation | Male | Female |
| Farming, Fishing & Forestry | 0 (0.0%) | 0 (0.0%) |
| Construction & Extraction | 202 (94.4%) | 12 (5.6%) |
| Installation, Maintenance & Repair | 86 (100.0%) | 0 (0.0%) |
| Total (Category) | 288 (96.0%) | 12 (4.0%) |
| Total (Overall) | 714 (57.0%) | 539 (43.0%) |
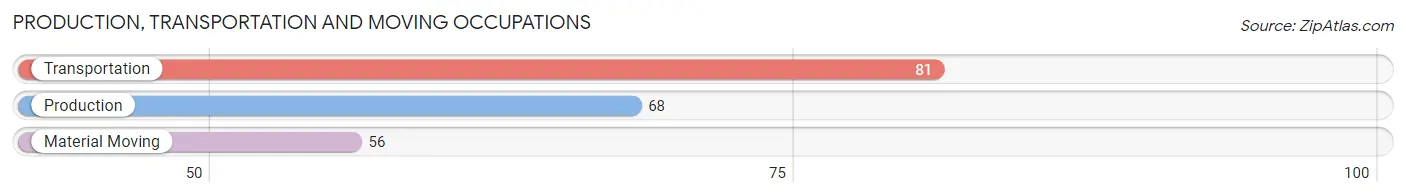
Production, Transportation and Moving Occupations
The most common Production, Transportation and Moving occupations in Laporte are Transportation (81 | 6.5%), Production (68 | 5.4%), and Material Moving (56 | 4.5%).
Production, Transportation and Moving Occupations by Sex
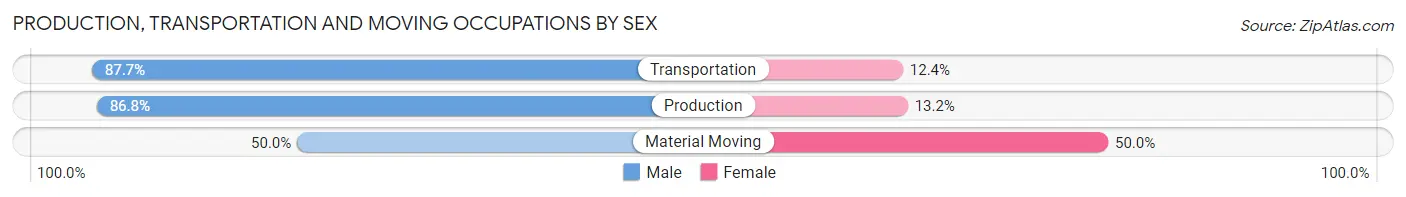
| Occupation | Male | Female |
| Production | 59 (86.8%) | 9 (13.2%) |
| Transportation | 71 (87.6%) | 10 (12.3%) |
| Material Moving | 28 (50.0%) | 28 (50.0%) |
| Total (Category) | 158 (77.1%) | 47 (22.9%) |
| Total (Overall) | 714 (57.0%) | 539 (43.0%) |
Employment Industries by Sex in Laporte
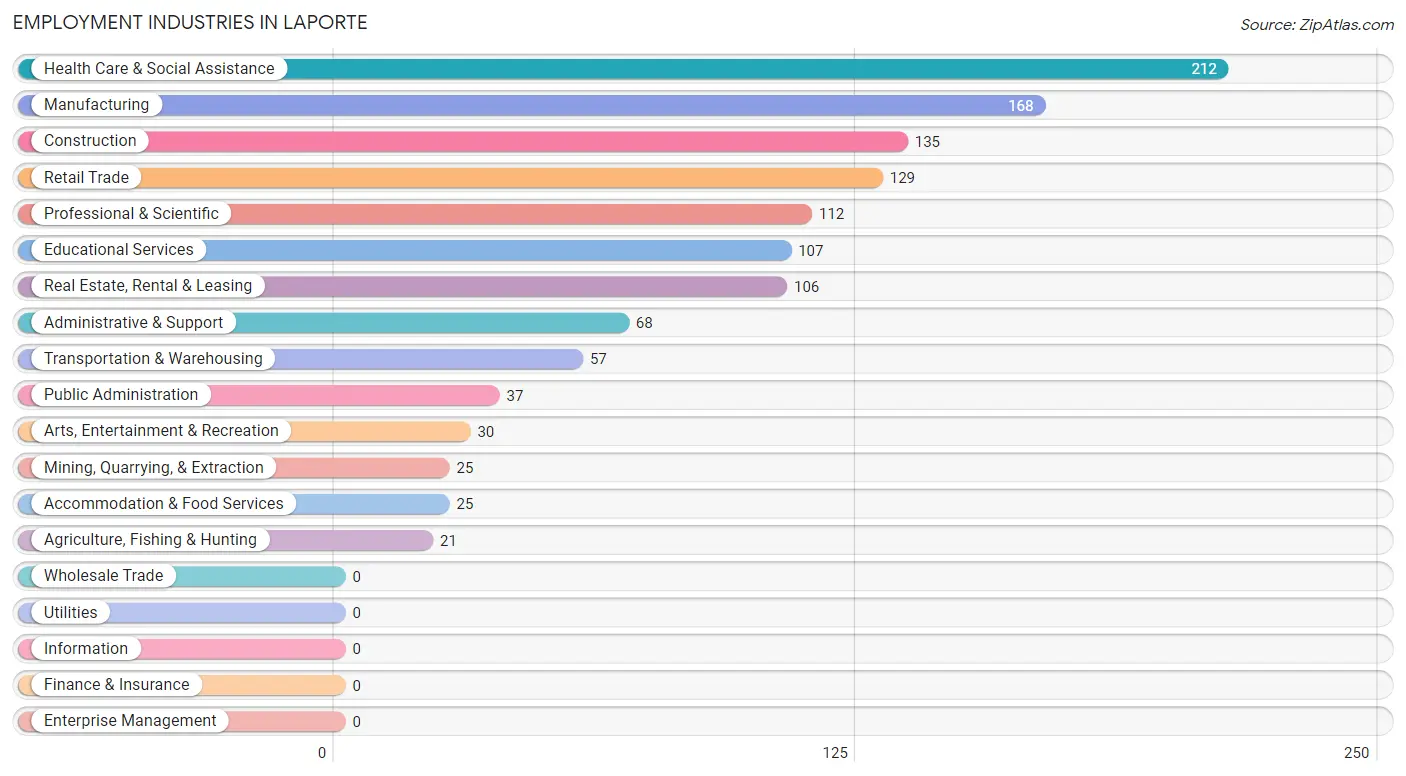
Employment Industries in Laporte
The major employment industries in Laporte include Health Care & Social Assistance (212 | 16.9%), Manufacturing (168 | 13.4%), Construction (135 | 10.8%), Retail Trade (129 | 10.3%), and Professional & Scientific (112 | 8.9%).
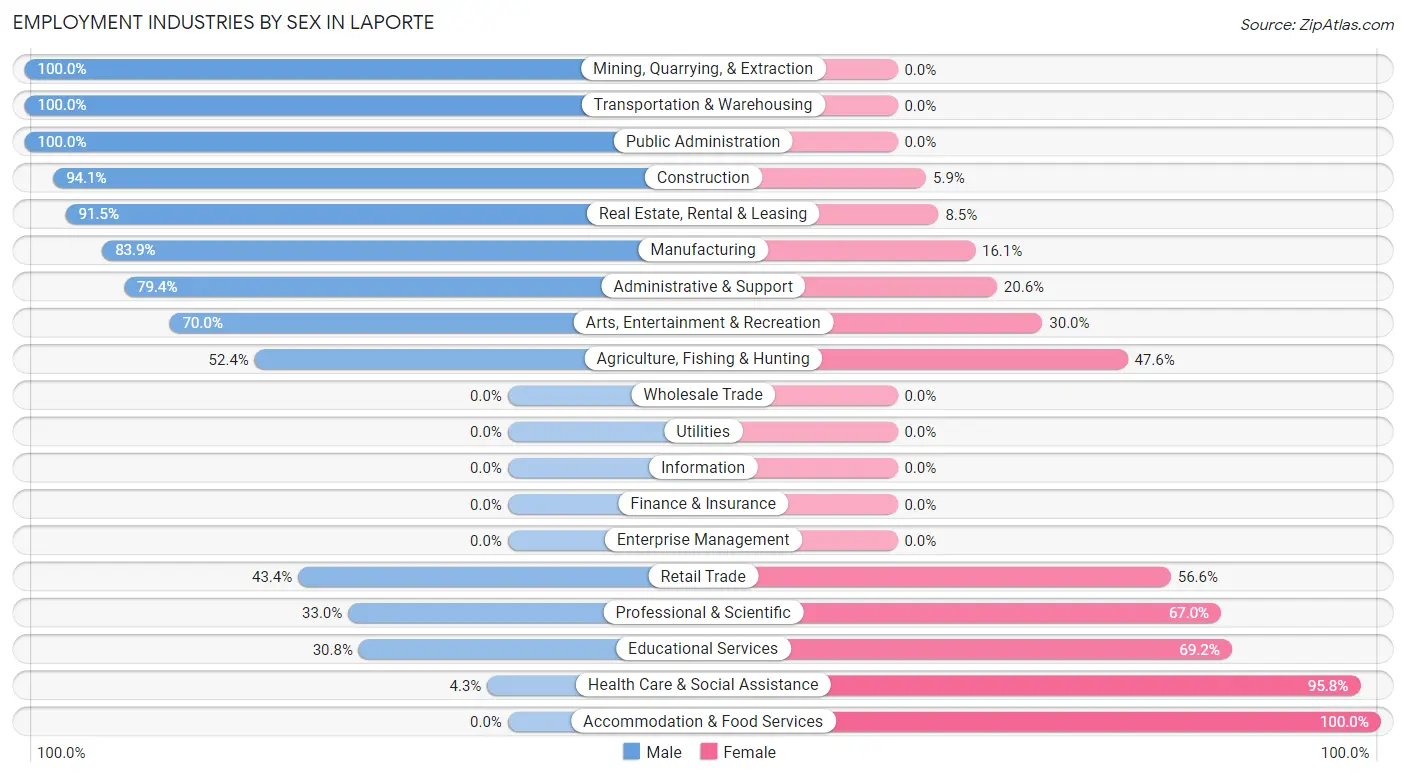
Employment Industries by Sex in Laporte
The Laporte industries that see more men than women are Mining, Quarrying, & Extraction (100.0%), Transportation & Warehousing (100.0%), and Public Administration (100.0%), whereas the industries that tend to have a higher number of women are Accommodation & Food Services (100.0%), Health Care & Social Assistance (95.8%), and Educational Services (69.2%).
| Industry | Male | Female |
| Agriculture, Fishing & Hunting | 11 (52.4%) | 10 (47.6%) |
| Mining, Quarrying, & Extraction | 25 (100.0%) | 0 (0.0%) |
| Construction | 127 (94.1%) | 8 (5.9%) |
| Manufacturing | 141 (83.9%) | 27 (16.1%) |
| Wholesale Trade | 0 (0.0%) | 0 (0.0%) |
| Retail Trade | 56 (43.4%) | 73 (56.6%) |
| Transportation & Warehousing | 57 (100.0%) | 0 (0.0%) |
| Utilities | 0 (0.0%) | 0 (0.0%) |
| Information | 0 (0.0%) | 0 (0.0%) |
| Finance & Insurance | 0 (0.0%) | 0 (0.0%) |
| Real Estate, Rental & Leasing | 97 (91.5%) | 9 (8.5%) |
| Professional & Scientific | 37 (33.0%) | 75 (67.0%) |
| Enterprise Management | 0 (0.0%) | 0 (0.0%) |
| Administrative & Support | 54 (79.4%) | 14 (20.6%) |
| Educational Services | 33 (30.8%) | 74 (69.2%) |
| Health Care & Social Assistance | 9 (4.3%) | 203 (95.8%) |
| Arts, Entertainment & Recreation | 21 (70.0%) | 9 (30.0%) |
| Accommodation & Food Services | 0 (0.0%) | 25 (100.0%) |
| Public Administration | 37 (100.0%) | 0 (0.0%) |
| Total | 714 (57.0%) | 539 (43.0%) |
Education in Laporte
School Enrollment in Laporte
The most common levels of schooling among the 468 students in Laporte are high school (158 | 33.8%), elementary school (94 | 20.1%), and middle school (79 | 16.9%).
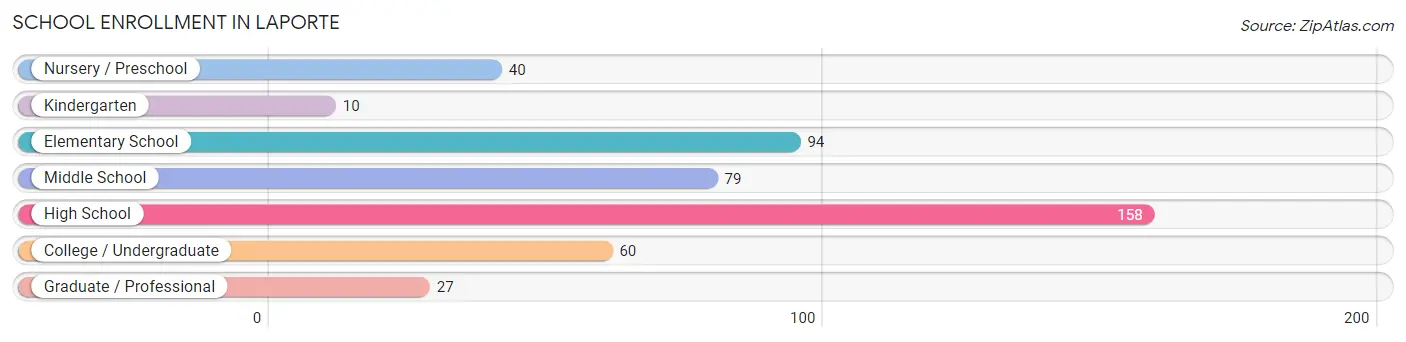
| School Level | # Students | % Students |
| Nursery / Preschool | 40 | 8.6% |
| Kindergarten | 10 | 2.1% |
| Elementary School | 94 | 20.1% |
| Middle School | 79 | 16.9% |
| High School | 158 | 33.8% |
| College / Undergraduate | 60 | 12.8% |
| Graduate / Professional | 27 | 5.8% |
| Total | 468 | 100.0% |
School Enrollment by Age by Funding Source in Laporte
Out of a total of 468 students who are enrolled in schools in Laporte, 47 (10.0%) attend a private institution, while the remaining 421 (90.0%) are enrolled in public schools. The age group of 35 years and over has the highest likelihood of being enrolled in private schools, with 30 (27.8% in the age bracket) enrolled. Conversely, the age group of 3 to 4 year olds has the lowest likelihood of being enrolled in a private school, with 30 (100.0% in the age bracket) attending a public institution.
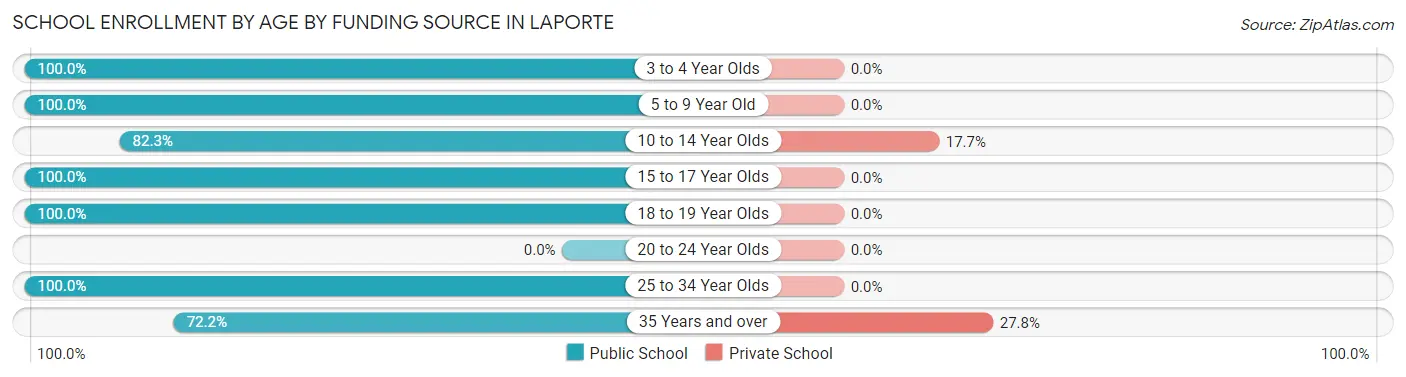
| Age Bracket | Public School | Private School |
| 3 to 4 Year Olds | 30 (100.0%) | 0 (0.0%) |
| 5 to 9 Year Old | 97 (100.0%) | 0 (0.0%) |
| 10 to 14 Year Olds | 79 (82.3%) | 17 (17.7%) |
| 15 to 17 Year Olds | 107 (100.0%) | 0 (0.0%) |
| 18 to 19 Year Olds | 21 (100.0%) | 0 (0.0%) |
| 20 to 24 Year Olds | 0 (0.0%) | 0 (0.0%) |
| 25 to 34 Year Olds | 9 (100.0%) | 0 (0.0%) |
| 35 Years and over | 78 (72.2%) | 30 (27.8%) |
| Total | 421 (90.0%) | 47 (10.0%) |
Educational Attainment by Field of Study in Laporte
Social sciences (107 | 15.1%), bio, nature & agricultural (99 | 13.9%), psychology (81 | 11.4%), engineering (80 | 11.3%), and science & technology (60 | 8.5%) are the most common fields of study among 710 individuals in Laporte who have obtained a bachelor's degree or higher.
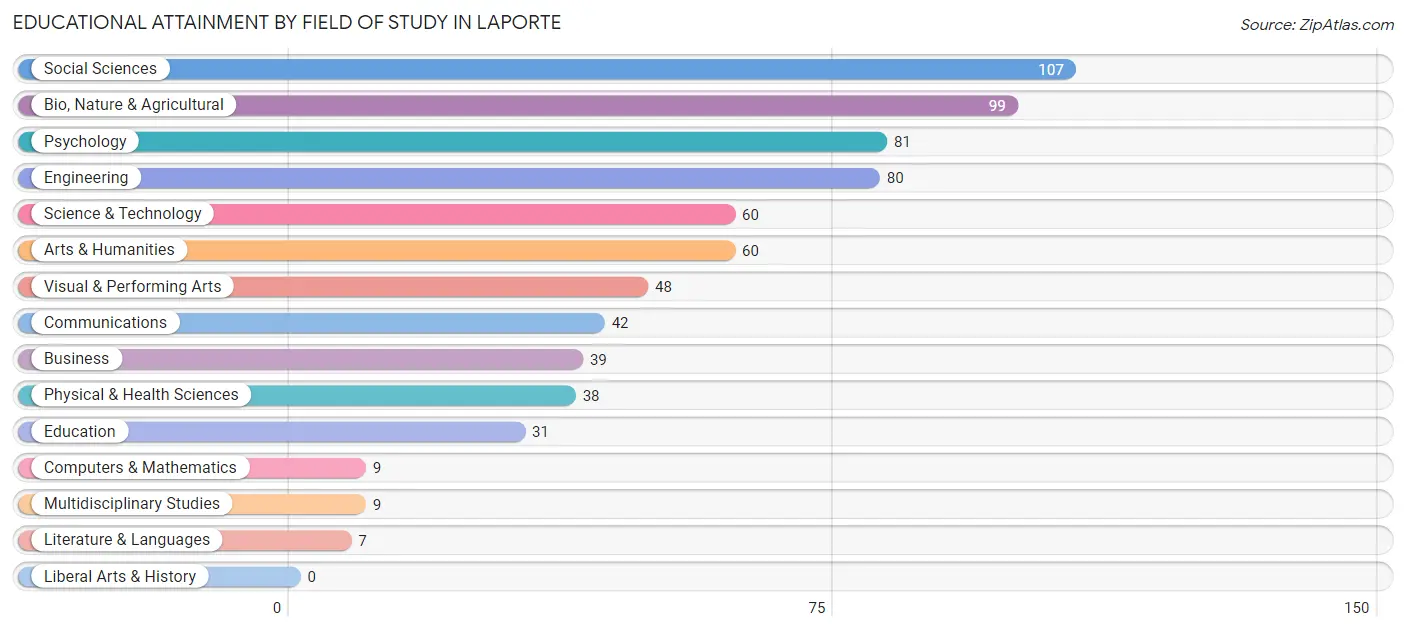
| Field of Study | # Graduates | % Graduates |
| Computers & Mathematics | 9 | 1.3% |
| Bio, Nature & Agricultural | 99 | 13.9% |
| Physical & Health Sciences | 38 | 5.3% |
| Psychology | 81 | 11.4% |
| Social Sciences | 107 | 15.1% |
| Engineering | 80 | 11.3% |
| Multidisciplinary Studies | 9 | 1.3% |
| Science & Technology | 60 | 8.5% |
| Business | 39 | 5.5% |
| Education | 31 | 4.4% |
| Literature & Languages | 7 | 1.0% |
| Liberal Arts & History | 0 | 0.0% |
| Visual & Performing Arts | 48 | 6.8% |
| Communications | 42 | 5.9% |
| Arts & Humanities | 60 | 8.5% |
| Total | 710 | 100.0% |
Transportation & Commute in Laporte
Vehicle Availability by Sex in Laporte
The most prevalent vehicle ownership categories in Laporte are males with 2 vehicles (350, accounting for 51.2%) and females with 2 vehicles (278, making up 66.2%).
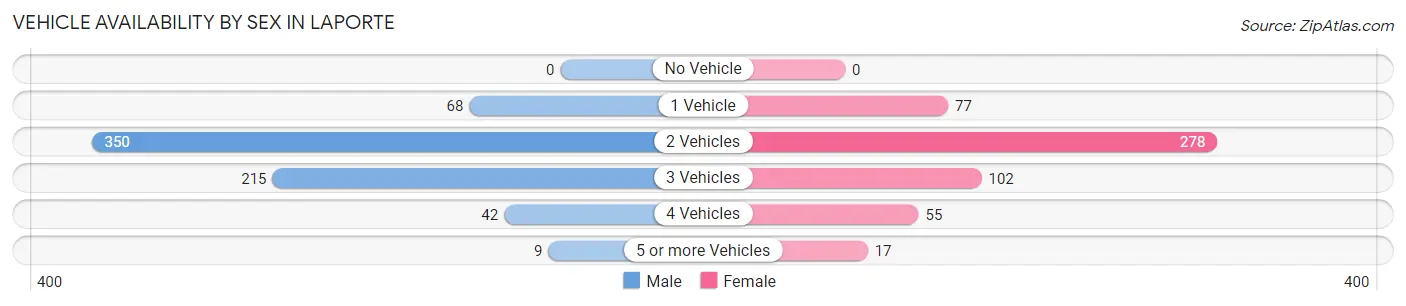
| Vehicles Available | Male | Female |
| No Vehicle | 0 (0.0%) | 0 (0.0%) |
| 1 Vehicle | 68 (9.9%) | 77 (14.6%) |
| 2 Vehicles | 350 (51.2%) | 278 (52.5%) |
| 3 Vehicles | 215 (31.4%) | 102 (19.3%) |
| 4 Vehicles | 42 (6.1%) | 55 (10.4%) |
| 5 or more Vehicles | 9 (1.3%) | 17 (3.2%) |
| Total | 684 (100.0%) | 529 (100.0%) |
Commute Time in Laporte
The most frequently occuring commute durations in Laporte are 30 to 34 minutes (238 commuters, 22.8%), 10 to 14 minutes (183 commuters, 17.5%), and 20 to 24 minutes (153 commuters, 14.7%).
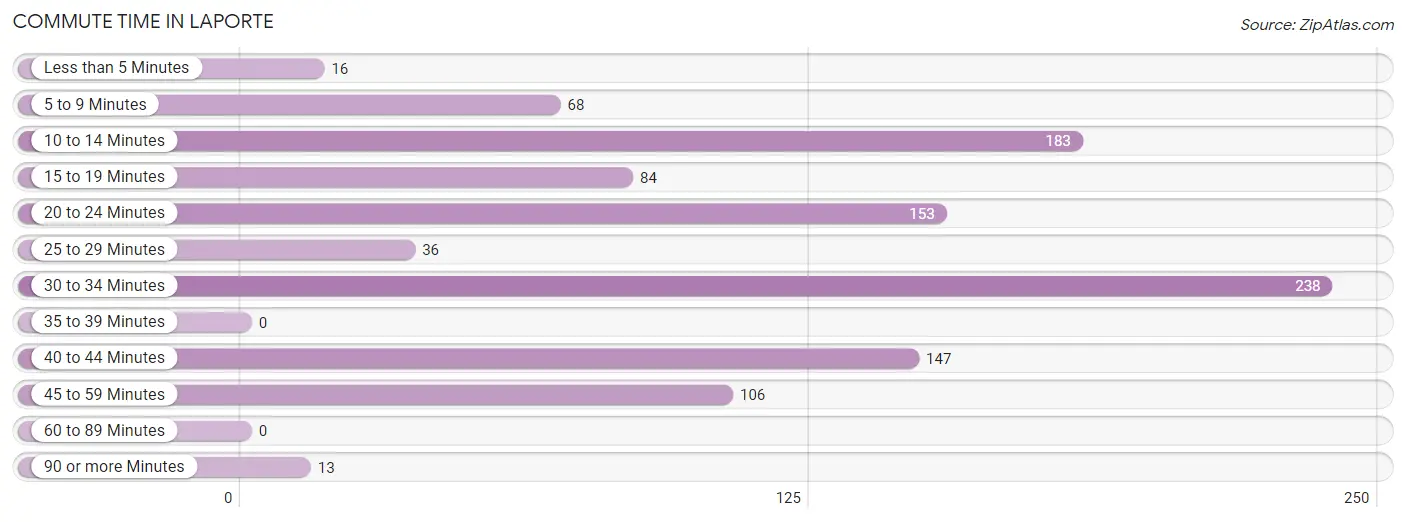
| Commute Time | # Commuters | % Commuters |
| Less than 5 Minutes | 16 | 1.5% |
| 5 to 9 Minutes | 68 | 6.5% |
| 10 to 14 Minutes | 183 | 17.5% |
| 15 to 19 Minutes | 84 | 8.1% |
| 20 to 24 Minutes | 153 | 14.7% |
| 25 to 29 Minutes | 36 | 3.5% |
| 30 to 34 Minutes | 238 | 22.8% |
| 35 to 39 Minutes | 0 | 0.0% |
| 40 to 44 Minutes | 147 | 14.1% |
| 45 to 59 Minutes | 106 | 10.2% |
| 60 to 89 Minutes | 0 | 0.0% |
| 90 or more Minutes | 13 | 1.3% |
Commute Time by Sex in Laporte
The most common commute times in Laporte are 20 to 24 minutes (108 commuters, 19.5%) for males and 30 to 34 minutes (162 commuters, 33.1%) for females.
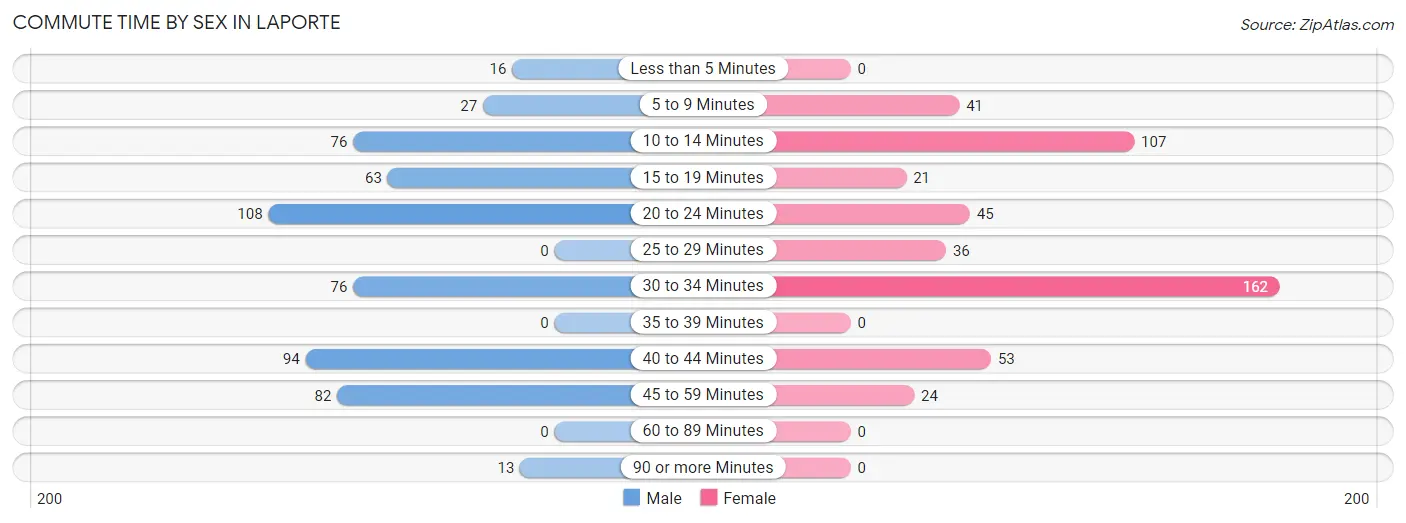
| Commute Time | Male | Female |
| Less than 5 Minutes | 16 (2.9%) | 0 (0.0%) |
| 5 to 9 Minutes | 27 (4.9%) | 41 (8.4%) |
| 10 to 14 Minutes | 76 (13.7%) | 107 (21.9%) |
| 15 to 19 Minutes | 63 (11.4%) | 21 (4.3%) |
| 20 to 24 Minutes | 108 (19.5%) | 45 (9.2%) |
| 25 to 29 Minutes | 0 (0.0%) | 36 (7.4%) |
| 30 to 34 Minutes | 76 (13.7%) | 162 (33.1%) |
| 35 to 39 Minutes | 0 (0.0%) | 0 (0.0%) |
| 40 to 44 Minutes | 94 (16.9%) | 53 (10.8%) |
| 45 to 59 Minutes | 82 (14.8%) | 24 (4.9%) |
| 60 to 89 Minutes | 0 (0.0%) | 0 (0.0%) |
| 90 or more Minutes | 13 (2.3%) | 0 (0.0%) |
Time of Departure to Work by Sex in Laporte
The most frequent times of departure to work in Laporte are 6:00 AM to 6:29 AM (156, 28.1%) for males and 8:00 AM to 8:29 AM (93, 19.0%) for females.
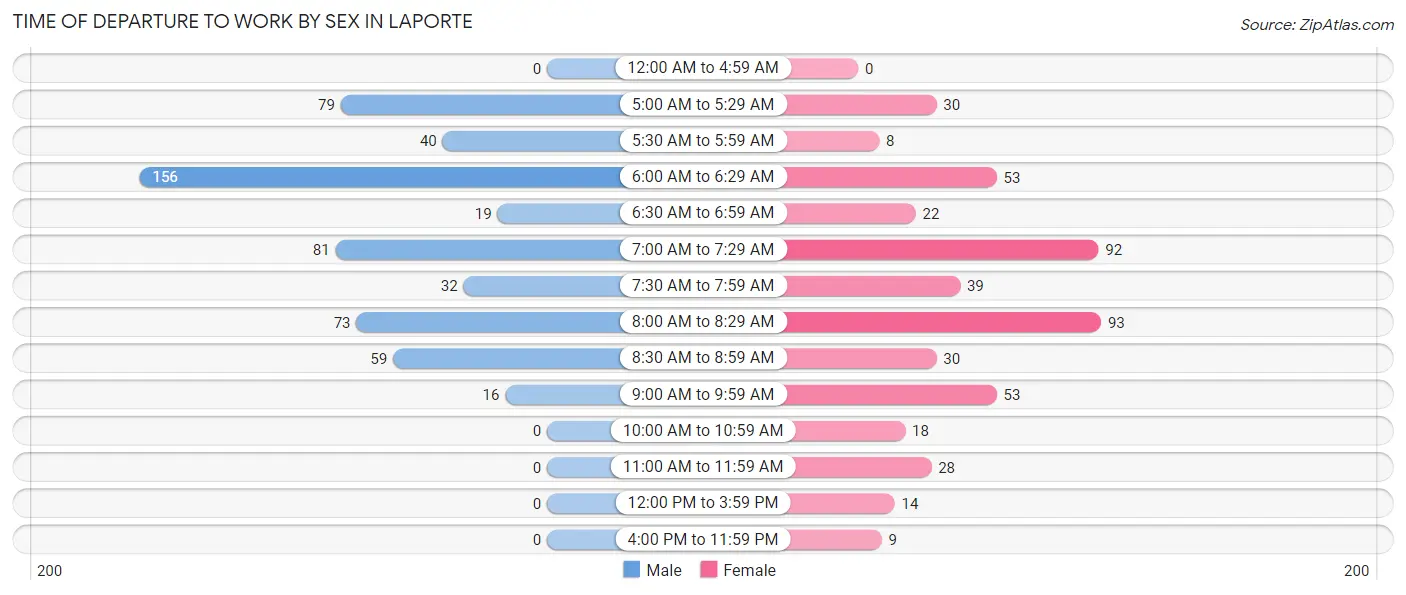
| Time of Departure | Male | Female |
| 12:00 AM to 4:59 AM | 0 (0.0%) | 0 (0.0%) |
| 5:00 AM to 5:29 AM | 79 (14.2%) | 30 (6.1%) |
| 5:30 AM to 5:59 AM | 40 (7.2%) | 8 (1.6%) |
| 6:00 AM to 6:29 AM | 156 (28.1%) | 53 (10.8%) |
| 6:30 AM to 6:59 AM | 19 (3.4%) | 22 (4.5%) |
| 7:00 AM to 7:29 AM | 81 (14.6%) | 92 (18.8%) |
| 7:30 AM to 7:59 AM | 32 (5.8%) | 39 (8.0%) |
| 8:00 AM to 8:29 AM | 73 (13.2%) | 93 (19.0%) |
| 8:30 AM to 8:59 AM | 59 (10.6%) | 30 (6.1%) |
| 9:00 AM to 9:59 AM | 16 (2.9%) | 53 (10.8%) |
| 10:00 AM to 10:59 AM | 0 (0.0%) | 18 (3.7%) |
| 11:00 AM to 11:59 AM | 0 (0.0%) | 28 (5.7%) |
| 12:00 PM to 3:59 PM | 0 (0.0%) | 14 (2.9%) |
| 4:00 PM to 11:59 PM | 0 (0.0%) | 9 (1.8%) |
| Total | 555 (100.0%) | 489 (100.0%) |
Housing Occupancy in Laporte
Occupancy by Ownership in Laporte
Of the total 1,082 dwellings in Laporte, owner-occupied units account for 730 (67.5%), while renter-occupied units make up 352 (32.5%).
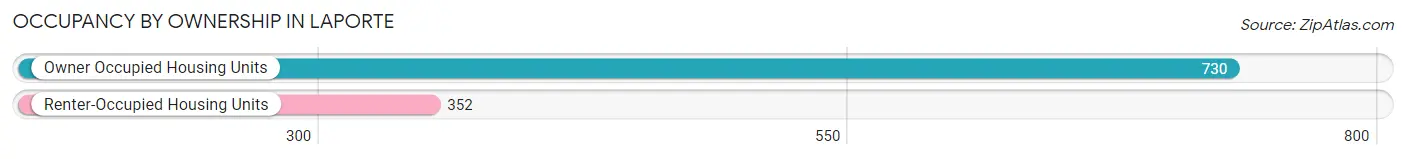
| Occupancy | # Housing Units | % Housing Units |
| Owner Occupied Housing Units | 730 | 67.5% |
| Renter-Occupied Housing Units | 352 | 32.5% |
| Total Occupied Housing Units | 1,082 | 100.0% |
Occupancy by Household Size in Laporte
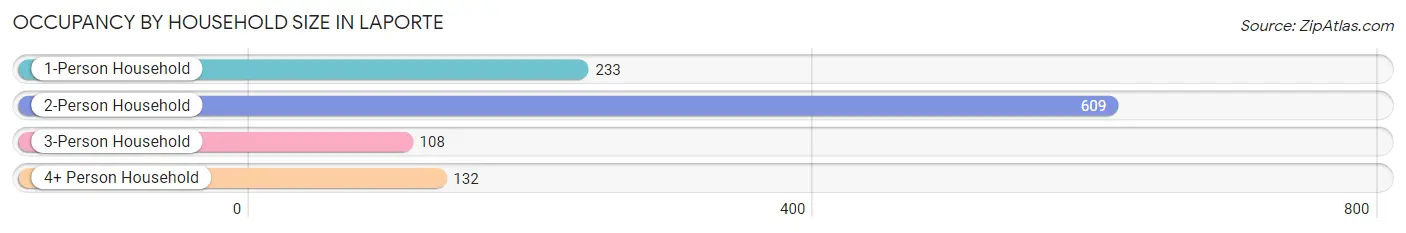
| Household Size | # Housing Units | % Housing Units |
| 1-Person Household | 233 | 21.5% |
| 2-Person Household | 609 | 56.3% |
| 3-Person Household | 108 | 10.0% |
| 4+ Person Household | 132 | 12.2% |
| Total Housing Units | 1,082 | 100.0% |
Occupancy by Ownership by Household Size in Laporte
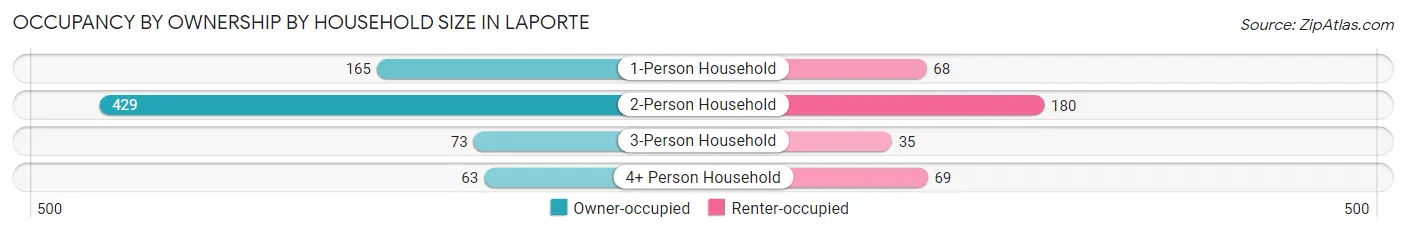
| Household Size | Owner-occupied | Renter-occupied |
| 1-Person Household | 165 (70.8%) | 68 (29.2%) |
| 2-Person Household | 429 (70.4%) | 180 (29.6%) |
| 3-Person Household | 73 (67.6%) | 35 (32.4%) |
| 4+ Person Household | 63 (47.7%) | 69 (52.3%) |
| Total Housing Units | 730 (67.5%) | 352 (32.5%) |
Occupancy by Educational Attainment in Laporte
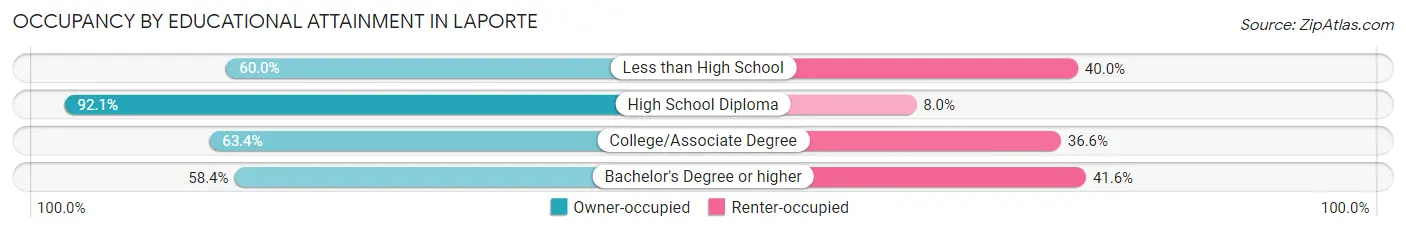
| Household Size | Owner-occupied | Renter-occupied |
| Less than High School | 54 (60.0%) | 36 (40.0%) |
| High School Diploma | 220 (92.0%) | 19 (8.0%) |
| College/Associate Degree | 206 (63.4%) | 119 (36.6%) |
| Bachelor's Degree or higher | 250 (58.4%) | 178 (41.6%) |
Occupancy by Age of Householder in Laporte
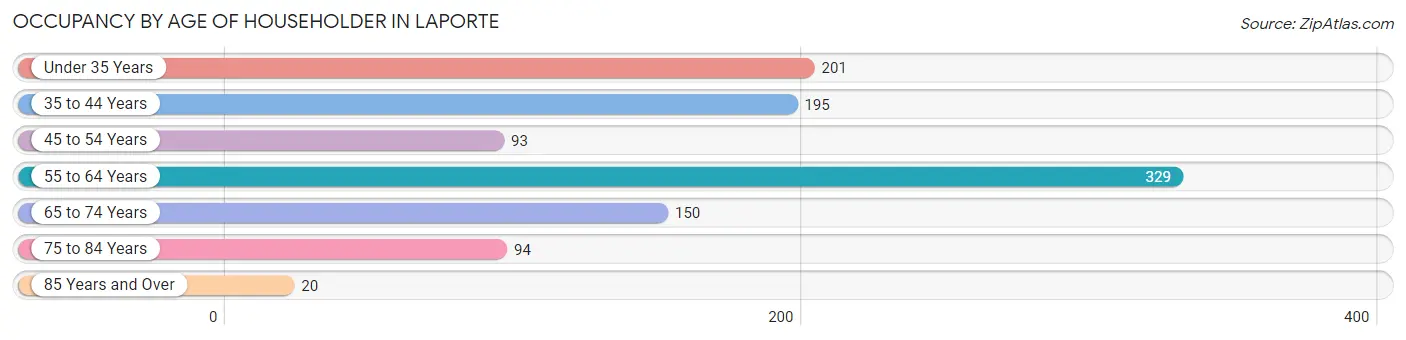
| Age Bracket | # Households | % Households |
| Under 35 Years | 201 | 18.6% |
| 35 to 44 Years | 195 | 18.0% |
| 45 to 54 Years | 93 | 8.6% |
| 55 to 64 Years | 329 | 30.4% |
| 65 to 74 Years | 150 | 13.9% |
| 75 to 84 Years | 94 | 8.7% |
| 85 Years and Over | 20 | 1.8% |
| Total | 1,082 | 100.0% |
Housing Finances in Laporte
Median Income by Occupancy in Laporte
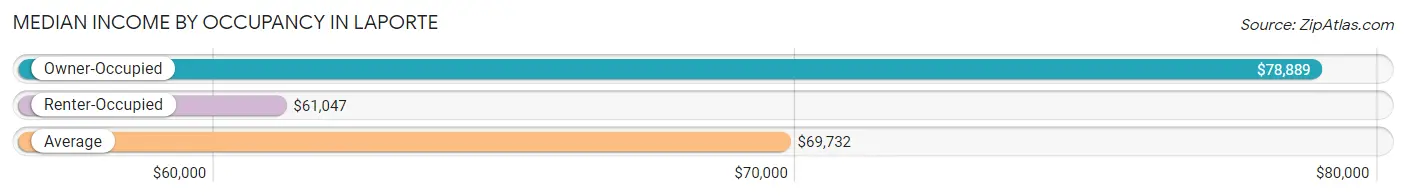
| Occupancy Type | # Households | Median Income |
| Owner-Occupied | 730 (67.5%) | $78,889 |
| Renter-Occupied | 352 (32.5%) | $61,047 |
| Average | 1,082 (100.0%) | $69,732 |
Occupancy by Householder Income Bracket in Laporte
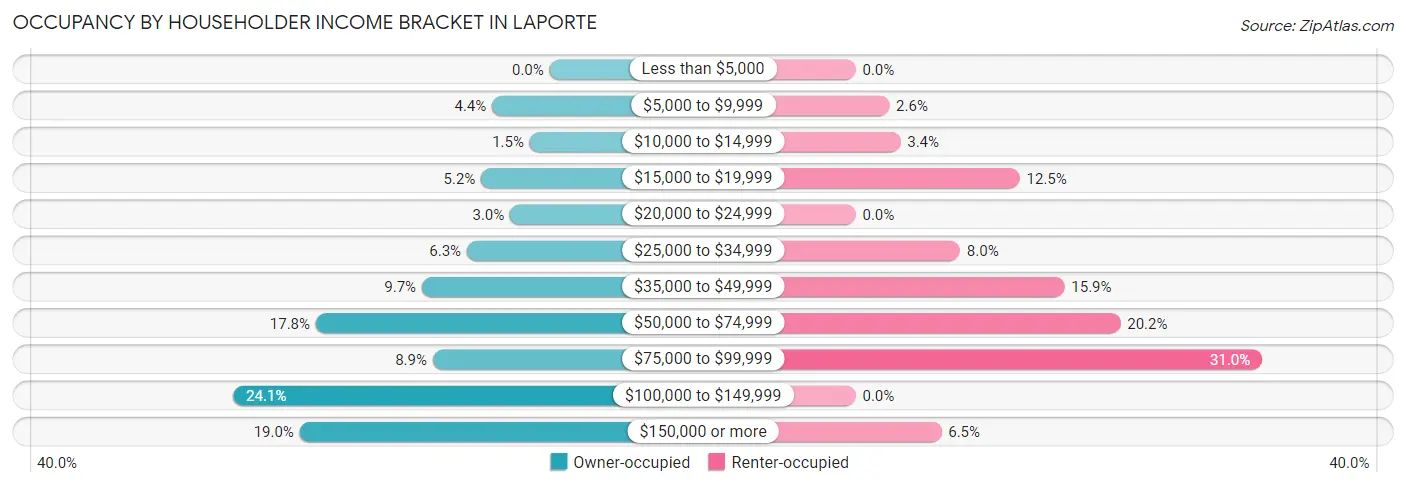
| Income Bracket | Owner-occupied | Renter-occupied |
| Less than $5,000 | 0 (0.0%) | 0 (0.0%) |
| $5,000 to $9,999 | 32 (4.4%) | 9 (2.6%) |
| $10,000 to $14,999 | 11 (1.5%) | 12 (3.4%) |
| $15,000 to $19,999 | 38 (5.2%) | 44 (12.5%) |
| $20,000 to $24,999 | 22 (3.0%) | 0 (0.0%) |
| $25,000 to $34,999 | 46 (6.3%) | 28 (8.0%) |
| $35,000 to $49,999 | 71 (9.7%) | 56 (15.9%) |
| $50,000 to $74,999 | 130 (17.8%) | 71 (20.2%) |
| $75,000 to $99,999 | 65 (8.9%) | 109 (31.0%) |
| $100,000 to $149,999 | 176 (24.1%) | 0 (0.0%) |
| $150,000 or more | 139 (19.0%) | 23 (6.5%) |
| Total | 730 (100.0%) | 352 (100.0%) |
Monthly Housing Cost Tiers in Laporte
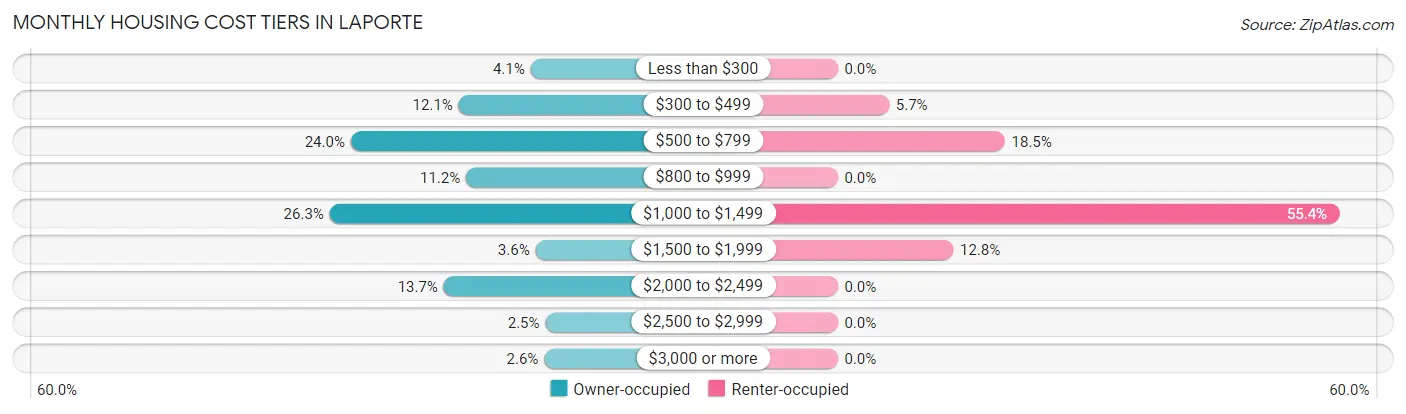
| Monthly Cost | Owner-occupied | Renter-occupied |
| Less than $300 | 30 (4.1%) | 0 (0.0%) |
| $300 to $499 | 88 (12.0%) | 20 (5.7%) |
| $500 to $799 | 175 (24.0%) | 65 (18.5%) |
| $800 to $999 | 82 (11.2%) | 0 (0.0%) |
| $1,000 to $1,499 | 192 (26.3%) | 195 (55.4%) |
| $1,500 to $1,999 | 26 (3.6%) | 45 (12.8%) |
| $2,000 to $2,499 | 100 (13.7%) | 0 (0.0%) |
| $2,500 to $2,999 | 18 (2.5%) | 0 (0.0%) |
| $3,000 or more | 19 (2.6%) | 0 (0.0%) |
| Total | 730 (100.0%) | 352 (100.0%) |
Physical Housing Characteristics in Laporte
Housing Structures in Laporte
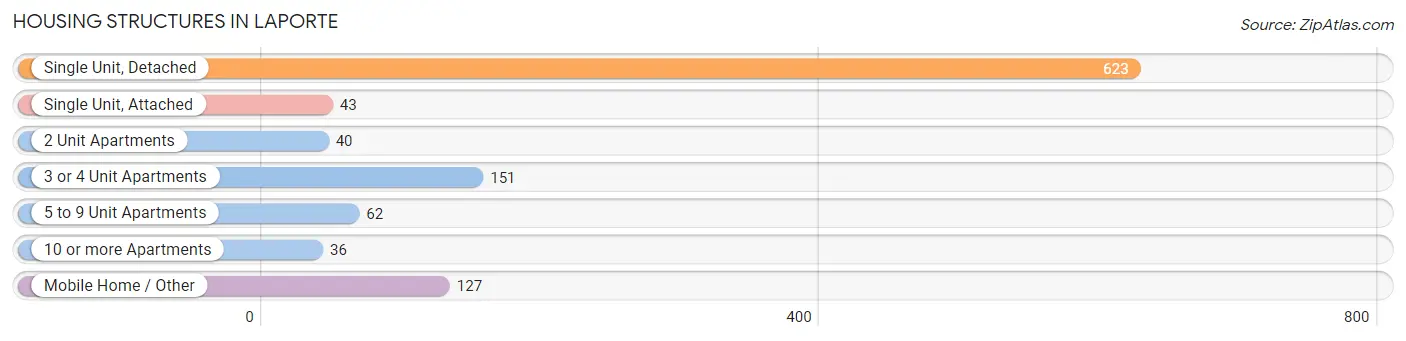
| Structure Type | # Housing Units | % Housing Units |
| Single Unit, Detached | 623 | 57.6% |
| Single Unit, Attached | 43 | 4.0% |
| 2 Unit Apartments | 40 | 3.7% |
| 3 or 4 Unit Apartments | 151 | 14.0% |
| 5 to 9 Unit Apartments | 62 | 5.7% |
| 10 or more Apartments | 36 | 3.3% |
| Mobile Home / Other | 127 | 11.7% |
| Total | 1,082 | 100.0% |
Housing Structures by Occupancy in Laporte
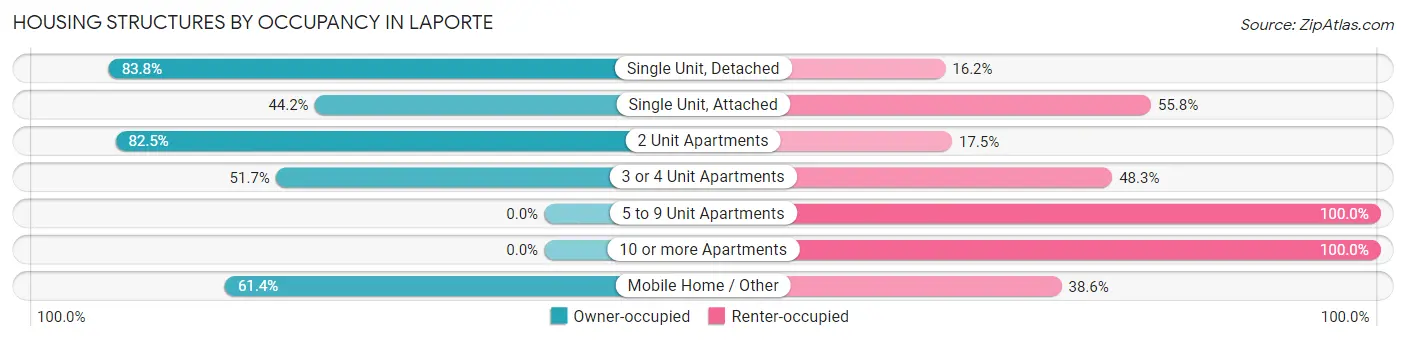
| Structure Type | Owner-occupied | Renter-occupied |
| Single Unit, Detached | 522 (83.8%) | 101 (16.2%) |
| Single Unit, Attached | 19 (44.2%) | 24 (55.8%) |
| 2 Unit Apartments | 33 (82.5%) | 7 (17.5%) |
| 3 or 4 Unit Apartments | 78 (51.7%) | 73 (48.3%) |
| 5 to 9 Unit Apartments | 0 (0.0%) | 62 (100.0%) |
| 10 or more Apartments | 0 (0.0%) | 36 (100.0%) |
| Mobile Home / Other | 78 (61.4%) | 49 (38.6%) |
| Total | 730 (67.5%) | 352 (32.5%) |
Housing Structures by Number of Rooms in Laporte
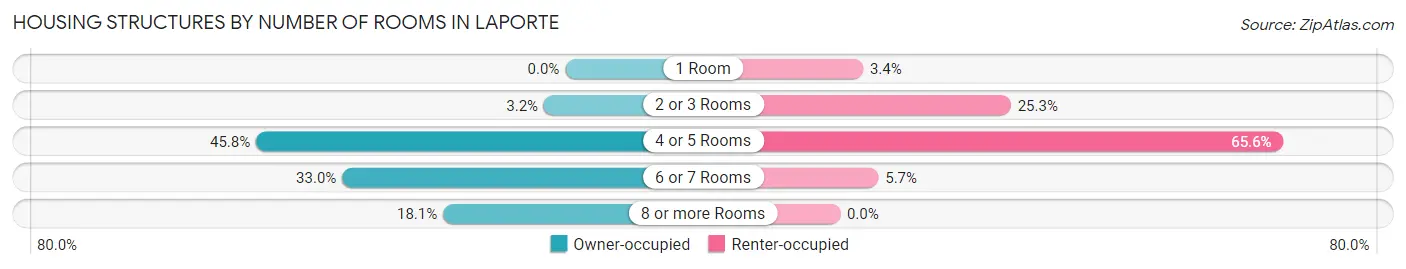
| Number of Rooms | Owner-occupied | Renter-occupied |
| 1 Room | 0 (0.0%) | 12 (3.4%) |
| 2 or 3 Rooms | 23 (3.2%) | 89 (25.3%) |
| 4 or 5 Rooms | 334 (45.8%) | 231 (65.6%) |
| 6 or 7 Rooms | 241 (33.0%) | 20 (5.7%) |
| 8 or more Rooms | 132 (18.1%) | 0 (0.0%) |
| Total | 730 (100.0%) | 352 (100.0%) |
Housing Structure by Heating Type in Laporte
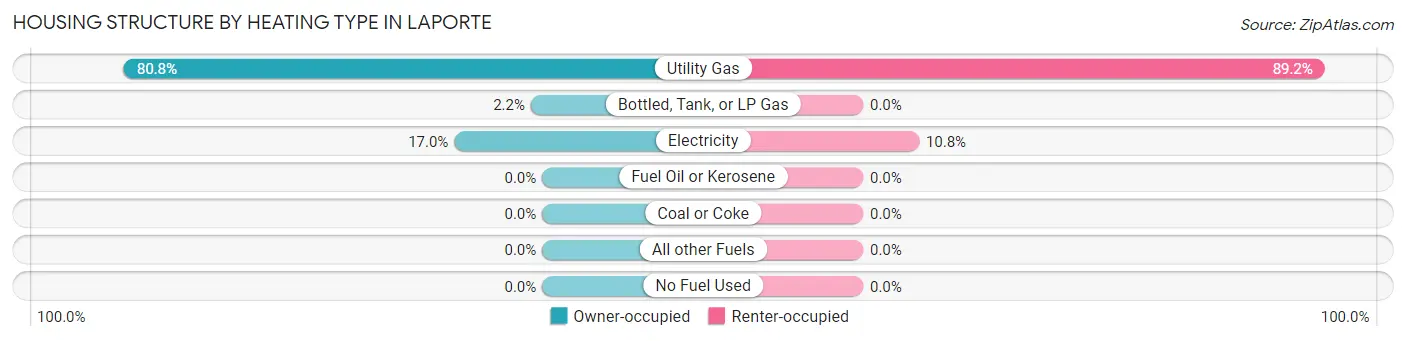
| Heating Type | Owner-occupied | Renter-occupied |
| Utility Gas | 590 (80.8%) | 314 (89.2%) |
| Bottled, Tank, or LP Gas | 16 (2.2%) | 0 (0.0%) |
| Electricity | 124 (17.0%) | 38 (10.8%) |
| Fuel Oil or Kerosene | 0 (0.0%) | 0 (0.0%) |
| Coal or Coke | 0 (0.0%) | 0 (0.0%) |
| All other Fuels | 0 (0.0%) | 0 (0.0%) |
| No Fuel Used | 0 (0.0%) | 0 (0.0%) |
| Total | 730 (100.0%) | 352 (100.0%) |
Household Vehicle Usage in Laporte
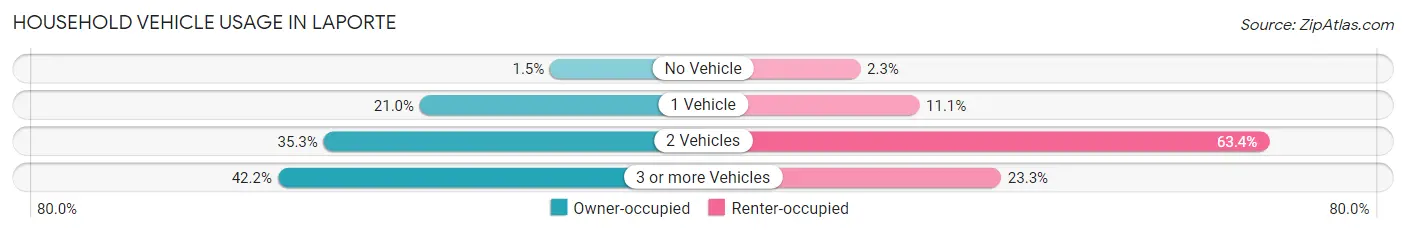
| Vehicles per Household | Owner-occupied | Renter-occupied |
| No Vehicle | 11 (1.5%) | 8 (2.3%) |
| 1 Vehicle | 153 (21.0%) | 39 (11.1%) |
| 2 Vehicles | 258 (35.3%) | 223 (63.3%) |
| 3 or more Vehicles | 308 (42.2%) | 82 (23.3%) |
| Total | 730 (100.0%) | 352 (100.0%) |
Real Estate & Mortgages in Laporte
Real Estate and Mortgage Overview in Laporte
| Characteristic | Without Mortgage | With Mortgage |
| Housing Units | 333 | 397 |
| Median Property Value | $368,200 | $343,800 |
| Median Household Income | $68,603 | $130 |
| Monthly Housing Costs | $548 | $19 |
| Real Estate Taxes | $2,253 | $0 |
Property Value by Mortgage Status in Laporte
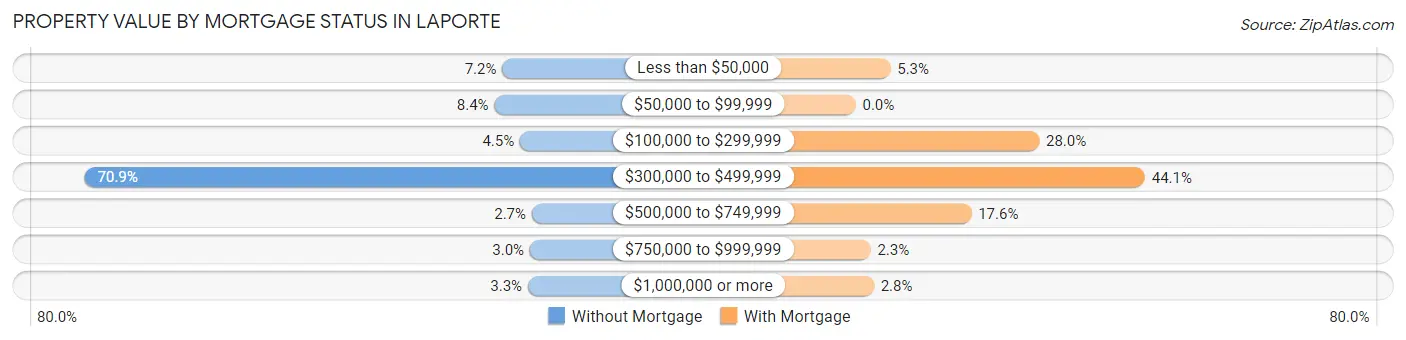
| Property Value | Without Mortgage | With Mortgage |
| Less than $50,000 | 24 (7.2%) | 21 (5.3%) |
| $50,000 to $99,999 | 28 (8.4%) | 0 (0.0%) |
| $100,000 to $299,999 | 15 (4.5%) | 111 (28.0%) |
| $300,000 to $499,999 | 236 (70.9%) | 175 (44.1%) |
| $500,000 to $749,999 | 9 (2.7%) | 70 (17.6%) |
| $750,000 to $999,999 | 10 (3.0%) | 9 (2.3%) |
| $1,000,000 or more | 11 (3.3%) | 11 (2.8%) |
| Total | 333 (100.0%) | 397 (100.0%) |
Household Income by Mortgage Status in Laporte
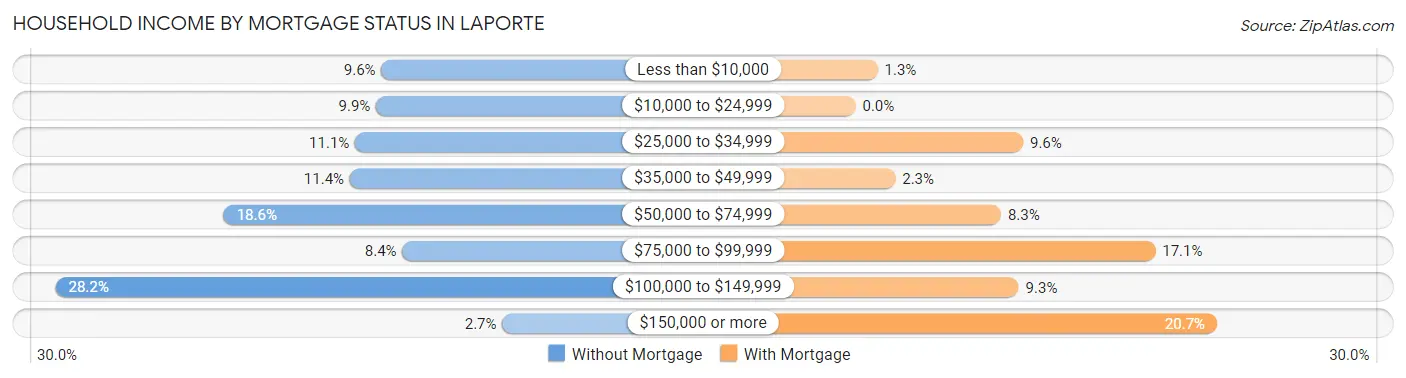
| Household Income | Without Mortgage | With Mortgage |
| Less than $10,000 | 32 (9.6%) | 5 (1.3%) |
| $10,000 to $24,999 | 33 (9.9%) | 0 (0.0%) |
| $25,000 to $34,999 | 37 (11.1%) | 38 (9.6%) |
| $35,000 to $49,999 | 38 (11.4%) | 9 (2.3%) |
| $50,000 to $74,999 | 62 (18.6%) | 33 (8.3%) |
| $75,000 to $99,999 | 28 (8.4%) | 68 (17.1%) |
| $100,000 to $149,999 | 94 (28.2%) | 37 (9.3%) |
| $150,000 or more | 9 (2.7%) | 82 (20.6%) |
| Total | 333 (100.0%) | 397 (100.0%) |
Property Value to Household Income Ratio in Laporte
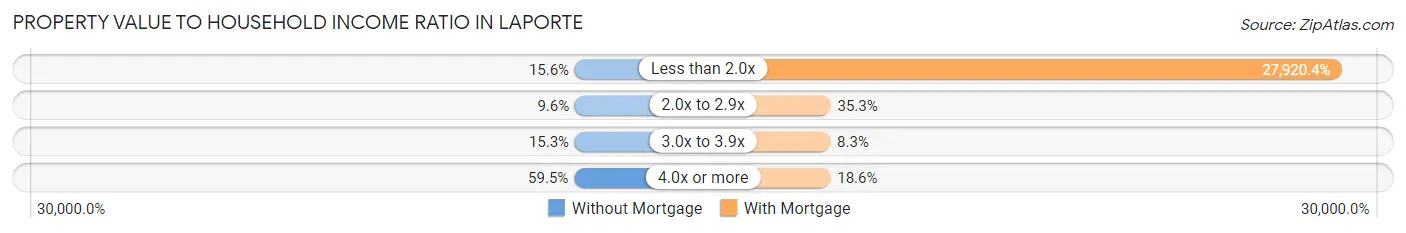
| Value-to-Income Ratio | Without Mortgage | With Mortgage |
| Less than 2.0x | 52 (15.6%) | 110,844 (27,920.4%) |
| 2.0x to 2.9x | 32 (9.6%) | 140 (35.3%) |
| 3.0x to 3.9x | 51 (15.3%) | 33 (8.3%) |
| 4.0x or more | 198 (59.5%) | 74 (18.6%) |
| Total | 333 (100.0%) | 397 (100.0%) |
Real Estate Taxes by Mortgage Status in Laporte
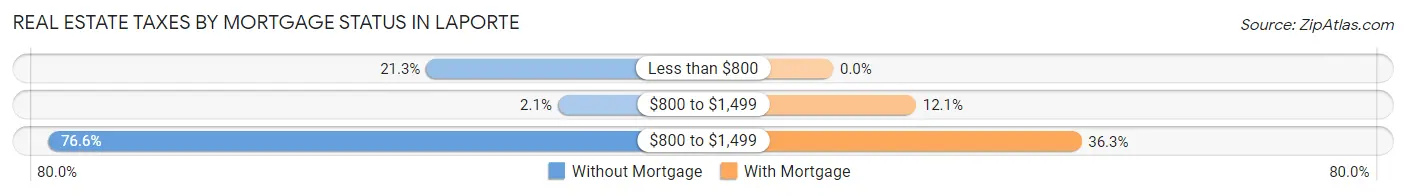
| Property Taxes | Without Mortgage | With Mortgage |
| Less than $800 | 71 (21.3%) | 0 (0.0%) |
| $800 to $1,499 | 7 (2.1%) | 48 (12.1%) |
| $800 to $1,499 | 255 (76.6%) | 144 (36.3%) |
| Total | 333 (100.0%) | 397 (100.0%) |
Health & Disability in Laporte
Health Insurance Coverage by Age in Laporte
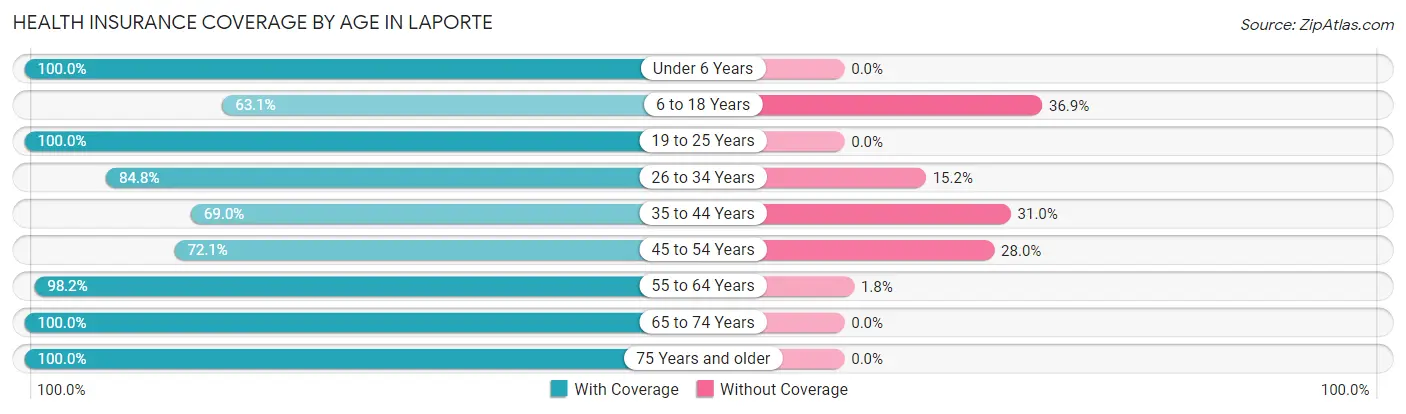
| Age Bracket | With Coverage | Without Coverage |
| Under 6 Years | 58 (100.0%) | 0 (0.0%) |
| 6 to 18 Years | 190 (63.1%) | 111 (36.9%) |
| 19 to 25 Years | 78 (100.0%) | 0 (0.0%) |
| 26 to 34 Years | 240 (84.8%) | 43 (15.2%) |
| 35 to 44 Years | 229 (69.0%) | 103 (31.0%) |
| 45 to 54 Years | 165 (72.1%) | 64 (28.0%) |
| 55 to 64 Years | 487 (98.2%) | 9 (1.8%) |
| 65 to 74 Years | 297 (100.0%) | 0 (0.0%) |
| 75 Years and older | 159 (100.0%) | 0 (0.0%) |
| Total | 1,903 (85.2%) | 330 (14.8%) |
Health Insurance Coverage by Citizenship Status in Laporte

| Citizenship Status | With Coverage | Without Coverage |
| Native Born | 58 (100.0%) | 0 (0.0%) |
| Foreign Born, Citizen | 190 (63.1%) | 111 (36.9%) |
| Foreign Born, not a Citizen | 78 (100.0%) | 0 (0.0%) |
Health Insurance Coverage by Household Income in Laporte

| Household Income | With Coverage | Without Coverage |
| Under $25,000 | 224 (97.0%) | 7 (3.0%) |
| $25,000 to $49,999 | 344 (79.3%) | 90 (20.7%) |
| $50,000 to $74,999 | 358 (89.3%) | 43 (10.7%) |
| $75,000 to $99,999 | 344 (82.1%) | 75 (17.9%) |
| $100,000 and over | 633 (84.6%) | 115 (15.4%) |
Public vs Private Health Insurance Coverage by Age in Laporte
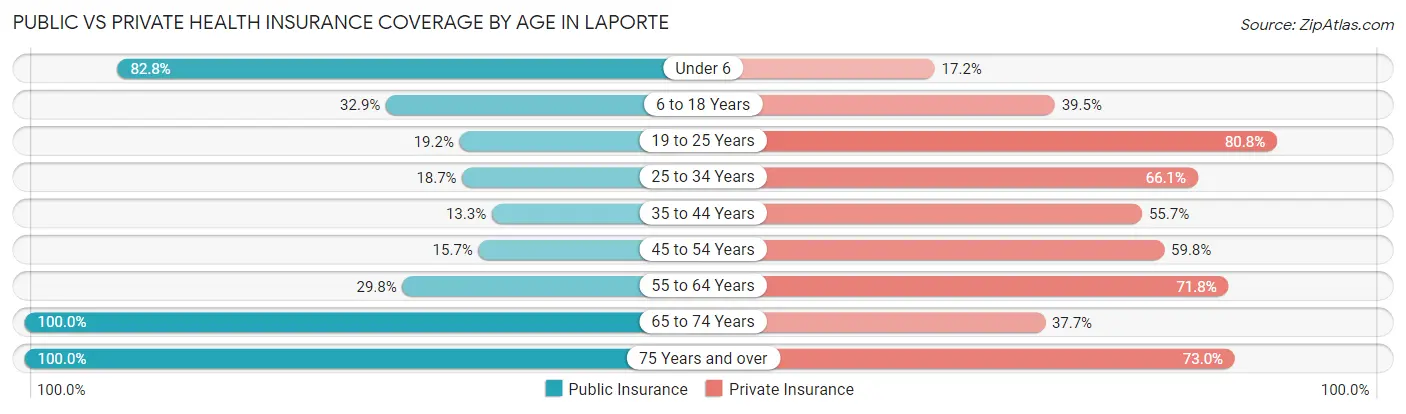
| Age Bracket | Public Insurance | Private Insurance |
| Under 6 | 48 (82.8%) | 10 (17.2%) |
| 6 to 18 Years | 99 (32.9%) | 119 (39.5%) |
| 19 to 25 Years | 15 (19.2%) | 63 (80.8%) |
| 25 to 34 Years | 53 (18.7%) | 187 (66.1%) |
| 35 to 44 Years | 44 (13.3%) | 185 (55.7%) |
| 45 to 54 Years | 36 (15.7%) | 137 (59.8%) |
| 55 to 64 Years | 148 (29.8%) | 356 (71.8%) |
| 65 to 74 Years | 297 (100.0%) | 112 (37.7%) |
| 75 Years and over | 159 (100.0%) | 116 (73.0%) |
| Total | 899 (40.3%) | 1,285 (57.6%) |
Disability Status by Sex by Age in Laporte
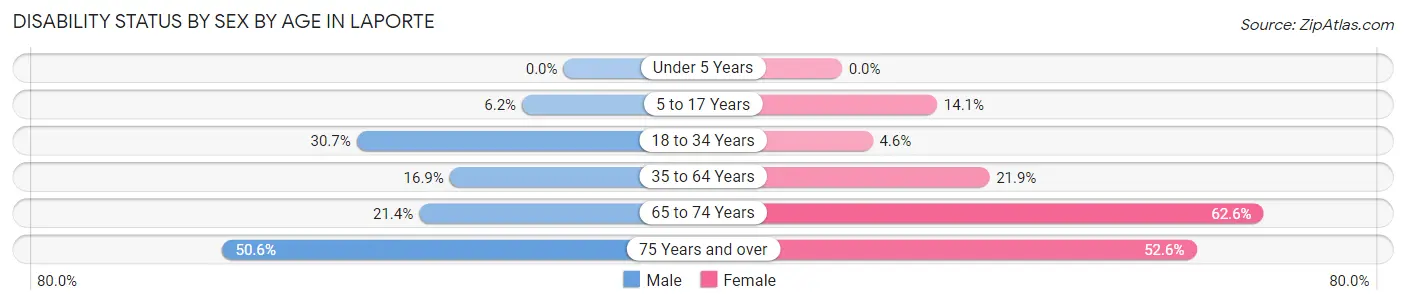
| Age Bracket | Male | Female |
| Under 5 Years | 0 (0.0%) | 0 (0.0%) |
| 5 to 17 Years | 8 (6.1%) | 24 (14.1%) |
| 18 to 34 Years | 43 (30.7%) | 11 (4.5%) |
| 35 to 64 Years | 89 (16.9%) | 116 (21.9%) |
| 65 to 74 Years | 39 (21.4%) | 72 (62.6%) |
| 75 Years and over | 42 (50.6%) | 40 (52.6%) |
Disability Class by Sex by Age in Laporte
Disability Class: Hearing Difficulty
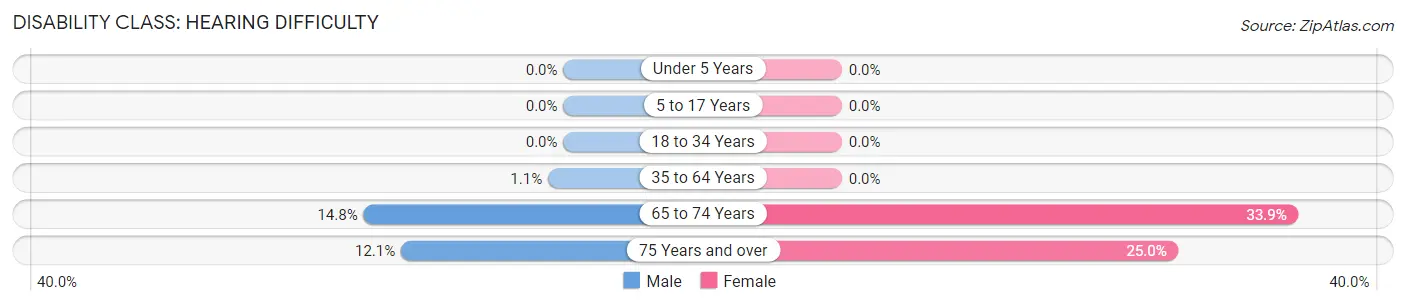
| Age Bracket | Male | Female |
| Under 5 Years | 0 (0.0%) | 0 (0.0%) |
| 5 to 17 Years | 0 (0.0%) | 0 (0.0%) |
| 18 to 34 Years | 0 (0.0%) | 0 (0.0%) |
| 35 to 64 Years | 6 (1.1%) | 0 (0.0%) |
| 65 to 74 Years | 27 (14.8%) | 39 (33.9%) |
| 75 Years and over | 10 (12.0%) | 19 (25.0%) |
Disability Class: Vision Difficulty
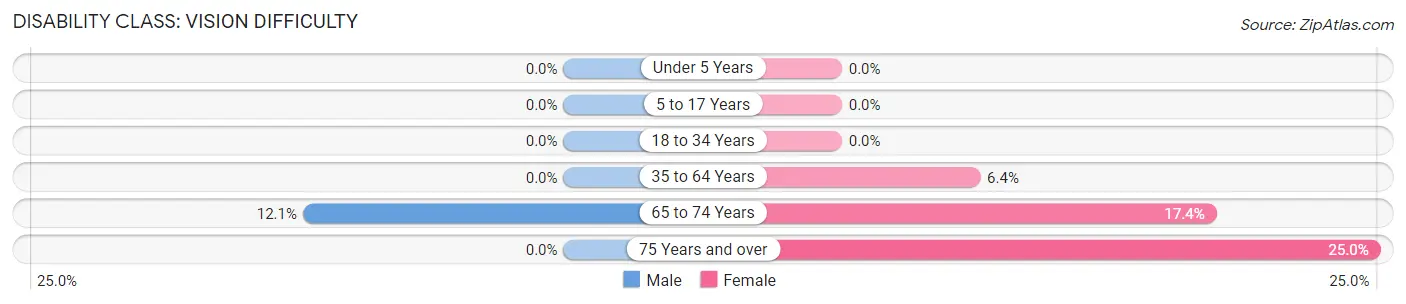
| Age Bracket | Male | Female |
| Under 5 Years | 0 (0.0%) | 0 (0.0%) |
| 5 to 17 Years | 0 (0.0%) | 0 (0.0%) |
| 18 to 34 Years | 0 (0.0%) | 0 (0.0%) |
| 35 to 64 Years | 0 (0.0%) | 34 (6.4%) |
| 65 to 74 Years | 22 (12.1%) | 20 (17.4%) |
| 75 Years and over | 0 (0.0%) | 19 (25.0%) |
Disability Class: Cognitive Difficulty
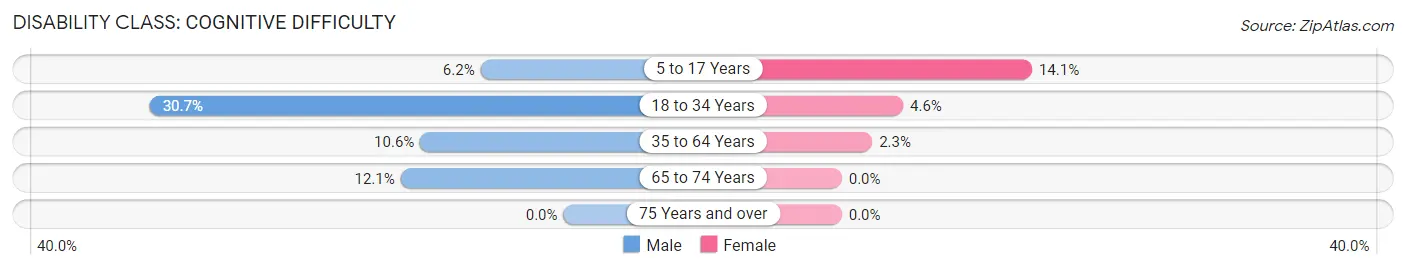
| Age Bracket | Male | Female |
| 5 to 17 Years | 8 (6.1%) | 24 (14.1%) |
| 18 to 34 Years | 43 (30.7%) | 11 (4.5%) |
| 35 to 64 Years | 56 (10.6%) | 12 (2.3%) |
| 65 to 74 Years | 22 (12.1%) | 0 (0.0%) |
| 75 Years and over | 0 (0.0%) | 0 (0.0%) |
Disability Class: Ambulatory Difficulty
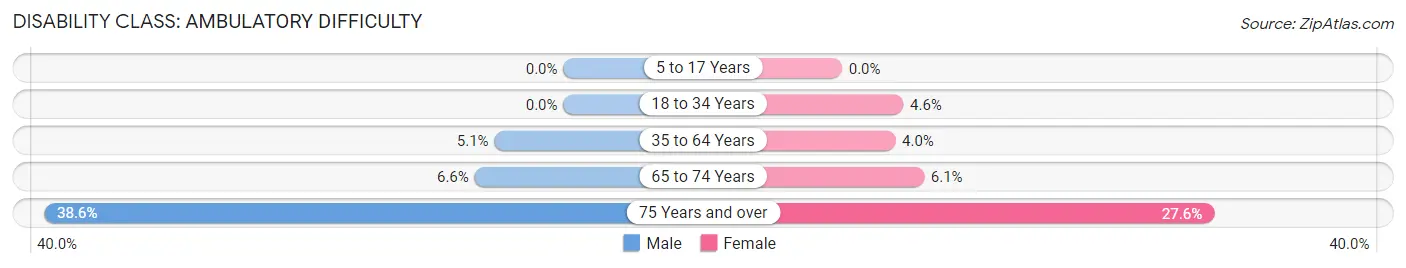
| Age Bracket | Male | Female |
| 5 to 17 Years | 0 (0.0%) | 0 (0.0%) |
| 18 to 34 Years | 0 (0.0%) | 11 (4.5%) |
| 35 to 64 Years | 27 (5.1%) | 21 (4.0%) |
| 65 to 74 Years | 12 (6.6%) | 7 (6.1%) |
| 75 Years and over | 32 (38.6%) | 21 (27.6%) |
Disability Class: Self-Care Difficulty
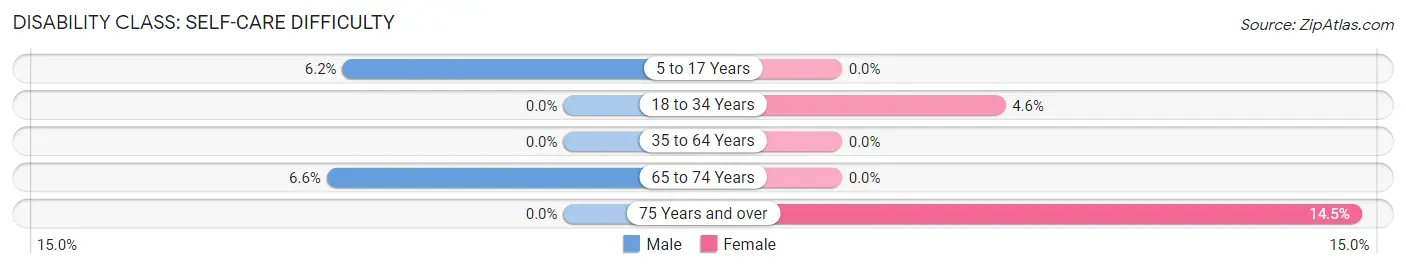
| Age Bracket | Male | Female |
| 5 to 17 Years | 8 (6.1%) | 0 (0.0%) |
| 18 to 34 Years | 0 (0.0%) | 11 (4.5%) |
| 35 to 64 Years | 0 (0.0%) | 0 (0.0%) |
| 65 to 74 Years | 12 (6.6%) | 0 (0.0%) |
| 75 Years and over | 0 (0.0%) | 11 (14.5%) |
Technology Access in Laporte
Computing Device Access in Laporte
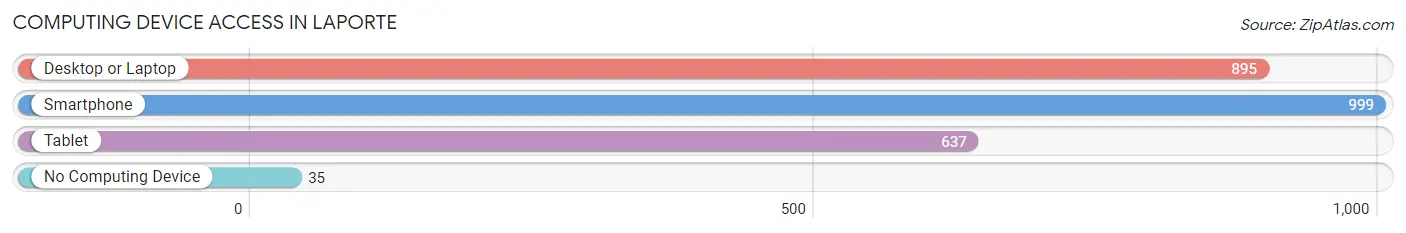
| Device Type | # Households | % Households |
| Desktop or Laptop | 895 | 82.7% |
| Smartphone | 999 | 92.3% |
| Tablet | 637 | 58.9% |
| No Computing Device | 35 | 3.2% |
| Total | 1,082 | 100.0% |
Internet Access in Laporte
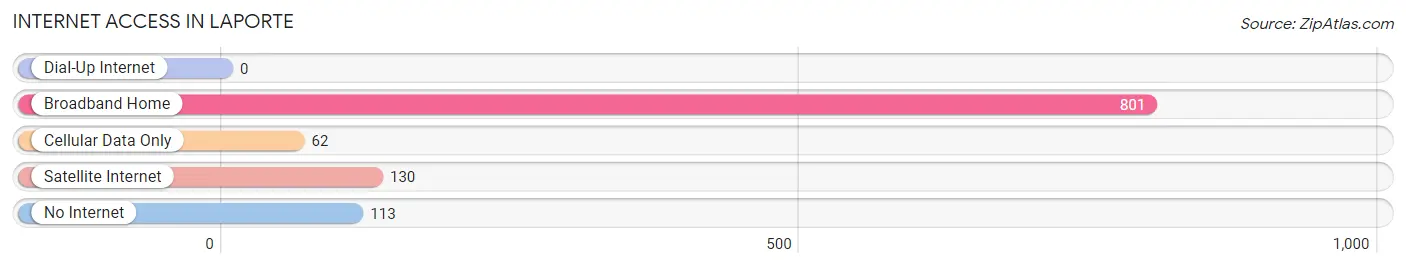
| Internet Type | # Households | % Households |
| Dial-Up Internet | 0 | 0.0% |
| Broadband Home | 801 | 74.0% |
| Cellular Data Only | 62 | 5.7% |
| Satellite Internet | 130 | 12.0% |
| No Internet | 113 | 10.4% |
| Total | 1,082 | 100.0% |
Laporte Summary
Laporte, Colorado is a small town located in Larimer County, Colorado. It is situated in the foothills of the Rocky Mountains, approximately 10 miles west of Fort Collins. The town was founded in 1873 and has a population of approximately 1,000 people.
History
Laporte was founded in 1873 by a group of settlers from the Midwest. The town was named after the French explorer, Pierre Laporte, who explored the area in the late 1700s. The town was originally a farming community, but it soon became a popular destination for tourists and outdoor enthusiasts. The town was also home to a number of businesses, including a hotel, a general store, and a post office.
In the early 1900s, the town began to experience a period of growth. The population increased from around 200 in 1900 to over 1,000 by the 1950s. During this time, the town was home to a number of businesses, including a bank, a movie theater, and a variety of shops.
Geography
Laporte is located in the foothills of the Rocky Mountains, approximately 10 miles west of Fort Collins. The town is situated at an elevation of 5,400 feet and is surrounded by rolling hills and open fields. The Cache la Poudre River runs through the town, providing a source of recreation for the residents.
The climate in Laporte is generally mild, with temperatures ranging from the low 30s in the winter to the mid-80s in the summer. The town receives an average of 16 inches of precipitation per year, with most of it falling in the form of snow.
Economy
The economy of Laporte is largely based on tourism and outdoor recreation. The town is home to a number of businesses, including restaurants, shops, and lodging. The town is also home to a number of outdoor recreation activities, including fishing, hiking, and camping.
The town is also home to a number of small businesses, including a hardware store, a grocery store, and a gas station. The town is also home to a number of farms, which produce a variety of crops, including hay, corn, and wheat.
Demographics
As of the 2010 census, the population of Laporte was 1,000. The town is predominantly white, with approximately 95% of the population identifying as Caucasian. The median household income is $50,000, and the median age is 40.
Conclusion
Laporte, Colorado is a small town located in Larimer County, Colorado. It is situated in the foothills of the Rocky Mountains, approximately 10 miles west of Fort Collins. The town was founded in 1873 and has a population of approximately 1,000 people. The economy of Laporte is largely based on tourism and outdoor recreation, and the town is home to a number of businesses, including restaurants, shops, and lodging. The town is predominantly white, with approximately 95% of the population identifying as Caucasian.
Common Questions
What is Per Capita Income in Laporte?
Per Capita income in Laporte is $37,947.
What is the Median Family Income in Laporte?
Median Family Income in Laporte is $80,903.
What is the Median Household income in Laporte?
Median Household Income in Laporte is $69,732.
What is Income or Wage Gap in Laporte?
Income or Wage Gap in Laporte is 40.0%.
Women in Laporte earn 60.0 cents for every dollar earned by a man.
What is Inequality or Gini Index in Laporte?
Inequality or Gini Index in Laporte is 0.39.
What is the Total Population of Laporte?
Total Population of Laporte is 2,233.
What is the Total Male Population of Laporte?
Total Male Population of Laporte is 1,100.
What is the Total Female Population of Laporte?
Total Female Population of Laporte is 1,133.
What is the Ratio of Males per 100 Females in Laporte?
There are 97.09 Males per 100 Females in Laporte.
What is the Ratio of Females per 100 Males in Laporte?
There are 103.00 Females per 100 Males in Laporte.
What is the Median Population Age in Laporte?
Median Population Age in Laporte is 49.3 Years.
What is the Average Family Size in Laporte
Average Family Size in Laporte is 2.4 People.
What is the Average Household Size in Laporte
Average Household Size in Laporte is 2.1 People.
How Large is the Labor Force in Laporte?
There are 1,296 People in the Labor Forcein in Laporte.
What is the Percentage of People in the Labor Force in Laporte?
67.0% of People are in the Labor Force in Laporte.
What is the Unemployment Rate in Laporte?
Unemployment Rate in Laporte is 3.4%.