Athens, TX Map & Demographics
Athens Map
Athens Overview
$29,235
PER CAPITA INCOME
$68,951
AVG FAMILY INCOME
$54,828
AVG HOUSEHOLD INCOME
49.1%
WAGE / INCOME GAP [ % ]
50.9¢/ $1
WAGE / INCOME GAP [ $ ]
$9,666
FAMILY INCOME DEFICIT
0.47
INEQUALITY / GINI INDEX
12,878
TOTAL POPULATION
6,025
MALE POPULATION
6,853
FEMALE POPULATION
87.92
MALES / 100 FEMALES
113.74
FEMALES / 100 MALES
38.2
MEDIAN AGE
3.4
AVG FAMILY SIZE
2.6
AVG HOUSEHOLD SIZE
5,926
LABOR FORCE [ PEOPLE ]
57.1%
PERCENT IN LABOR FORCE
2.4%
UNEMPLOYMENT RATE
Income in Athens
Income Overview in Athens
Per Capita Income in Athens is $29,235, while median incomes of families and households are $68,951 and $54,828 respectively.
| Characteristic | Number | Measure |
| Per Capita Income | 12,878 | $29,235 |
| Median Family Income | 2,729 | $68,951 |
| Mean Family Income | 2,729 | $93,850 |
| Median Household Income | 4,582 | $54,828 |
| Mean Household Income | 4,582 | $75,158 |
| Income Deficit | 2,729 | $9,666 |
| Wage / Income Gap (%) | 12,878 | 49.08% |
| Wage / Income Gap ($) | 12,878 | 50.92¢ per $1 |
| Gini / Inequality Index | 12,878 | 0.47 |
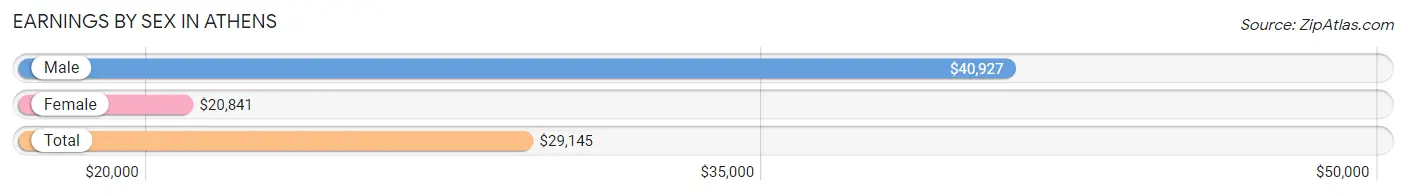
Earnings by Sex in Athens
Average Earnings in Athens are $29,145, $40,927 for men and $20,841 for women, a difference of 49.1%.
| Sex | Number | Average Earnings |
| Male | 2,984 (48.3%) | $40,927 |
| Female | 3,192 (51.7%) | $20,841 |
| Total | 6,176 (100.0%) | $29,145 |
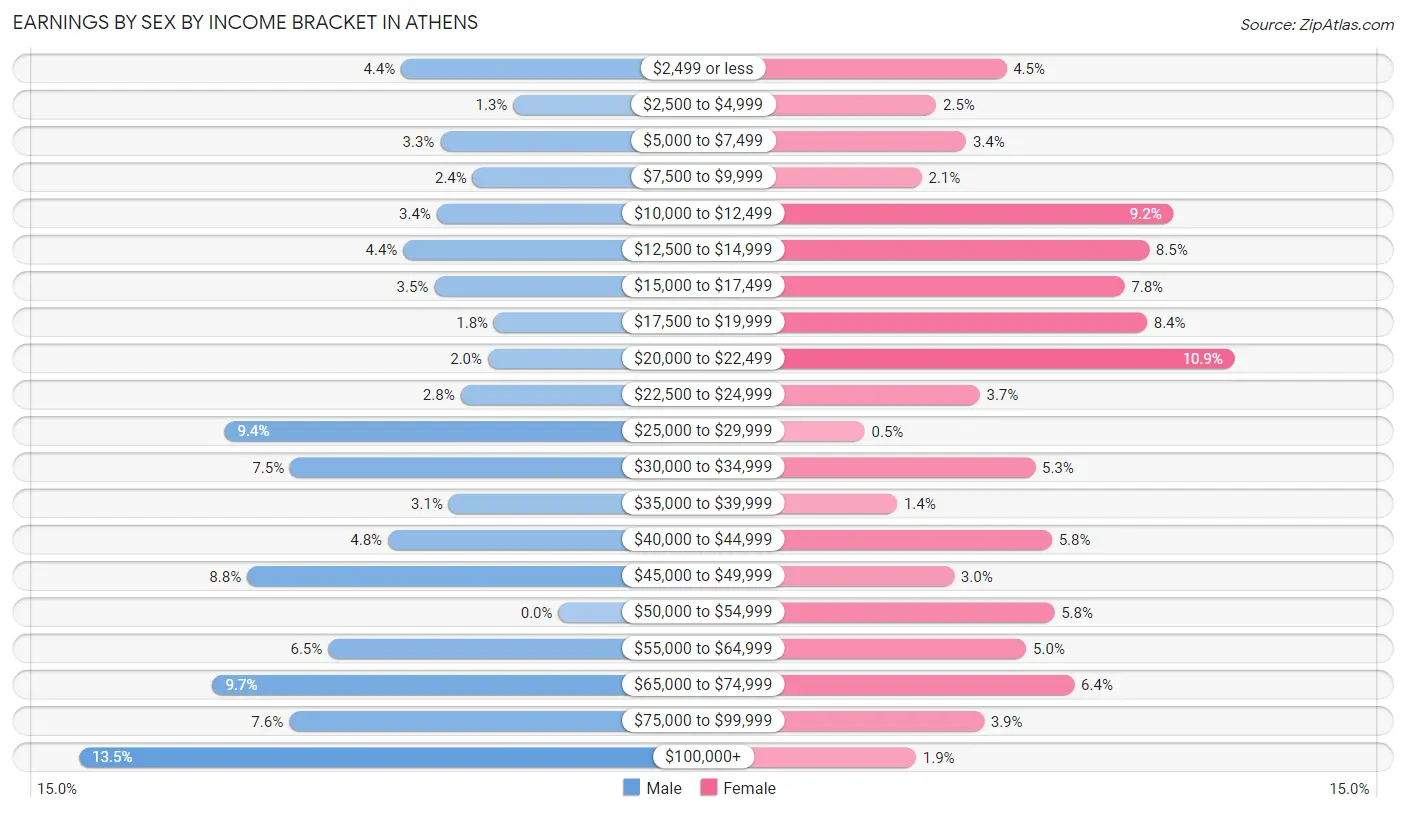
Earnings by Sex by Income Bracket in Athens
The most common earnings brackets in Athens are $100,000+ for men (402 | 13.5%) and $20,000 to $22,499 for women (348 | 10.9%).
| Income | Male | Female |
| $2,499 or less | 132 (4.4%) | 143 (4.5%) |
| $2,500 to $4,999 | 38 (1.3%) | 80 (2.5%) |
| $5,000 to $7,499 | 99 (3.3%) | 107 (3.4%) |
| $7,500 to $9,999 | 72 (2.4%) | 67 (2.1%) |
| $10,000 to $12,499 | 102 (3.4%) | 293 (9.2%) |
| $12,500 to $14,999 | 130 (4.4%) | 271 (8.5%) |
| $15,000 to $17,499 | 104 (3.5%) | 249 (7.8%) |
| $17,500 to $19,999 | 54 (1.8%) | 269 (8.4%) |
| $20,000 to $22,499 | 59 (2.0%) | 348 (10.9%) |
| $22,500 to $24,999 | 82 (2.8%) | 119 (3.7%) |
| $25,000 to $29,999 | 280 (9.4%) | 16 (0.5%) |
| $30,000 to $34,999 | 225 (7.5%) | 169 (5.3%) |
| $35,000 to $39,999 | 92 (3.1%) | 45 (1.4%) |
| $40,000 to $44,999 | 143 (4.8%) | 184 (5.8%) |
| $45,000 to $49,999 | 261 (8.7%) | 96 (3.0%) |
| $50,000 to $54,999 | 0 (0.0%) | 186 (5.8%) |
| $55,000 to $64,999 | 193 (6.5%) | 161 (5.0%) |
| $65,000 to $74,999 | 290 (9.7%) | 204 (6.4%) |
| $75,000 to $99,999 | 226 (7.6%) | 123 (3.8%) |
| $100,000+ | 402 (13.5%) | 62 (1.9%) |
| Total | 2,984 (100.0%) | 3,192 (100.0%) |
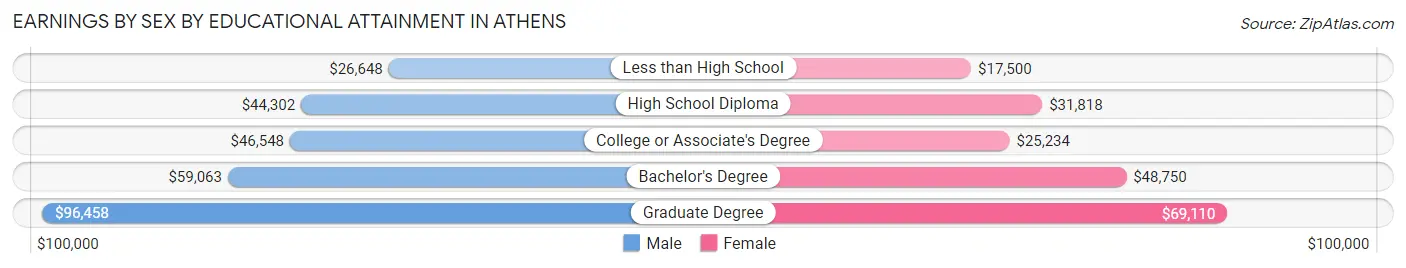
Earnings by Sex by Educational Attainment in Athens
Average earnings in Athens are $46,373 for men and $31,356 for women, a difference of 32.4%. Men with an educational attainment of graduate degree enjoy the highest average annual earnings of $96,458, while those with less than high school education earn the least with $26,648. Women with an educational attainment of graduate degree earn the most with the average annual earnings of $69,110, while those with less than high school education have the smallest earnings of $17,500.
| Educational Attainment | Male Income | Female Income |
| Less than High School | $26,648 | $17,500 |
| High School Diploma | $44,302 | $31,818 |
| College or Associate's Degree | $46,548 | $25,234 |
| Bachelor's Degree | $59,063 | $48,750 |
| Graduate Degree | $96,458 | $69,110 |
| Total | $46,373 | $31,356 |
Family Income in Athens
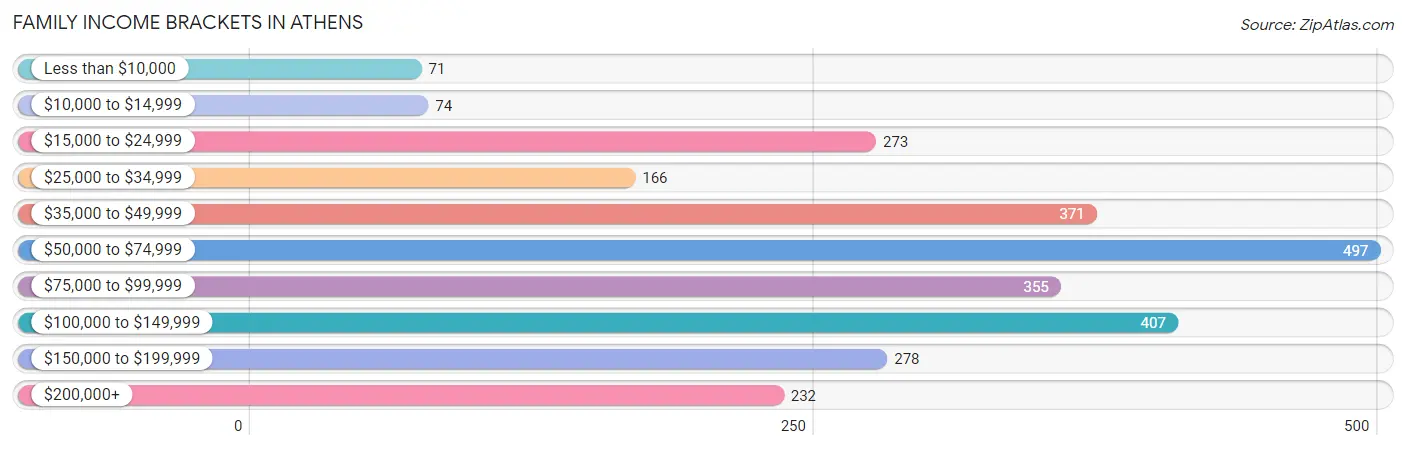
Family Income Brackets in Athens
According to the Athens family income data, there are 497 families falling into the $50,000 to $74,999 income range, which is the most common income bracket and makes up 18.2% of all families. Conversely, the less than $10,000 income bracket is the least frequent group with only 71 families (2.6%) belonging to this category.
| Income Bracket | # Families | % Families |
| Less than $10,000 | 71 | 2.6% |
| $10,000 to $14,999 | 74 | 2.7% |
| $15,000 to $24,999 | 273 | 10.0% |
| $25,000 to $34,999 | 166 | 6.1% |
| $35,000 to $49,999 | 371 | 13.6% |
| $50,000 to $74,999 | 497 | 18.2% |
| $75,000 to $99,999 | 355 | 13.0% |
| $100,000 to $149,999 | 407 | 14.9% |
| $150,000 to $199,999 | 278 | 10.2% |
| $200,000+ | 232 | 8.5% |
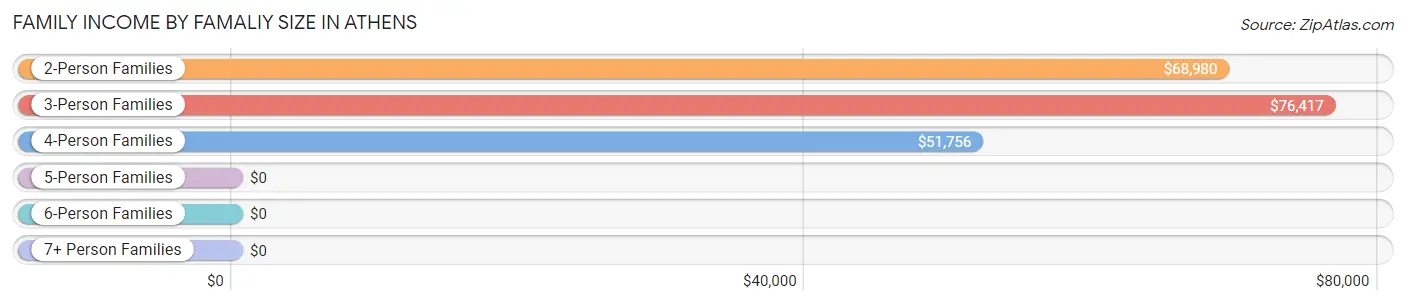
Family Income by Famaliy Size in Athens
3-person families (456 | 16.7%) account for the highest median family income in Athens with $76,417 per family, while 2-person families (1,354 | 49.6%) have the highest median income of $34,490 per family member.
| Income Bracket | # Families | Median Income |
| 2-Person Families | 1,354 (49.6%) | $68,980 |
| 3-Person Families | 456 (16.7%) | $76,417 |
| 4-Person Families | 521 (19.1%) | $51,756 |
| 5-Person Families | 233 (8.5%) | $0 |
| 6-Person Families | 73 (2.7%) | $0 |
| 7+ Person Families | 92 (3.4%) | $0 |
| Total | 2,729 (100.0%) | $68,951 |
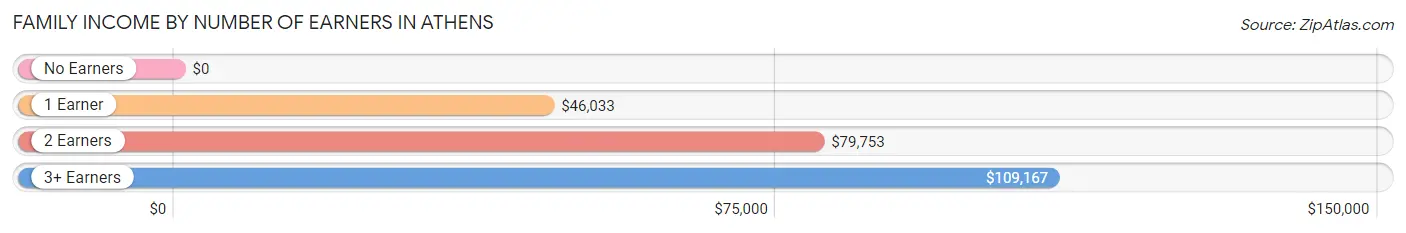
Family Income by Number of Earners in Athens
| Number of Earners | # Families | Median Income |
| No Earners | 317 (11.6%) | $0 |
| 1 Earner | 915 (33.5%) | $46,033 |
| 2 Earners | 1,243 (45.6%) | $79,753 |
| 3+ Earners | 254 (9.3%) | $109,167 |
| Total | 2,729 (100.0%) | $68,951 |
Household Income in Athens
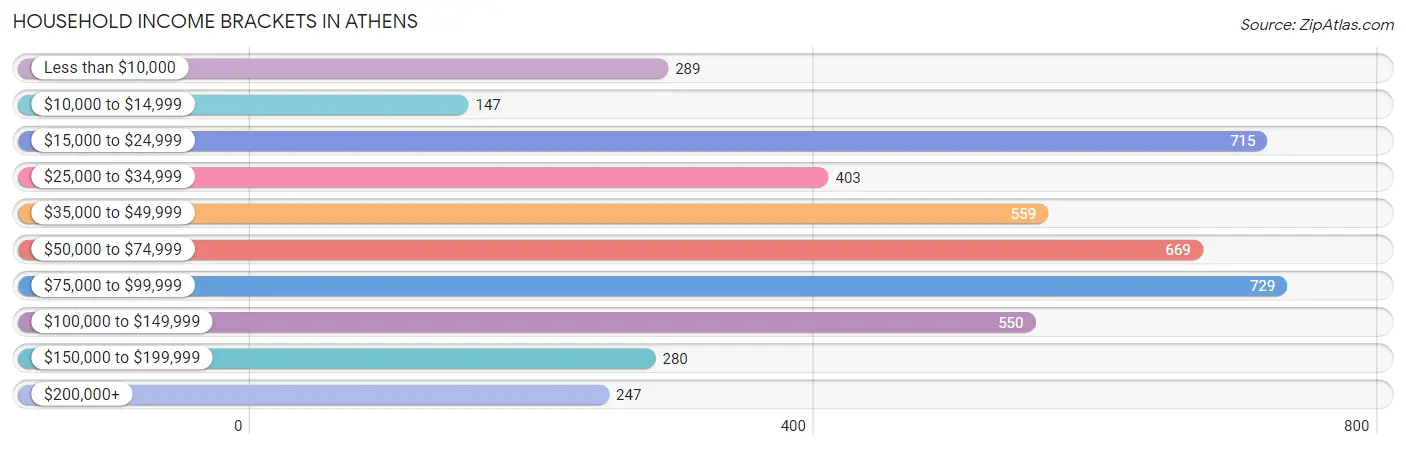
Household Income Brackets in Athens
With 729 households falling in the category, the $75,000 to $99,999 income range is the most frequent in Athens, accounting for 15.9% of all households. In contrast, only 147 households (3.2%) fall into the $10,000 to $14,999 income bracket, making it the least populous group.
| Income Bracket | # Households | % Households |
| Less than $10,000 | 289 | 6.3% |
| $10,000 to $14,999 | 147 | 3.2% |
| $15,000 to $24,999 | 715 | 15.6% |
| $25,000 to $34,999 | 403 | 8.8% |
| $35,000 to $49,999 | 559 | 12.2% |
| $50,000 to $74,999 | 669 | 14.6% |
| $75,000 to $99,999 | 729 | 15.9% |
| $100,000 to $149,999 | 550 | 12.0% |
| $150,000 to $199,999 | 280 | 6.1% |
| $200,000+ | 247 | 5.4% |
Household Income by Householder Age in Athens
The median household income in Athens is $54,828, with the highest median household income of $75,724 found in the 15 to 24 years age bracket for the primary householder. A total of 244 households (5.3%) fall into this category. Meanwhile, the 65+ years age bracket for the primary householder has the lowest median household income of $43,106, with 1,822 households (39.8%) in this group.
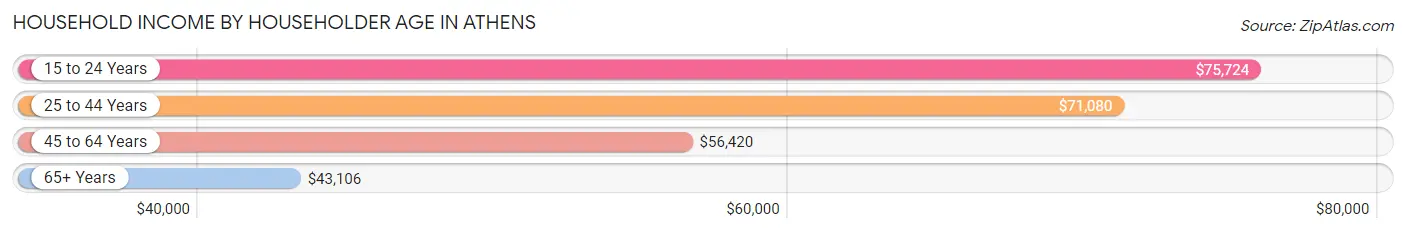
| Income Bracket | # Households | Median Income |
| 15 to 24 Years | 244 (5.3%) | $75,724 |
| 25 to 44 Years | 1,263 (27.6%) | $71,080 |
| 45 to 64 Years | 1,253 (27.4%) | $56,420 |
| 65+ Years | 1,822 (39.8%) | $43,106 |
| Total | 4,582 (100.0%) | $54,828 |
Poverty in Athens
Income Below Poverty by Sex and Age in Athens
With 18.9% poverty level for males and 15.2% for females among the residents of Athens, 5 year old males and under 5 year old females are the most vulnerable to poverty, with 44 males (55.7%) and 130 females (58.6%) in their respective age groups living below the poverty level.
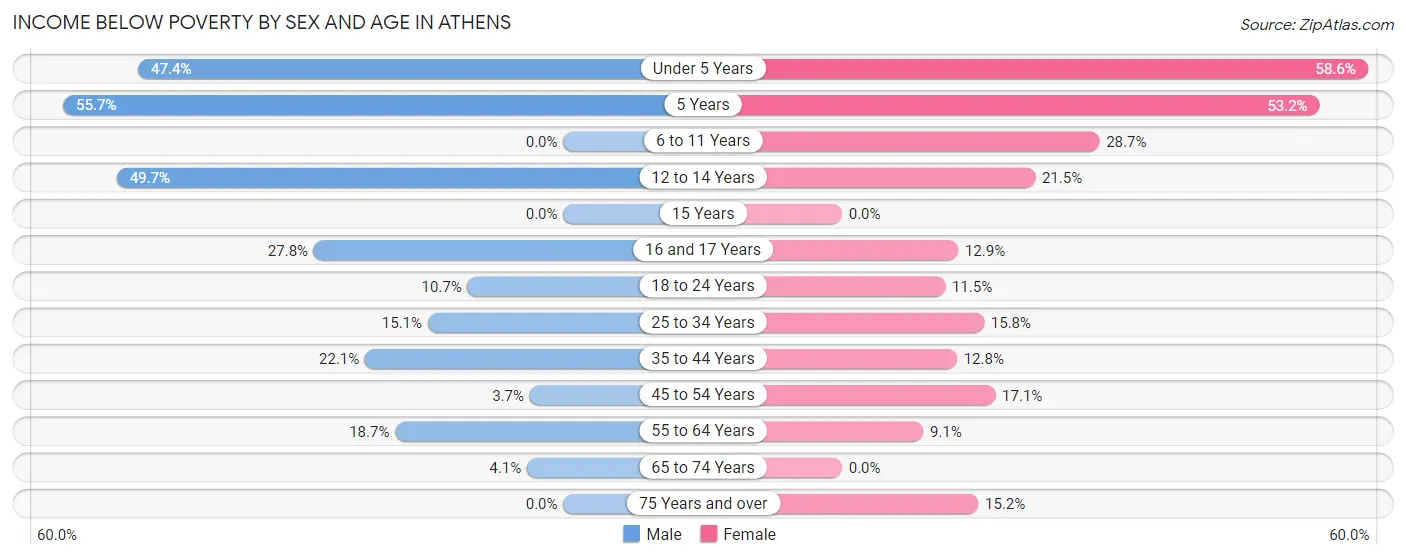
| Age Bracket | Male | Female |
| Under 5 Years | 295 (47.3%) | 130 (58.6%) |
| 5 Years | 44 (55.7%) | 25 (53.2%) |
| 6 to 11 Years | 0 (0.0%) | 123 (28.7%) |
| 12 to 14 Years | 188 (49.7%) | 65 (21.5%) |
| 15 Years | 0 (0.0%) | 0 (0.0%) |
| 16 and 17 Years | 45 (27.8%) | 22 (12.9%) |
| 18 to 24 Years | 55 (10.7%) | 95 (11.5%) |
| 25 to 34 Years | 91 (15.1%) | 125 (15.8%) |
| 35 to 44 Years | 157 (22.1%) | 79 (12.8%) |
| 45 to 54 Years | 15 (3.7%) | 116 (17.1%) |
| 55 to 64 Years | 105 (18.7%) | 60 (9.0%) |
| 65 to 74 Years | 27 (4.1%) | 0 (0.0%) |
| 75 Years and over | 0 (0.0%) | 131 (15.2%) |
| Total | 1,022 (18.9%) | 971 (15.2%) |
Income Above Poverty by Sex and Age in Athens
According to the poverty statistics in Athens, males aged 6 to 11 years and females aged 15 years are the age groups that are most secure financially, with 100.0% of males and 100.0% of females in these age groups living above the poverty line.
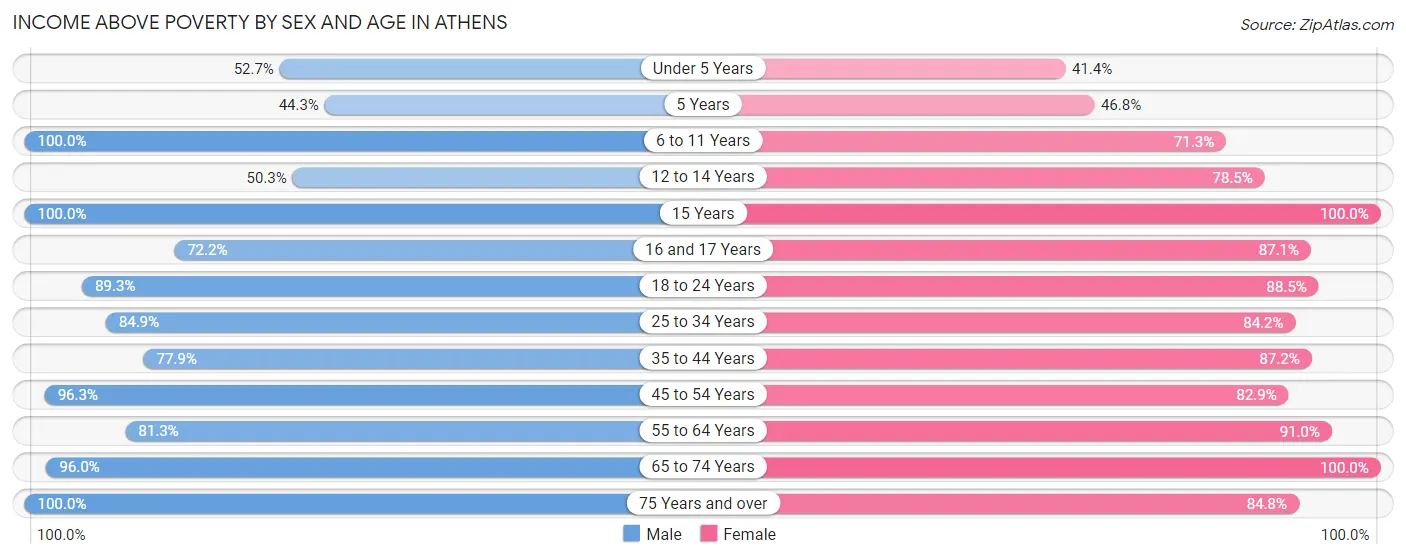
| Age Bracket | Male | Female |
| Under 5 Years | 328 (52.6%) | 92 (41.4%) |
| 5 Years | 35 (44.3%) | 22 (46.8%) |
| 6 to 11 Years | 336 (100.0%) | 306 (71.3%) |
| 12 to 14 Years | 190 (50.3%) | 237 (78.5%) |
| 15 Years | 25 (100.0%) | 58 (100.0%) |
| 16 and 17 Years | 117 (72.2%) | 148 (87.1%) |
| 18 to 24 Years | 461 (89.3%) | 732 (88.5%) |
| 25 to 34 Years | 512 (84.9%) | 665 (84.2%) |
| 35 to 44 Years | 554 (77.9%) | 538 (87.2%) |
| 45 to 54 Years | 386 (96.3%) | 563 (82.9%) |
| 55 to 64 Years | 456 (81.3%) | 603 (90.9%) |
| 65 to 74 Years | 640 (96.0%) | 724 (100.0%) |
| 75 Years and over | 334 (100.0%) | 732 (84.8%) |
| Total | 4,374 (81.1%) | 5,420 (84.8%) |
Income Below Poverty Among Married-Couple Families in Athens
The poverty statistics for married-couple families in Athens show that 9.4% or 187 of the total 1,986 families live below the poverty line. Families with 3 or 4 children have the highest poverty rate of 26.0%, comprising of 58 families. On the other hand, families with no children have the lowest poverty rate of 2.1%, which includes 25 families.
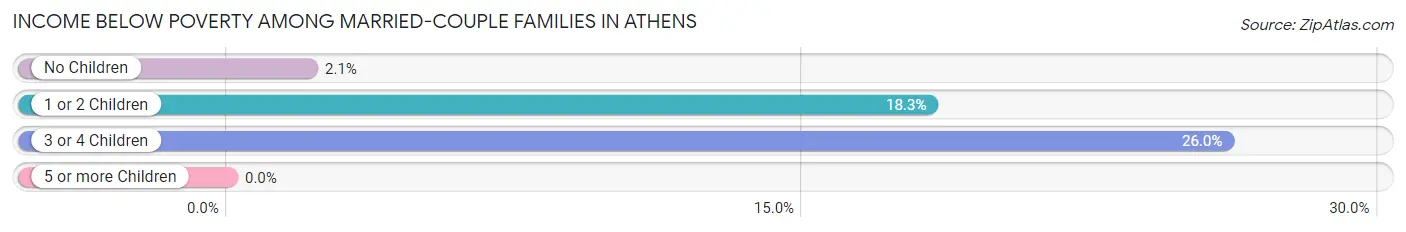
| Children | Above Poverty | Below Poverty |
| No Children | 1,169 (97.9%) | 25 (2.1%) |
| 1 or 2 Children | 465 (81.7%) | 104 (18.3%) |
| 3 or 4 Children | 165 (74.0%) | 58 (26.0%) |
| 5 or more Children | 0 (0.0%) | 0 (0.0%) |
| Total | 1,799 (90.6%) | 187 (9.4%) |
Income Below Poverty Among Single-Parent Households in Athens
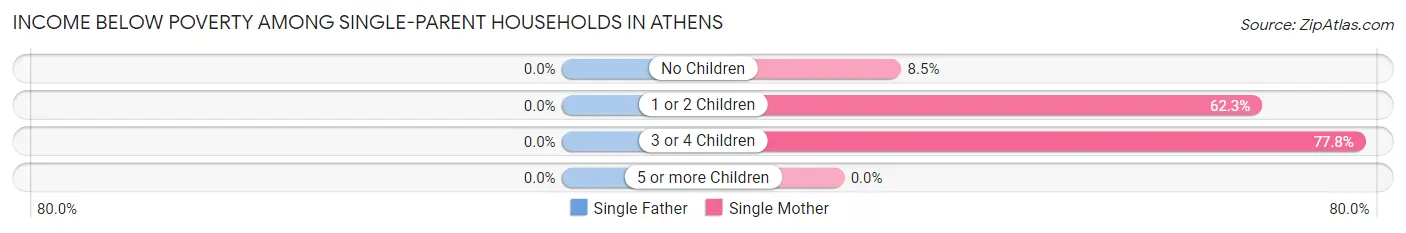
| Children | Single Father | Single Mother |
| No Children | 0 (0.0%) | 18 (8.5%) |
| 1 or 2 Children | 0 (0.0%) | 192 (62.3%) |
| 3 or 4 Children | 0 (0.0%) | 14 (77.8%) |
| 5 or more Children | 0 (0.0%) | 0 (0.0%) |
| Total | 0 (0.0%) | 224 (41.6%) |
Income Below Poverty Among Married-Couple vs Single-Parent Households in Athens
The poverty data for Athens shows that 187 of the married-couple family households (9.4%) and 224 of the single-parent households (30.1%) are living below the poverty level. Within the married-couple family households, those with 3 or 4 children have the highest poverty rate, with 58 households (26.0%) falling below the poverty line. Among the single-parent households, those with 3 or 4 children have the highest poverty rate, with 14 household (77.8%) living below poverty.
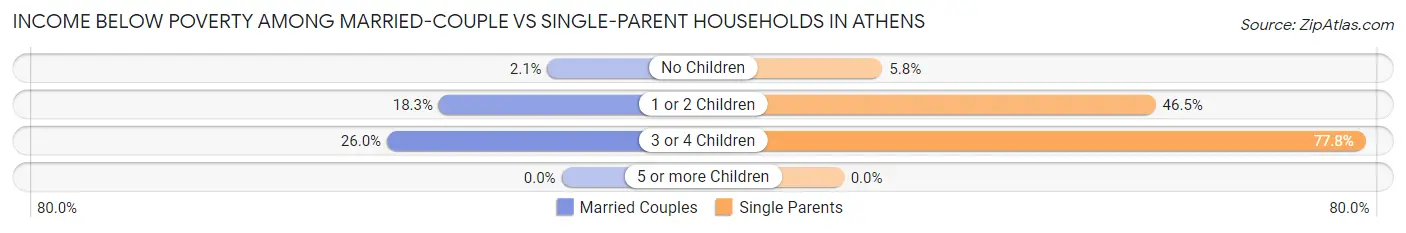
| Children | Married-Couple Families | Single-Parent Households |
| No Children | 25 (2.1%) | 18 (5.8%) |
| 1 or 2 Children | 104 (18.3%) | 192 (46.5%) |
| 3 or 4 Children | 58 (26.0%) | 14 (77.8%) |
| 5 or more Children | 0 (0.0%) | 0 (0.0%) |
| Total | 187 (9.4%) | 224 (30.1%) |
Race in Athens
The most populous races in Athens are White / Caucasian (7,698 | 59.8%), Hispanic or Latino (3,928 | 30.5%), and Two or more Races (2,220 | 17.2%).
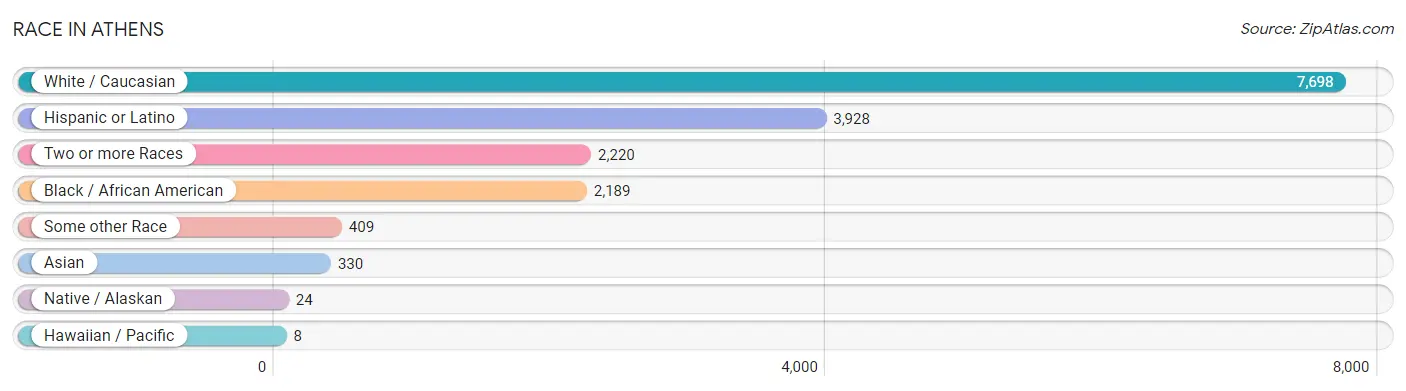
| Race | # Population | % Population |
| Asian | 330 | 2.6% |
| Black / African American | 2,189 | 17.0% |
| Hawaiian / Pacific | 8 | 0.1% |
| Hispanic or Latino | 3,928 | 30.5% |
| Native / Alaskan | 24 | 0.2% |
| White / Caucasian | 7,698 | 59.8% |
| Two or more Races | 2,220 | 17.2% |
| Some other Race | 409 | 3.2% |
| Total | 12,878 | 100.0% |
Ancestry in Athens
The most populous ancestries reported in Athens are Mexican (3,579 | 27.8%), English (1,560 | 12.1%), American (1,147 | 8.9%), Irish (1,073 | 8.3%), and German (927 | 7.2%), together accounting for 64.3% of all Athens residents.
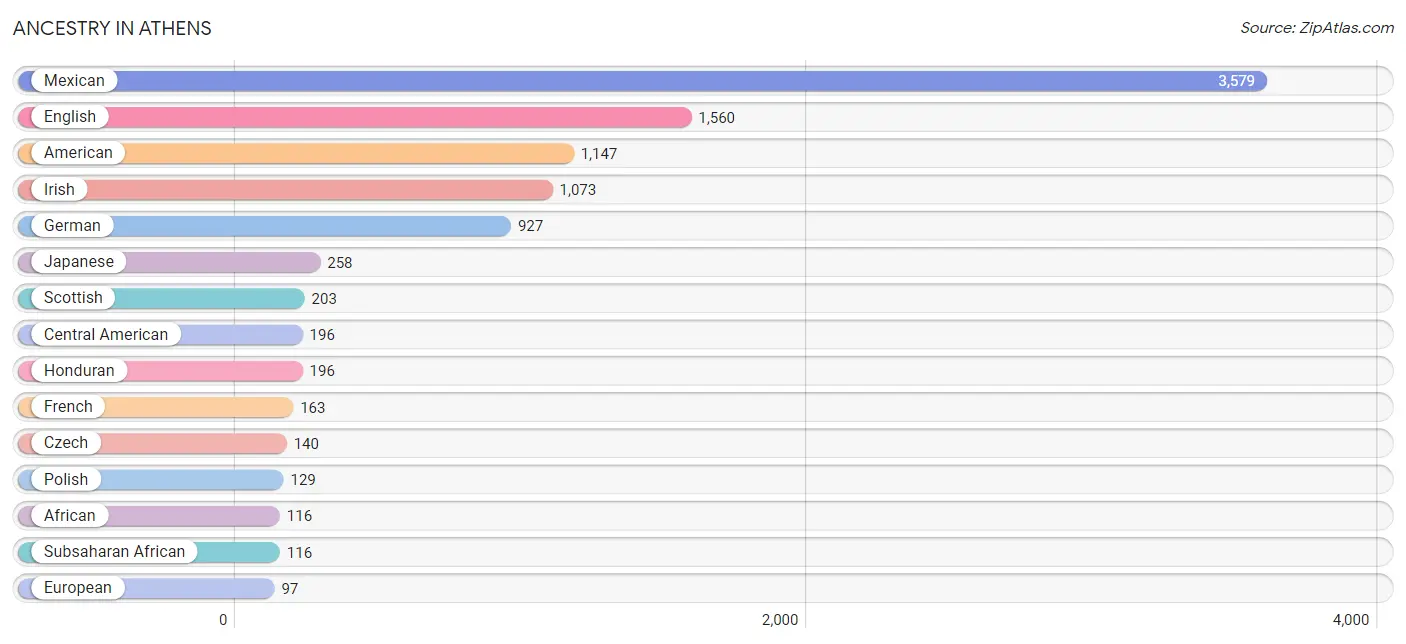
| Ancestry | # Population | % Population |
| African | 116 | 0.9% |
| American | 1,147 | 8.9% |
| Arab | 3 | 0.0% |
| Bermudan | 18 | 0.1% |
| Bhutanese | 1 | 0.0% |
| Bolivian | 8 | 0.1% |
| British | 16 | 0.1% |
| Burmese | 28 | 0.2% |
| Canadian | 7 | 0.1% |
| Central American | 196 | 1.5% |
| Colombian | 2 | 0.0% |
| Creek | 28 | 0.2% |
| Czech | 140 | 1.1% |
| Danish | 16 | 0.1% |
| Dominican | 1 | 0.0% |
| Dutch | 39 | 0.3% |
| Dutch West Indian | 7 | 0.1% |
| Egyptian | 3 | 0.0% |
| English | 1,560 | 12.1% |
| European | 97 | 0.7% |
| French | 163 | 1.3% |
| German | 927 | 7.2% |
| Honduran | 196 | 1.5% |
| Hungarian | 23 | 0.2% |
| Indian (Asian) | 29 | 0.2% |
| Irish | 1,073 | 8.3% |
| Italian | 82 | 0.6% |
| Jamaican | 16 | 0.1% |
| Japanese | 258 | 2.0% |
| Korean | 20 | 0.2% |
| Mexican | 3,579 | 27.8% |
| Native Hawaiian | 15 | 0.1% |
| Navajo | 16 | 0.1% |
| Norwegian | 29 | 0.2% |
| Polish | 129 | 1.0% |
| Puerto Rican | 29 | 0.2% |
| Russian | 13 | 0.1% |
| Scandinavian | 21 | 0.2% |
| Scotch-Irish | 62 | 0.5% |
| Scottish | 203 | 1.6% |
| South American | 10 | 0.1% |
| Spaniard | 3 | 0.0% |
| Subsaharan African | 116 | 0.9% |
| Thai | 43 | 0.3% |
| Welsh | 20 | 0.2% | View All 45 Rows |
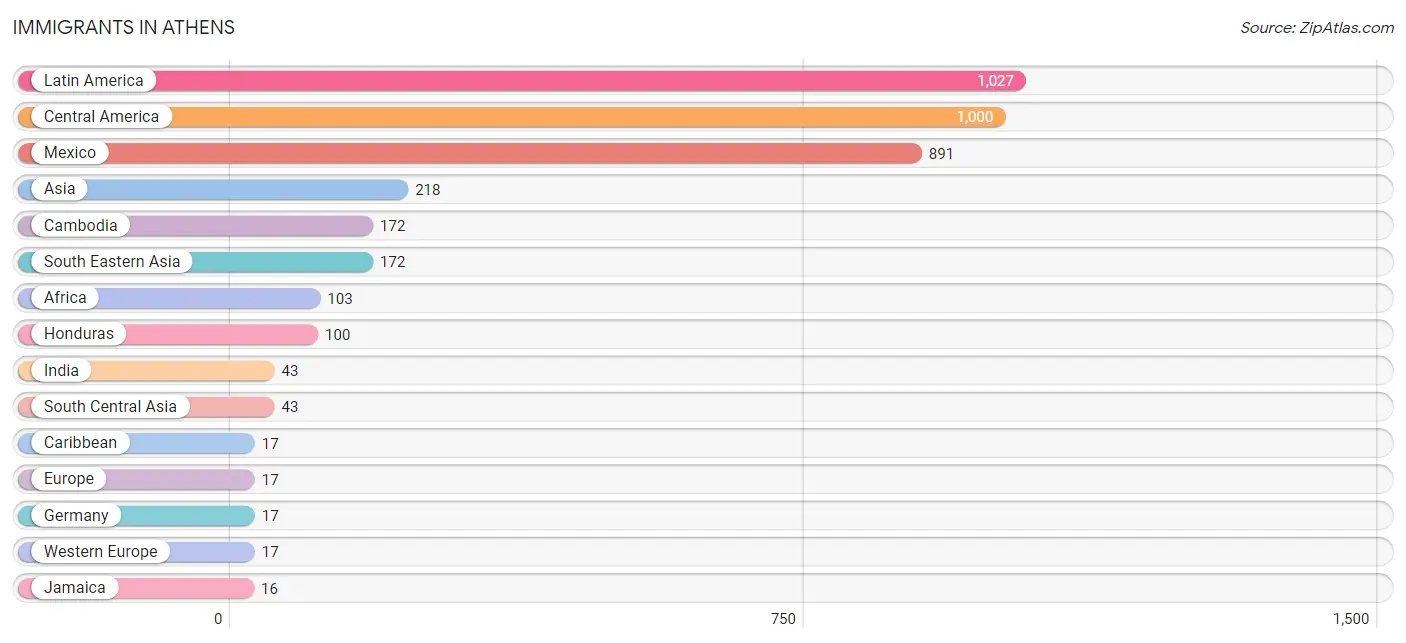
Immigrants in Athens
The most numerous immigrant groups reported in Athens came from Latin America (1,027 | 8.0%), Central America (1,000 | 7.8%), Mexico (891 | 6.9%), Asia (218 | 1.7%), and Cambodia (172 | 1.3%), together accounting for 25.7% of all Athens residents.
| Immigration Origin | # Population | % Population |
| Africa | 103 | 0.8% |
| Asia | 218 | 1.7% |
| Bolivia | 8 | 0.1% |
| Cambodia | 172 | 1.3% |
| Canada | 10 | 0.1% |
| Caribbean | 17 | 0.1% |
| Central America | 1,000 | 7.8% |
| China | 2 | 0.0% |
| Colombia | 2 | 0.0% |
| Dominican Republic | 1 | 0.0% |
| Eastern Asia | 3 | 0.0% |
| Egypt | 3 | 0.0% |
| Europe | 17 | 0.1% |
| Germany | 17 | 0.1% |
| Guatemala | 9 | 0.1% |
| Honduras | 100 | 0.8% |
| India | 43 | 0.3% |
| Jamaica | 16 | 0.1% |
| Japan | 1 | 0.0% |
| Latin America | 1,027 | 8.0% |
| Mexico | 891 | 6.9% |
| Northern Africa | 3 | 0.0% |
| South America | 10 | 0.1% |
| South Central Asia | 43 | 0.3% |
| South Eastern Asia | 172 | 1.3% |
| Western Europe | 17 | 0.1% | View All 26 Rows |
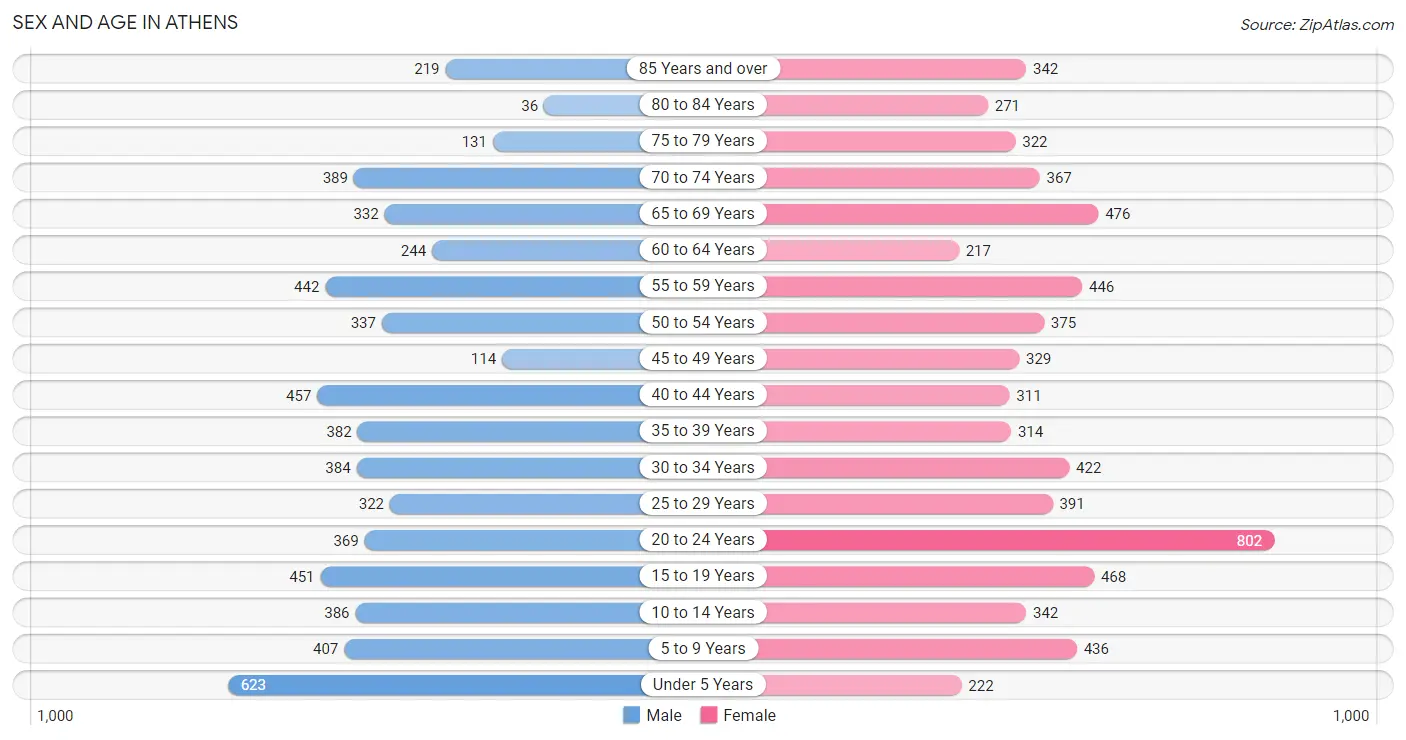
Sex and Age in Athens
Sex and Age in Athens
The most populous age groups in Athens are Under 5 Years (623 | 10.3%) for men and 20 to 24 Years (802 | 11.7%) for women.
| Age Bracket | Male | Female |
| Under 5 Years | 623 (10.3%) | 222 (3.2%) |
| 5 to 9 Years | 407 (6.8%) | 436 (6.4%) |
| 10 to 14 Years | 386 (6.4%) | 342 (5.0%) |
| 15 to 19 Years | 451 (7.5%) | 468 (6.8%) |
| 20 to 24 Years | 369 (6.1%) | 802 (11.7%) |
| 25 to 29 Years | 322 (5.3%) | 391 (5.7%) |
| 30 to 34 Years | 384 (6.4%) | 422 (6.2%) |
| 35 to 39 Years | 382 (6.3%) | 314 (4.6%) |
| 40 to 44 Years | 457 (7.6%) | 311 (4.5%) |
| 45 to 49 Years | 114 (1.9%) | 329 (4.8%) |
| 50 to 54 Years | 337 (5.6%) | 375 (5.5%) |
| 55 to 59 Years | 442 (7.3%) | 446 (6.5%) |
| 60 to 64 Years | 244 (4.1%) | 217 (3.2%) |
| 65 to 69 Years | 332 (5.5%) | 476 (7.0%) |
| 70 to 74 Years | 389 (6.5%) | 367 (5.4%) |
| 75 to 79 Years | 131 (2.2%) | 322 (4.7%) |
| 80 to 84 Years | 36 (0.6%) | 271 (4.0%) |
| 85 Years and over | 219 (3.6%) | 342 (5.0%) |
| Total | 6,025 (100.0%) | 6,853 (100.0%) |
Families and Households in Athens
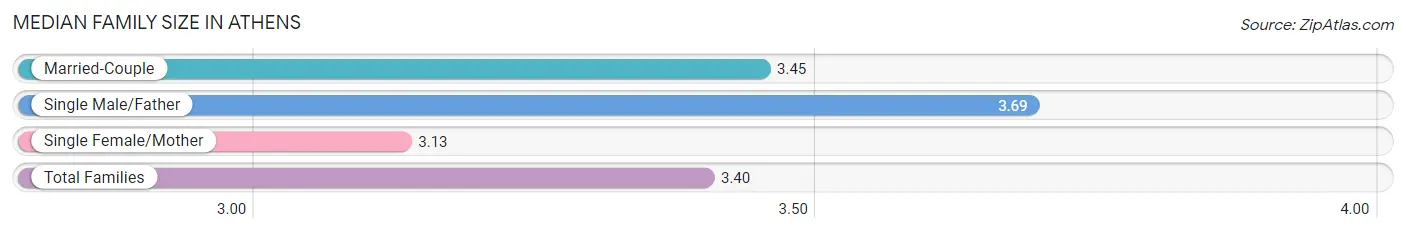
Median Family Size in Athens
The median family size in Athens is 3.40 persons per family, with single male/father families (205 | 7.5%) accounting for the largest median family size of 3.69 persons per family. On the other hand, single female/mother families (538 | 19.7%) represent the smallest median family size with 3.13 persons per family.
| Family Type | # Families | Family Size |
| Married-Couple | 1,986 (72.8%) | 3.45 |
| Single Male/Father | 205 (7.5%) | 3.69 |
| Single Female/Mother | 538 (19.7%) | 3.13 |
| Total Families | 2,729 (100.0%) | 3.40 |
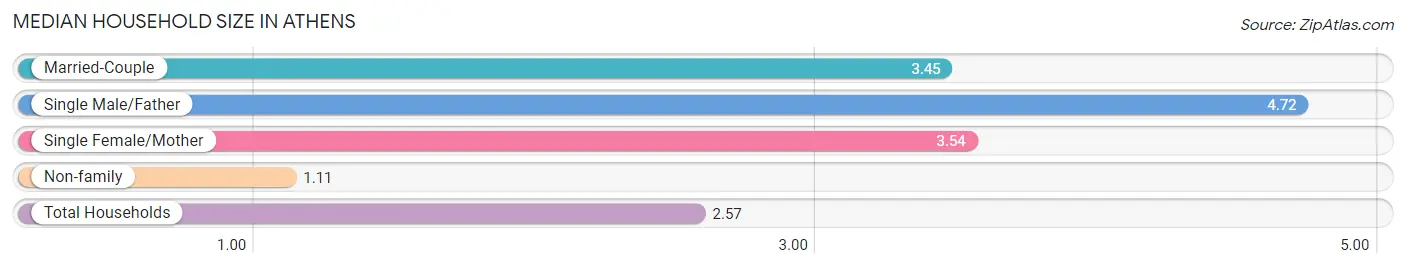
Median Household Size in Athens
The median household size in Athens is 2.57 persons per household, with single male/father households (205 | 4.5%) accounting for the largest median household size of 4.72 persons per household. non-family households (1,853 | 40.4%) represent the smallest median household size with 1.11 persons per household.
| Household Type | # Households | Household Size |
| Married-Couple | 1,986 (43.3%) | 3.45 |
| Single Male/Father | 205 (4.5%) | 4.72 |
| Single Female/Mother | 538 (11.7%) | 3.54 |
| Non-family | 1,853 (40.4%) | 1.11 |
| Total Households | 4,582 (100.0%) | 2.57 |
Household Size by Marriage Status in Athens
Out of a total of 4,582 households in Athens, 2,729 (59.6%) are family households, while 1,853 (40.4%) are nonfamily households. The most numerous type of family households are 2-person households, comprising 1,181, and the most common type of nonfamily households are 1-person households, comprising 1,745.
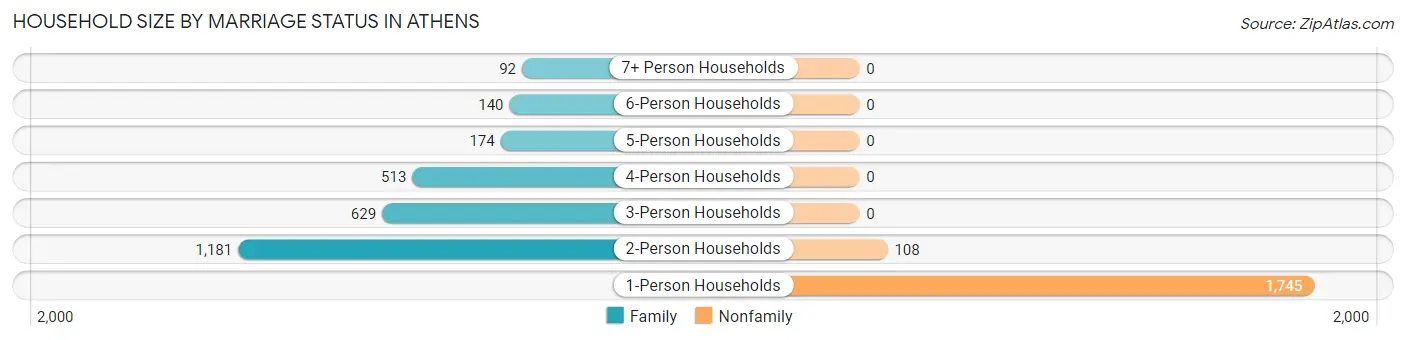
| Household Size | Family Households | Nonfamily Households |
| 1-Person Households | - | 1,745 (38.1%) |
| 2-Person Households | 1,181 (25.8%) | 108 (2.4%) |
| 3-Person Households | 629 (13.7%) | 0 (0.0%) |
| 4-Person Households | 513 (11.2%) | 0 (0.0%) |
| 5-Person Households | 174 (3.8%) | 0 (0.0%) |
| 6-Person Households | 140 (3.1%) | 0 (0.0%) |
| 7+ Person Households | 92 (2.0%) | 0 (0.0%) |
| Total | 2,729 (59.6%) | 1,853 (40.4%) |
Female Fertility in Athens
Fertility by Age in Athens
Average fertility rate in Athens is 66.0 births per 1,000 women. Women in the age bracket of 35 to 50 years have the highest fertility rate with 87.0 births per 1,000 women. Women in the age bracket of 20 to 34 years acount for 56.4% of all women with births.
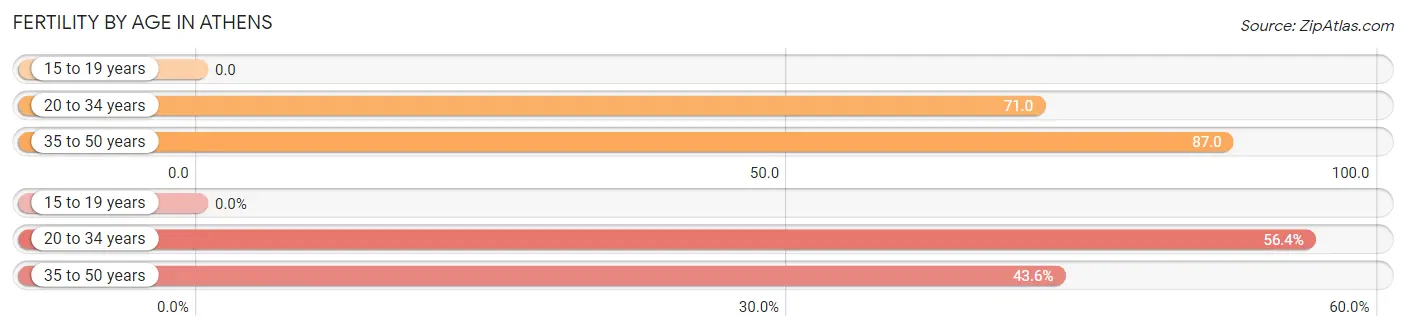
| Age Bracket | Women with Births | Births / 1,000 Women |
| 15 to 19 years | 0 (0.0%) | 0.0 |
| 20 to 34 years | 115 (56.4%) | 71.0 |
| 35 to 50 years | 89 (43.6%) | 87.0 |
| Total | 204 (100.0%) | 66.0 |
Fertility by Age by Marriage Status in Athens
62.7% of women with births (204) in Athens are married. The highest percentage of unmarried women with births falls into 20 to 34 years age bracket with 43.5% of them unmarried at the time of birth, while the lowest percentage of unmarried women with births belong to 35 to 50 years age bracket with 29.2% of them unmarried.
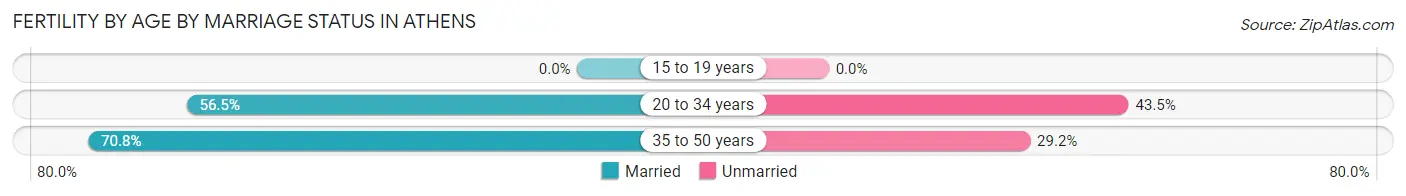
| Age Bracket | Married | Unmarried |
| 15 to 19 years | 0 (0.0%) | 0 (0.0%) |
| 20 to 34 years | 65 (56.5%) | 50 (43.5%) |
| 35 to 50 years | 63 (70.8%) | 26 (29.2%) |
| Total | 128 (62.7%) | 76 (37.2%) |
Fertility by Education in Athens
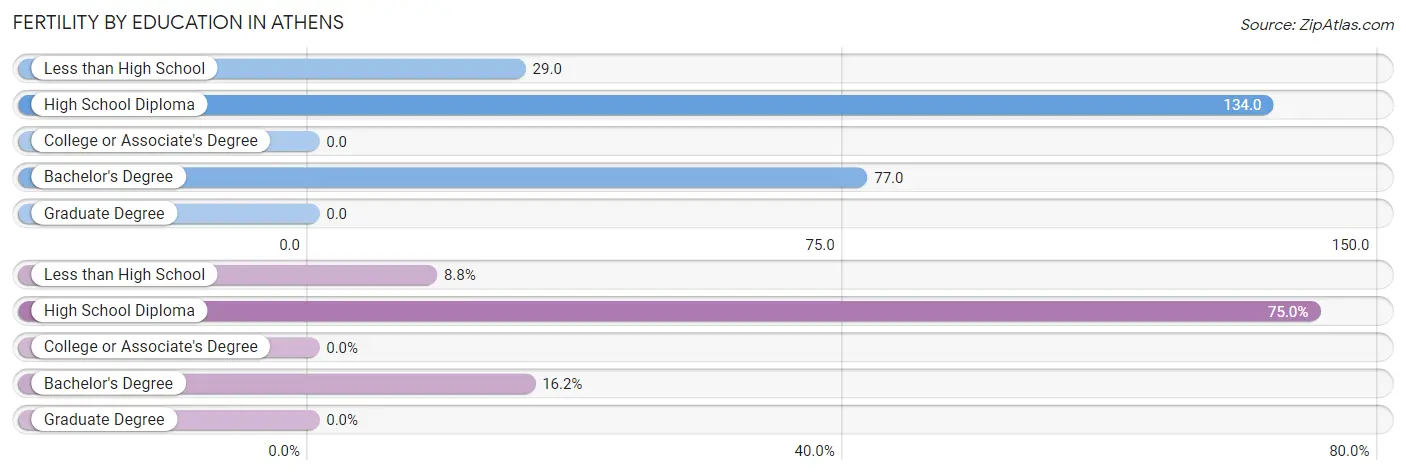
| Educational Attainment | Women with Births | Births / 1,000 Women |
| Less than High School | 18 (8.8%) | 29.0 |
| High School Diploma | 153 (75.0%) | 134.0 |
| College or Associate's Degree | 0 (0.0%) | 0.0 |
| Bachelor's Degree | 33 (16.2%) | 77.0 |
| Graduate Degree | 0 (0.0%) | 0.0 |
| Total | 204 (100.0%) | 66.0 |
Fertility by Education by Marriage Status in Athens
37.2% of women with births in Athens are unmarried. Women with the educational attainment of less than high school are most likely to be married with 100.0% of them married at childbirth, while women with the educational attainment of high school diploma are least likely to be married with 49.7% of them unmarried at childbirth.
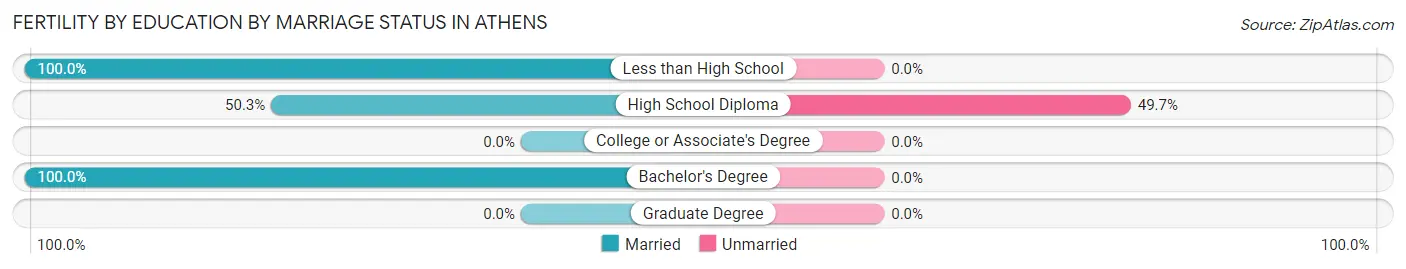
| Educational Attainment | Married | Unmarried |
| Less than High School | 18 (100.0%) | 0 (0.0%) |
| High School Diploma | 77 (50.3%) | 76 (49.7%) |
| College or Associate's Degree | 0 (0.0%) | 0 (0.0%) |
| Bachelor's Degree | 33 (100.0%) | 0 (0.0%) |
| Graduate Degree | 0 (0.0%) | 0 (0.0%) |
| Total | 128 (62.7%) | 76 (37.2%) |
Employment Characteristics in Athens
Employment by Class of Employer in Athens
Among the 5,678 employed individuals in Athens, private company employees (3,973 | 70.0%), self-employed (not incorporated) (602 | 10.6%), and local government employees (377 | 6.6%) make up the most common classes of employment.
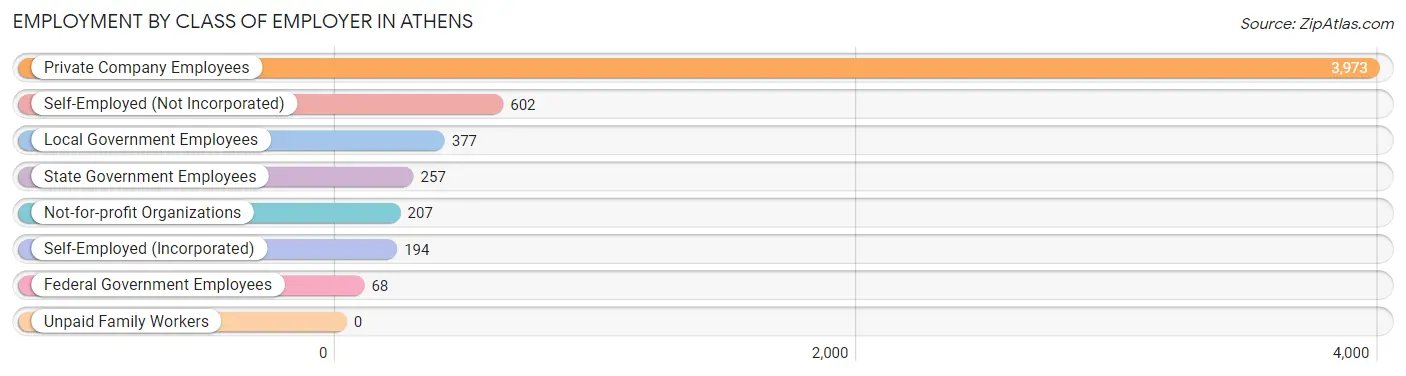
| Employer Class | # Employees | % Employees |
| Private Company Employees | 3,973 | 70.0% |
| Self-Employed (Incorporated) | 194 | 3.4% |
| Self-Employed (Not Incorporated) | 602 | 10.6% |
| Not-for-profit Organizations | 207 | 3.6% |
| Local Government Employees | 377 | 6.6% |
| State Government Employees | 257 | 4.5% |
| Federal Government Employees | 68 | 1.2% |
| Unpaid Family Workers | 0 | 0.0% |
| Total | 5,678 | 100.0% |
Employment Status by Age in Athens
According to the labor force statistics for Athens, out of the total population over 16 years of age (10,379), 57.1% or 5,926 individuals are in the labor force, with 2.4% or 142 of them unemployed. The age group with the highest labor force participation rate is 25 to 29 years, with 93.8% or 669 individuals in the labor force. Within the labor force, the 45 to 54 years age range has the highest percentage of unemployed individuals, with 5.1% or 36 of them being unemployed.
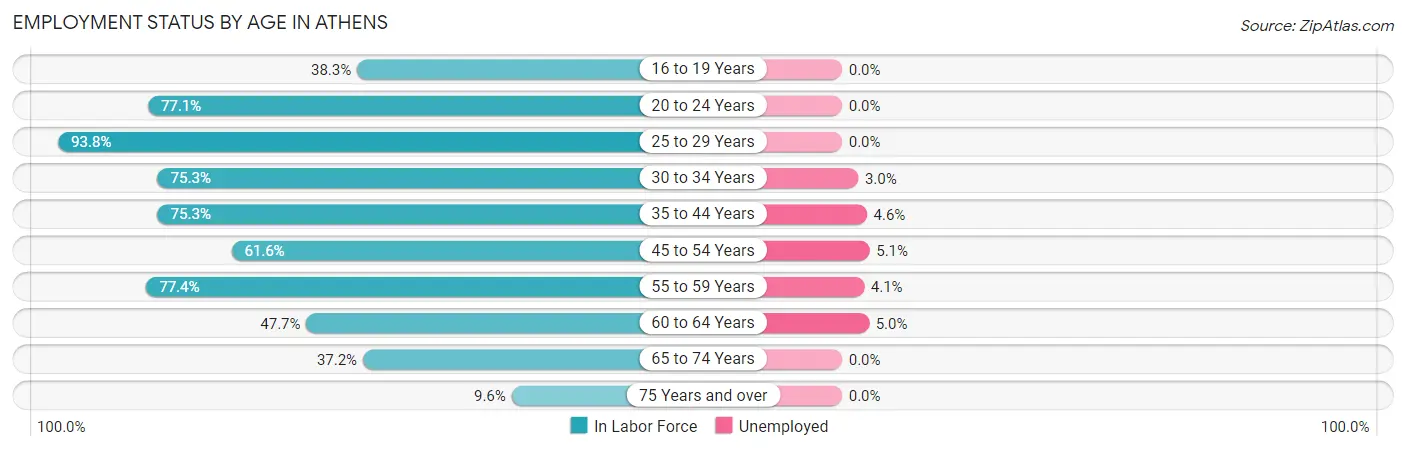
| Age Bracket | In Labor Force | Unemployed |
| 16 to 19 Years | 320 (38.3%) | 0 (0.0%) |
| 20 to 24 Years | 903 (77.1%) | 0 (0.0%) |
| 25 to 29 Years | 669 (93.8%) | 0 (0.0%) |
| 30 to 34 Years | 607 (75.3%) | 18 (3.0%) |
| 35 to 44 Years | 1,102 (75.3%) | 51 (4.6%) |
| 45 to 54 Years | 711 (61.6%) | 36 (5.1%) |
| 55 to 59 Years | 687 (77.4%) | 28 (4.1%) |
| 60 to 64 Years | 220 (47.7%) | 11 (5.0%) |
| 65 to 74 Years | 582 (37.2%) | 0 (0.0%) |
| 75 Years and over | 127 (9.6%) | 0 (0.0%) |
| Total | 5,926 (57.1%) | 142 (2.4%) |
Employment Status by Educational Attainment in Athens
According to labor force statistics for Athens, 72.9% of individuals (4,000) out of the total population between 25 and 64 years of age (5,487) are in the labor force, with 3.6% or 144 of them being unemployed. The group with the highest labor force participation rate are those with the educational attainment of bachelor's degree or higher, with 92.1% or 761 individuals in the labor force. Within the labor force, individuals with less than high school education have the highest percentage of unemployment, with 7.3% or 54 of them being unemployed.
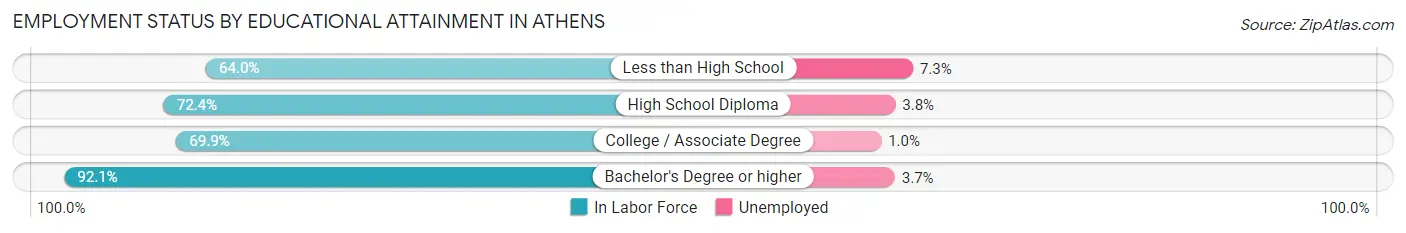
| Educational Attainment | In Labor Force | Unemployed |
| Less than High School | 739 (64.0%) | 84 (7.3%) |
| High School Diploma | 1,357 (72.4%) | 71 (3.8%) |
| College / Associate Degree | 1,141 (69.9%) | 16 (1.0%) |
| Bachelor's Degree or higher | 761 (92.1%) | 31 (3.7%) |
| Total | 4,000 (72.9%) | 198 (3.6%) |
Employment Occupations by Sex in Athens
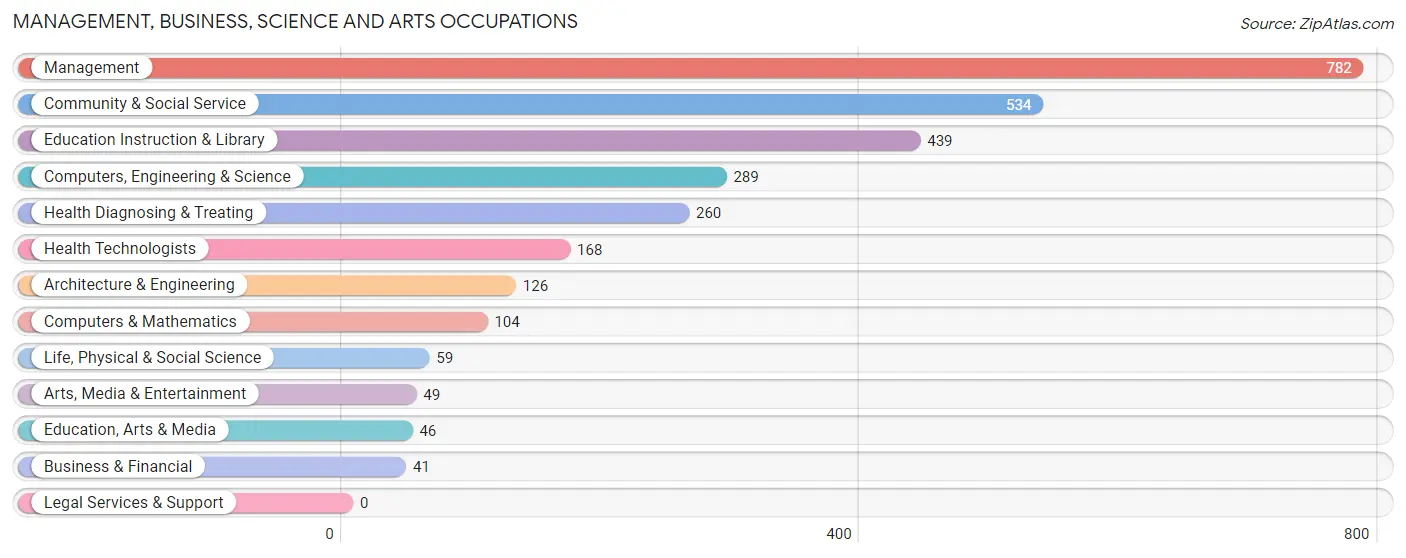
Management, Business, Science and Arts Occupations
The most common Management, Business, Science and Arts occupations in Athens are Management (782 | 13.5%), Community & Social Service (534 | 9.2%), Education Instruction & Library (439 | 7.6%), Computers, Engineering & Science (289 | 5.0%), and Health Diagnosing & Treating (260 | 4.5%).
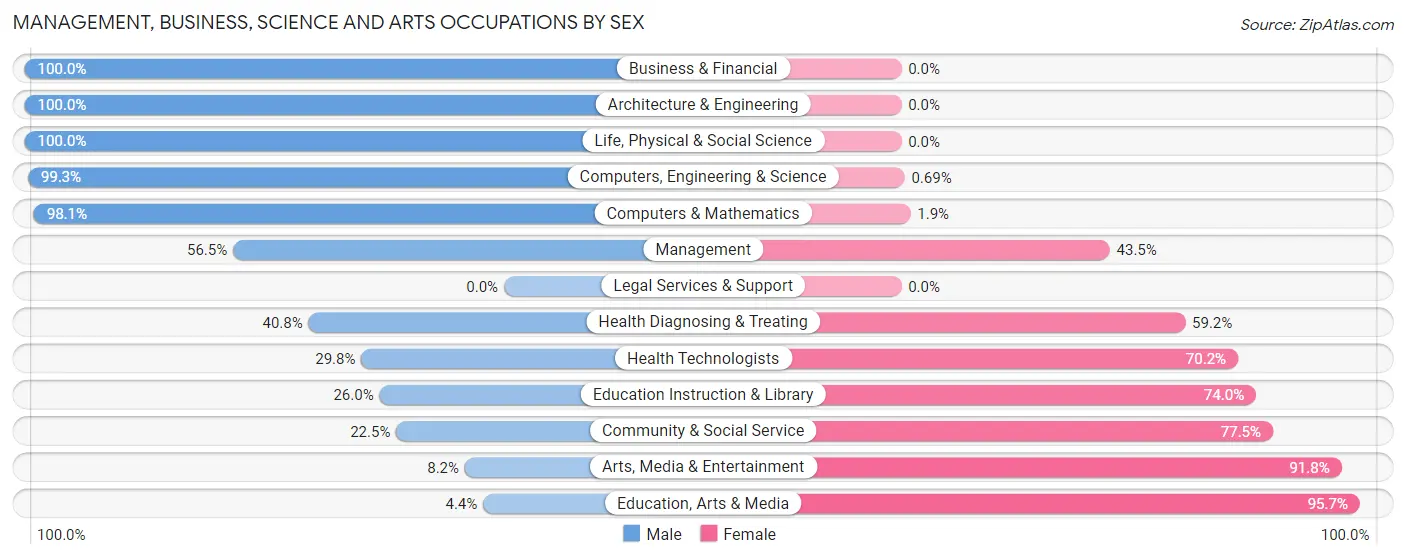
Management, Business, Science and Arts Occupations by Sex
Within the Management, Business, Science and Arts occupations in Athens, the most male-oriented occupations are Business & Financial (100.0%), Architecture & Engineering (100.0%), and Life, Physical & Social Science (100.0%), while the most female-oriented occupations are Education, Arts & Media (95.7%), Arts, Media & Entertainment (91.8%), and Community & Social Service (77.5%).
| Occupation | Male | Female |
| Management | 442 (56.5%) | 340 (43.5%) |
| Business & Financial | 41 (100.0%) | 0 (0.0%) |
| Computers, Engineering & Science | 287 (99.3%) | 2 (0.7%) |
| Computers & Mathematics | 102 (98.1%) | 2 (1.9%) |
| Architecture & Engineering | 126 (100.0%) | 0 (0.0%) |
| Life, Physical & Social Science | 59 (100.0%) | 0 (0.0%) |
| Community & Social Service | 120 (22.5%) | 414 (77.5%) |
| Education, Arts & Media | 2 (4.3%) | 44 (95.7%) |
| Legal Services & Support | 0 (0.0%) | 0 (0.0%) |
| Education Instruction & Library | 114 (26.0%) | 325 (74.0%) |
| Arts, Media & Entertainment | 4 (8.2%) | 45 (91.8%) |
| Health Diagnosing & Treating | 106 (40.8%) | 154 (59.2%) |
| Health Technologists | 50 (29.8%) | 118 (70.2%) |
| Total (Category) | 996 (52.3%) | 910 (47.7%) |
| Total (Overall) | 2,726 (47.1%) | 3,060 (52.9%) |
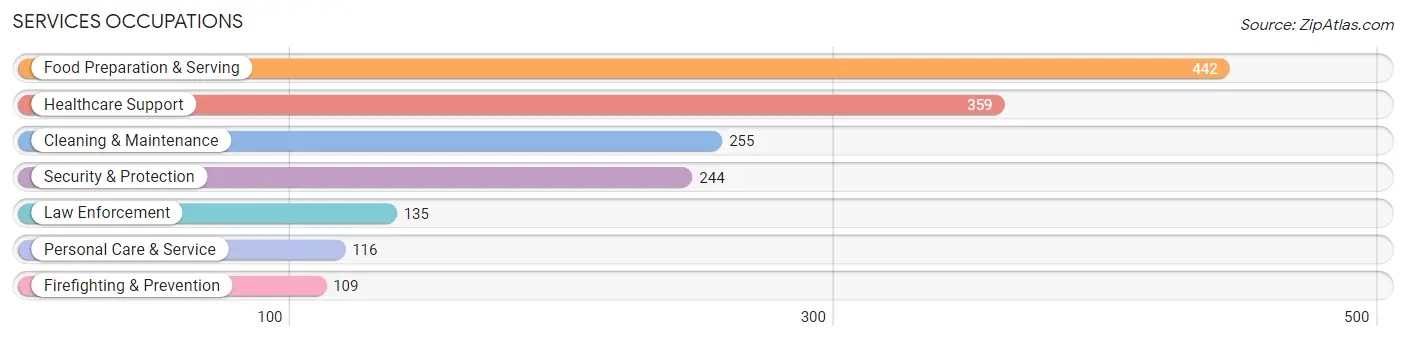
Services Occupations
The most common Services occupations in Athens are Food Preparation & Serving (442 | 7.6%), Healthcare Support (359 | 6.2%), Cleaning & Maintenance (255 | 4.4%), Security & Protection (244 | 4.2%), and Law Enforcement (135 | 2.3%).
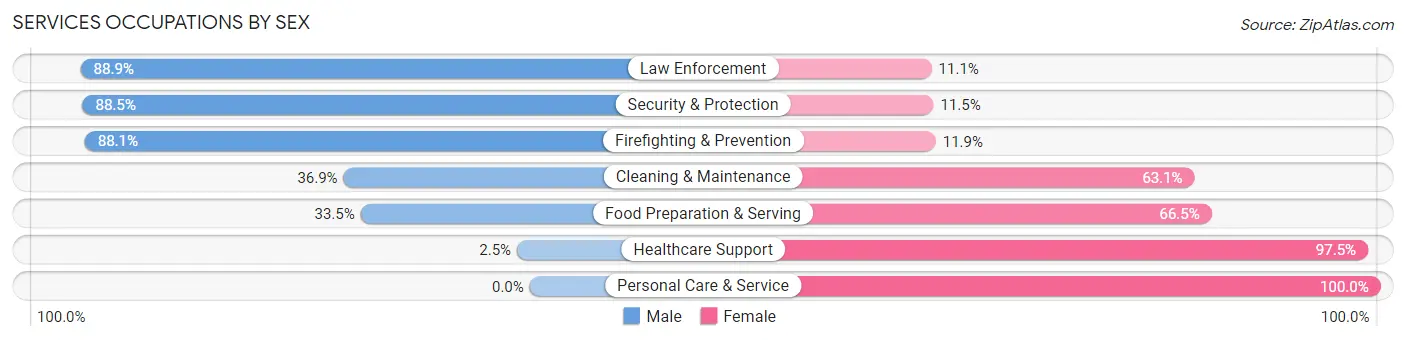
Services Occupations by Sex
Within the Services occupations in Athens, the most male-oriented occupations are Law Enforcement (88.9%), Security & Protection (88.5%), and Firefighting & Prevention (88.1%), while the most female-oriented occupations are Personal Care & Service (100.0%), Healthcare Support (97.5%), and Food Preparation & Serving (66.5%).
| Occupation | Male | Female |
| Healthcare Support | 9 (2.5%) | 350 (97.5%) |
| Security & Protection | 216 (88.5%) | 28 (11.5%) |
| Firefighting & Prevention | 96 (88.1%) | 13 (11.9%) |
| Law Enforcement | 120 (88.9%) | 15 (11.1%) |
| Food Preparation & Serving | 148 (33.5%) | 294 (66.5%) |
| Cleaning & Maintenance | 94 (36.9%) | 161 (63.1%) |
| Personal Care & Service | 0 (0.0%) | 116 (100.0%) |
| Total (Category) | 467 (33.0%) | 949 (67.0%) |
| Total (Overall) | 2,726 (47.1%) | 3,060 (52.9%) |
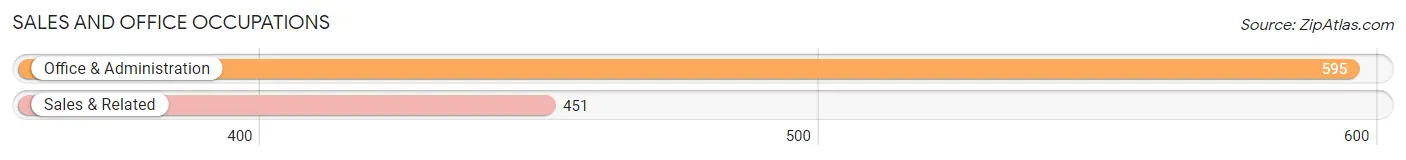
Sales and Office Occupations
The most common Sales and Office occupations in Athens are Office & Administration (595 | 10.3%), and Sales & Related (451 | 7.8%).
Sales and Office Occupations by Sex
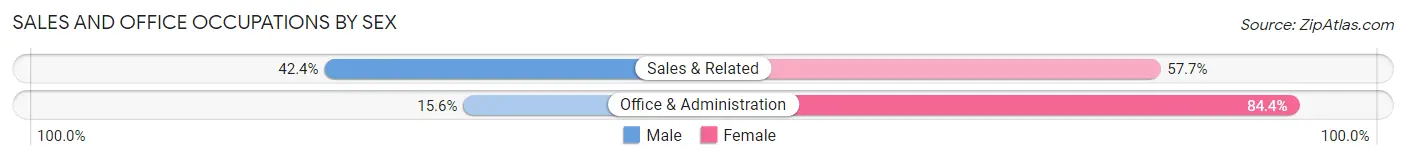
| Occupation | Male | Female |
| Sales & Related | 191 (42.3%) | 260 (57.7%) |
| Office & Administration | 93 (15.6%) | 502 (84.4%) |
| Total (Category) | 284 (27.2%) | 762 (72.9%) |
| Total (Overall) | 2,726 (47.1%) | 3,060 (52.9%) |
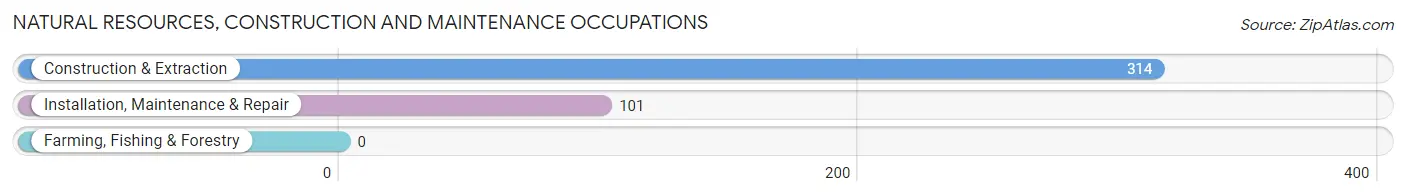
Natural Resources, Construction and Maintenance Occupations
The most common Natural Resources, Construction and Maintenance occupations in Athens are Construction & Extraction (314 | 5.4%), and Installation, Maintenance & Repair (101 | 1.8%).
Natural Resources, Construction and Maintenance Occupations by Sex
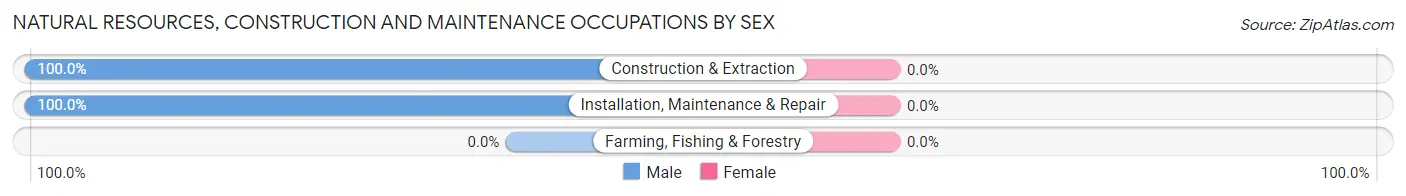
| Occupation | Male | Female |
| Farming, Fishing & Forestry | 0 (0.0%) | 0 (0.0%) |
| Construction & Extraction | 314 (100.0%) | 0 (0.0%) |
| Installation, Maintenance & Repair | 101 (100.0%) | 0 (0.0%) |
| Total (Category) | 415 (100.0%) | 0 (0.0%) |
| Total (Overall) | 2,726 (47.1%) | 3,060 (52.9%) |
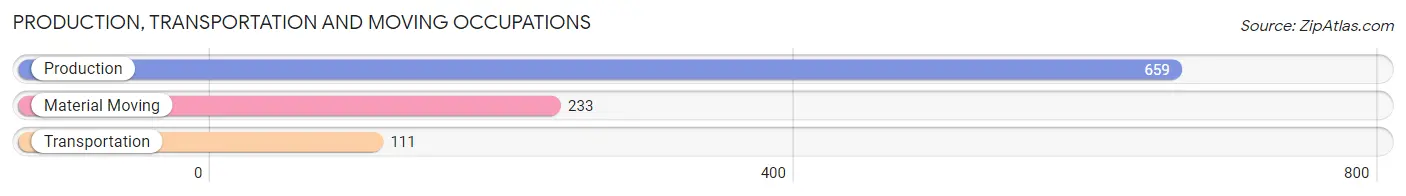
Production, Transportation and Moving Occupations
The most common Production, Transportation and Moving occupations in Athens are Production (659 | 11.4%), Material Moving (233 | 4.0%), and Transportation (111 | 1.9%).
Production, Transportation and Moving Occupations by Sex
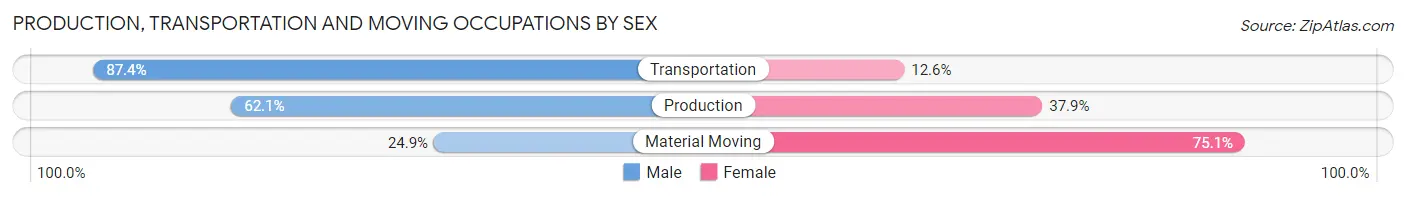
| Occupation | Male | Female |
| Production | 409 (62.1%) | 250 (37.9%) |
| Transportation | 97 (87.4%) | 14 (12.6%) |
| Material Moving | 58 (24.9%) | 175 (75.1%) |
| Total (Category) | 564 (56.2%) | 439 (43.8%) |
| Total (Overall) | 2,726 (47.1%) | 3,060 (52.9%) |
Employment Industries by Sex in Athens
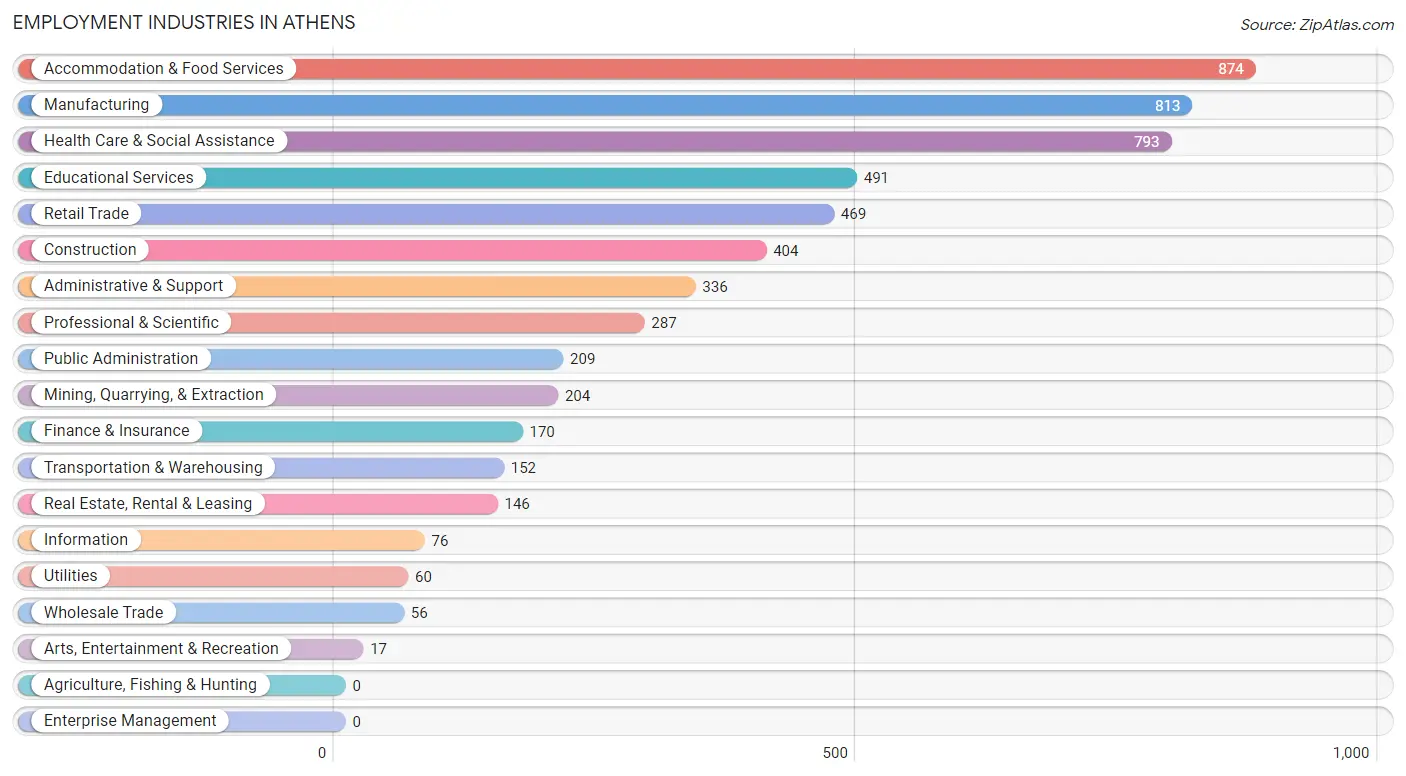
Employment Industries in Athens
The major employment industries in Athens include Accommodation & Food Services (874 | 15.1%), Manufacturing (813 | 14.1%), Health Care & Social Assistance (793 | 13.7%), Educational Services (491 | 8.5%), and Retail Trade (469 | 8.1%).
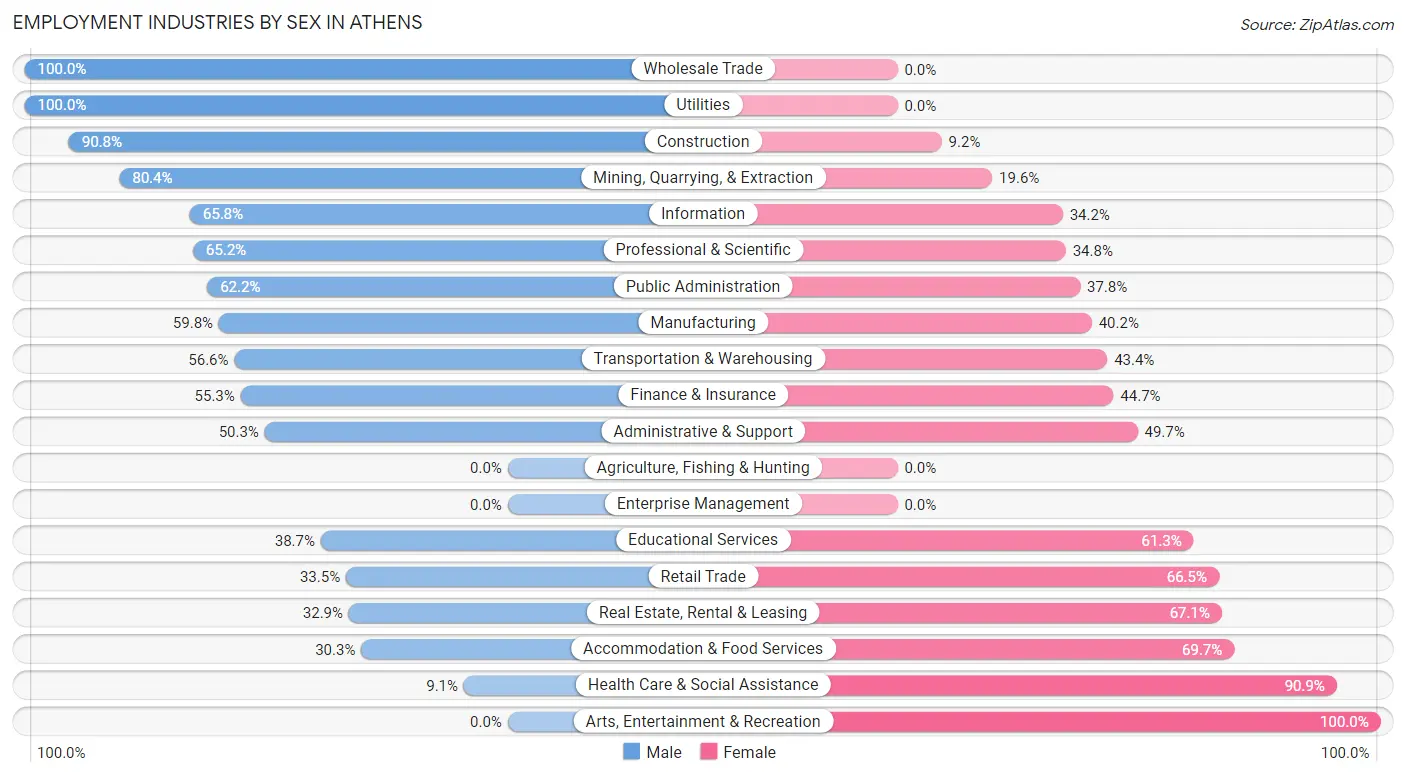
Employment Industries by Sex in Athens
The Athens industries that see more men than women are Wholesale Trade (100.0%), Utilities (100.0%), and Construction (90.8%), whereas the industries that tend to have a higher number of women are Arts, Entertainment & Recreation (100.0%), Health Care & Social Assistance (90.9%), and Accommodation & Food Services (69.7%).
| Industry | Male | Female |
| Agriculture, Fishing & Hunting | 0 (0.0%) | 0 (0.0%) |
| Mining, Quarrying, & Extraction | 164 (80.4%) | 40 (19.6%) |
| Construction | 367 (90.8%) | 37 (9.2%) |
| Manufacturing | 486 (59.8%) | 327 (40.2%) |
| Wholesale Trade | 56 (100.0%) | 0 (0.0%) |
| Retail Trade | 157 (33.5%) | 312 (66.5%) |
| Transportation & Warehousing | 86 (56.6%) | 66 (43.4%) |
| Utilities | 60 (100.0%) | 0 (0.0%) |
| Information | 50 (65.8%) | 26 (34.2%) |
| Finance & Insurance | 94 (55.3%) | 76 (44.7%) |
| Real Estate, Rental & Leasing | 48 (32.9%) | 98 (67.1%) |
| Professional & Scientific | 187 (65.2%) | 100 (34.8%) |
| Enterprise Management | 0 (0.0%) | 0 (0.0%) |
| Administrative & Support | 169 (50.3%) | 167 (49.7%) |
| Educational Services | 190 (38.7%) | 301 (61.3%) |
| Health Care & Social Assistance | 72 (9.1%) | 721 (90.9%) |
| Arts, Entertainment & Recreation | 0 (0.0%) | 17 (100.0%) |
| Accommodation & Food Services | 265 (30.3%) | 609 (69.7%) |
| Public Administration | 130 (62.2%) | 79 (37.8%) |
| Total | 2,726 (47.1%) | 3,060 (52.9%) |
Education in Athens
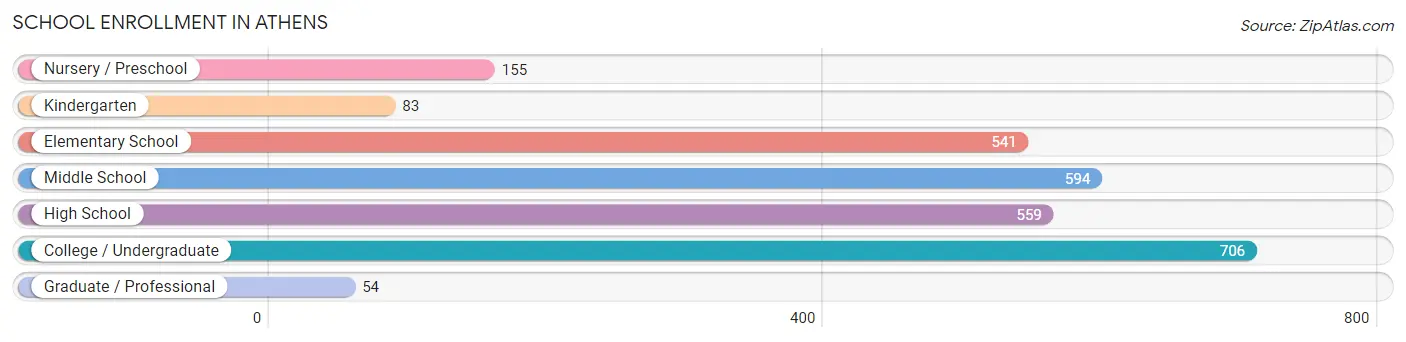
School Enrollment in Athens
The most common levels of schooling among the 2,692 students in Athens are college / undergraduate (706 | 26.2%), middle school (594 | 22.1%), and high school (559 | 20.8%).
| School Level | # Students | % Students |
| Nursery / Preschool | 155 | 5.8% |
| Kindergarten | 83 | 3.1% |
| Elementary School | 541 | 20.1% |
| Middle School | 594 | 22.1% |
| High School | 559 | 20.8% |
| College / Undergraduate | 706 | 26.2% |
| Graduate / Professional | 54 | 2.0% |
| Total | 2,692 | 100.0% |
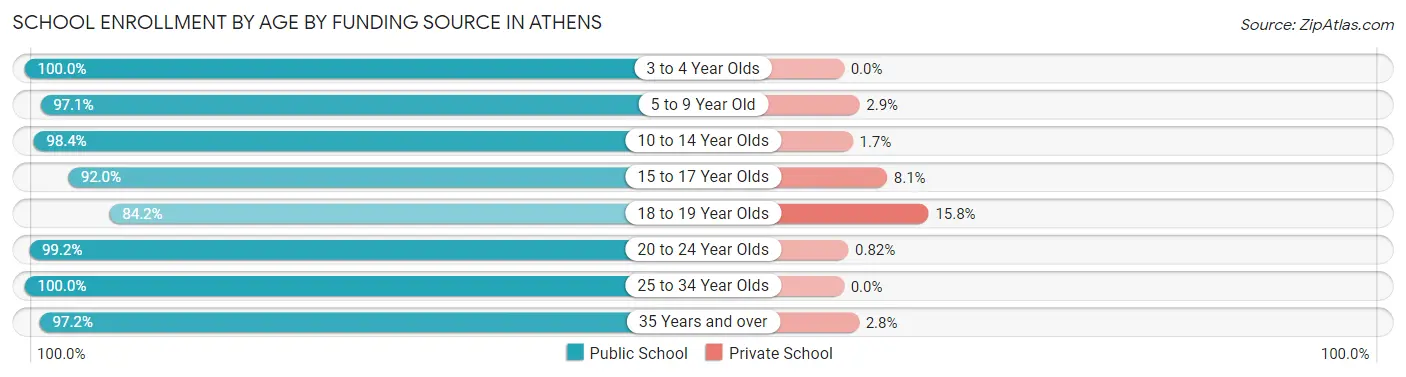
School Enrollment by Age by Funding Source in Athens
Out of a total of 2,692 students who are enrolled in schools in Athens, 135 (5.0%) attend a private institution, while the remaining 2,557 (95.0%) are enrolled in public schools. The age group of 18 to 19 year olds has the highest likelihood of being enrolled in private schools, with 66 (15.8% in the age bracket) enrolled. Conversely, the age group of 3 to 4 year olds has the lowest likelihood of being enrolled in a private school, with 63 (100.0% in the age bracket) attending a public institution.
| Age Bracket | Public School | Private School |
| 3 to 4 Year Olds | 63 (100.0%) | 0 (0.0%) |
| 5 to 9 Year Old | 731 (97.1%) | 22 (2.9%) |
| 10 to 14 Year Olds | 655 (98.4%) | 11 (1.7%) |
| 15 to 17 Year Olds | 354 (91.9%) | 31 (8.1%) |
| 18 to 19 Year Olds | 352 (84.2%) | 66 (15.8%) |
| 20 to 24 Year Olds | 241 (99.2%) | 2 (0.8%) |
| 25 to 34 Year Olds | 57 (100.0%) | 0 (0.0%) |
| 35 Years and over | 104 (97.2%) | 3 (2.8%) |
| Total | 2,557 (95.0%) | 135 (5.0%) |
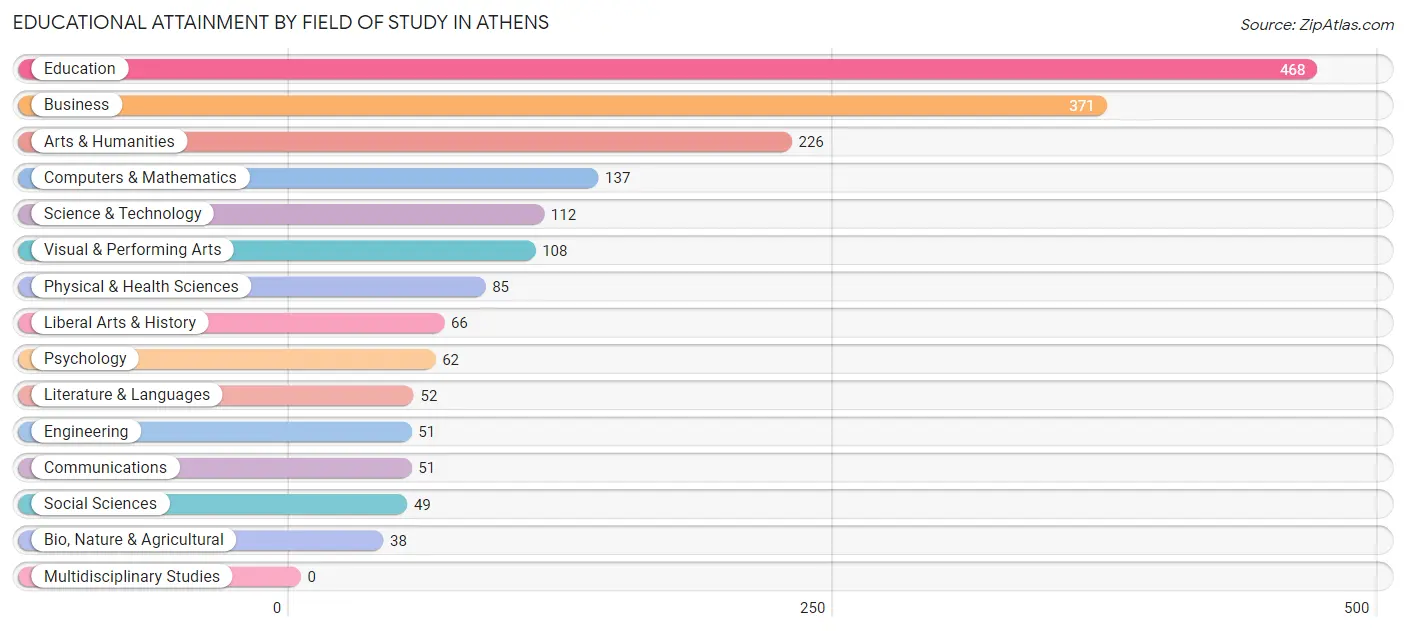
Educational Attainment by Field of Study in Athens
Education (468 | 24.9%), business (371 | 19.8%), arts & humanities (226 | 12.0%), computers & mathematics (137 | 7.3%), and science & technology (112 | 6.0%) are the most common fields of study among 1,876 individuals in Athens who have obtained a bachelor's degree or higher.
| Field of Study | # Graduates | % Graduates |
| Computers & Mathematics | 137 | 7.3% |
| Bio, Nature & Agricultural | 38 | 2.0% |
| Physical & Health Sciences | 85 | 4.5% |
| Psychology | 62 | 3.3% |
| Social Sciences | 49 | 2.6% |
| Engineering | 51 | 2.7% |
| Multidisciplinary Studies | 0 | 0.0% |
| Science & Technology | 112 | 6.0% |
| Business | 371 | 19.8% |
| Education | 468 | 24.9% |
| Literature & Languages | 52 | 2.8% |
| Liberal Arts & History | 66 | 3.5% |
| Visual & Performing Arts | 108 | 5.8% |
| Communications | 51 | 2.7% |
| Arts & Humanities | 226 | 12.0% |
| Total | 1,876 | 100.0% |
Transportation & Commute in Athens
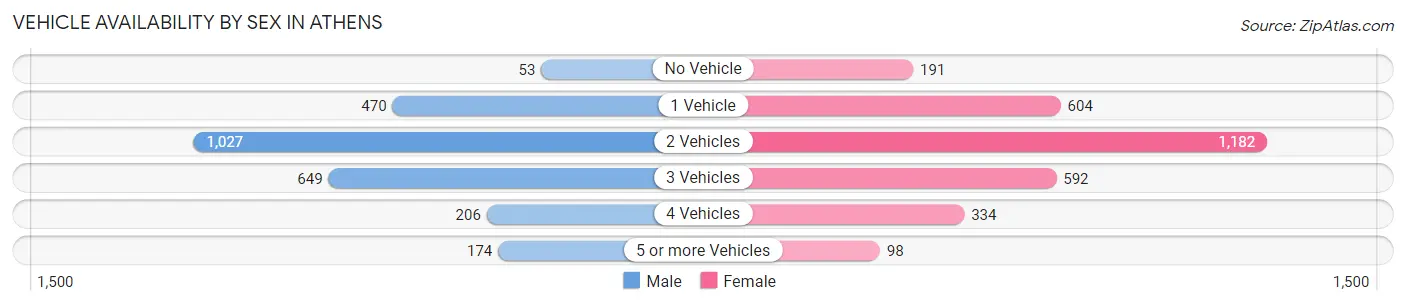
Vehicle Availability by Sex in Athens
The most prevalent vehicle ownership categories in Athens are males with 2 vehicles (1,027, accounting for 39.8%) and females with 2 vehicles (1,182, making up 34.2%).
| Vehicles Available | Male | Female |
| No Vehicle | 53 (2.1%) | 191 (6.4%) |
| 1 Vehicle | 470 (18.2%) | 604 (20.1%) |
| 2 Vehicles | 1,027 (39.8%) | 1,182 (39.4%) |
| 3 Vehicles | 649 (25.2%) | 592 (19.7%) |
| 4 Vehicles | 206 (8.0%) | 334 (11.1%) |
| 5 or more Vehicles | 174 (6.8%) | 98 (3.3%) |
| Total | 2,579 (100.0%) | 3,001 (100.0%) |
Commute Time in Athens
The most frequently occuring commute durations in Athens are 5 to 9 minutes (1,779 commuters, 32.7%), 10 to 14 minutes (853 commuters, 15.7%), and 45 to 59 minutes (499 commuters, 9.2%).
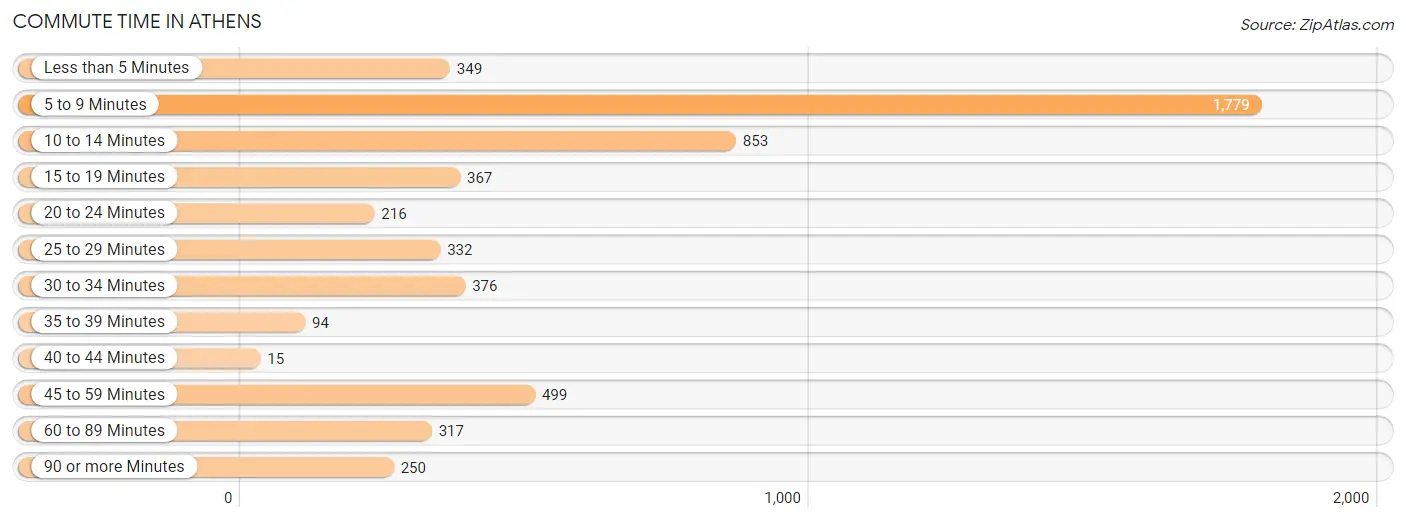
| Commute Time | # Commuters | % Commuters |
| Less than 5 Minutes | 349 | 6.4% |
| 5 to 9 Minutes | 1,779 | 32.7% |
| 10 to 14 Minutes | 853 | 15.7% |
| 15 to 19 Minutes | 367 | 6.7% |
| 20 to 24 Minutes | 216 | 4.0% |
| 25 to 29 Minutes | 332 | 6.1% |
| 30 to 34 Minutes | 376 | 6.9% |
| 35 to 39 Minutes | 94 | 1.7% |
| 40 to 44 Minutes | 15 | 0.3% |
| 45 to 59 Minutes | 499 | 9.2% |
| 60 to 89 Minutes | 317 | 5.8% |
| 90 or more Minutes | 250 | 4.6% |
Commute Time by Sex in Athens
The most common commute times in Athens are 5 to 9 minutes (602 commuters, 23.5%) for males and 5 to 9 minutes (1,177 commuters, 40.8%) for females.
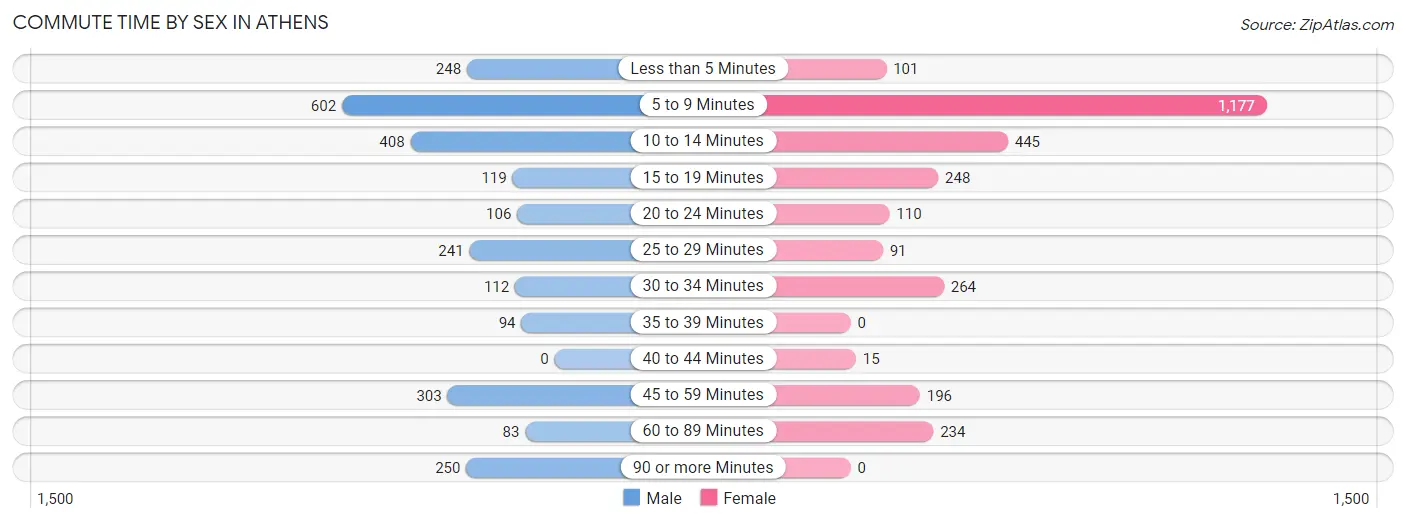
| Commute Time | Male | Female |
| Less than 5 Minutes | 248 (9.7%) | 101 (3.5%) |
| 5 to 9 Minutes | 602 (23.5%) | 1,177 (40.8%) |
| 10 to 14 Minutes | 408 (15.9%) | 445 (15.4%) |
| 15 to 19 Minutes | 119 (4.6%) | 248 (8.6%) |
| 20 to 24 Minutes | 106 (4.1%) | 110 (3.8%) |
| 25 to 29 Minutes | 241 (9.4%) | 91 (3.2%) |
| 30 to 34 Minutes | 112 (4.4%) | 264 (9.2%) |
| 35 to 39 Minutes | 94 (3.7%) | 0 (0.0%) |
| 40 to 44 Minutes | 0 (0.0%) | 15 (0.5%) |
| 45 to 59 Minutes | 303 (11.8%) | 196 (6.8%) |
| 60 to 89 Minutes | 83 (3.2%) | 234 (8.1%) |
| 90 or more Minutes | 250 (9.7%) | 0 (0.0%) |
Time of Departure to Work by Sex in Athens
The most frequent times of departure to work in Athens are 6:30 AM to 6:59 AM (390, 15.2%) for males and 8:00 AM to 8:29 AM (401, 13.9%) for females.
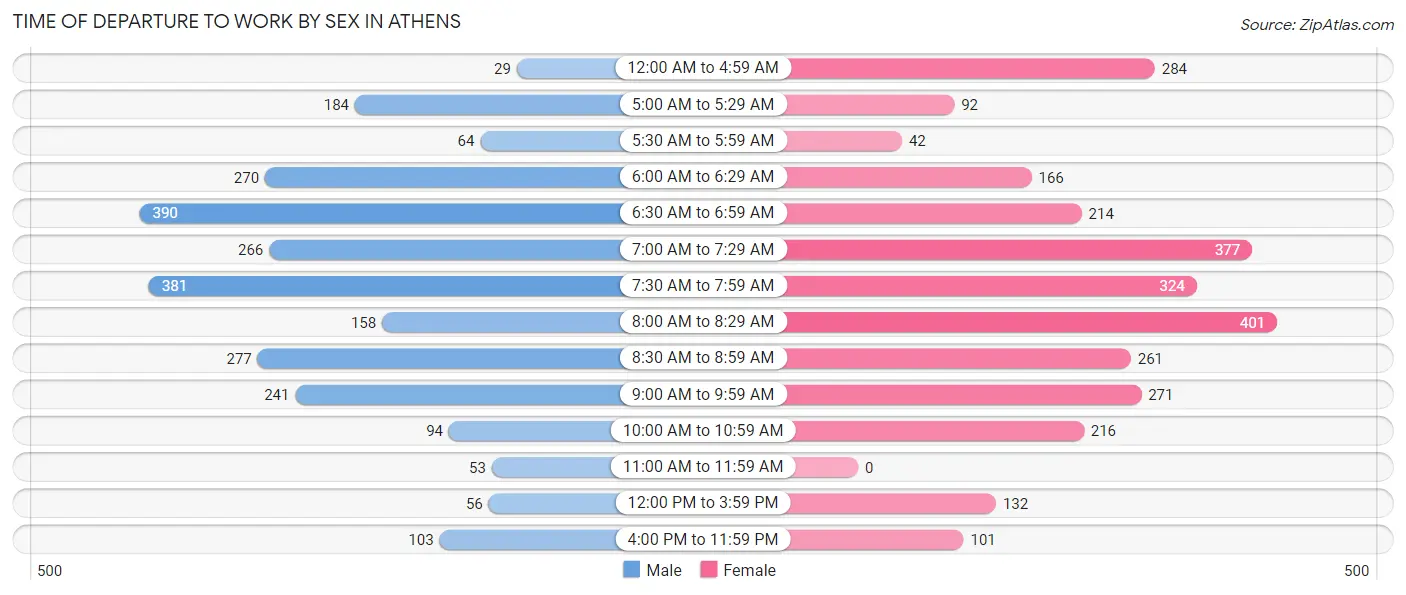
| Time of Departure | Male | Female |
| 12:00 AM to 4:59 AM | 29 (1.1%) | 284 (9.9%) |
| 5:00 AM to 5:29 AM | 184 (7.2%) | 92 (3.2%) |
| 5:30 AM to 5:59 AM | 64 (2.5%) | 42 (1.5%) |
| 6:00 AM to 6:29 AM | 270 (10.5%) | 166 (5.8%) |
| 6:30 AM to 6:59 AM | 390 (15.2%) | 214 (7.4%) |
| 7:00 AM to 7:29 AM | 266 (10.4%) | 377 (13.1%) |
| 7:30 AM to 7:59 AM | 381 (14.8%) | 324 (11.3%) |
| 8:00 AM to 8:29 AM | 158 (6.2%) | 401 (13.9%) |
| 8:30 AM to 8:59 AM | 277 (10.8%) | 261 (9.1%) |
| 9:00 AM to 9:59 AM | 241 (9.4%) | 271 (9.4%) |
| 10:00 AM to 10:59 AM | 94 (3.7%) | 216 (7.5%) |
| 11:00 AM to 11:59 AM | 53 (2.1%) | 0 (0.0%) |
| 12:00 PM to 3:59 PM | 56 (2.2%) | 132 (4.6%) |
| 4:00 PM to 11:59 PM | 103 (4.0%) | 101 (3.5%) |
| Total | 2,566 (100.0%) | 2,881 (100.0%) |
Housing Occupancy in Athens
Occupancy by Ownership in Athens
Of the total 4,582 dwellings in Athens, owner-occupied units account for 2,550 (55.6%), while renter-occupied units make up 2,032 (44.4%).
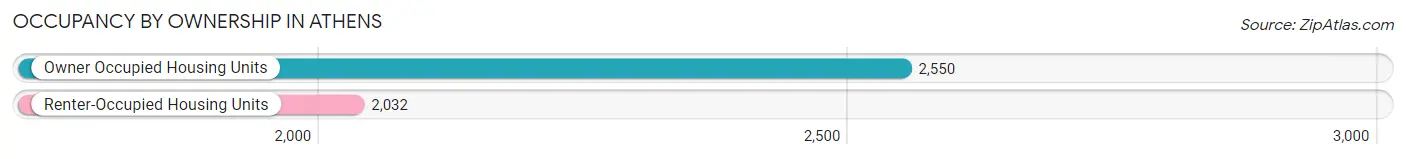
| Occupancy | # Housing Units | % Housing Units |
| Owner Occupied Housing Units | 2,550 | 55.6% |
| Renter-Occupied Housing Units | 2,032 | 44.4% |
| Total Occupied Housing Units | 4,582 | 100.0% |
Occupancy by Household Size in Athens
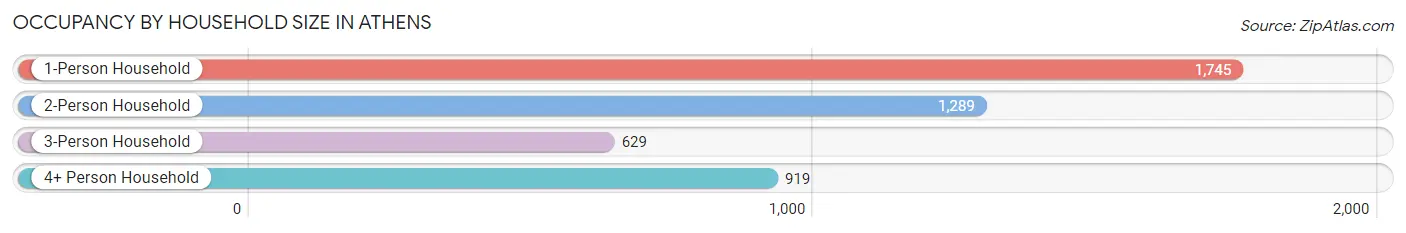
| Household Size | # Housing Units | % Housing Units |
| 1-Person Household | 1,745 | 38.1% |
| 2-Person Household | 1,289 | 28.1% |
| 3-Person Household | 629 | 13.7% |
| 4+ Person Household | 919 | 20.1% |
| Total Housing Units | 4,582 | 100.0% |
Occupancy by Ownership by Household Size in Athens
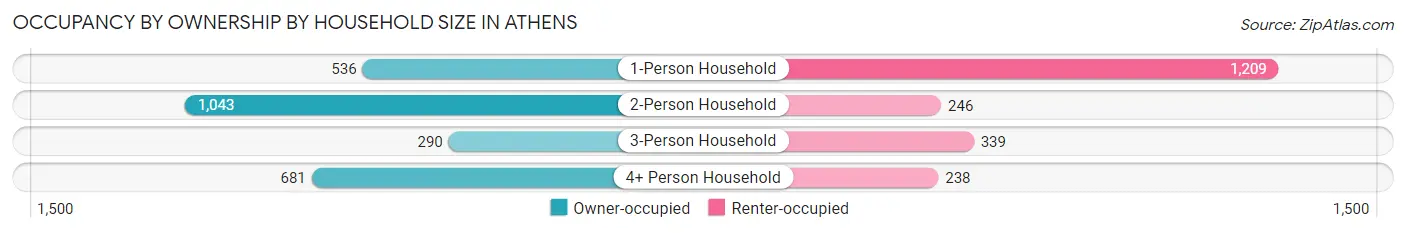
| Household Size | Owner-occupied | Renter-occupied |
| 1-Person Household | 536 (30.7%) | 1,209 (69.3%) |
| 2-Person Household | 1,043 (80.9%) | 246 (19.1%) |
| 3-Person Household | 290 (46.1%) | 339 (53.9%) |
| 4+ Person Household | 681 (74.1%) | 238 (25.9%) |
| Total Housing Units | 2,550 (55.6%) | 2,032 (44.4%) |
Occupancy by Educational Attainment in Athens
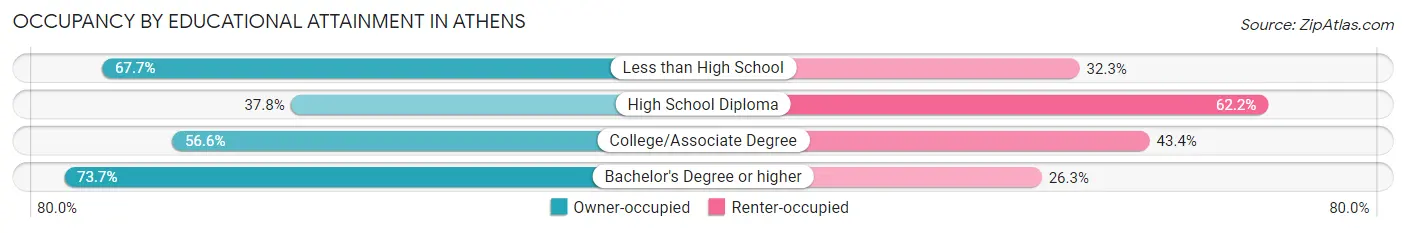
| Household Size | Owner-occupied | Renter-occupied |
| Less than High School | 409 (67.7%) | 195 (32.3%) |
| High School Diploma | 580 (37.8%) | 953 (62.2%) |
| College/Associate Degree | 800 (56.6%) | 613 (43.4%) |
| Bachelor's Degree or higher | 761 (73.7%) | 271 (26.3%) |
Occupancy by Age of Householder in Athens
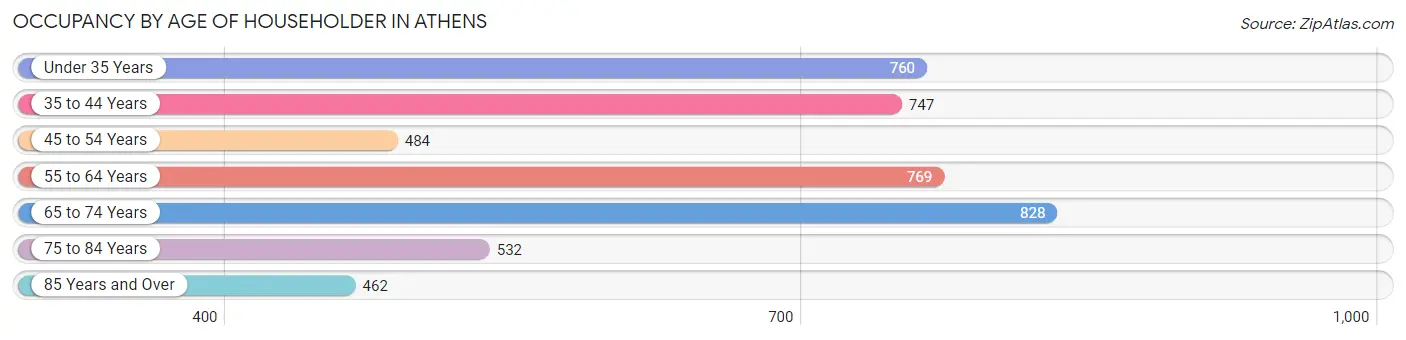
| Age Bracket | # Households | % Households |
| Under 35 Years | 760 | 16.6% |
| 35 to 44 Years | 747 | 16.3% |
| 45 to 54 Years | 484 | 10.6% |
| 55 to 64 Years | 769 | 16.8% |
| 65 to 74 Years | 828 | 18.1% |
| 75 to 84 Years | 532 | 11.6% |
| 85 Years and Over | 462 | 10.1% |
| Total | 4,582 | 100.0% |
Housing Finances in Athens
Median Income by Occupancy in Athens
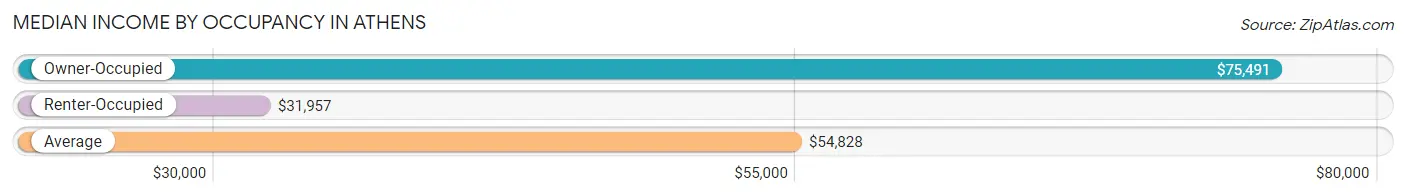
| Occupancy Type | # Households | Median Income |
| Owner-Occupied | 2,550 (55.6%) | $75,491 |
| Renter-Occupied | 2,032 (44.4%) | $31,957 |
| Average | 4,582 (100.0%) | $54,828 |
Occupancy by Householder Income Bracket in Athens
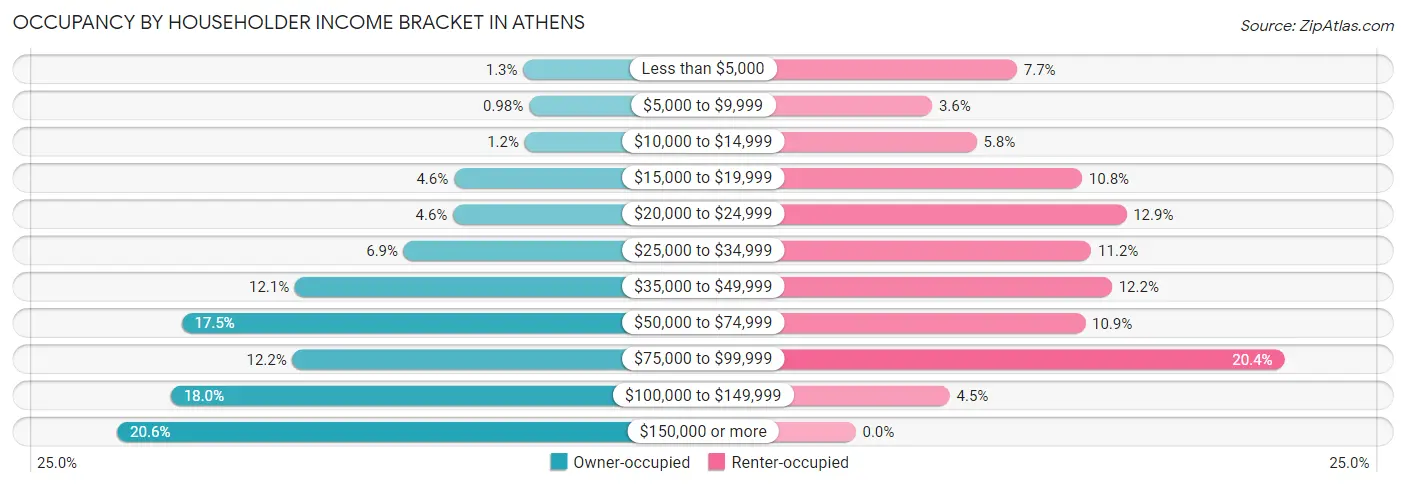
| Income Bracket | Owner-occupied | Renter-occupied |
| Less than $5,000 | 32 (1.3%) | 156 (7.7%) |
| $5,000 to $9,999 | 25 (1.0%) | 74 (3.6%) |
| $10,000 to $14,999 | 30 (1.2%) | 117 (5.8%) |
| $15,000 to $19,999 | 116 (4.5%) | 219 (10.8%) |
| $20,000 to $24,999 | 117 (4.6%) | 262 (12.9%) |
| $25,000 to $34,999 | 177 (6.9%) | 228 (11.2%) |
| $35,000 to $49,999 | 309 (12.1%) | 248 (12.2%) |
| $50,000 to $74,999 | 447 (17.5%) | 222 (10.9%) |
| $75,000 to $99,999 | 312 (12.2%) | 415 (20.4%) |
| $100,000 to $149,999 | 460 (18.0%) | 91 (4.5%) |
| $150,000 or more | 525 (20.6%) | 0 (0.0%) |
| Total | 2,550 (100.0%) | 2,032 (100.0%) |
Monthly Housing Cost Tiers in Athens
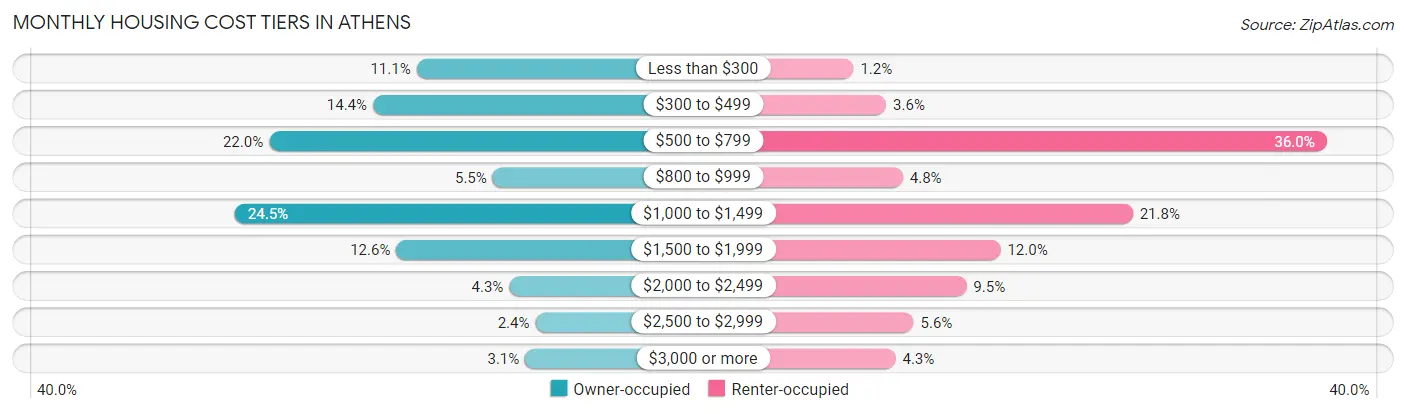
| Monthly Cost | Owner-occupied | Renter-occupied |
| Less than $300 | 284 (11.1%) | 24 (1.2%) |
| $300 to $499 | 366 (14.3%) | 73 (3.6%) |
| $500 to $799 | 561 (22.0%) | 732 (36.0%) |
| $800 to $999 | 141 (5.5%) | 98 (4.8%) |
| $1,000 to $1,499 | 625 (24.5%) | 442 (21.7%) |
| $1,500 to $1,999 | 322 (12.6%) | 244 (12.0%) |
| $2,000 to $2,499 | 110 (4.3%) | 193 (9.5%) |
| $2,500 to $2,999 | 61 (2.4%) | 114 (5.6%) |
| $3,000 or more | 80 (3.1%) | 87 (4.3%) |
| Total | 2,550 (100.0%) | 2,032 (100.0%) |
Physical Housing Characteristics in Athens
Housing Structures in Athens
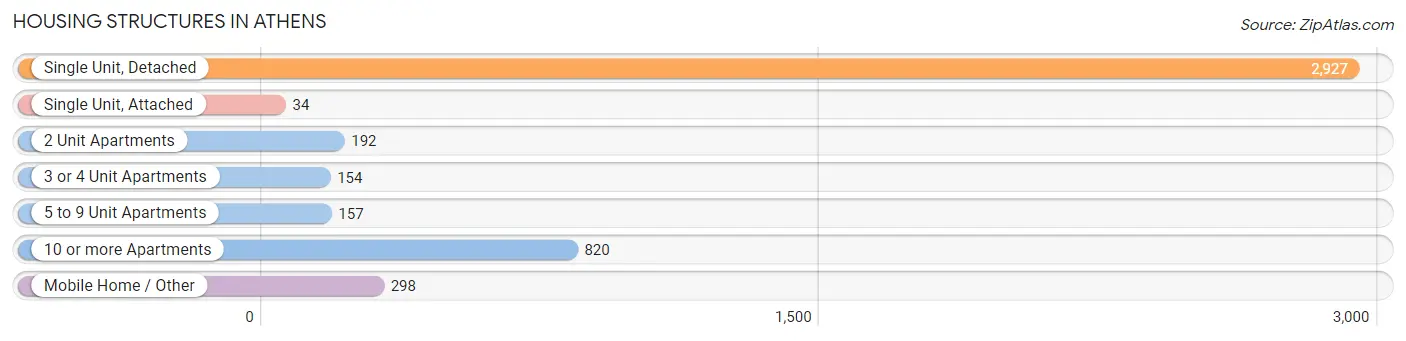
| Structure Type | # Housing Units | % Housing Units |
| Single Unit, Detached | 2,927 | 63.9% |
| Single Unit, Attached | 34 | 0.7% |
| 2 Unit Apartments | 192 | 4.2% |
| 3 or 4 Unit Apartments | 154 | 3.4% |
| 5 to 9 Unit Apartments | 157 | 3.4% |
| 10 or more Apartments | 820 | 17.9% |
| Mobile Home / Other | 298 | 6.5% |
| Total | 4,582 | 100.0% |
Housing Structures by Occupancy in Athens
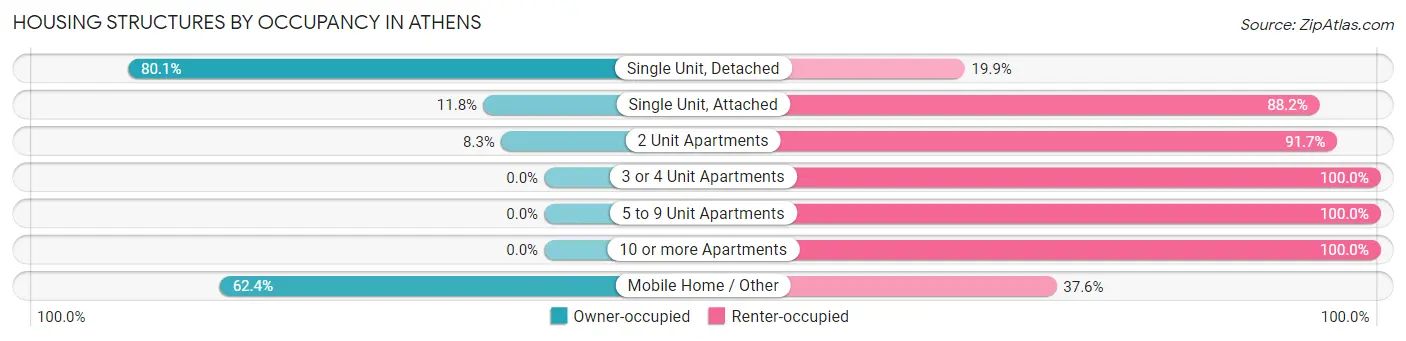
| Structure Type | Owner-occupied | Renter-occupied |
| Single Unit, Detached | 2,344 (80.1%) | 583 (19.9%) |
| Single Unit, Attached | 4 (11.8%) | 30 (88.2%) |
| 2 Unit Apartments | 16 (8.3%) | 176 (91.7%) |
| 3 or 4 Unit Apartments | 0 (0.0%) | 154 (100.0%) |
| 5 to 9 Unit Apartments | 0 (0.0%) | 157 (100.0%) |
| 10 or more Apartments | 0 (0.0%) | 820 (100.0%) |
| Mobile Home / Other | 186 (62.4%) | 112 (37.6%) |
| Total | 2,550 (55.6%) | 2,032 (44.4%) |
Housing Structures by Number of Rooms in Athens
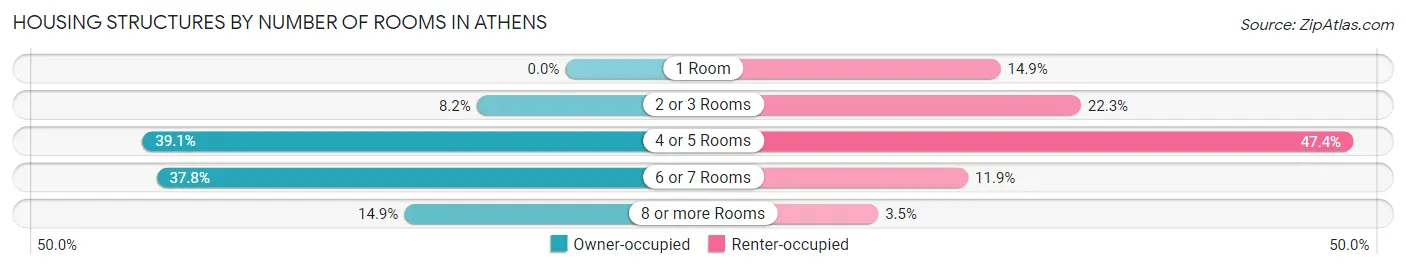
| Number of Rooms | Owner-occupied | Renter-occupied |
| 1 Room | 0 (0.0%) | 302 (14.9%) |
| 2 or 3 Rooms | 209 (8.2%) | 453 (22.3%) |
| 4 or 5 Rooms | 997 (39.1%) | 964 (47.4%) |
| 6 or 7 Rooms | 964 (37.8%) | 241 (11.9%) |
| 8 or more Rooms | 380 (14.9%) | 72 (3.5%) |
| Total | 2,550 (100.0%) | 2,032 (100.0%) |
Housing Structure by Heating Type in Athens
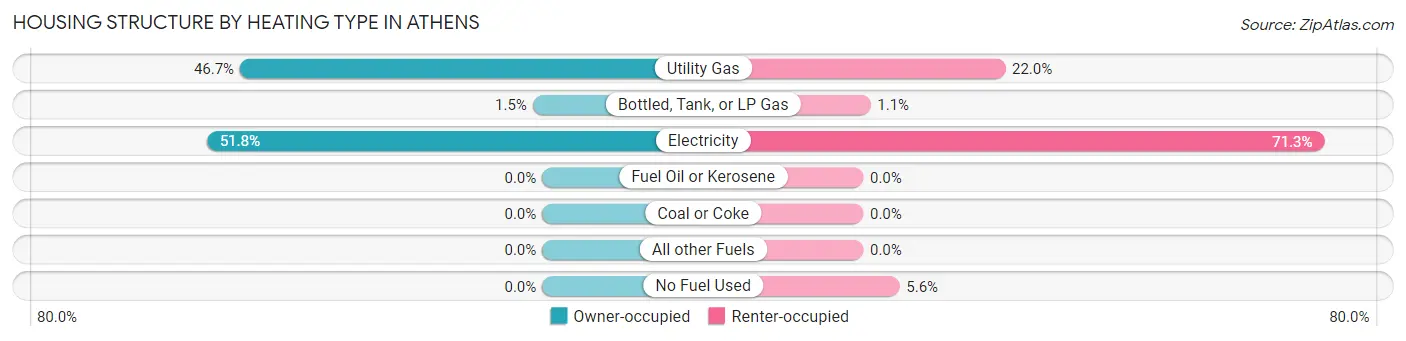
| Heating Type | Owner-occupied | Renter-occupied |
| Utility Gas | 1,191 (46.7%) | 446 (22.0%) |
| Bottled, Tank, or LP Gas | 37 (1.5%) | 23 (1.1%) |
| Electricity | 1,322 (51.8%) | 1,449 (71.3%) |
| Fuel Oil or Kerosene | 0 (0.0%) | 0 (0.0%) |
| Coal or Coke | 0 (0.0%) | 0 (0.0%) |
| All other Fuels | 0 (0.0%) | 0 (0.0%) |
| No Fuel Used | 0 (0.0%) | 114 (5.6%) |
| Total | 2,550 (100.0%) | 2,032 (100.0%) |
Household Vehicle Usage in Athens
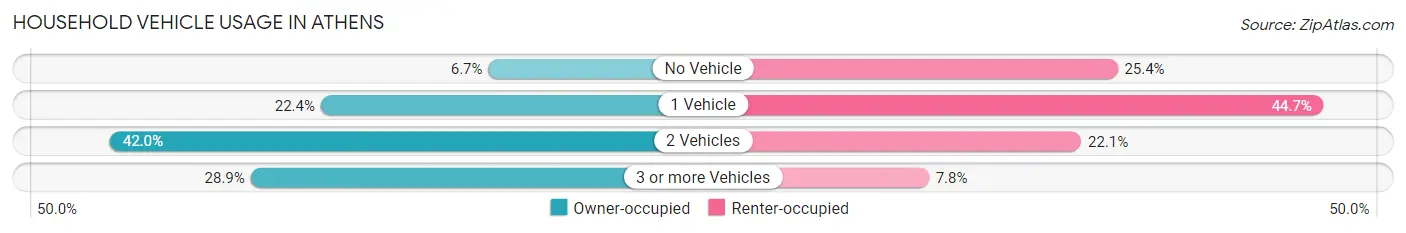
| Vehicles per Household | Owner-occupied | Renter-occupied |
| No Vehicle | 171 (6.7%) | 517 (25.4%) |
| 1 Vehicle | 570 (22.4%) | 908 (44.7%) |
| 2 Vehicles | 1,072 (42.0%) | 448 (22.1%) |
| 3 or more Vehicles | 737 (28.9%) | 159 (7.8%) |
| Total | 2,550 (100.0%) | 2,032 (100.0%) |
Real Estate & Mortgages in Athens
Real Estate and Mortgage Overview in Athens
| Characteristic | Without Mortgage | With Mortgage |
| Housing Units | 1,230 | 1,320 |
| Median Property Value | $136,400 | $173,300 |
| Median Household Income | $43,643 | $425 |
| Monthly Housing Costs | $490 | $80 |
| Real Estate Taxes | $1,371 | $25 |
Property Value by Mortgage Status in Athens
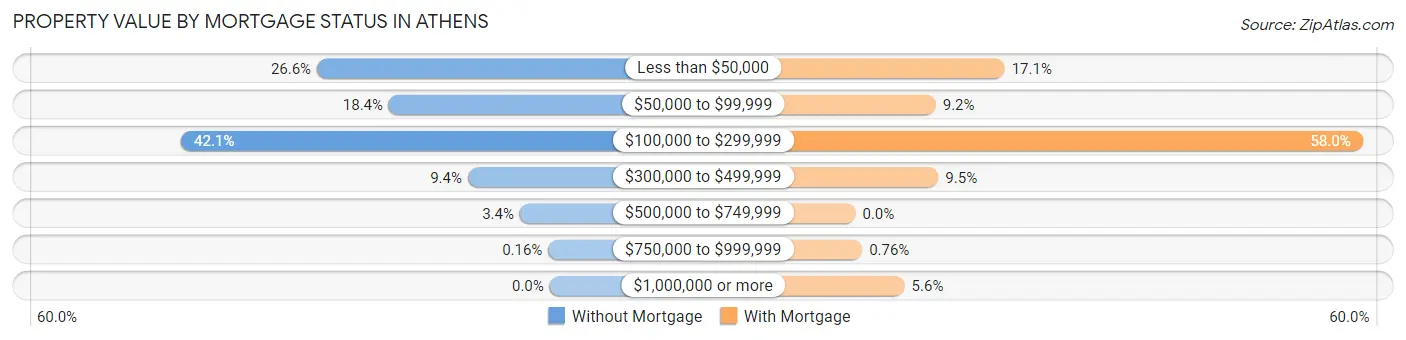
| Property Value | Without Mortgage | With Mortgage |
| Less than $50,000 | 327 (26.6%) | 225 (17.1%) |
| $50,000 to $99,999 | 226 (18.4%) | 121 (9.2%) |
| $100,000 to $299,999 | 518 (42.1%) | 765 (58.0%) |
| $300,000 to $499,999 | 115 (9.3%) | 125 (9.5%) |
| $500,000 to $749,999 | 42 (3.4%) | 0 (0.0%) |
| $750,000 to $999,999 | 2 (0.2%) | 10 (0.8%) |
| $1,000,000 or more | 0 (0.0%) | 74 (5.6%) |
| Total | 1,230 (100.0%) | 1,320 (100.0%) |
Household Income by Mortgage Status in Athens
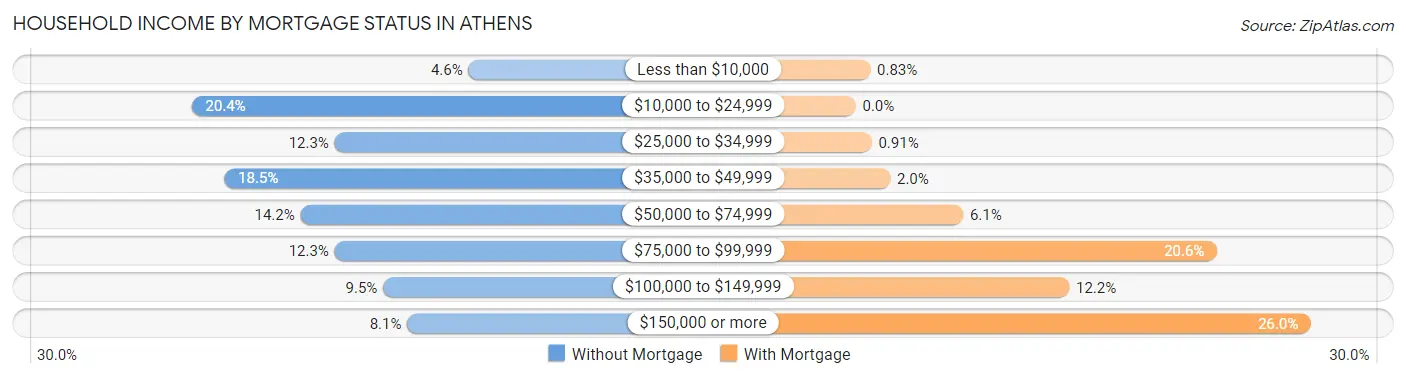
| Household Income | Without Mortgage | With Mortgage |
| Less than $10,000 | 57 (4.6%) | 11 (0.8%) |
| $10,000 to $24,999 | 251 (20.4%) | 0 (0.0%) |
| $25,000 to $34,999 | 151 (12.3%) | 12 (0.9%) |
| $35,000 to $49,999 | 228 (18.5%) | 26 (2.0%) |
| $50,000 to $74,999 | 175 (14.2%) | 81 (6.1%) |
| $75,000 to $99,999 | 151 (12.3%) | 272 (20.6%) |
| $100,000 to $149,999 | 117 (9.5%) | 161 (12.2%) |
| $150,000 or more | 100 (8.1%) | 343 (26.0%) |
| Total | 1,230 (100.0%) | 1,320 (100.0%) |
Property Value to Household Income Ratio in Athens
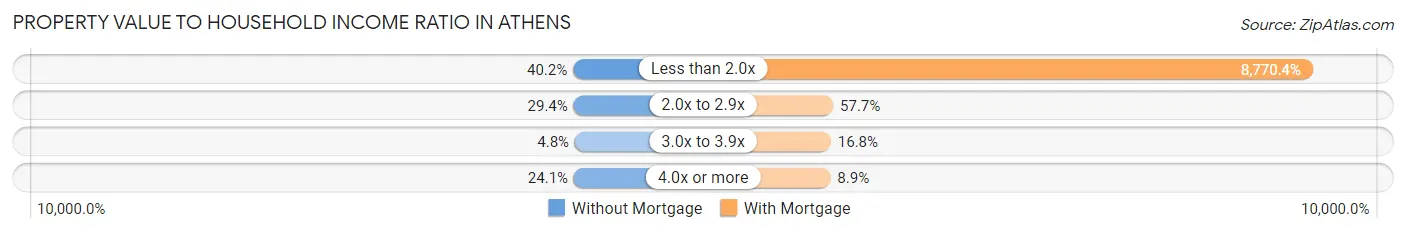
| Value-to-Income Ratio | Without Mortgage | With Mortgage |
| Less than 2.0x | 495 (40.2%) | 115,769 (8,770.4%) |
| 2.0x to 2.9x | 362 (29.4%) | 761 (57.7%) |
| 3.0x to 3.9x | 59 (4.8%) | 222 (16.8%) |
| 4.0x or more | 296 (24.1%) | 118 (8.9%) |
| Total | 1,230 (100.0%) | 1,320 (100.0%) |
Real Estate Taxes by Mortgage Status in Athens
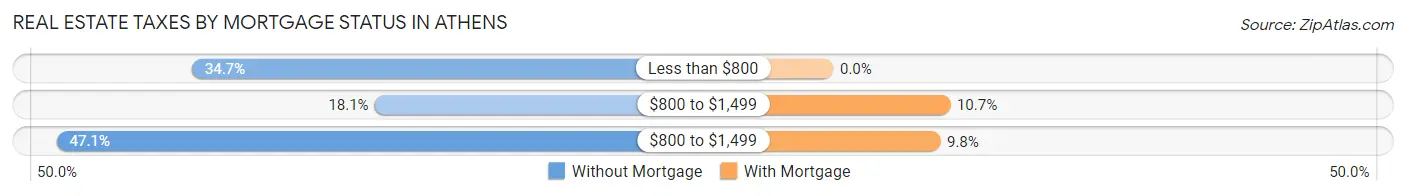
| Property Taxes | Without Mortgage | With Mortgage |
| Less than $800 | 427 (34.7%) | 0 (0.0%) |
| $800 to $1,499 | 222 (18.0%) | 141 (10.7%) |
| $800 to $1,499 | 579 (47.1%) | 129 (9.8%) |
| Total | 1,230 (100.0%) | 1,320 (100.0%) |
Health & Disability in Athens
Health Insurance Coverage by Age in Athens
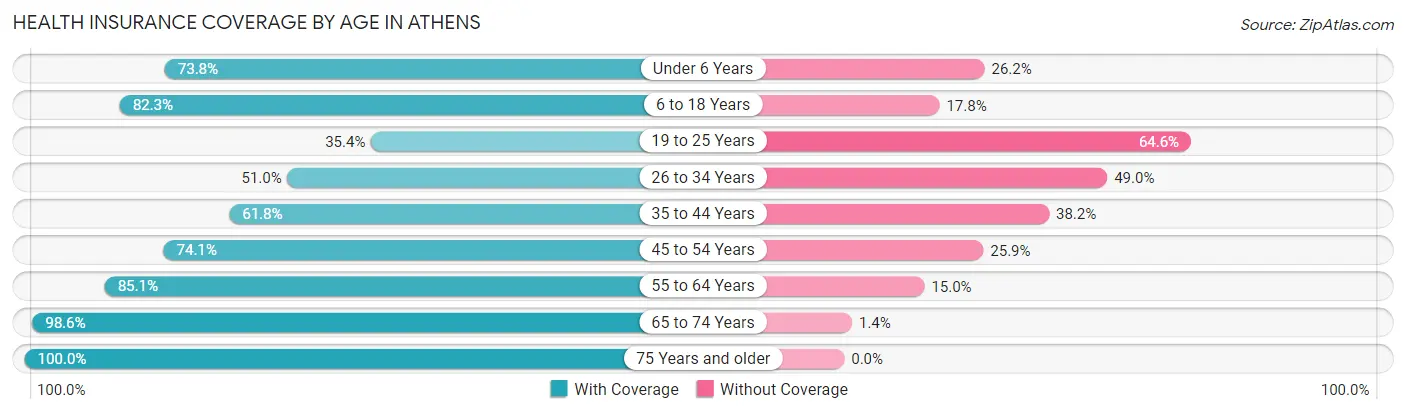
| Age Bracket | With Coverage | Without Coverage |
| Under 6 Years | 717 (73.8%) | 254 (26.2%) |
| 6 to 18 Years | 1,724 (82.3%) | 372 (17.7%) |
| 19 to 25 Years | 604 (35.4%) | 1,104 (64.6%) |
| 26 to 34 Years | 554 (51.0%) | 533 (49.0%) |
| 35 to 44 Years | 821 (61.8%) | 507 (38.2%) |
| 45 to 54 Years | 800 (74.1%) | 280 (25.9%) |
| 55 to 64 Years | 1,041 (85.1%) | 183 (14.9%) |
| 65 to 74 Years | 1,371 (98.6%) | 20 (1.4%) |
| 75 Years and older | 1,197 (100.0%) | 0 (0.0%) |
| Total | 8,829 (73.1%) | 3,253 (26.9%) |
Health Insurance Coverage by Citizenship Status in Athens
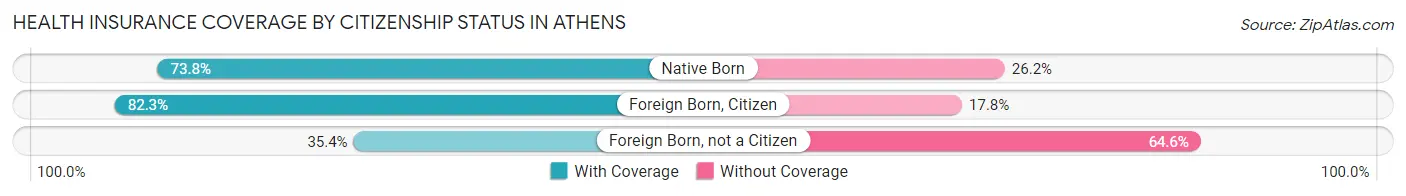
| Citizenship Status | With Coverage | Without Coverage |
| Native Born | 717 (73.8%) | 254 (26.2%) |
| Foreign Born, Citizen | 1,724 (82.3%) | 372 (17.7%) |
| Foreign Born, not a Citizen | 604 (35.4%) | 1,104 (64.6%) |
Health Insurance Coverage by Household Income in Athens
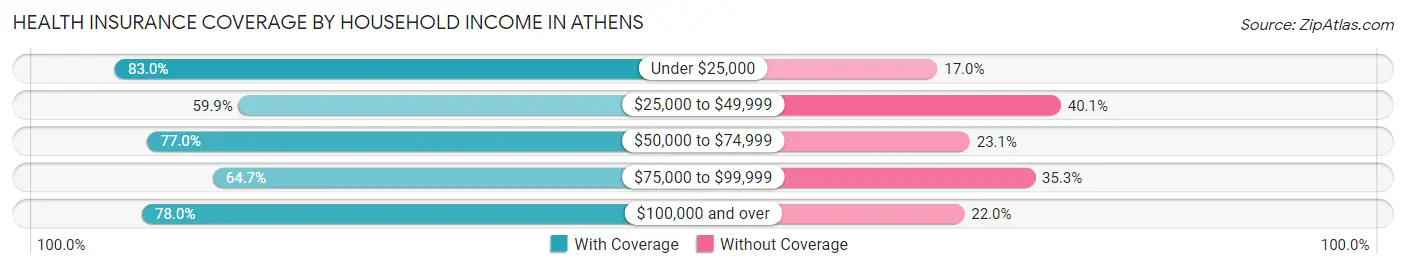
| Household Income | With Coverage | Without Coverage |
| Under $25,000 | 1,679 (83.0%) | 343 (17.0%) |
| $25,000 to $49,999 | 1,449 (59.9%) | 970 (40.1%) |
| $50,000 to $74,999 | 1,305 (76.9%) | 391 (23.1%) |
| $75,000 to $99,999 | 1,411 (64.7%) | 769 (35.3%) |
| $100,000 and over | 2,689 (78.0%) | 759 (22.0%) |
Public vs Private Health Insurance Coverage by Age in Athens
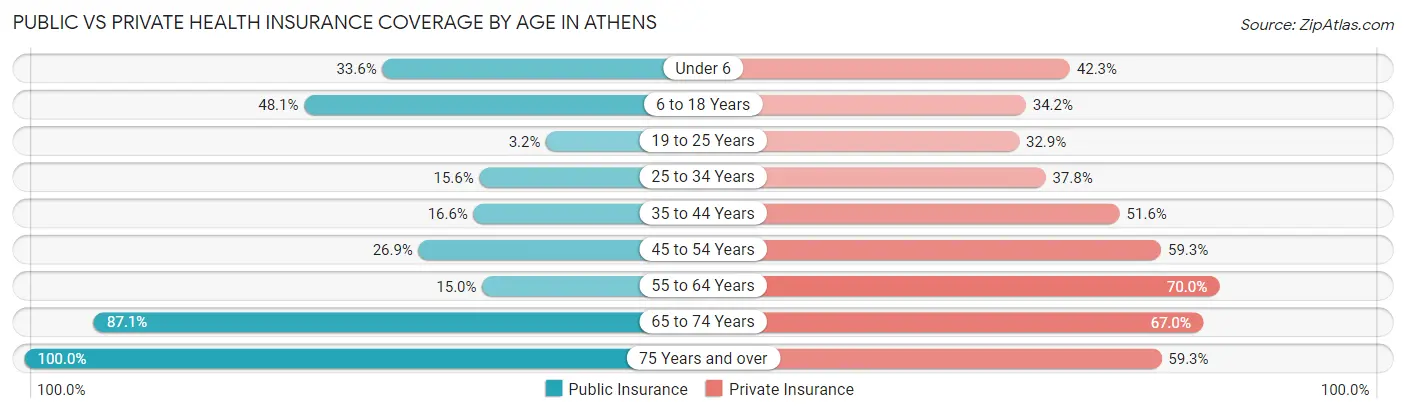
| Age Bracket | Public Insurance | Private Insurance |
| Under 6 | 326 (33.6%) | 411 (42.3%) |
| 6 to 18 Years | 1,008 (48.1%) | 716 (34.2%) |
| 19 to 25 Years | 54 (3.2%) | 562 (32.9%) |
| 25 to 34 Years | 169 (15.5%) | 411 (37.8%) |
| 35 to 44 Years | 221 (16.6%) | 685 (51.6%) |
| 45 to 54 Years | 290 (26.9%) | 640 (59.3%) |
| 55 to 64 Years | 184 (15.0%) | 857 (70.0%) |
| 65 to 74 Years | 1,212 (87.1%) | 932 (67.0%) |
| 75 Years and over | 1,197 (100.0%) | 710 (59.3%) |
| Total | 4,661 (38.6%) | 5,924 (49.0%) |
Disability Status by Sex by Age in Athens
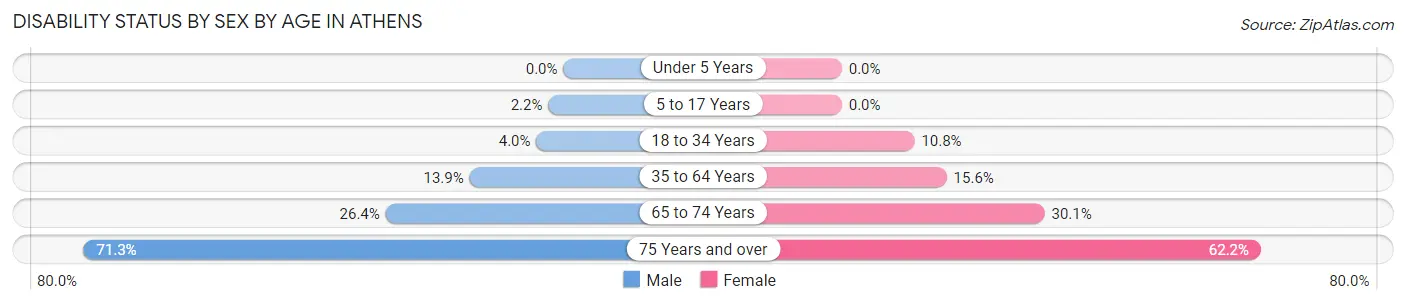
| Age Bracket | Male | Female |
| Under 5 Years | 0 (0.0%) | 0 (0.0%) |
| 5 to 17 Years | 22 (2.2%) | 0 (0.0%) |
| 18 to 34 Years | 49 (4.0%) | 195 (10.8%) |
| 35 to 64 Years | 233 (13.9%) | 305 (15.6%) |
| 65 to 74 Years | 176 (26.4%) | 218 (30.1%) |
| 75 Years and over | 238 (71.3%) | 537 (62.2%) |
Disability Class by Sex by Age in Athens
Disability Class: Hearing Difficulty
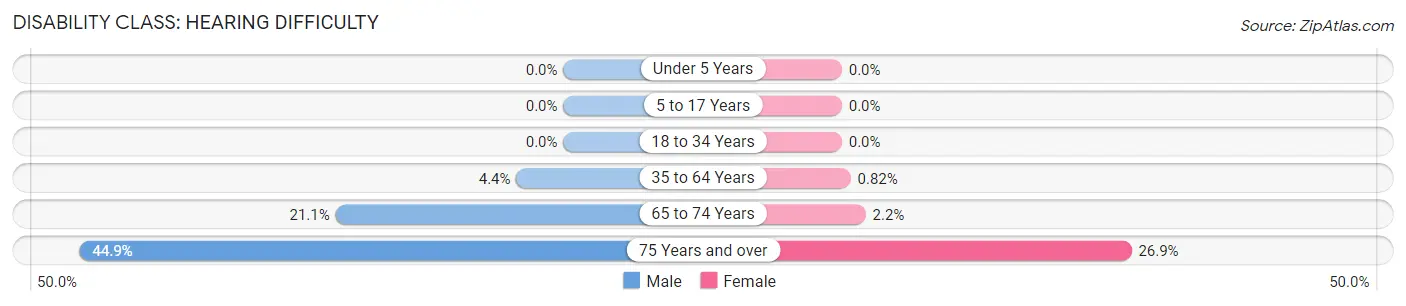
| Age Bracket | Male | Female |
| Under 5 Years | 0 (0.0%) | 0 (0.0%) |
| 5 to 17 Years | 0 (0.0%) | 0 (0.0%) |
| 18 to 34 Years | 0 (0.0%) | 0 (0.0%) |
| 35 to 64 Years | 73 (4.4%) | 16 (0.8%) |
| 65 to 74 Years | 141 (21.1%) | 16 (2.2%) |
| 75 Years and over | 150 (44.9%) | 232 (26.9%) |
Disability Class: Vision Difficulty
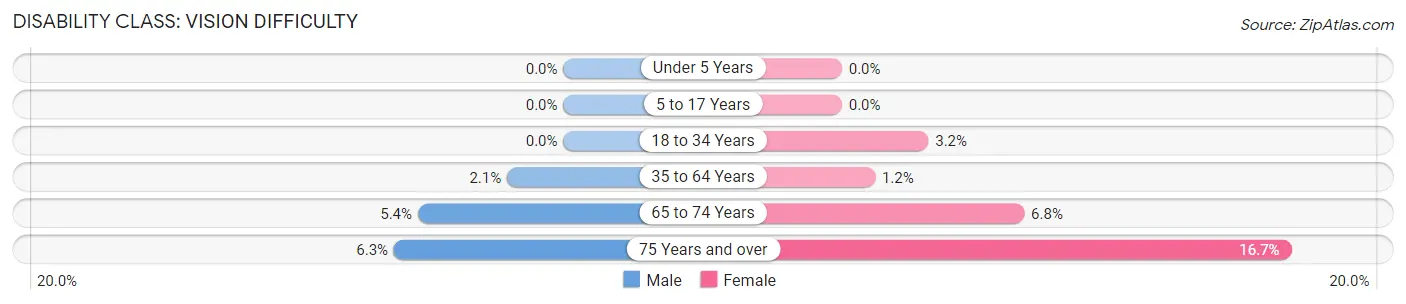
| Age Bracket | Male | Female |
| Under 5 Years | 0 (0.0%) | 0 (0.0%) |
| 5 to 17 Years | 0 (0.0%) | 0 (0.0%) |
| 18 to 34 Years | 0 (0.0%) | 58 (3.2%) |
| 35 to 64 Years | 35 (2.1%) | 24 (1.2%) |
| 65 to 74 Years | 36 (5.4%) | 49 (6.8%) |
| 75 Years and over | 21 (6.3%) | 144 (16.7%) |
Disability Class: Cognitive Difficulty
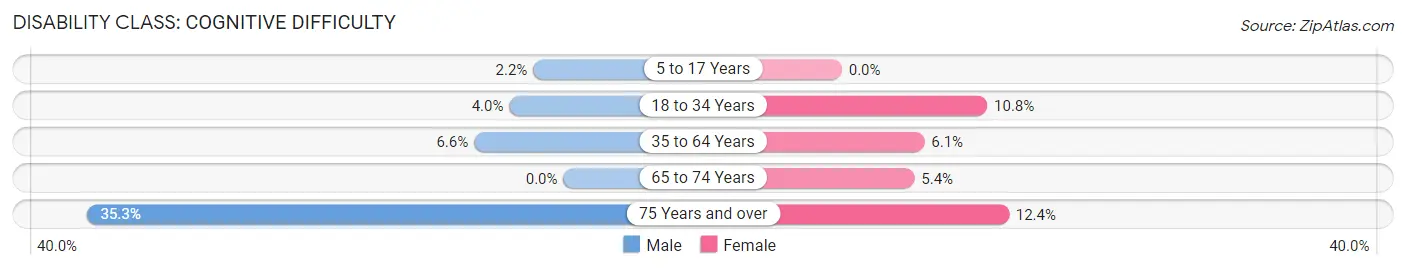
| Age Bracket | Male | Female |
| 5 to 17 Years | 22 (2.2%) | 0 (0.0%) |
| 18 to 34 Years | 49 (4.0%) | 195 (10.8%) |
| 35 to 64 Years | 111 (6.6%) | 120 (6.1%) |
| 65 to 74 Years | 0 (0.0%) | 39 (5.4%) |
| 75 Years and over | 118 (35.3%) | 107 (12.4%) |
Disability Class: Ambulatory Difficulty
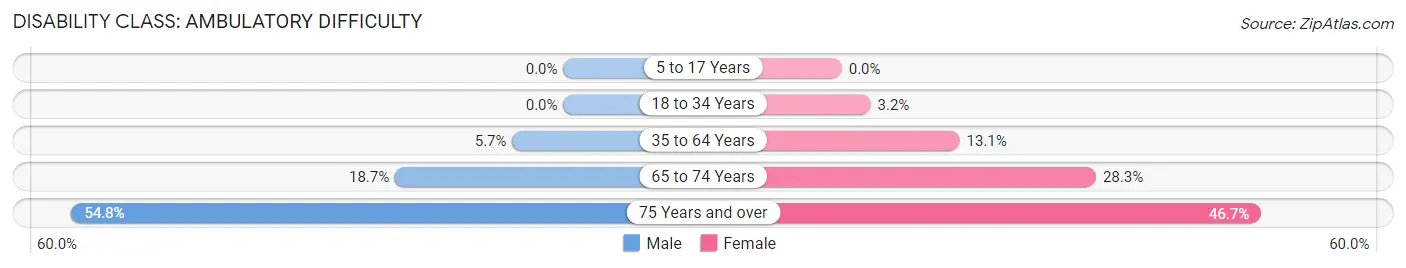
| Age Bracket | Male | Female |
| 5 to 17 Years | 0 (0.0%) | 0 (0.0%) |
| 18 to 34 Years | 0 (0.0%) | 58 (3.2%) |
| 35 to 64 Years | 95 (5.7%) | 257 (13.1%) |
| 65 to 74 Years | 125 (18.7%) | 205 (28.3%) |
| 75 Years and over | 183 (54.8%) | 403 (46.7%) |
Disability Class: Self-Care Difficulty
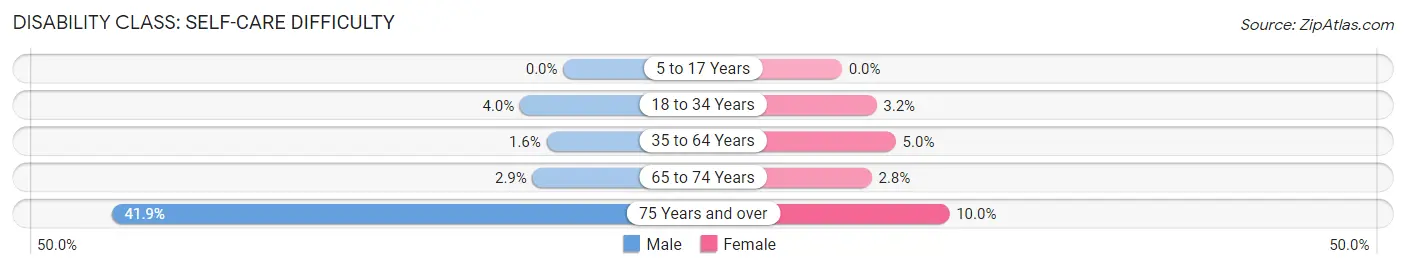
| Age Bracket | Male | Female |
| 5 to 17 Years | 0 (0.0%) | 0 (0.0%) |
| 18 to 34 Years | 49 (4.0%) | 58 (3.2%) |
| 35 to 64 Years | 26 (1.5%) | 98 (5.0%) |
| 65 to 74 Years | 19 (2.9%) | 20 (2.8%) |
| 75 Years and over | 140 (41.9%) | 86 (10.0%) |
Technology Access in Athens
Computing Device Access in Athens
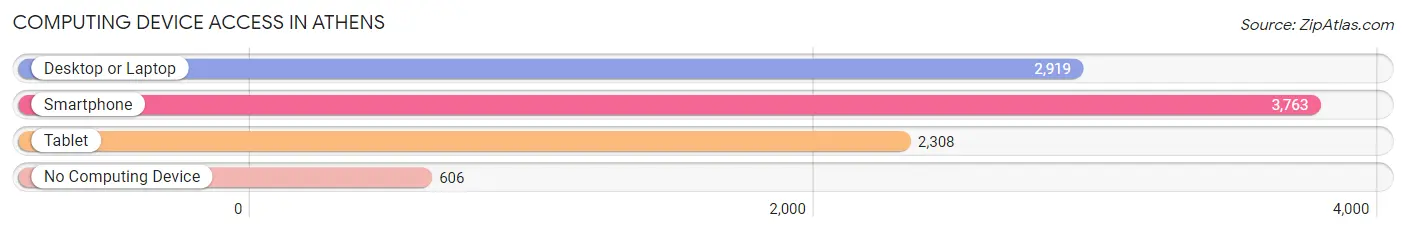
| Device Type | # Households | % Households |
| Desktop or Laptop | 2,919 | 63.7% |
| Smartphone | 3,763 | 82.1% |
| Tablet | 2,308 | 50.4% |
| No Computing Device | 606 | 13.2% |
| Total | 4,582 | 100.0% |
Internet Access in Athens
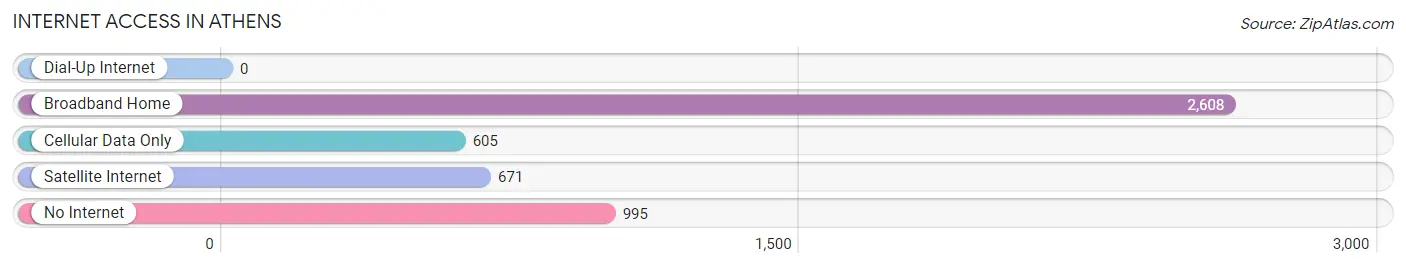
| Internet Type | # Households | % Households |
| Dial-Up Internet | 0 | 0.0% |
| Broadband Home | 2,608 | 56.9% |
| Cellular Data Only | 605 | 13.2% |
| Satellite Internet | 671 | 14.6% |
| No Internet | 995 | 21.7% |
| Total | 4,582 | 100.0% |
Athens Summary
Athens, Texas is a city located in Henderson County, Texas, United States. The population was 12,710 at the 2010 census. It is the county seat of Henderson County. Athens is located 75 miles southeast of Dallas and is part of the Tyler-Jacksonville Combined Statistical Area.
History
Athens was founded in 1846 by settlers from the nearby town of Nacogdoches. The town was named after Athens, Greece, and was the first town in Henderson County. The town was incorporated in 1873 and has since grown to become the county seat.
Athens was an important stop on the Texas and Pacific Railway, which was completed in 1873. The railroad brought new settlers to the area and helped to spur economic growth. The town was also home to several cotton gins and sawmills.
Athens was the site of a major battle during the Civil War. On October 5, 1862, Confederate forces under General John B. Magruder defeated Union forces under General William B. Franklin in the Battle of Athens. The battle was part of the larger Red River Campaign and resulted in a Confederate victory.
Geography
Athens is located at 32°10'25" North, 95°50'25" West (32.173611, -95.840278). According to the United States Census Bureau, the city has a total area of 8.3 square miles (21.5 km2), all of it land.
Economy
Athens is a regional center for manufacturing, agriculture, and healthcare. The city is home to several manufacturing plants, including a Tyson Foods poultry processing plant, a Texas Instruments semiconductor plant, and a General Motors assembly plant.
Agriculture is also an important part of the local economy. The area is known for its production of cotton, soybeans, and hay.
The city is also home to several healthcare facilities, including East Texas Medical Center Athens, a full-service hospital.
Demographics
As of the 2010 census, there were 12,710 people, 4,845 households, and 3,092 families residing in the city. The population density was 1,527.2 people per square mile (589.3/km2). There were 5,521 housing units at an average density of 667.2 per square mile (257.7/km2). The racial makeup of the city was 73.2% White, 17.3% African American, 0.6% Native American, 0.7% Asian, 6.2% from other races, and 2.0% from two or more races. Hispanic or Latino of any race were 13.3% of the population.
There were 4,845 households, out of which 30.2% had children under the age of 18 living with them, 44.2% were married couples living together, 15.7% had a female householder with no husband present, and 35.2% were non-families. 30.2% of all households were made up of individuals, and 14.2% had someone living alone who was 65 years of age or older. The average household size was 2.50 and the average family size was 3.09.
In the city, the population was spread out, with 25.7% under the age of 18, 9.2% from 18 to 24, 25.7% from 25 to 44, 22.2% from 45 to 64, and 17.2% who were 65 years of age or older. The median age was 37 years. For every 100 females, there were 87.7 males. For every 100 females age 18 and over, there were 82.7 males.
The median income for a household in the city was $30,945, and the median income for a family was $37,945. Males had a median income of $30,945 versus $21,945 for females. The per capita income for the city was $17,945. About 13.2% of families and 16.2% of the population were below the poverty line, including 22.2% of those under age 18 and 11.2% of those age 65 or over.
Common Questions
What is Per Capita Income in Athens?
Per Capita income in Athens is $29,235.
What is the Median Family Income in Athens?
Median Family Income in Athens is $68,951.
What is the Median Household income in Athens?
Median Household Income in Athens is $54,828.
What is Income or Wage Gap in Athens?
Income or Wage Gap in Athens is 49.1%.
Women in Athens earn 50.9 cents for every dollar earned by a man.
What is Family Income Deficit in Athens?
Family Income Deficit in Athens is $9,666.
Families that are below poverty line in Athens earn $9,666 less on average than the poverty threshold level.
What is Inequality or Gini Index in Athens?
Inequality or Gini Index in Athens is 0.47.
What is the Total Population of Athens?
Total Population of Athens is 12,878.
What is the Total Male Population of Athens?
Total Male Population of Athens is 6,025.
What is the Total Female Population of Athens?
Total Female Population of Athens is 6,853.
What is the Ratio of Males per 100 Females in Athens?
There are 87.92 Males per 100 Females in Athens.
What is the Ratio of Females per 100 Males in Athens?
There are 113.74 Females per 100 Males in Athens.
What is the Median Population Age in Athens?
Median Population Age in Athens is 38.2 Years.
What is the Average Family Size in Athens
Average Family Size in Athens is 3.4 People.
What is the Average Household Size in Athens
Average Household Size in Athens is 2.6 People.
How Large is the Labor Force in Athens?
There are 5,926 People in the Labor Forcein in Athens.
What is the Percentage of People in the Labor Force in Athens?
57.1% of People are in the Labor Force in Athens.
What is the Unemployment Rate in Athens?
Unemployment Rate in Athens is 2.4%.