Buras, LA Map & Demographics
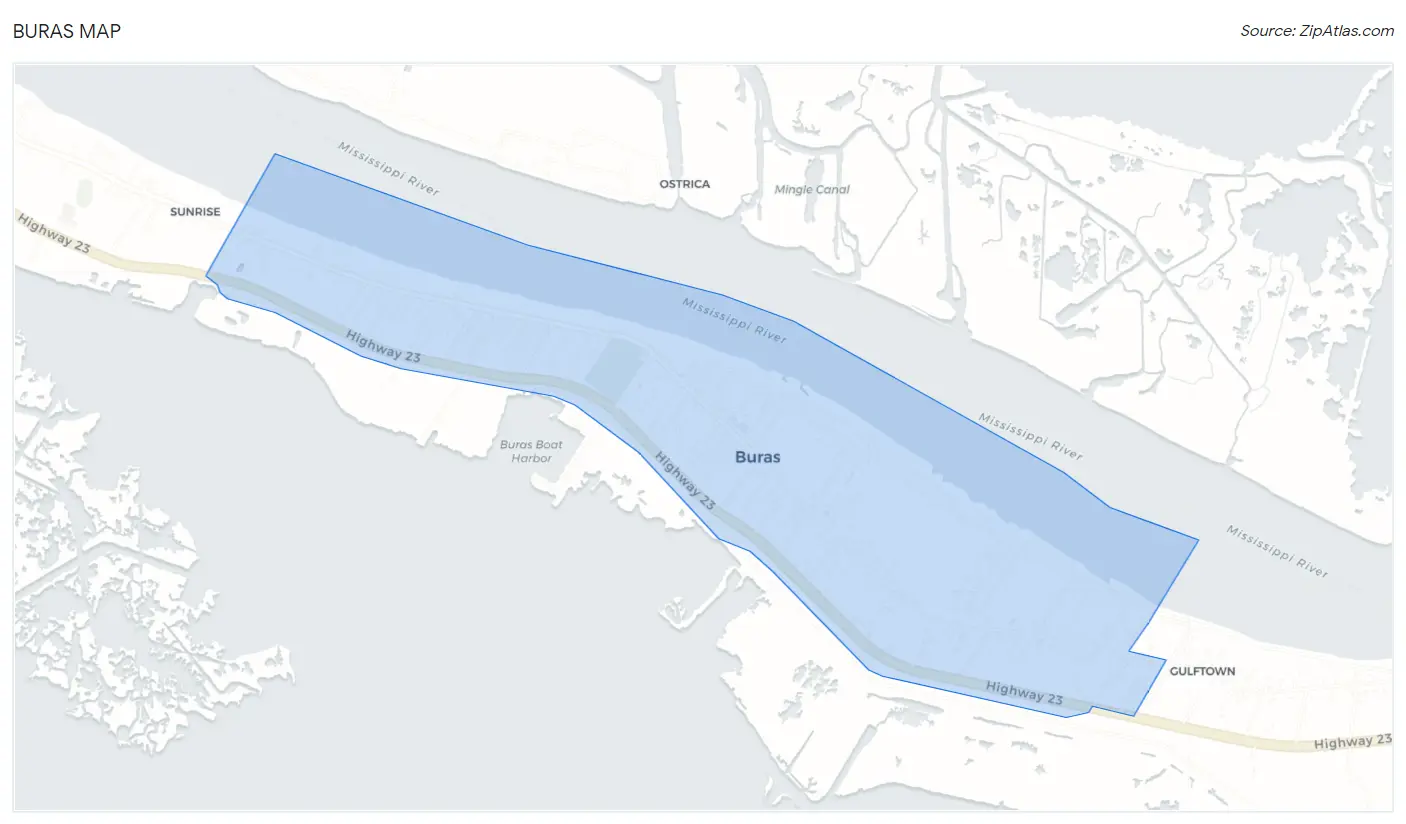
Buras Map
Buras Overview
$24,126
PER CAPITA INCOME
$34,076
AVG FAMILY INCOME
$34,518
AVG HOUSEHOLD INCOME
0.50
INEQUALITY / GINI INDEX
921
TOTAL POPULATION
426
MALE POPULATION
495
FEMALE POPULATION
86.06
MALES / 100 FEMALES
116.20
FEMALES / 100 MALES
36.2
MEDIAN AGE
3.2
AVG FAMILY SIZE
2.7
AVG HOUSEHOLD SIZE
333
LABOR FORCE [ PEOPLE ]
46.4%
PERCENT IN LABOR FORCE
Buras Zip Codes
Buras Area Codes
Income in Buras
Income Overview in Buras
Per Capita Income in Buras is $24,126, while median incomes of families and households are $34,076 and $34,518 respectively.
| Characteristic | Number | Measure |
| Per Capita Income | 921 | $24,126 |
| Median Family Income | 247 | $34,076 |
| Mean Family Income | 247 | $63,689 |
| Median Household Income | 339 | $34,518 |
| Mean Household Income | 339 | $68,230 |
| Income Deficit | 247 | $0 |
| Wage / Income Gap (%) | 921 | 0.00% |
| Wage / Income Gap ($) | 921 | 100.00¢ per $1 |
| Gini / Inequality Index | 921 | 0.50 |
Earnings by Sex in Buras
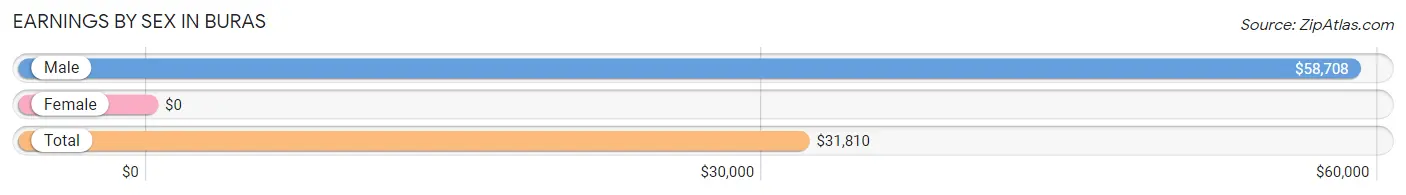
| Sex | Number | Average Earnings |
| Male | 209 (49.4%) | $58,708 |
| Female | 214 (50.6%) | $0 |
| Total | 423 (100.0%) | $31,810 |
Earnings by Sex by Income Bracket in Buras
The most common earnings brackets in Buras are $75,000 to $99,999 for men (59 | 28.2%) and $2,500 to $4,999 for women (65 | 30.4%).
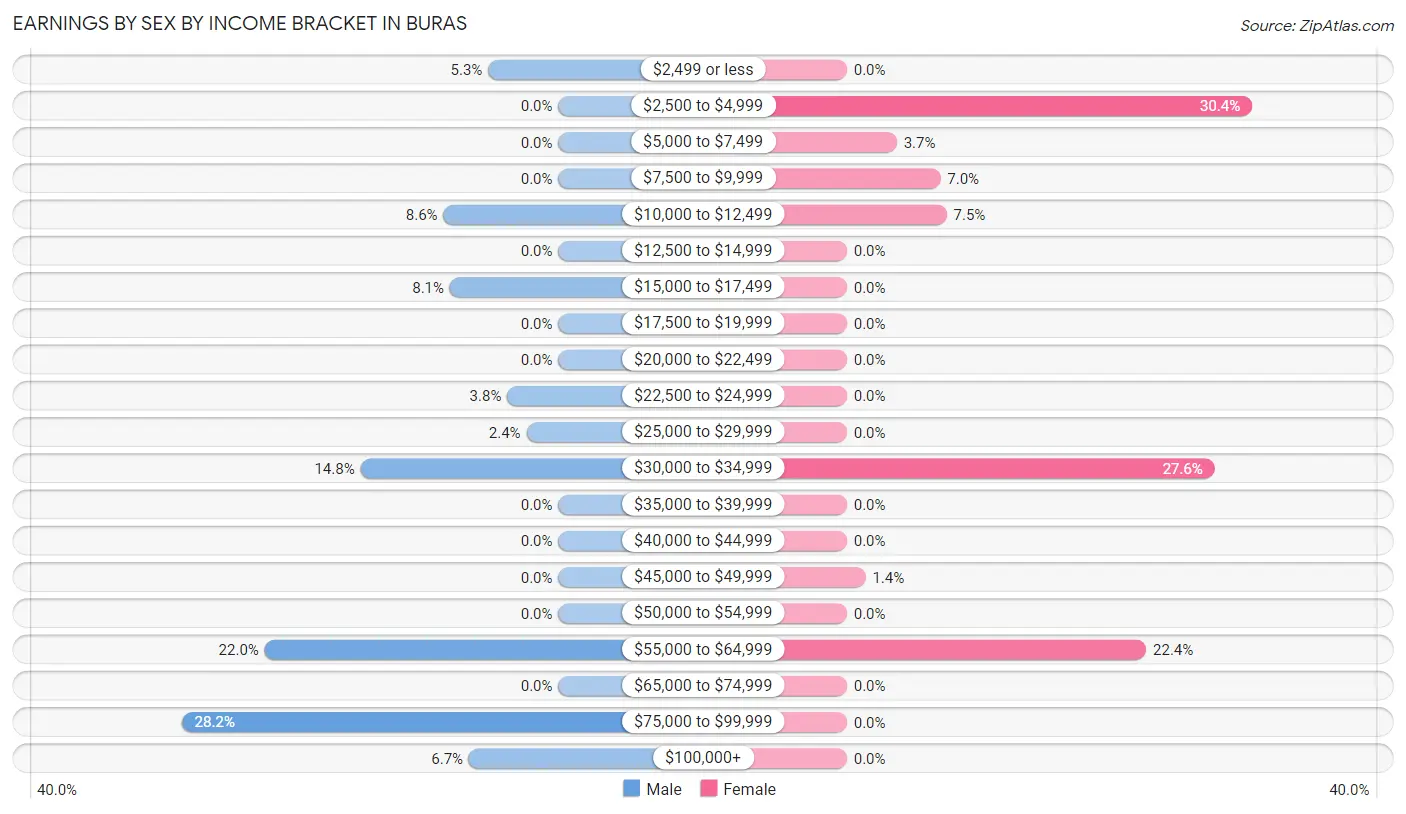
| Income | Male | Female |
| $2,499 or less | 11 (5.3%) | 0 (0.0%) |
| $2,500 to $4,999 | 0 (0.0%) | 65 (30.4%) |
| $5,000 to $7,499 | 0 (0.0%) | 8 (3.7%) |
| $7,500 to $9,999 | 0 (0.0%) | 15 (7.0%) |
| $10,000 to $12,499 | 18 (8.6%) | 16 (7.5%) |
| $12,500 to $14,999 | 0 (0.0%) | 0 (0.0%) |
| $15,000 to $17,499 | 17 (8.1%) | 0 (0.0%) |
| $17,500 to $19,999 | 0 (0.0%) | 0 (0.0%) |
| $20,000 to $22,499 | 0 (0.0%) | 0 (0.0%) |
| $22,500 to $24,999 | 8 (3.8%) | 0 (0.0%) |
| $25,000 to $29,999 | 5 (2.4%) | 0 (0.0%) |
| $30,000 to $34,999 | 31 (14.8%) | 59 (27.6%) |
| $35,000 to $39,999 | 0 (0.0%) | 0 (0.0%) |
| $40,000 to $44,999 | 0 (0.0%) | 0 (0.0%) |
| $45,000 to $49,999 | 0 (0.0%) | 3 (1.4%) |
| $50,000 to $54,999 | 0 (0.0%) | 0 (0.0%) |
| $55,000 to $64,999 | 46 (22.0%) | 48 (22.4%) |
| $65,000 to $74,999 | 0 (0.0%) | 0 (0.0%) |
| $75,000 to $99,999 | 59 (28.2%) | 0 (0.0%) |
| $100,000+ | 14 (6.7%) | 0 (0.0%) |
| Total | 209 (100.0%) | 214 (100.0%) |
Earnings by Sex by Educational Attainment in Buras
Average earnings in Buras are $59,667 for men and $31,504 for women, a difference of 47.2%. Men with an educational attainment of high school diploma enjoy the highest average annual earnings of $85,703, while those with less than high school education earn the least with $58,208. Women with an educational attainment of less than high school earn the most with the average annual earnings of $58,922, while those with college or associate's degree education have the smallest earnings of $31,314.
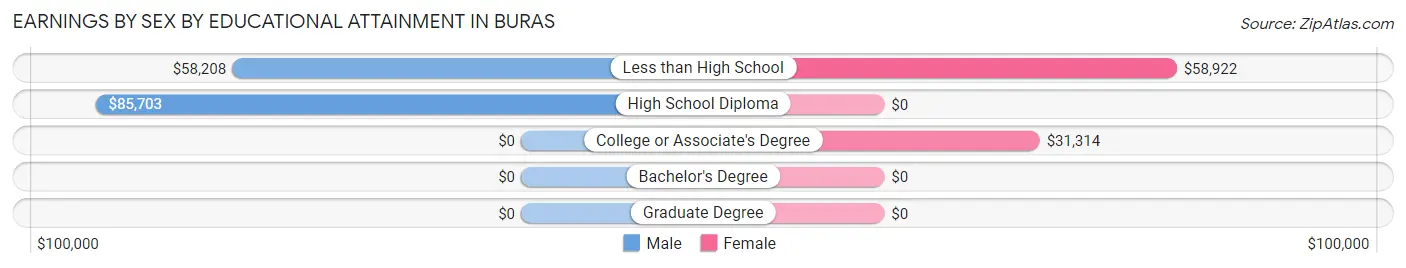
| Educational Attainment | Male Income | Female Income |
| Less than High School | $58,208 | $58,922 |
| High School Diploma | $85,703 | $0 |
| College or Associate's Degree | - | - |
| Bachelor's Degree | - | - |
| Graduate Degree | - | - |
| Total | $59,667 | $31,504 |
Family Income in Buras
Family Income Brackets in Buras
According to the Buras family income data, there are 104 families falling into the $25,000 to $34,999 income range, which is the most common income bracket and makes up 42.1% of all families.
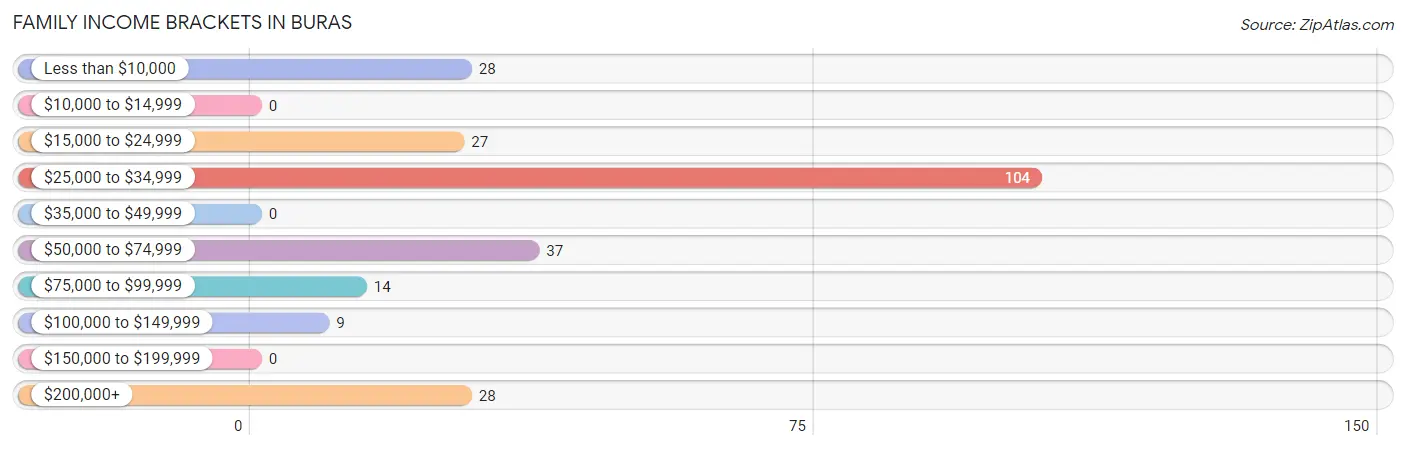
| Income Bracket | # Families | % Families |
| Less than $10,000 | 28 | 11.3% |
| $10,000 to $14,999 | 0 | 0.0% |
| $15,000 to $24,999 | 27 | 10.9% |
| $25,000 to $34,999 | 104 | 42.1% |
| $35,000 to $49,999 | 0 | 0.0% |
| $50,000 to $74,999 | 37 | 15.0% |
| $75,000 to $99,999 | 14 | 5.7% |
| $100,000 to $149,999 | 9 | 3.6% |
| $150,000 to $199,999 | 0 | 0.0% |
| $200,000+ | 28 | 11.3% |
Family Income by Famaliy Size in Buras
5-person families (59 | 23.9%) account for the highest median family income in Buras with $33,694 per family, while 2-person families (85 | 34.4%) have the highest median income of $16,654 per family member.
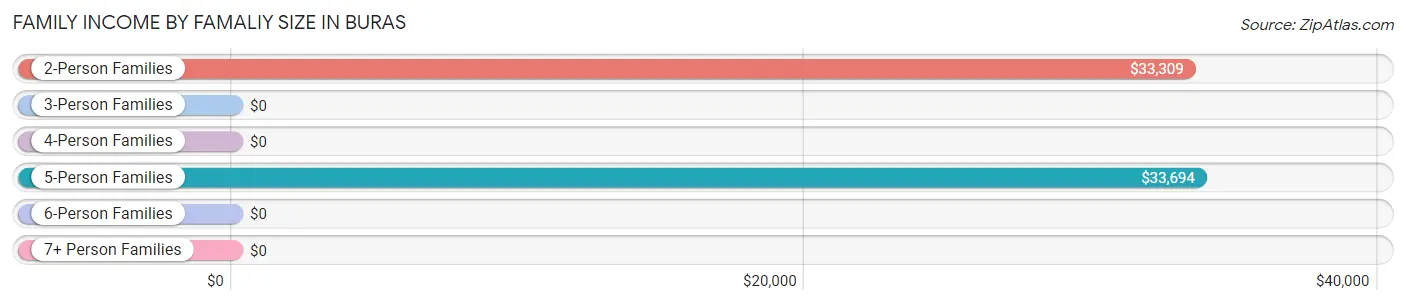
| Income Bracket | # Families | Median Income |
| 2-Person Families | 85 (34.4%) | $33,309 |
| 3-Person Families | 46 (18.6%) | $0 |
| 4-Person Families | 29 (11.7%) | $0 |
| 5-Person Families | 59 (23.9%) | $33,694 |
| 6-Person Families | 0 (0.0%) | $0 |
| 7+ Person Families | 28 (11.3%) | $0 |
| Total | 247 (100.0%) | $34,076 |
Family Income by Number of Earners in Buras
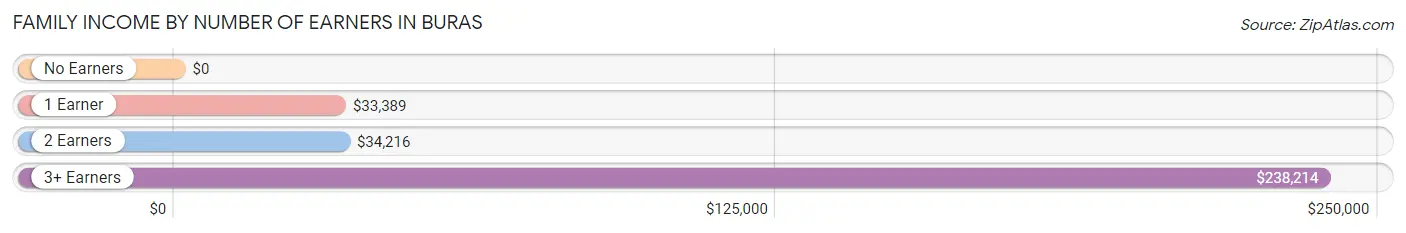
| Number of Earners | # Families | Median Income |
| No Earners | 21 (8.5%) | $0 |
| 1 Earner | 116 (47.0%) | $33,389 |
| 2 Earners | 70 (28.3%) | $34,216 |
| 3+ Earners | 40 (16.2%) | $238,214 |
| Total | 247 (100.0%) | $34,076 |
Household Income in Buras
Household Income Brackets in Buras
With 104 households falling in the category, the $25,000 to $34,999 income range is the most frequent in Buras, accounting for 30.7% of all households.
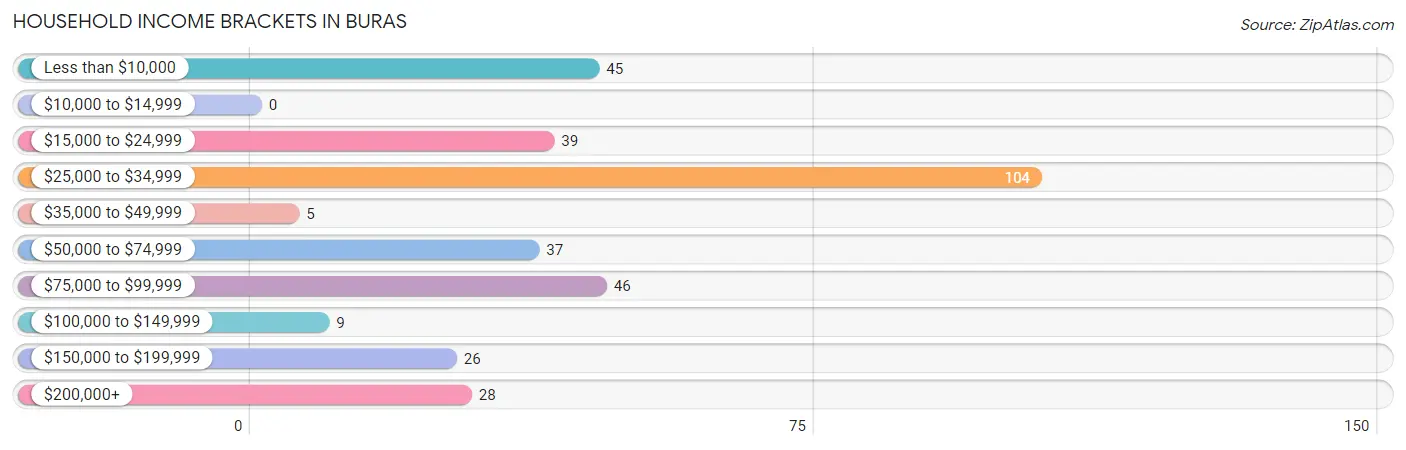
| Income Bracket | # Households | % Households |
| Less than $10,000 | 45 | 13.3% |
| $10,000 to $14,999 | 0 | 0.0% |
| $15,000 to $24,999 | 39 | 11.5% |
| $25,000 to $34,999 | 104 | 30.7% |
| $35,000 to $49,999 | 5 | 1.5% |
| $50,000 to $74,999 | 37 | 10.9% |
| $75,000 to $99,999 | 46 | 13.6% |
| $100,000 to $149,999 | 9 | 2.7% |
| $150,000 to $199,999 | 26 | 7.7% |
| $200,000+ | 28 | 8.3% |
Household Income by Householder Age in Buras
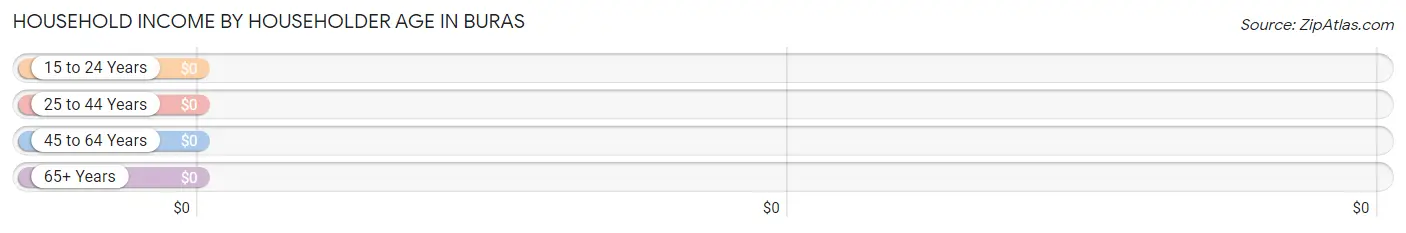
| Income Bracket | # Households | Median Income |
| 15 to 24 Years | 5 (1.5%) | $0 |
| 25 to 44 Years | 142 (41.9%) | $0 |
| 45 to 64 Years | 131 (38.6%) | $0 |
| 65+ Years | 61 (18.0%) | $0 |
| Total | 339 (100.0%) | $34,518 |
Poverty in Buras
Income Below Poverty by Sex and Age in Buras
With 36.4% poverty level for males and 33.5% for females among the residents of Buras, 18 to 24 year old males and 5 year old females are the most vulnerable to poverty, with 18 males (100.0%) and 21 females (100.0%) in their respective age groups living below the poverty level.
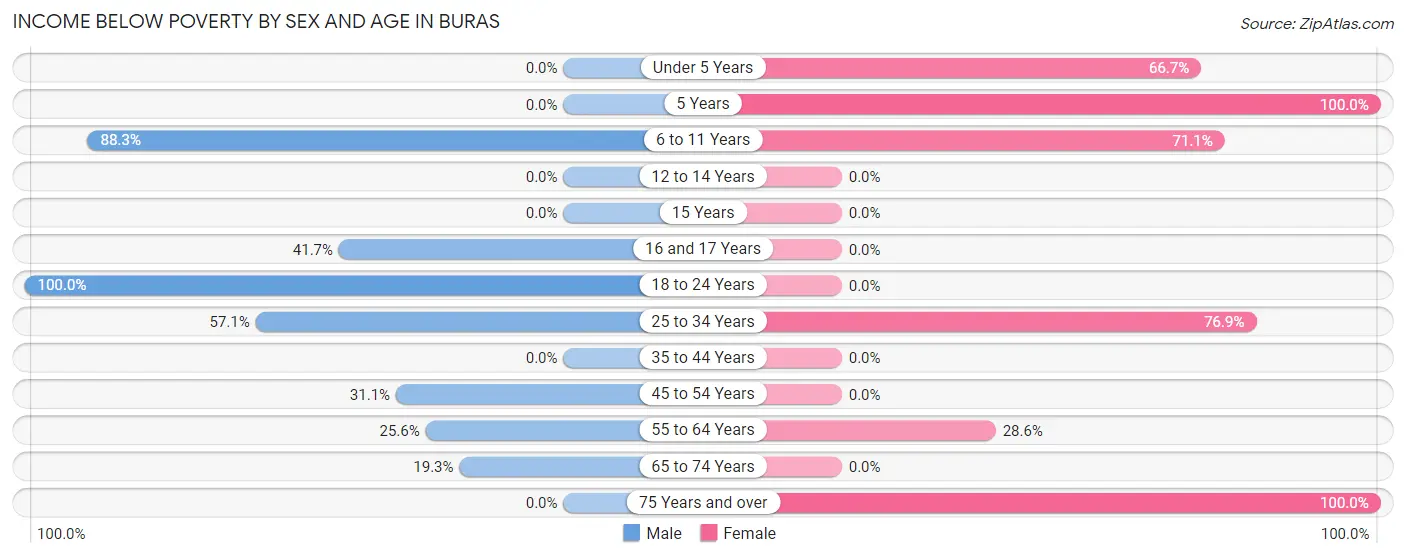
| Age Bracket | Male | Female |
| Under 5 Years | 0 (0.0%) | 12 (66.7%) |
| 5 Years | 0 (0.0%) | 21 (100.0%) |
| 6 to 11 Years | 68 (88.3%) | 27 (71.1%) |
| 12 to 14 Years | 0 (0.0%) | 0 (0.0%) |
| 15 Years | 0 (0.0%) | 0 (0.0%) |
| 16 and 17 Years | 5 (41.7%) | 0 (0.0%) |
| 18 to 24 Years | 18 (100.0%) | 0 (0.0%) |
| 25 to 34 Years | 8 (57.1%) | 70 (76.9%) |
| 35 to 44 Years | 0 (0.0%) | 0 (0.0%) |
| 45 to 54 Years | 23 (31.1%) | 0 (0.0%) |
| 55 to 64 Years | 22 (25.6%) | 32 (28.6%) |
| 65 to 74 Years | 11 (19.3%) | 0 (0.0%) |
| 75 Years and over | 0 (0.0%) | 4 (100.0%) |
| Total | 155 (36.4%) | 166 (33.5%) |
Income Above Poverty by Sex and Age in Buras
According to the poverty statistics in Buras, males aged 5 years and females aged 15 years are the age groups that are most secure financially, with 100.0% of males and 100.0% of females in these age groups living above the poverty line.
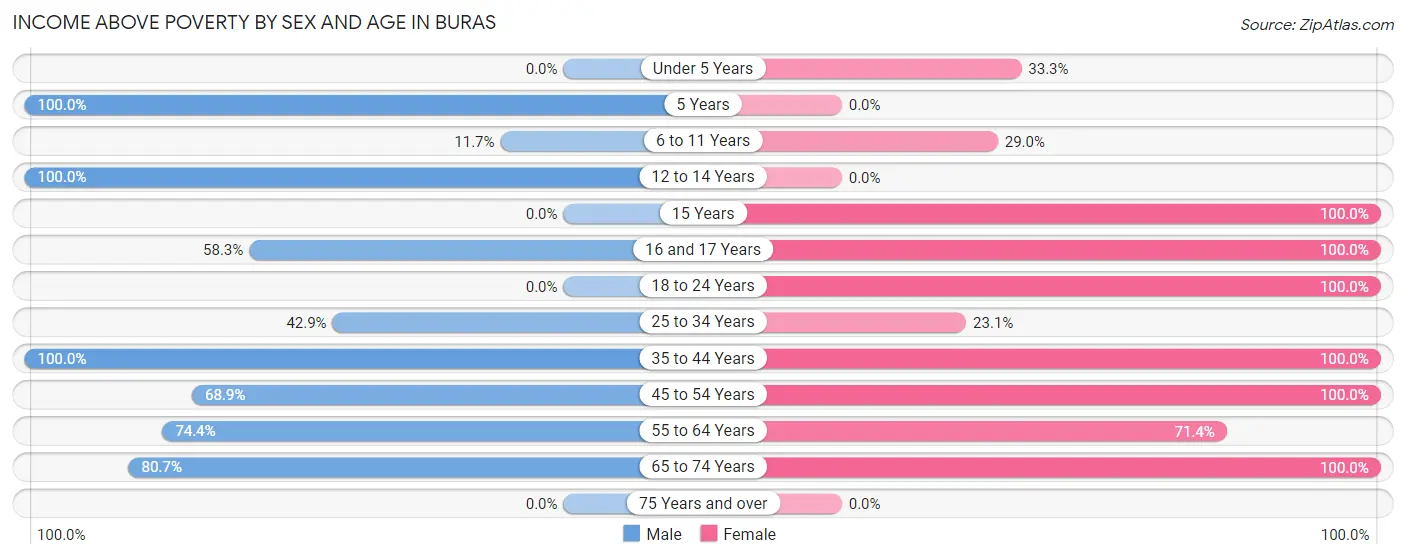
| Age Bracket | Male | Female |
| Under 5 Years | 0 (0.0%) | 6 (33.3%) |
| 5 Years | 16 (100.0%) | 0 (0.0%) |
| 6 to 11 Years | 9 (11.7%) | 11 (28.9%) |
| 12 to 14 Years | 22 (100.0%) | 0 (0.0%) |
| 15 Years | 0 (0.0%) | 11 (100.0%) |
| 16 and 17 Years | 7 (58.3%) | 19 (100.0%) |
| 18 to 24 Years | 0 (0.0%) | 65 (100.0%) |
| 25 to 34 Years | 6 (42.9%) | 21 (23.1%) |
| 35 to 44 Years | 50 (100.0%) | 45 (100.0%) |
| 45 to 54 Years | 51 (68.9%) | 50 (100.0%) |
| 55 to 64 Years | 64 (74.4%) | 80 (71.4%) |
| 65 to 74 Years | 46 (80.7%) | 21 (100.0%) |
| 75 Years and over | 0 (0.0%) | 0 (0.0%) |
| Total | 271 (63.6%) | 329 (66.5%) |
Income Below Poverty Among Married-Couple Families in Buras
The poverty statistics for married-couple families in Buras show that 36.6% or 56 of the total 153 families live below the poverty line. Families with 3 or 4 children have the highest poverty rate of 61.6%, comprising of 45 families. On the other hand, families with 1 or 2 children have the lowest poverty rate of 0.0%, which includes 0 families.
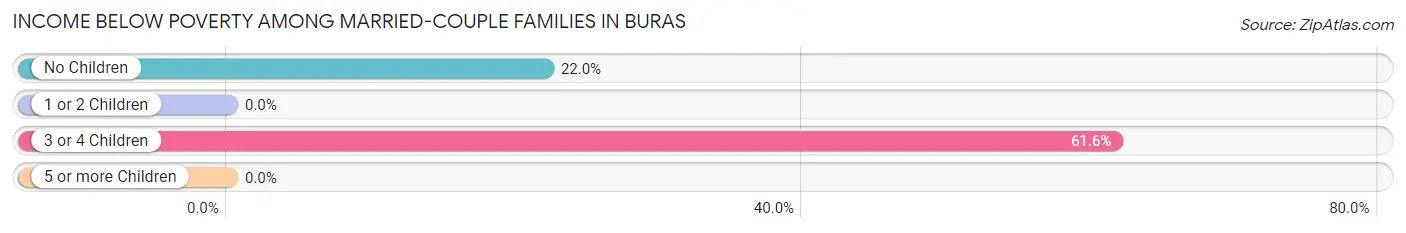
| Children | Above Poverty | Below Poverty |
| No Children | 39 (78.0%) | 11 (22.0%) |
| 1 or 2 Children | 30 (100.0%) | 0 (0.0%) |
| 3 or 4 Children | 28 (38.4%) | 45 (61.6%) |
| 5 or more Children | 0 (0.0%) | 0 (0.0%) |
| Total | 97 (63.4%) | 56 (36.6%) |
Income Below Poverty Among Single-Parent Households in Buras
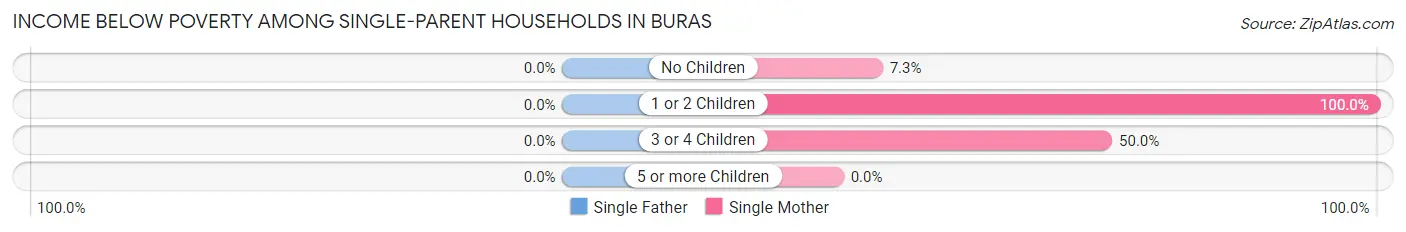
| Children | Single Father | Single Mother |
| No Children | 0 (0.0%) | 4 (7.3%) |
| 1 or 2 Children | 0 (0.0%) | 17 (100.0%) |
| 3 or 4 Children | 0 (0.0%) | 8 (50.0%) |
| 5 or more Children | 0 (0.0%) | 0 (0.0%) |
| Total | 0 (0.0%) | 29 (33.0%) |
Income Below Poverty Among Married-Couple vs Single-Parent Households in Buras
The poverty data for Buras shows that 56 of the married-couple family households (36.6%) and 29 of the single-parent households (30.8%) are living below the poverty level. Within the married-couple family households, those with 3 or 4 children have the highest poverty rate, with 45 households (61.6%) falling below the poverty line. Among the single-parent households, those with 1 or 2 children have the highest poverty rate, with 17 household (100.0%) living below poverty.
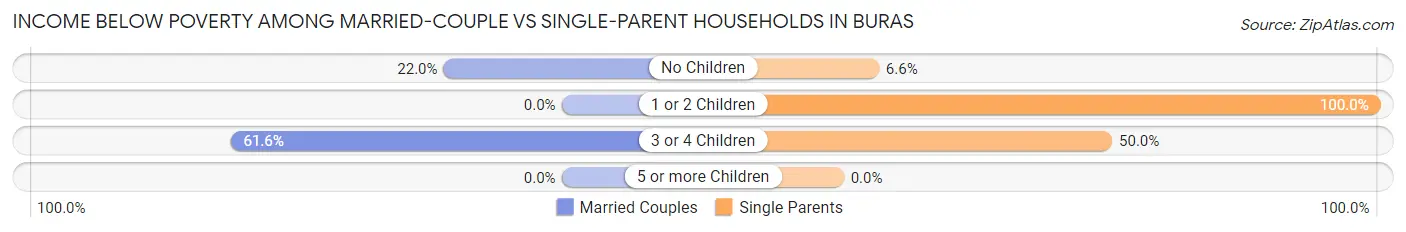
| Children | Married-Couple Families | Single-Parent Households |
| No Children | 11 (22.0%) | 4 (6.6%) |
| 1 or 2 Children | 0 (0.0%) | 17 (100.0%) |
| 3 or 4 Children | 45 (61.6%) | 8 (50.0%) |
| 5 or more Children | 0 (0.0%) | 0 (0.0%) |
| Total | 56 (36.6%) | 29 (30.8%) |
Race in Buras
The most populous races in Buras are Asian (424 | 46.0%), White / Caucasian (416 | 45.2%), and Two or more Races (81 | 8.8%).
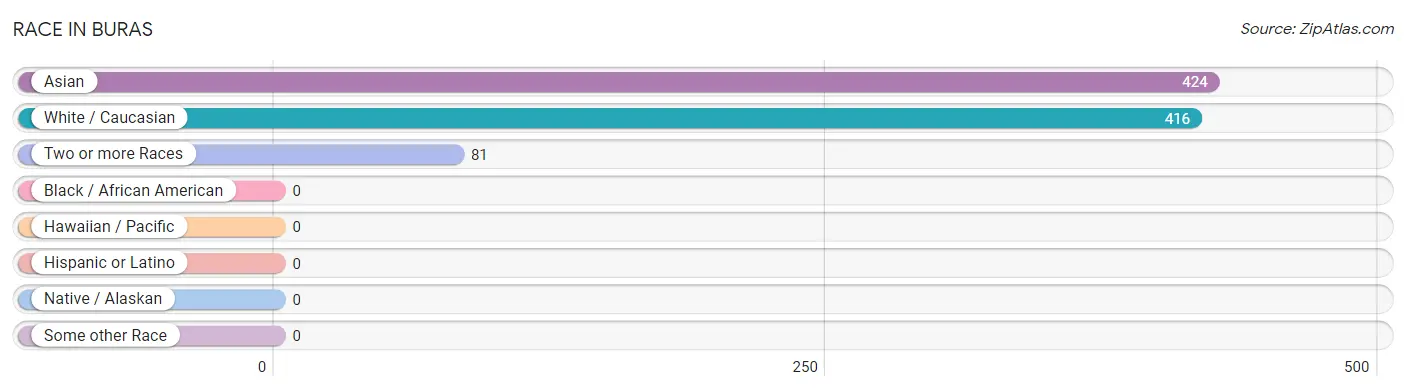
| Race | # Population | % Population |
| Asian | 424 | 46.0% |
| Black / African American | 0 | 0.0% |
| Hawaiian / Pacific | 0 | 0.0% |
| Hispanic or Latino | 0 | 0.0% |
| Native / Alaskan | 0 | 0.0% |
| White / Caucasian | 416 | 45.2% |
| Two or more Races | 81 | 8.8% |
| Some other Race | 0 | 0.0% |
| Total | 921 | 100.0% |
Ancestry in Buras
The most populous ancestries reported in Buras are Sri Lankan (219 | 23.8%), Japanese (214 | 23.2%), French (147 | 16.0%), American (121 | 13.1%), and German (114 | 12.4%), together accounting for 88.5% of all Buras residents.
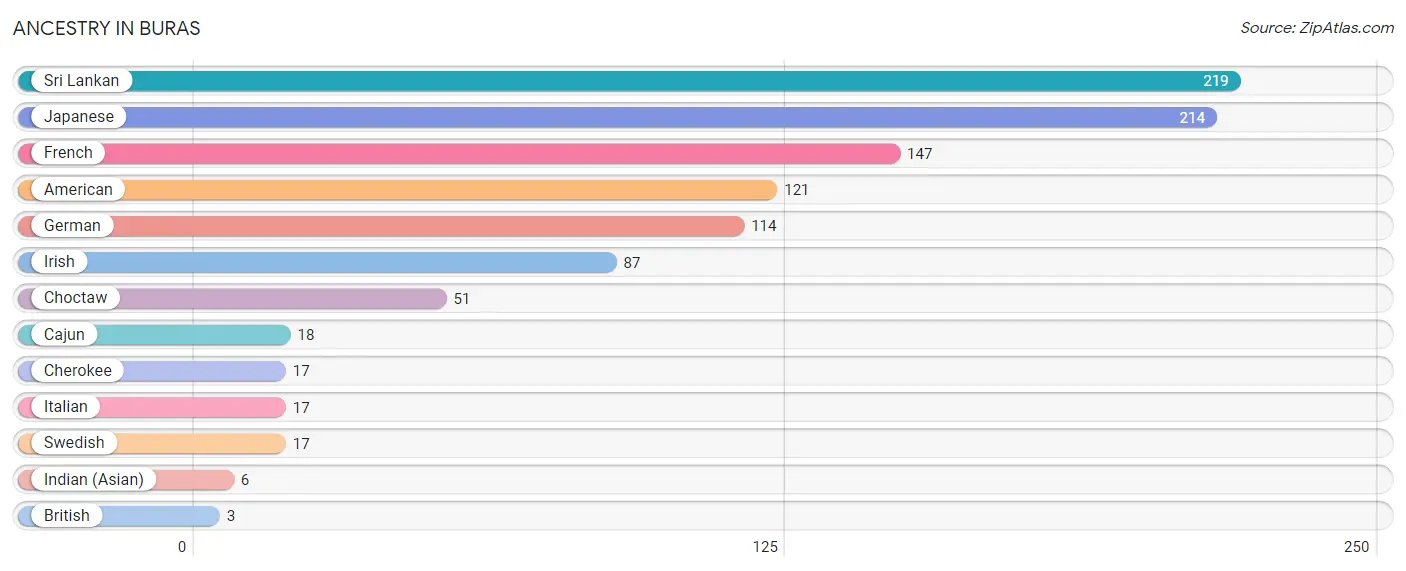
| Ancestry | # Population | % Population |
| American | 121 | 13.1% |
| British | 3 | 0.3% |
| Cajun | 18 | 1.9% |
| Cherokee | 17 | 1.8% |
| Choctaw | 51 | 5.5% |
| French | 147 | 16.0% |
| German | 114 | 12.4% |
| Indian (Asian) | 6 | 0.6% |
| Irish | 87 | 9.5% |
| Italian | 17 | 1.8% |
| Japanese | 214 | 23.2% |
| Sri Lankan | 219 | 23.8% |
| Swedish | 17 | 1.8% | View All 13 Rows |
Immigrants in Buras
The most numerous immigrant groups reported in Buras came from Asia (303 | 32.9%), South Eastern Asia (303 | 32.9%), Vietnam (153 | 16.6%), Cambodia (93 | 10.1%), and Thailand (57 | 6.2%), together accounting for 98.7% of all Buras residents.
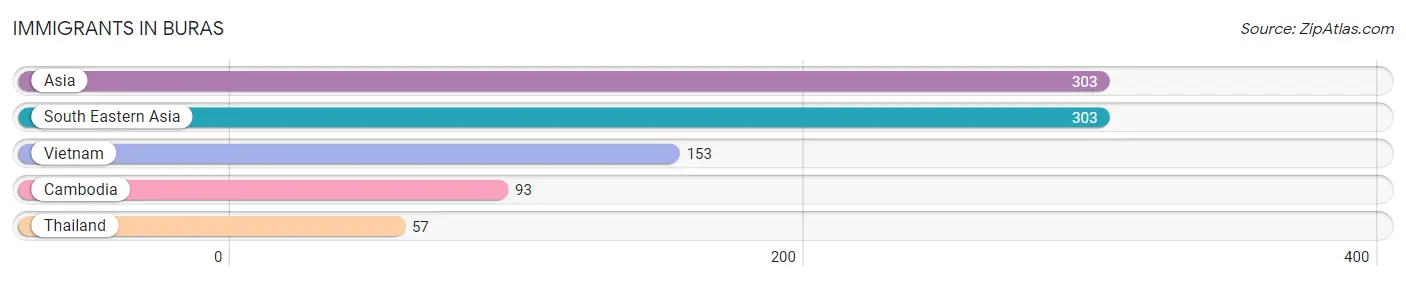
| Immigration Origin | # Population | % Population |
| Asia | 303 | 32.9% |
| Cambodia | 93 | 10.1% |
| South Eastern Asia | 303 | 32.9% |
| Thailand | 57 | 6.2% |
| Vietnam | 153 | 16.6% | View All 5 Rows |
Sex and Age in Buras
Sex and Age in Buras
The most populous age groups in Buras are 45 to 49 Years (66 | 15.5%) for men and 55 to 59 Years (80 | 16.2%) for women.
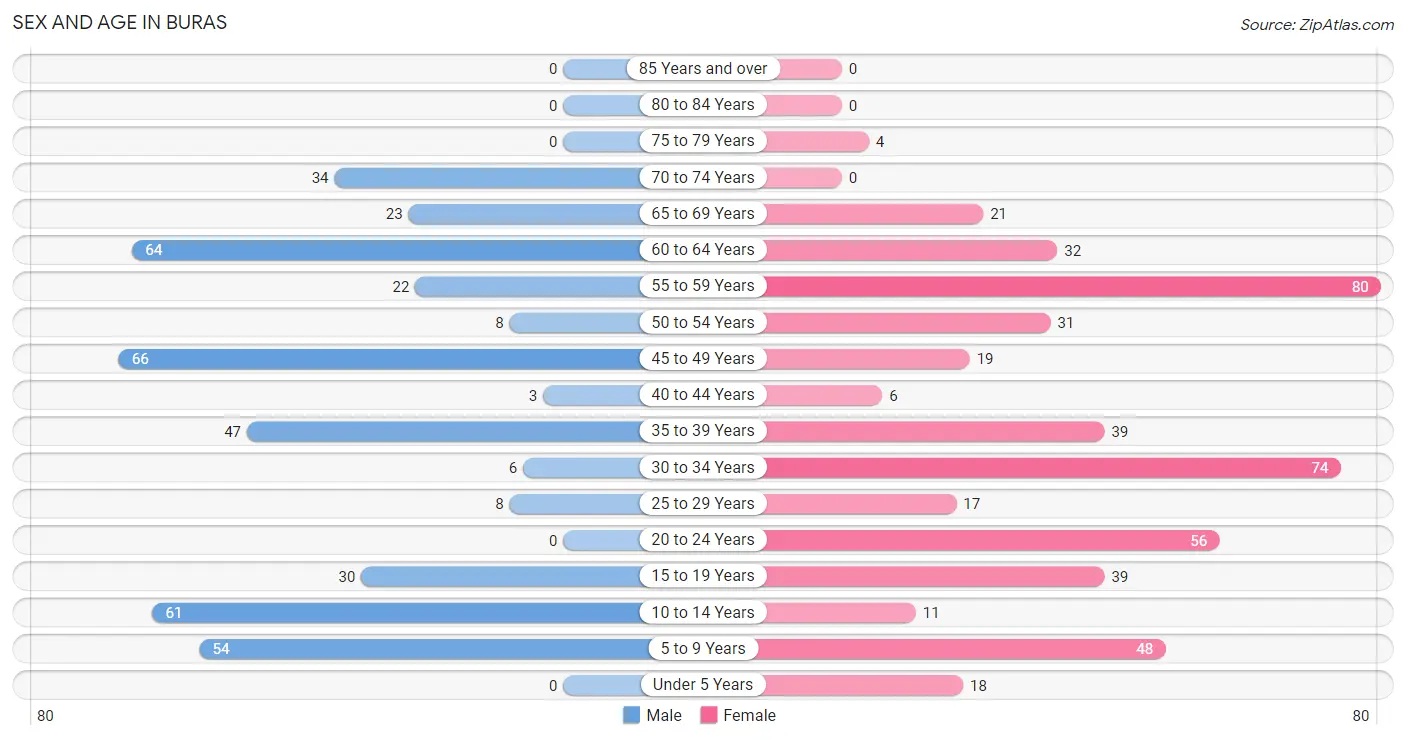
| Age Bracket | Male | Female |
| Under 5 Years | 0 (0.0%) | 18 (3.6%) |
| 5 to 9 Years | 54 (12.7%) | 48 (9.7%) |
| 10 to 14 Years | 61 (14.3%) | 11 (2.2%) |
| 15 to 19 Years | 30 (7.0%) | 39 (7.9%) |
| 20 to 24 Years | 0 (0.0%) | 56 (11.3%) |
| 25 to 29 Years | 8 (1.9%) | 17 (3.4%) |
| 30 to 34 Years | 6 (1.4%) | 74 (14.9%) |
| 35 to 39 Years | 47 (11.0%) | 39 (7.9%) |
| 40 to 44 Years | 3 (0.7%) | 6 (1.2%) |
| 45 to 49 Years | 66 (15.5%) | 19 (3.8%) |
| 50 to 54 Years | 8 (1.9%) | 31 (6.3%) |
| 55 to 59 Years | 22 (5.2%) | 80 (16.2%) |
| 60 to 64 Years | 64 (15.0%) | 32 (6.5%) |
| 65 to 69 Years | 23 (5.4%) | 21 (4.2%) |
| 70 to 74 Years | 34 (8.0%) | 0 (0.0%) |
| 75 to 79 Years | 0 (0.0%) | 4 (0.8%) |
| 80 to 84 Years | 0 (0.0%) | 0 (0.0%) |
| 85 Years and over | 0 (0.0%) | 0 (0.0%) |
| Total | 426 (100.0%) | 495 (100.0%) |
Families and Households in Buras
Median Family Size in Buras
The median family size in Buras is 3.21 persons per family, with single male/father families (6 | 2.4%) accounting for the largest median family size of 7.17 persons per family. On the other hand, single female/mother families (88 | 35.6%) represent the smallest median family size with 2.73 persons per family.
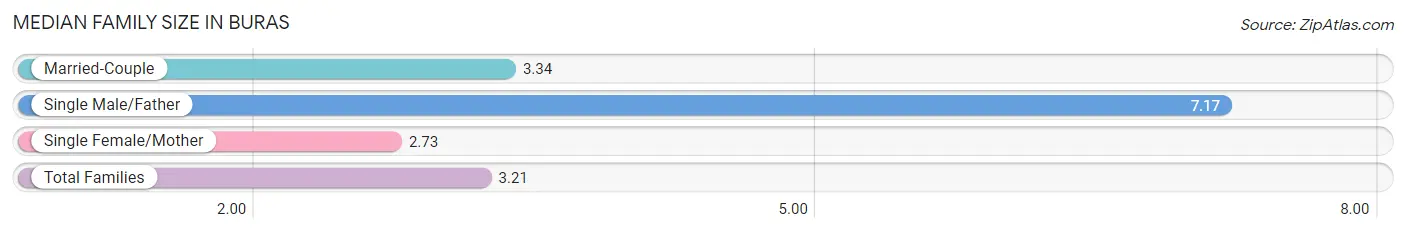
| Family Type | # Families | Family Size |
| Married-Couple | 153 (61.9%) | 3.34 |
| Single Male/Father | 6 (2.4%) | 7.17 |
| Single Female/Mother | 88 (35.6%) | 2.73 |
| Total Families | 247 (100.0%) | 3.21 |
Median Household Size in Buras
The median household size in Buras is 2.72 persons per household, with single male/father households (6 | 1.8%) accounting for the largest median household size of 7.17 persons per household. non-family households (92 | 27.1%) represent the smallest median household size with 1.38 persons per household.
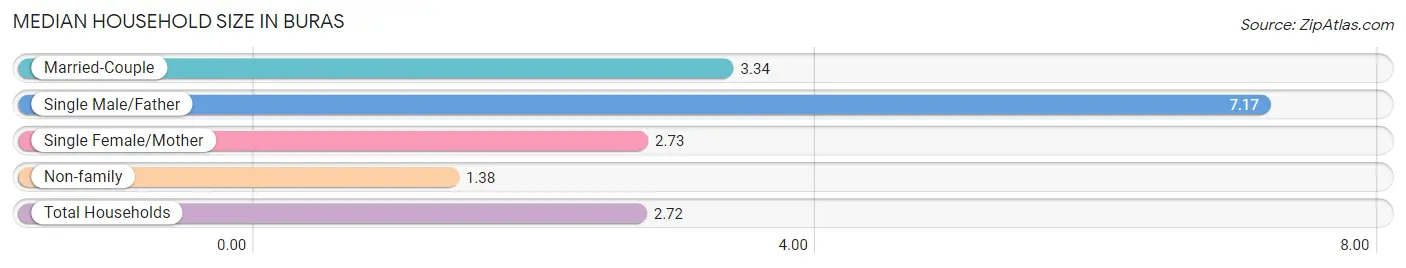
| Household Type | # Households | Household Size |
| Married-Couple | 153 (45.1%) | 3.34 |
| Single Male/Father | 6 (1.8%) | 7.17 |
| Single Female/Mother | 88 (26.0%) | 2.73 |
| Non-family | 92 (27.1%) | 1.38 |
| Total Households | 339 (100.0%) | 2.72 |
Household Size by Marriage Status in Buras
Out of a total of 339 households in Buras, 247 (72.9%) are family households, while 92 (27.1%) are nonfamily households. The most numerous type of family households are 2-person households, comprising 85, and the most common type of nonfamily households are 1-person households, comprising 61.
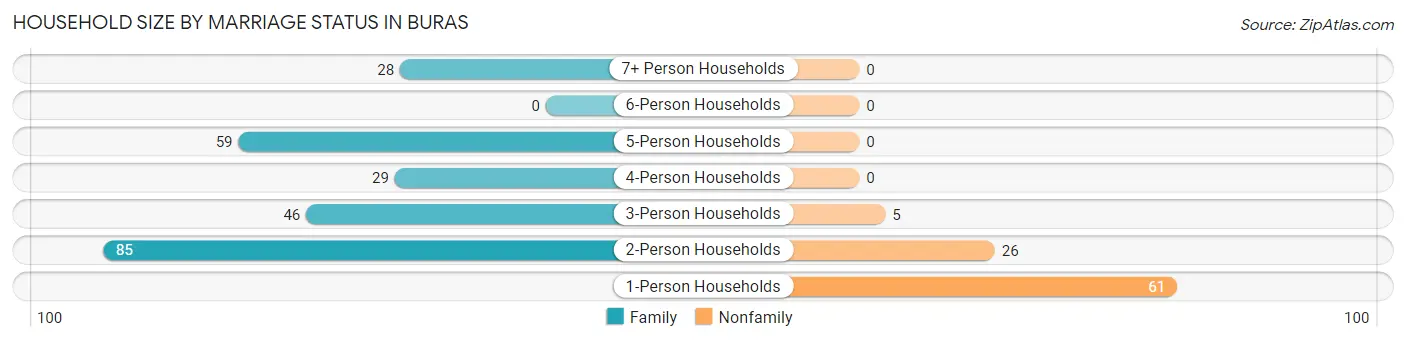
| Household Size | Family Households | Nonfamily Households |
| 1-Person Households | - | 61 (18.0%) |
| 2-Person Households | 85 (25.1%) | 26 (7.7%) |
| 3-Person Households | 46 (13.6%) | 5 (1.5%) |
| 4-Person Households | 29 (8.6%) | 0 (0.0%) |
| 5-Person Households | 59 (17.4%) | 0 (0.0%) |
| 6-Person Households | 0 (0.0%) | 0 (0.0%) |
| 7+ Person Households | 28 (8.3%) | 0 (0.0%) |
| Total | 247 (72.9%) | 92 (27.1%) |
Female Fertility in Buras
Fertility by Age in Buras
| Age Bracket | Women with Births | Births / 1,000 Women |
| 15 to 19 years | 0 (0.0%) | 0.0 |
| 20 to 34 years | 0 (0.0%) | 0.0 |
| 35 to 50 years | 0 (0.0%) | 0.0 |
| Total | 0 (0.0%) | 0.0 |
Fertility by Age by Marriage Status in Buras
| Age Bracket | Married | Unmarried |
| 15 to 19 years | 0 (0.0%) | 0 (0.0%) |
| 20 to 34 years | 0 (0.0%) | 0 (0.0%) |
| 35 to 50 years | 0 (0.0%) | 0 (0.0%) |
| Total | 0 (0.0%) | 0 (0.0%) |
Fertility by Education in Buras
| Educational Attainment | Women with Births | Births / 1,000 Women |
| Less than High School | 0 (0.0%) | 0.0 |
| High School Diploma | 0 (0.0%) | 0.0 |
| College or Associate's Degree | 0 (0.0%) | 0.0 |
| Bachelor's Degree | 0 (0.0%) | 0.0 |
| Graduate Degree | 0 (0.0%) | 0.0 |
| Total | 0 (0.0%) | 0.0 |
Fertility by Education by Marriage Status in Buras
| Educational Attainment | Married | Unmarried |
| Less than High School | 0 (0.0%) | 0 (0.0%) |
| High School Diploma | 0 (0.0%) | 0 (0.0%) |
| College or Associate's Degree | 0 (0.0%) | 0 (0.0%) |
| Bachelor's Degree | 0 (0.0%) | 0 (0.0%) |
| Graduate Degree | 0 (0.0%) | 0 (0.0%) |
| Total | 0 (0.0%) | 0 (0.0%) |
Employment Characteristics in Buras
Employment by Class of Employer in Buras
Among the 333 employed individuals in Buras, private company employees (227 | 68.2%), self-employed (incorporated) (47 | 14.1%), and self-employed (not incorporated) (43 | 12.9%) make up the most common classes of employment.
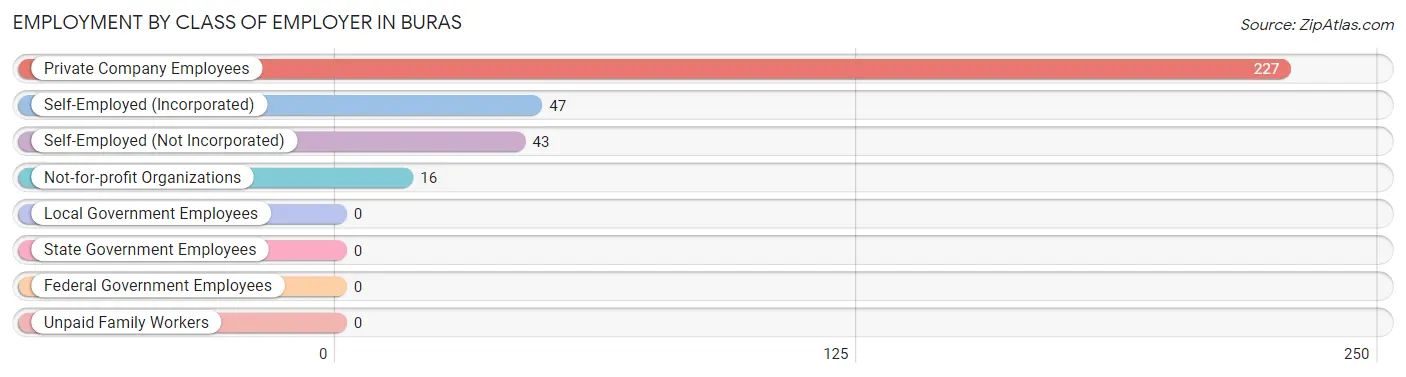
| Employer Class | # Employees | % Employees |
| Private Company Employees | 227 | 68.2% |
| Self-Employed (Incorporated) | 47 | 14.1% |
| Self-Employed (Not Incorporated) | 43 | 12.9% |
| Not-for-profit Organizations | 16 | 4.8% |
| Local Government Employees | 0 | 0.0% |
| State Government Employees | 0 | 0.0% |
| Federal Government Employees | 0 | 0.0% |
| Unpaid Family Workers | 0 | 0.0% |
| Total | 333 | 100.0% |
Employment Status by Age in Buras
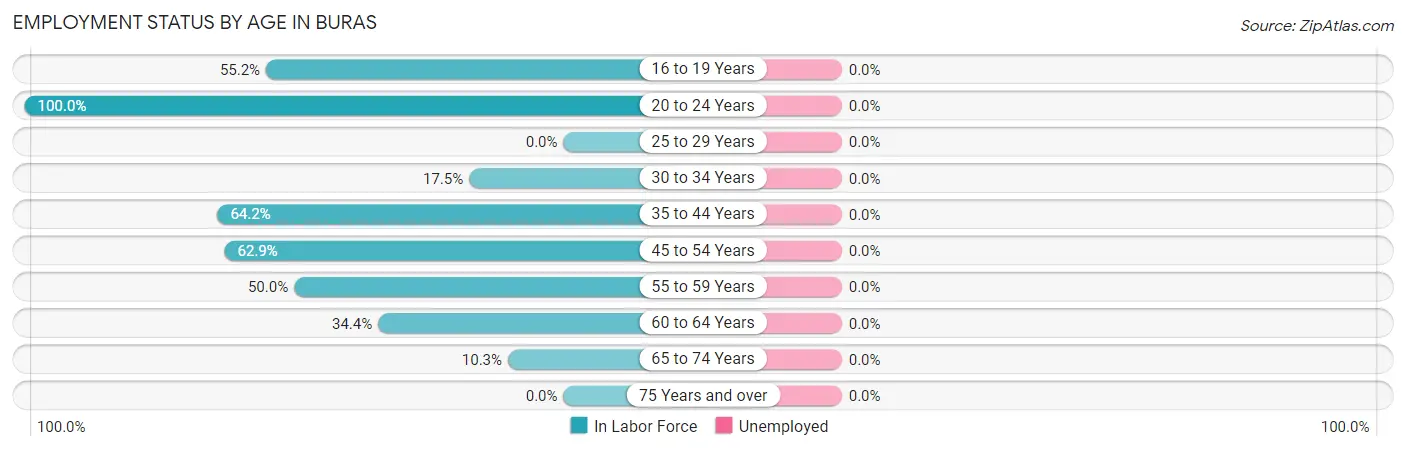
| Age Bracket | In Labor Force | Unemployed |
| 16 to 19 Years | 32 (55.2%) | 0 (0.0%) |
| 20 to 24 Years | 56 (100.0%) | 0 (0.0%) |
| 25 to 29 Years | 0 (0.0%) | 0 (0.0%) |
| 30 to 34 Years | 14 (17.5%) | 0 (0.0%) |
| 35 to 44 Years | 61 (64.2%) | 0 (0.0%) |
| 45 to 54 Years | 78 (62.9%) | 0 (0.0%) |
| 55 to 59 Years | 51 (50.0%) | 0 (0.0%) |
| 60 to 64 Years | 33 (34.4%) | 0 (0.0%) |
| 65 to 74 Years | 8 (10.3%) | 0 (0.0%) |
| 75 Years and over | 0 (0.0%) | 0 (0.0%) |
| Total | 333 (46.4%) | 0 (0.0%) |
Employment Status by Educational Attainment in Buras
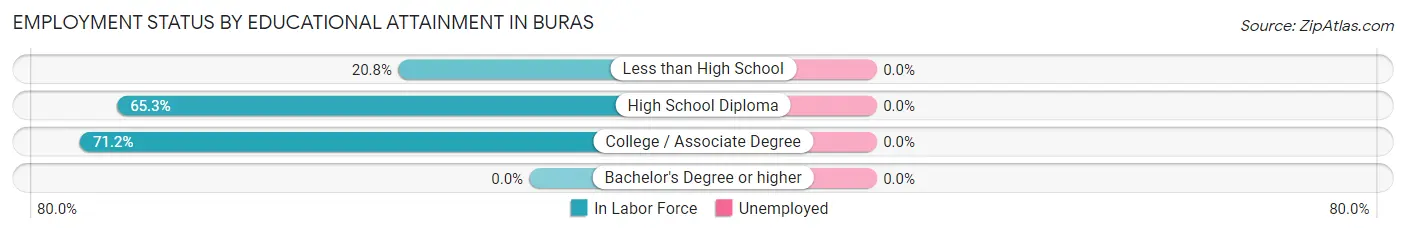
| Educational Attainment | In Labor Force | Unemployed |
| Less than High School | 52 (20.8%) | 0 (0.0%) |
| High School Diploma | 96 (65.3%) | 0 (0.0%) |
| College / Associate Degree | 89 (71.2%) | 0 (0.0%) |
| Bachelor's Degree or higher | 0 (0.0%) | 0 (0.0%) |
| Total | 237 (45.4%) | 0 (0.0%) |
Employment Occupations by Sex in Buras
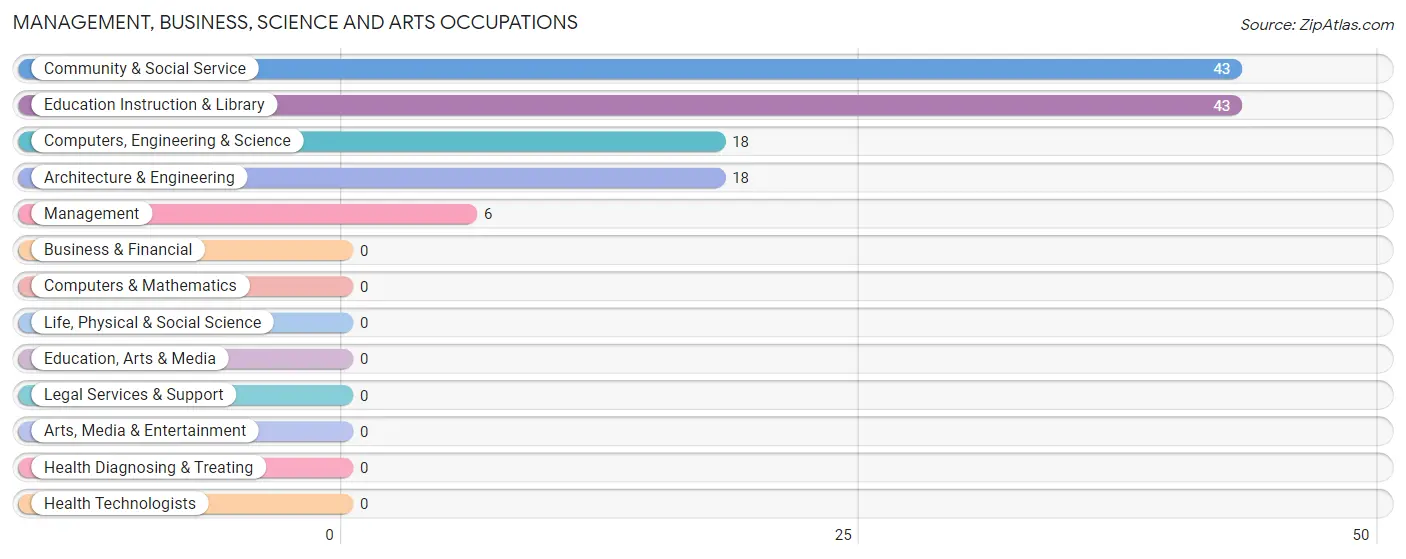
Management, Business, Science and Arts Occupations
The most common Management, Business, Science and Arts occupations in Buras are Community & Social Service (43 | 12.9%), Education Instruction & Library (43 | 12.9%), Computers, Engineering & Science (18 | 5.4%), Architecture & Engineering (18 | 5.4%), and Management (6 | 1.8%).
Management, Business, Science and Arts Occupations by Sex
Within the Management, Business, Science and Arts occupations in Buras, the most male-oriented occupations are Computers, Engineering & Science (100.0%), Architecture & Engineering (100.0%), and Management (50.0%), while the most female-oriented occupations are Community & Social Service (100.0%), Education Instruction & Library (100.0%), and Management (50.0%).
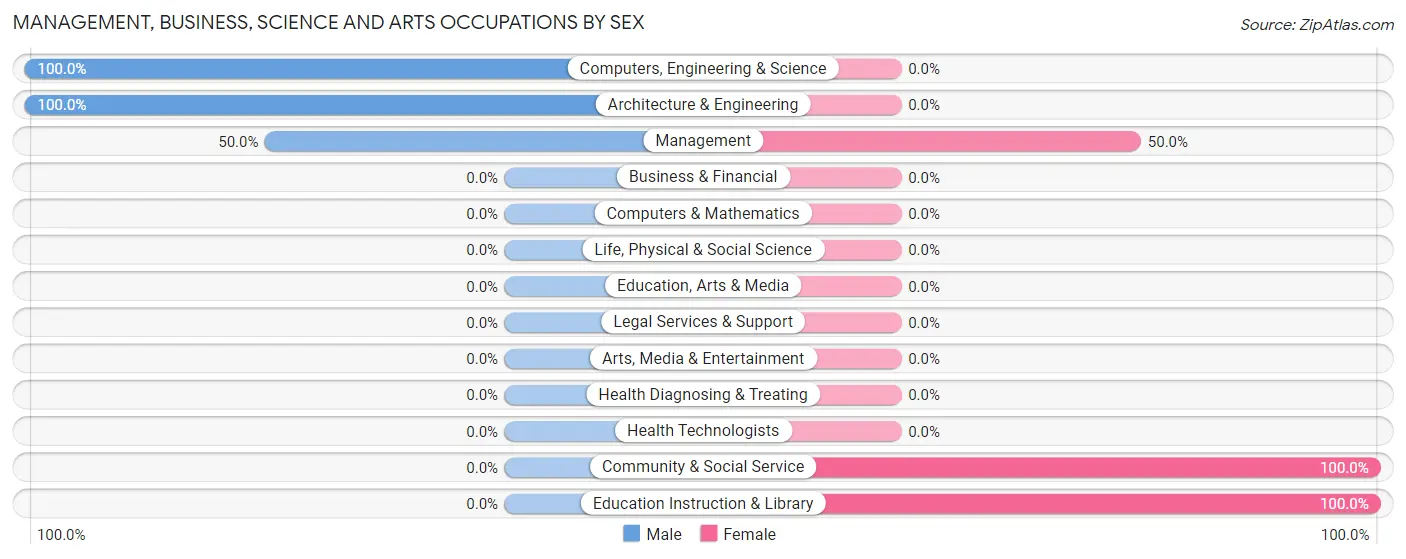
| Occupation | Male | Female |
| Management | 3 (50.0%) | 3 (50.0%) |
| Business & Financial | 0 (0.0%) | 0 (0.0%) |
| Computers, Engineering & Science | 18 (100.0%) | 0 (0.0%) |
| Computers & Mathematics | 0 (0.0%) | 0 (0.0%) |
| Architecture & Engineering | 18 (100.0%) | 0 (0.0%) |
| Life, Physical & Social Science | 0 (0.0%) | 0 (0.0%) |
| Community & Social Service | 0 (0.0%) | 43 (100.0%) |
| Education, Arts & Media | 0 (0.0%) | 0 (0.0%) |
| Legal Services & Support | 0 (0.0%) | 0 (0.0%) |
| Education Instruction & Library | 0 (0.0%) | 43 (100.0%) |
| Arts, Media & Entertainment | 0 (0.0%) | 0 (0.0%) |
| Health Diagnosing & Treating | 0 (0.0%) | 0 (0.0%) |
| Health Technologists | 0 (0.0%) | 0 (0.0%) |
| Total (Category) | 21 (31.3%) | 46 (68.7%) |
| Total (Overall) | 148 (44.4%) | 185 (55.6%) |
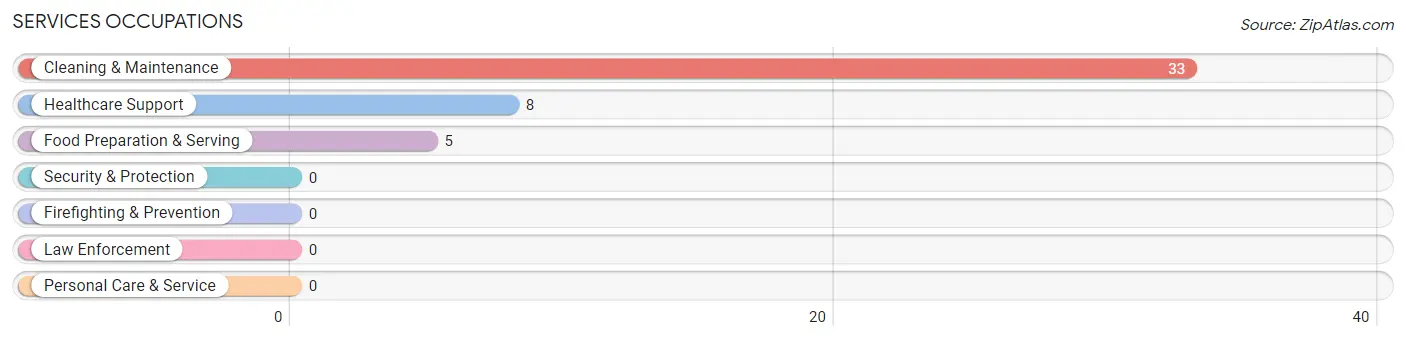
Services Occupations
The most common Services occupations in Buras are Cleaning & Maintenance (33 | 9.9%), Healthcare Support (8 | 2.4%), and Food Preparation & Serving (5 | 1.5%).
Services Occupations by Sex
Within the Services occupations in Buras, the most male-oriented occupations are Food Preparation & Serving (100.0%), and Cleaning & Maintenance (75.8%), while the most female-oriented occupations are Healthcare Support (100.0%), and Cleaning & Maintenance (24.2%).
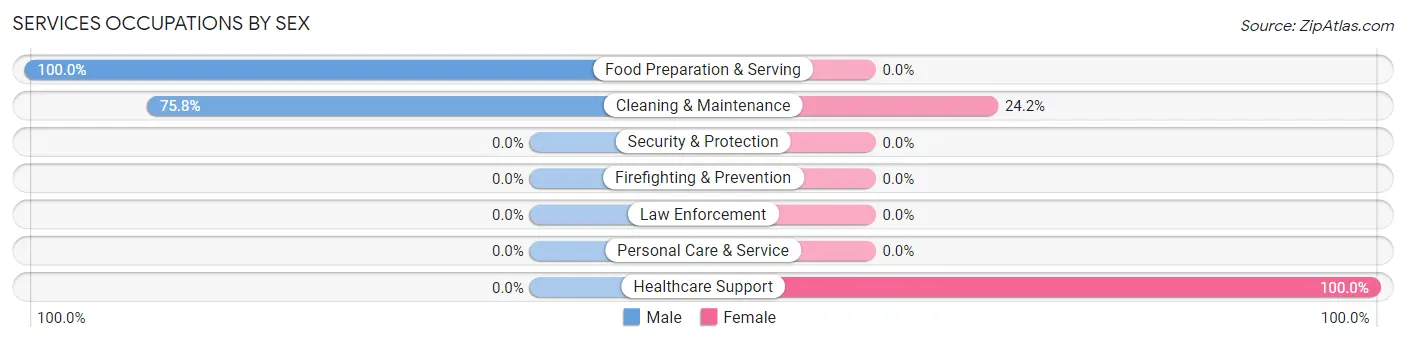
| Occupation | Male | Female |
| Healthcare Support | 0 (0.0%) | 8 (100.0%) |
| Security & Protection | 0 (0.0%) | 0 (0.0%) |
| Firefighting & Prevention | 0 (0.0%) | 0 (0.0%) |
| Law Enforcement | 0 (0.0%) | 0 (0.0%) |
| Food Preparation & Serving | 5 (100.0%) | 0 (0.0%) |
| Cleaning & Maintenance | 25 (75.8%) | 8 (24.2%) |
| Personal Care & Service | 0 (0.0%) | 0 (0.0%) |
| Total (Category) | 30 (65.2%) | 16 (34.8%) |
| Total (Overall) | 148 (44.4%) | 185 (55.6%) |
Sales and Office Occupations
The most common Sales and Office occupations in Buras are Office & Administration (80 | 24.0%), and Sales & Related (40 | 12.0%).
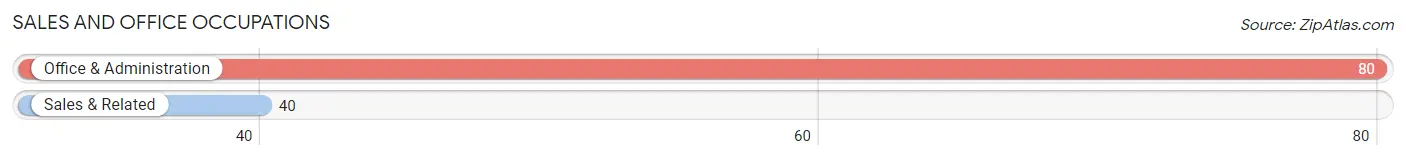
Sales and Office Occupations by Sex
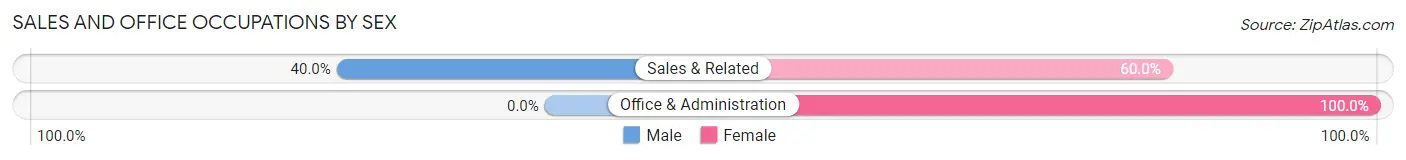
| Occupation | Male | Female |
| Sales & Related | 16 (40.0%) | 24 (60.0%) |
| Office & Administration | 0 (0.0%) | 80 (100.0%) |
| Total (Category) | 16 (13.3%) | 104 (86.7%) |
| Total (Overall) | 148 (44.4%) | 185 (55.6%) |
Natural Resources, Construction and Maintenance Occupations
The most common Natural Resources, Construction and Maintenance occupations in Buras are Farming, Fishing & Forestry (48 | 14.4%), and Installation, Maintenance & Repair (6 | 1.8%).
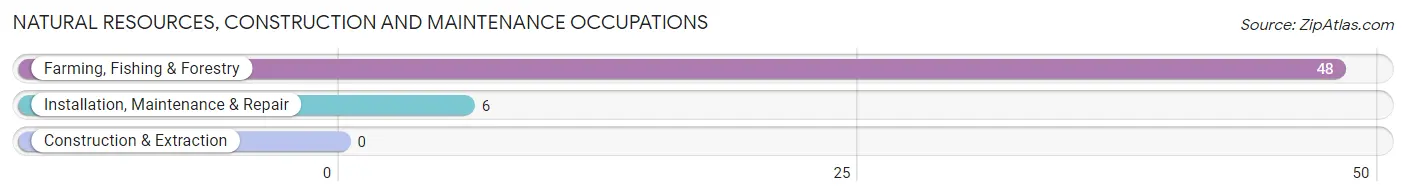
Natural Resources, Construction and Maintenance Occupations by Sex
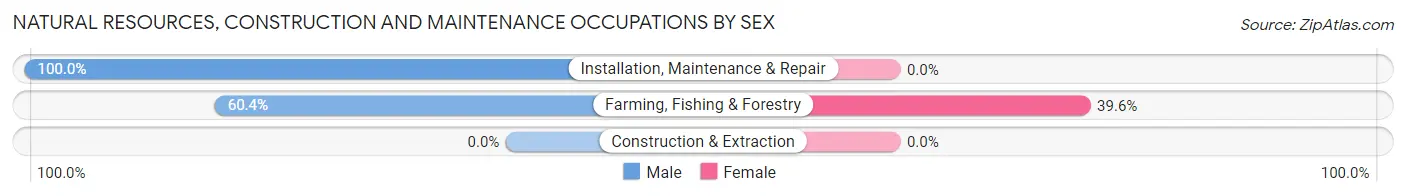
| Occupation | Male | Female |
| Farming, Fishing & Forestry | 29 (60.4%) | 19 (39.6%) |
| Construction & Extraction | 0 (0.0%) | 0 (0.0%) |
| Installation, Maintenance & Repair | 6 (100.0%) | 0 (0.0%) |
| Total (Category) | 35 (64.8%) | 19 (35.2%) |
| Total (Overall) | 148 (44.4%) | 185 (55.6%) |
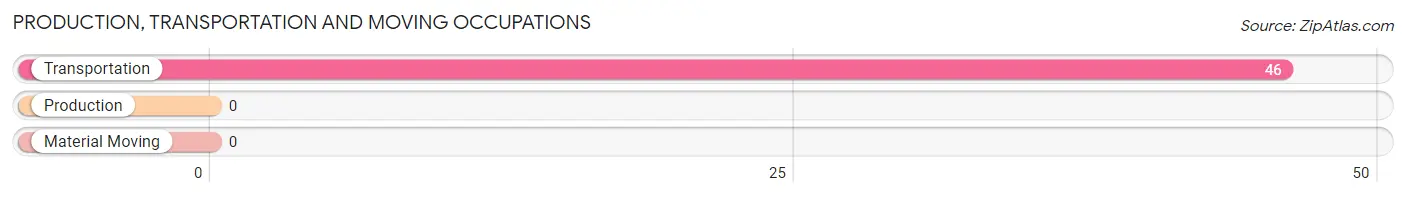
Production, Transportation and Moving Occupations
The most common Production, Transportation and Moving occupations in Buras are , and Transportation (46 | 13.8%).
Production, Transportation and Moving Occupations by Sex
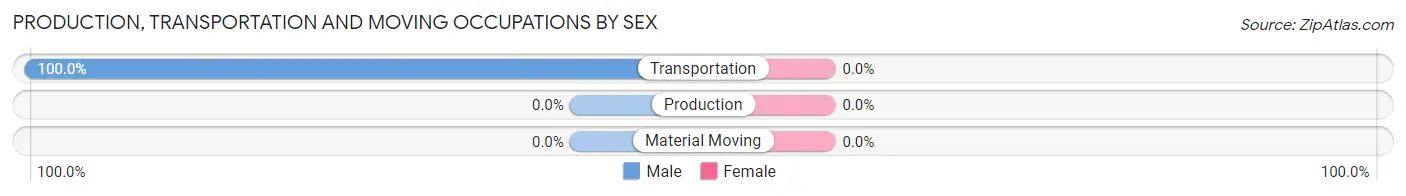
| Occupation | Male | Female |
| Production | 0 (0.0%) | 0 (0.0%) |
| Transportation | 46 (100.0%) | 0 (0.0%) |
| Material Moving | 0 (0.0%) | 0 (0.0%) |
| Total (Category) | 46 (100.0%) | 0 (0.0%) |
| Total (Overall) | 148 (44.4%) | 185 (55.6%) |
Employment Industries by Sex in Buras
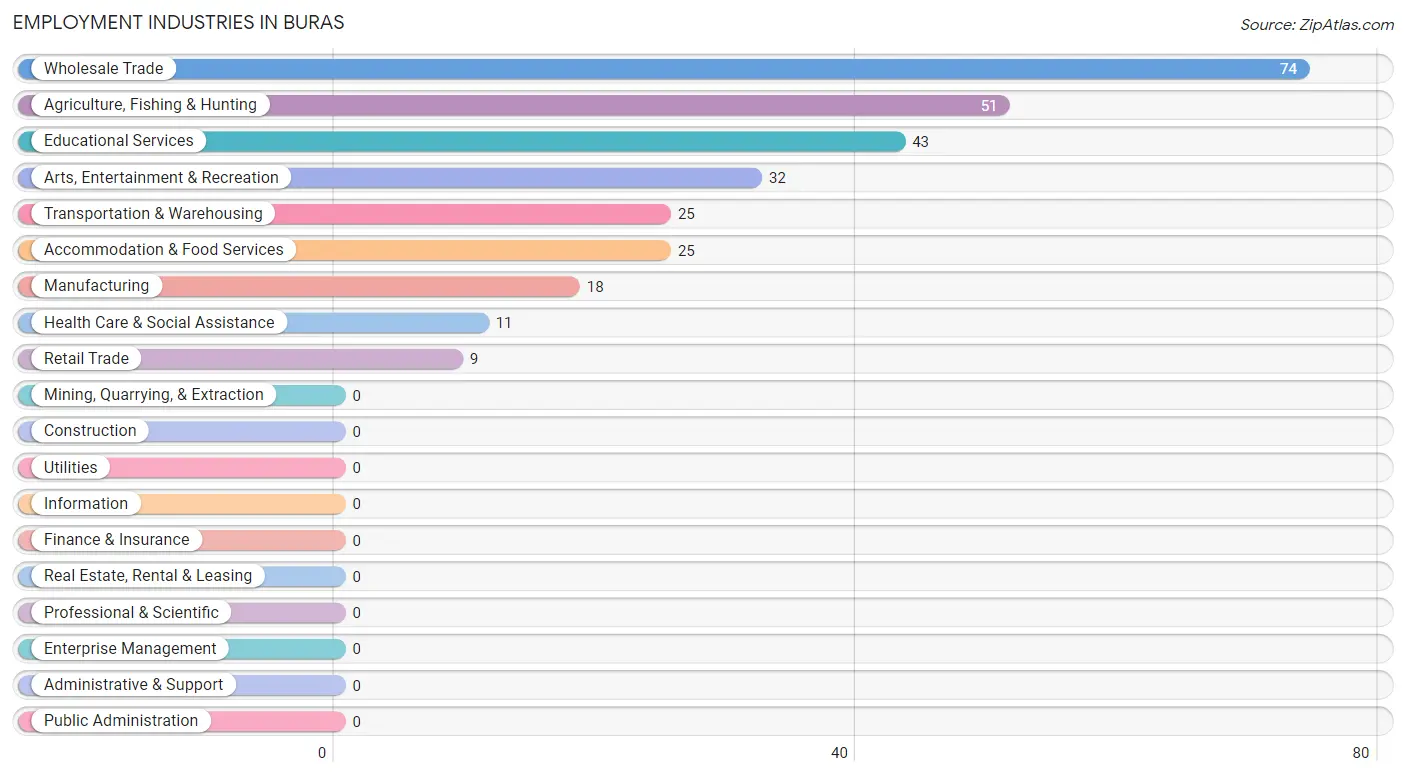
Employment Industries in Buras
The major employment industries in Buras include Wholesale Trade (74 | 22.2%), Agriculture, Fishing & Hunting (51 | 15.3%), Educational Services (43 | 12.9%), Arts, Entertainment & Recreation (32 | 9.6%), and Transportation & Warehousing (25 | 7.5%).
Employment Industries by Sex in Buras
The Buras industries that see more men than women are Manufacturing (100.0%), Transportation & Warehousing (100.0%), and Arts, Entertainment & Recreation (100.0%), whereas the industries that tend to have a higher number of women are Wholesale Trade (100.0%), Retail Trade (100.0%), and Educational Services (100.0%).
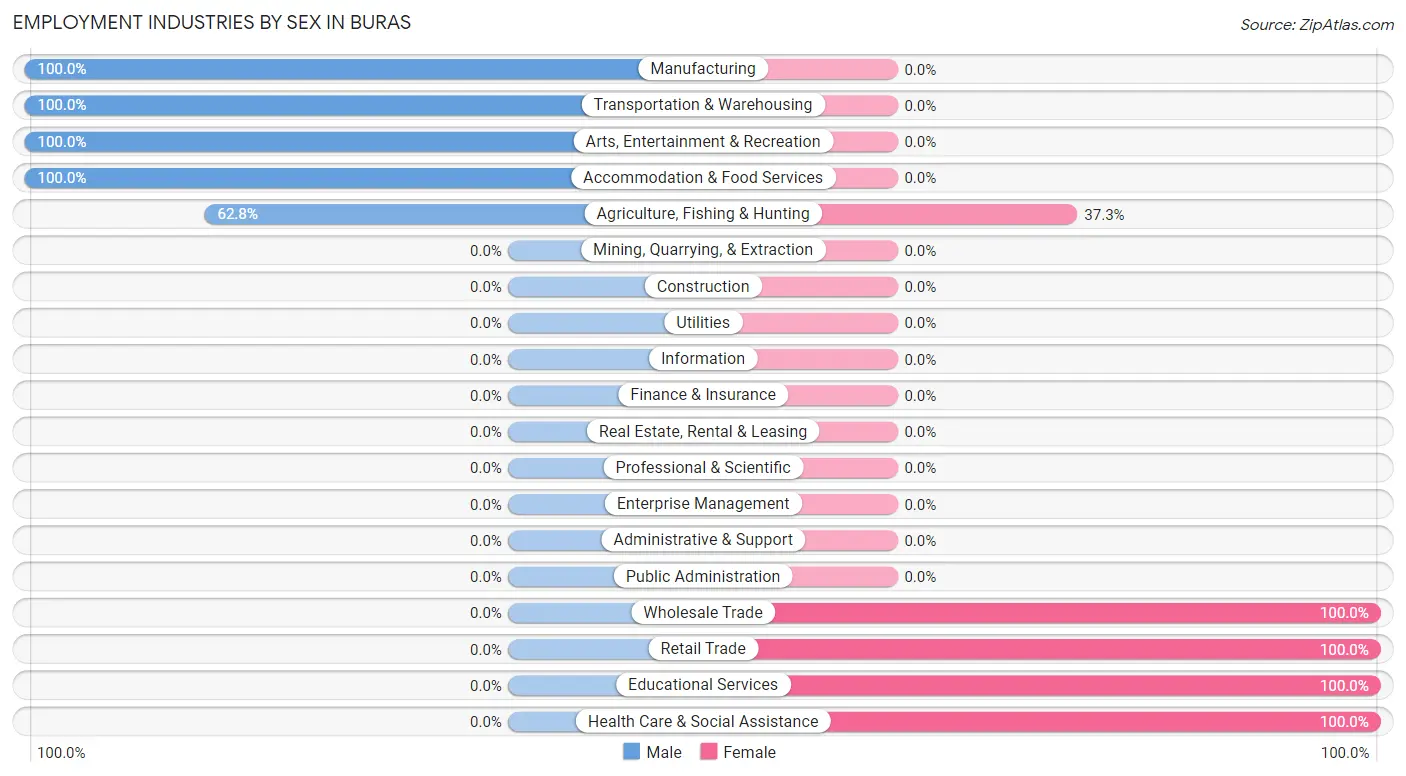
| Industry | Male | Female |
| Agriculture, Fishing & Hunting | 32 (62.7%) | 19 (37.2%) |
| Mining, Quarrying, & Extraction | 0 (0.0%) | 0 (0.0%) |
| Construction | 0 (0.0%) | 0 (0.0%) |
| Manufacturing | 18 (100.0%) | 0 (0.0%) |
| Wholesale Trade | 0 (0.0%) | 74 (100.0%) |
| Retail Trade | 0 (0.0%) | 9 (100.0%) |
| Transportation & Warehousing | 25 (100.0%) | 0 (0.0%) |
| Utilities | 0 (0.0%) | 0 (0.0%) |
| Information | 0 (0.0%) | 0 (0.0%) |
| Finance & Insurance | 0 (0.0%) | 0 (0.0%) |
| Real Estate, Rental & Leasing | 0 (0.0%) | 0 (0.0%) |
| Professional & Scientific | 0 (0.0%) | 0 (0.0%) |
| Enterprise Management | 0 (0.0%) | 0 (0.0%) |
| Administrative & Support | 0 (0.0%) | 0 (0.0%) |
| Educational Services | 0 (0.0%) | 43 (100.0%) |
| Health Care & Social Assistance | 0 (0.0%) | 11 (100.0%) |
| Arts, Entertainment & Recreation | 32 (100.0%) | 0 (0.0%) |
| Accommodation & Food Services | 25 (100.0%) | 0 (0.0%) |
| Public Administration | 0 (0.0%) | 0 (0.0%) |
| Total | 148 (44.4%) | 185 (55.6%) |
Education in Buras
School Enrollment in Buras
The most common levels of schooling among the 262 students in Buras are elementary school (81 | 30.9%), middle school (48 | 18.3%), and high school (44 | 16.8%).
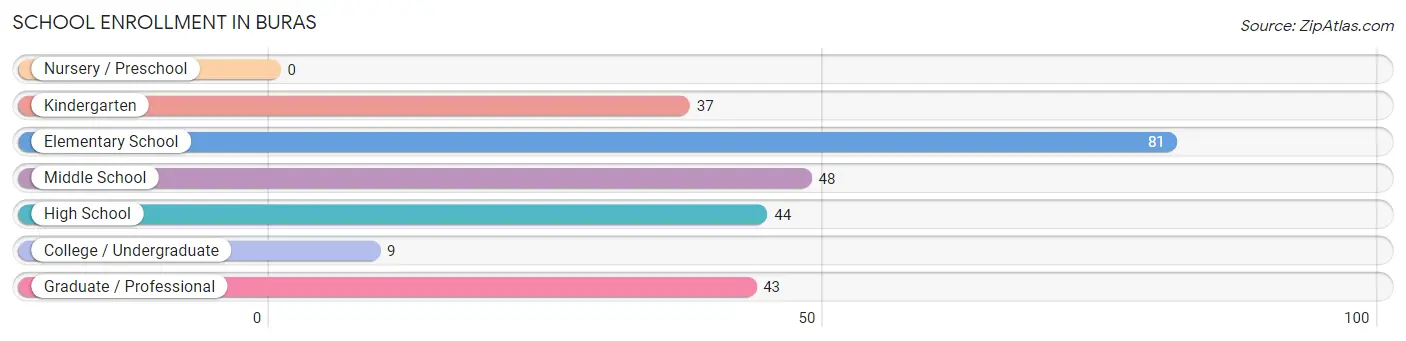
| School Level | # Students | % Students |
| Nursery / Preschool | 0 | 0.0% |
| Kindergarten | 37 | 14.1% |
| Elementary School | 81 | 30.9% |
| Middle School | 48 | 18.3% |
| High School | 44 | 16.8% |
| College / Undergraduate | 9 | 3.4% |
| Graduate / Professional | 43 | 16.4% |
| Total | 262 | 100.0% |
School Enrollment by Age by Funding Source in Buras
Out of a total of 262 students who are enrolled in schools in Buras, 43 (16.4%) attend a private institution, while the remaining 219 (83.6%) are enrolled in public schools. The age group of 20 to 24 year olds has the highest likelihood of being enrolled in private schools, with 43 (100.0% in the age bracket) enrolled. Conversely, the age group of 5 to 9 year old has the lowest likelihood of being enrolled in a private school, with 88 (100.0% in the age bracket) attending a public institution.
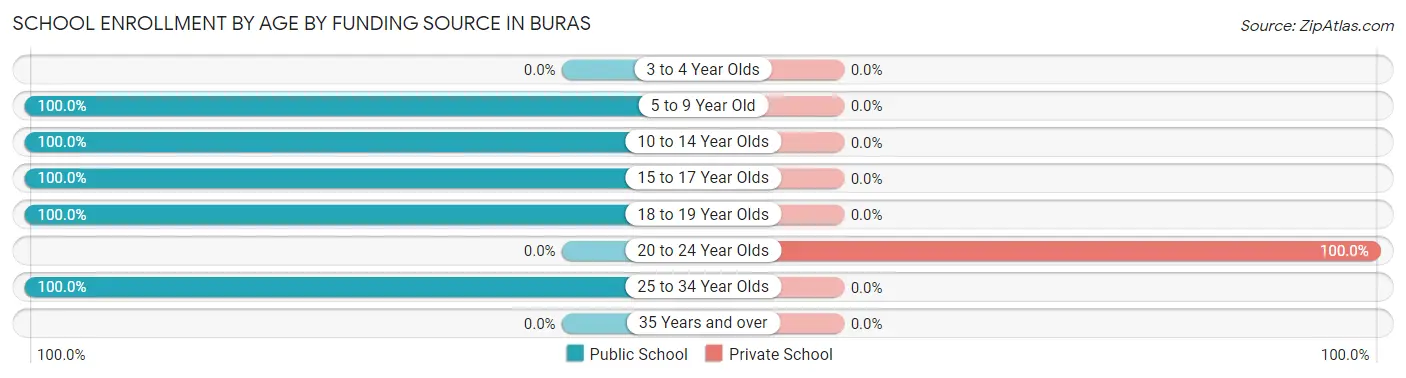
| Age Bracket | Public School | Private School |
| 3 to 4 Year Olds | 0 (0.0%) | 0 (0.0%) |
| 5 to 9 Year Old | 88 (100.0%) | 0 (0.0%) |
| 10 to 14 Year Olds | 72 (100.0%) | 0 (0.0%) |
| 15 to 17 Year Olds | 42 (100.0%) | 0 (0.0%) |
| 18 to 19 Year Olds | 9 (100.0%) | 0 (0.0%) |
| 20 to 24 Year Olds | 0 (0.0%) | 43 (100.0%) |
| 25 to 34 Year Olds | 8 (100.0%) | 0 (0.0%) |
| 35 Years and over | 0 (0.0%) | 0 (0.0%) |
| Total | 219 (83.6%) | 43 (16.4%) |
Educational Attainment by Field of Study in Buras
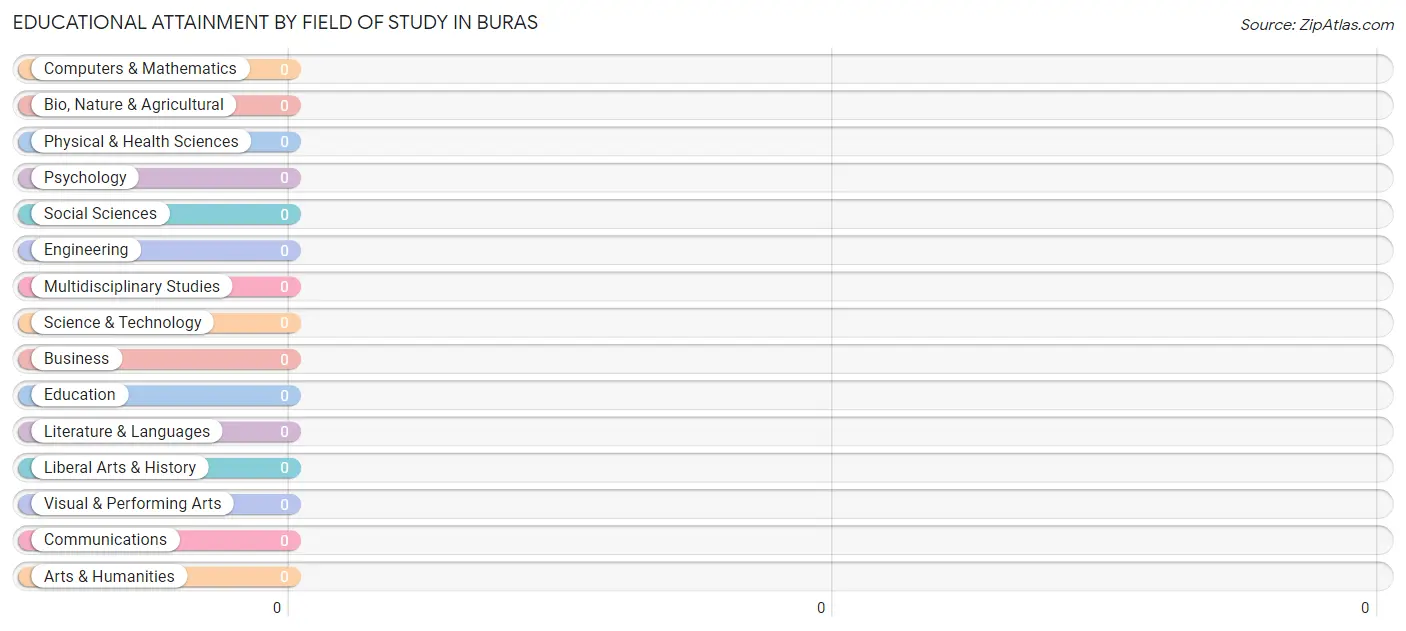
| Field of Study | # Graduates | % Graduates |
| Computers & Mathematics | 0 | 0.0% |
| Bio, Nature & Agricultural | 0 | 0.0% |
| Physical & Health Sciences | 0 | 0.0% |
| Psychology | 0 | 0.0% |
| Social Sciences | 0 | 0.0% |
| Engineering | 0 | 0.0% |
| Multidisciplinary Studies | 0 | 0.0% |
| Science & Technology | 0 | 0.0% |
| Business | 0 | 0.0% |
| Education | 0 | 0.0% |
| Literature & Languages | 0 | 0.0% |
| Liberal Arts & History | 0 | 0.0% |
| Visual & Performing Arts | 0 | 0.0% |
| Communications | 0 | 0.0% |
| Arts & Humanities | 0 | 0.0% |
| Total | 0 | 0.0% |
Transportation & Commute in Buras
Vehicle Availability by Sex in Buras
The most prevalent vehicle ownership categories in Buras are males with 2 vehicles (70, accounting for 47.3%) and females with 2 vehicles (143, making up 37.8%).
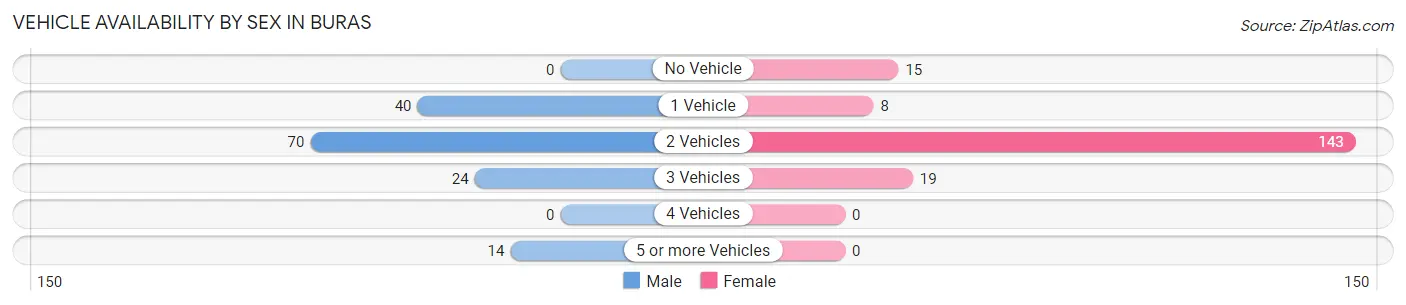
| Vehicles Available | Male | Female |
| No Vehicle | 0 (0.0%) | 15 (8.1%) |
| 1 Vehicle | 40 (27.0%) | 8 (4.3%) |
| 2 Vehicles | 70 (47.3%) | 143 (77.3%) |
| 3 Vehicles | 24 (16.2%) | 19 (10.3%) |
| 4 Vehicles | 0 (0.0%) | 0 (0.0%) |
| 5 or more Vehicles | 14 (9.5%) | 0 (0.0%) |
| Total | 148 (100.0%) | 185 (100.0%) |
Commute Time in Buras
The most frequently occuring commute durations in Buras are 90 or more minutes (102 commuters, 30.6%), 10 to 14 minutes (70 commuters, 21.0%), and 30 to 34 minutes (43 commuters, 12.9%).
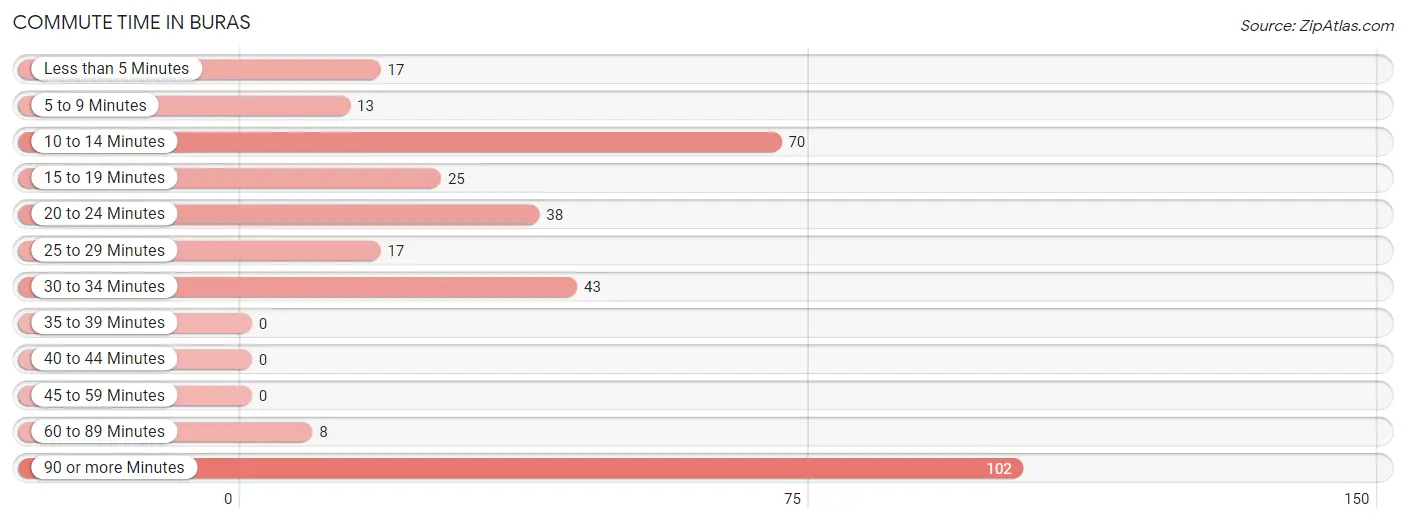
| Commute Time | # Commuters | % Commuters |
| Less than 5 Minutes | 17 | 5.1% |
| 5 to 9 Minutes | 13 | 3.9% |
| 10 to 14 Minutes | 70 | 21.0% |
| 15 to 19 Minutes | 25 | 7.5% |
| 20 to 24 Minutes | 38 | 11.4% |
| 25 to 29 Minutes | 17 | 5.1% |
| 30 to 34 Minutes | 43 | 12.9% |
| 35 to 39 Minutes | 0 | 0.0% |
| 40 to 44 Minutes | 0 | 0.0% |
| 45 to 59 Minutes | 0 | 0.0% |
| 60 to 89 Minutes | 8 | 2.4% |
| 90 or more Minutes | 102 | 30.6% |
Commute Time by Sex in Buras
The most common commute times in Buras are 20 to 24 minutes (38 commuters, 25.7%) for males and 90 or more minutes (94 commuters, 50.8%) for females.
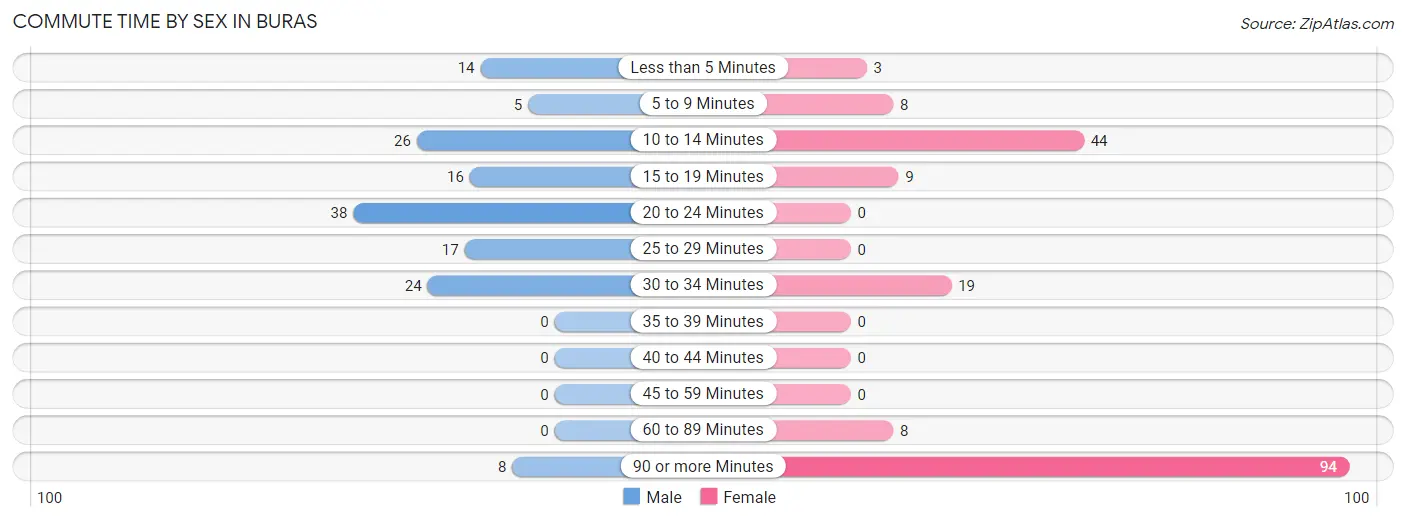
| Commute Time | Male | Female |
| Less than 5 Minutes | 14 (9.5%) | 3 (1.6%) |
| 5 to 9 Minutes | 5 (3.4%) | 8 (4.3%) |
| 10 to 14 Minutes | 26 (17.6%) | 44 (23.8%) |
| 15 to 19 Minutes | 16 (10.8%) | 9 (4.9%) |
| 20 to 24 Minutes | 38 (25.7%) | 0 (0.0%) |
| 25 to 29 Minutes | 17 (11.5%) | 0 (0.0%) |
| 30 to 34 Minutes | 24 (16.2%) | 19 (10.3%) |
| 35 to 39 Minutes | 0 (0.0%) | 0 (0.0%) |
| 40 to 44 Minutes | 0 (0.0%) | 0 (0.0%) |
| 45 to 59 Minutes | 0 (0.0%) | 0 (0.0%) |
| 60 to 89 Minutes | 0 (0.0%) | 8 (4.3%) |
| 90 or more Minutes | 8 (5.4%) | 94 (50.8%) |
Time of Departure to Work by Sex in Buras
The most frequent times of departure to work in Buras are 12:00 AM to 4:59 AM (69, 46.6%) for males and 4:00 PM to 11:59 PM (94, 50.8%) for females.
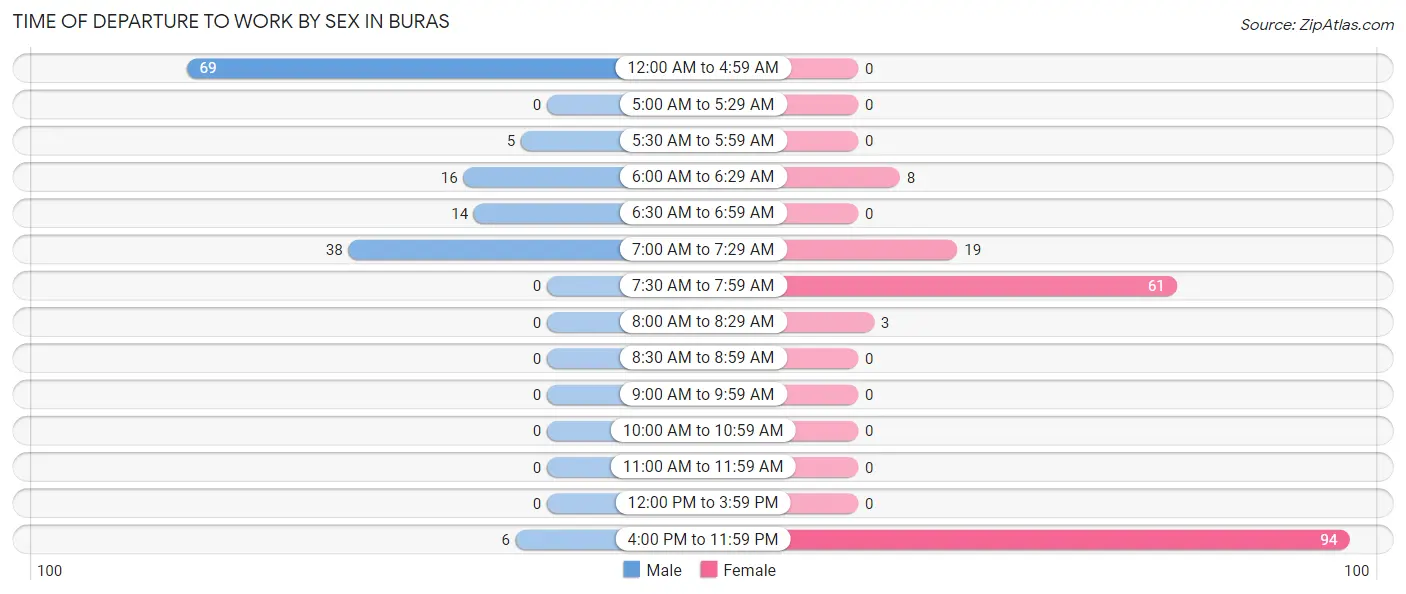
| Time of Departure | Male | Female |
| 12:00 AM to 4:59 AM | 69 (46.6%) | 0 (0.0%) |
| 5:00 AM to 5:29 AM | 0 (0.0%) | 0 (0.0%) |
| 5:30 AM to 5:59 AM | 5 (3.4%) | 0 (0.0%) |
| 6:00 AM to 6:29 AM | 16 (10.8%) | 8 (4.3%) |
| 6:30 AM to 6:59 AM | 14 (9.5%) | 0 (0.0%) |
| 7:00 AM to 7:29 AM | 38 (25.7%) | 19 (10.3%) |
| 7:30 AM to 7:59 AM | 0 (0.0%) | 61 (33.0%) |
| 8:00 AM to 8:29 AM | 0 (0.0%) | 3 (1.6%) |
| 8:30 AM to 8:59 AM | 0 (0.0%) | 0 (0.0%) |
| 9:00 AM to 9:59 AM | 0 (0.0%) | 0 (0.0%) |
| 10:00 AM to 10:59 AM | 0 (0.0%) | 0 (0.0%) |
| 11:00 AM to 11:59 AM | 0 (0.0%) | 0 (0.0%) |
| 12:00 PM to 3:59 PM | 0 (0.0%) | 0 (0.0%) |
| 4:00 PM to 11:59 PM | 6 (4.1%) | 94 (50.8%) |
| Total | 148 (100.0%) | 185 (100.0%) |
Housing Occupancy in Buras
Occupancy by Ownership in Buras
Of the total 339 dwellings in Buras, owner-occupied units account for 334 (98.5%), while renter-occupied units make up 5 (1.5%).
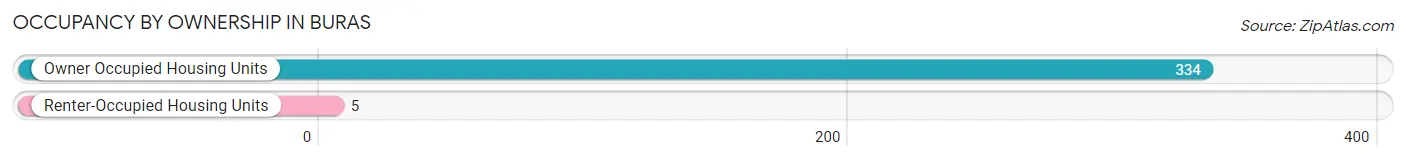
| Occupancy | # Housing Units | % Housing Units |
| Owner Occupied Housing Units | 334 | 98.5% |
| Renter-Occupied Housing Units | 5 | 1.5% |
| Total Occupied Housing Units | 339 | 100.0% |
Occupancy by Household Size in Buras
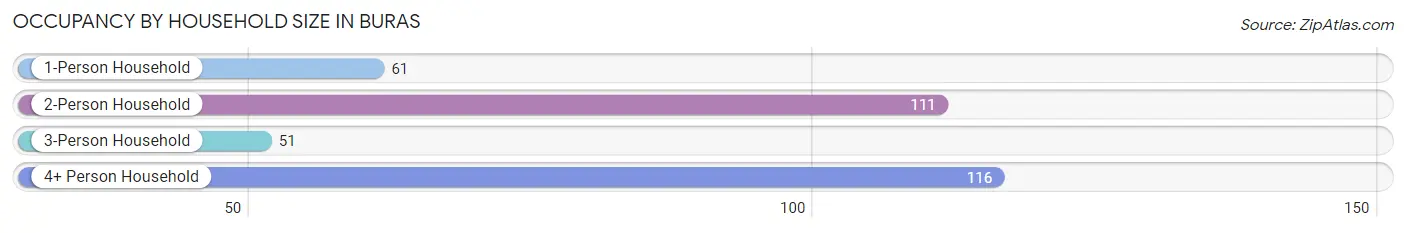
| Household Size | # Housing Units | % Housing Units |
| 1-Person Household | 61 | 18.0% |
| 2-Person Household | 111 | 32.7% |
| 3-Person Household | 51 | 15.0% |
| 4+ Person Household | 116 | 34.2% |
| Total Housing Units | 339 | 100.0% |
Occupancy by Ownership by Household Size in Buras
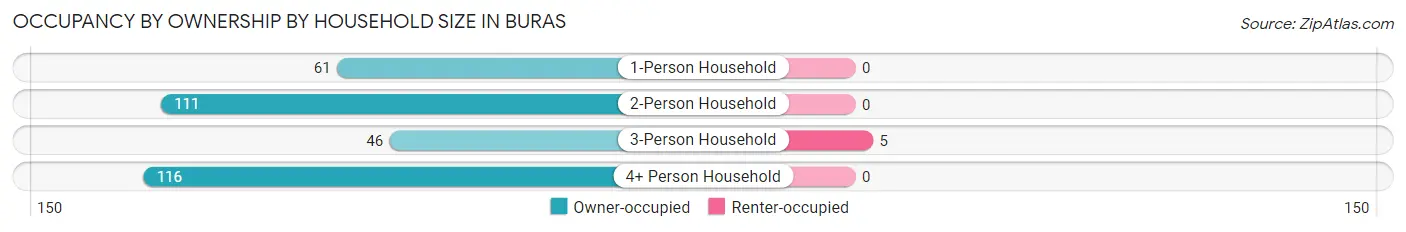
| Household Size | Owner-occupied | Renter-occupied |
| 1-Person Household | 61 (100.0%) | 0 (0.0%) |
| 2-Person Household | 111 (100.0%) | 0 (0.0%) |
| 3-Person Household | 46 (90.2%) | 5 (9.8%) |
| 4+ Person Household | 116 (100.0%) | 0 (0.0%) |
| Total Housing Units | 334 (98.5%) | 5 (1.5%) |
Occupancy by Educational Attainment in Buras
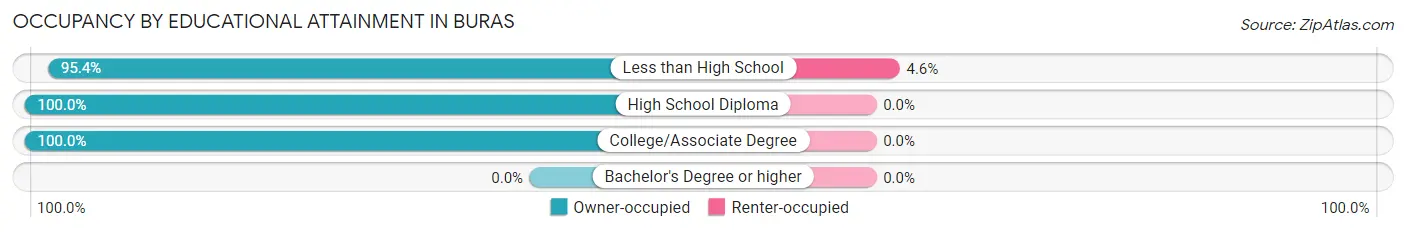
| Household Size | Owner-occupied | Renter-occupied |
| Less than High School | 103 (95.4%) | 5 (4.6%) |
| High School Diploma | 130 (100.0%) | 0 (0.0%) |
| College/Associate Degree | 101 (100.0%) | 0 (0.0%) |
| Bachelor's Degree or higher | 0 (0.0%) | 0 (0.0%) |
Occupancy by Age of Householder in Buras
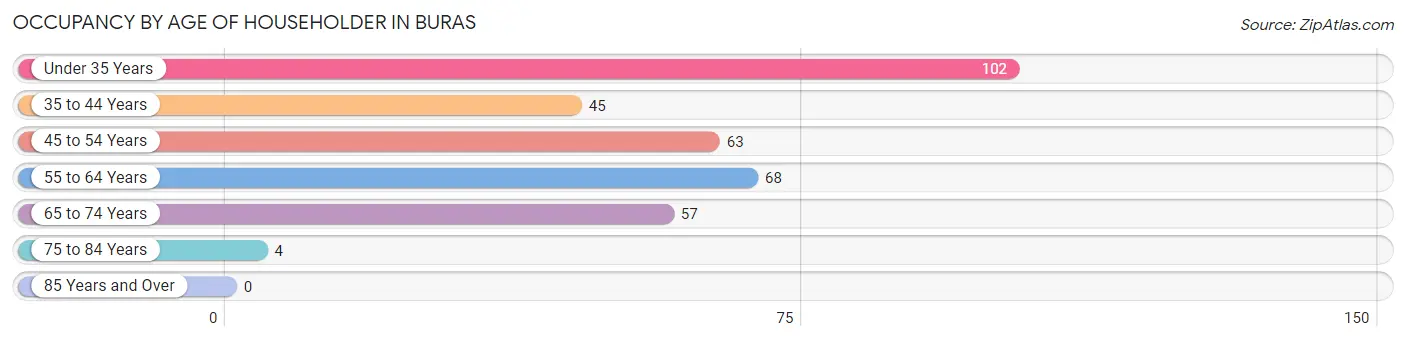
| Age Bracket | # Households | % Households |
| Under 35 Years | 102 | 30.1% |
| 35 to 44 Years | 45 | 13.3% |
| 45 to 54 Years | 63 | 18.6% |
| 55 to 64 Years | 68 | 20.1% |
| 65 to 74 Years | 57 | 16.8% |
| 75 to 84 Years | 4 | 1.2% |
| 85 Years and Over | 0 | 0.0% |
| Total | 339 | 100.0% |
Housing Finances in Buras
Median Income by Occupancy in Buras
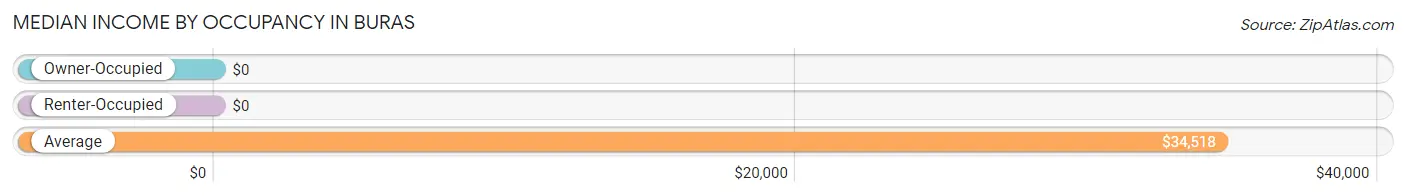
| Occupancy Type | # Households | Median Income |
| Owner-Occupied | 334 (98.5%) | $0 |
| Renter-Occupied | 5 (1.5%) | $0 |
| Average | 339 (100.0%) | $34,518 |
Occupancy by Householder Income Bracket in Buras
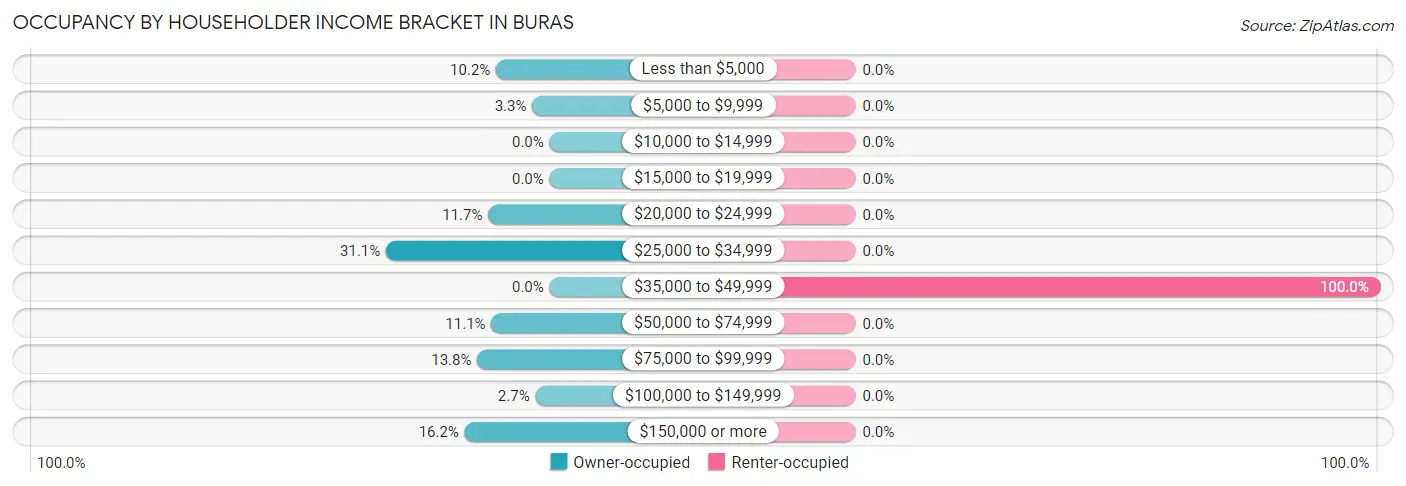
| Income Bracket | Owner-occupied | Renter-occupied |
| Less than $5,000 | 34 (10.2%) | 0 (0.0%) |
| $5,000 to $9,999 | 11 (3.3%) | 0 (0.0%) |
| $10,000 to $14,999 | 0 (0.0%) | 0 (0.0%) |
| $15,000 to $19,999 | 0 (0.0%) | 0 (0.0%) |
| $20,000 to $24,999 | 39 (11.7%) | 0 (0.0%) |
| $25,000 to $34,999 | 104 (31.1%) | 0 (0.0%) |
| $35,000 to $49,999 | 0 (0.0%) | 5 (100.0%) |
| $50,000 to $74,999 | 37 (11.1%) | 0 (0.0%) |
| $75,000 to $99,999 | 46 (13.8%) | 0 (0.0%) |
| $100,000 to $149,999 | 9 (2.7%) | 0 (0.0%) |
| $150,000 or more | 54 (16.2%) | 0 (0.0%) |
| Total | 334 (100.0%) | 5 (100.0%) |
Monthly Housing Cost Tiers in Buras
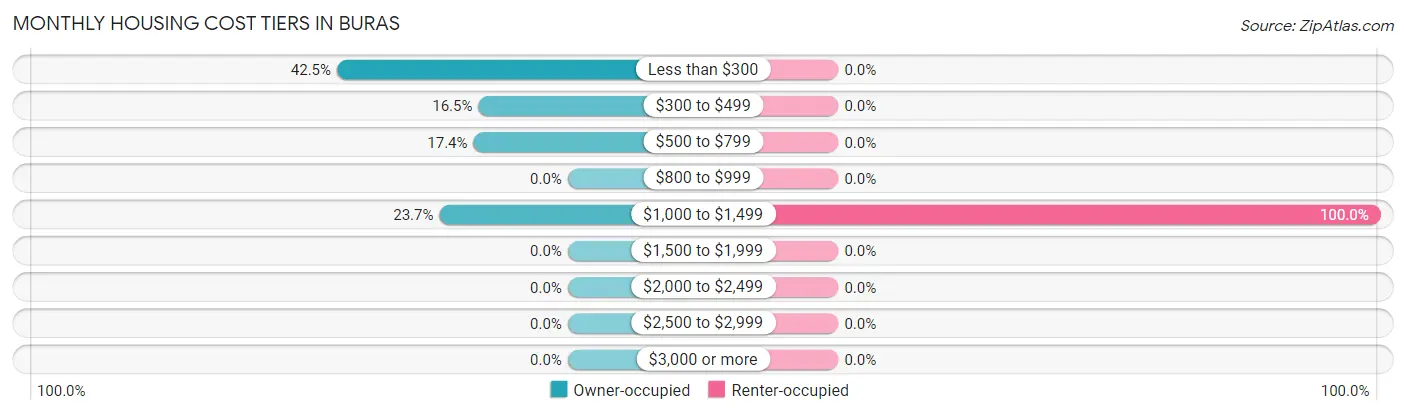
| Monthly Cost | Owner-occupied | Renter-occupied |
| Less than $300 | 142 (42.5%) | 0 (0.0%) |
| $300 to $499 | 55 (16.5%) | 0 (0.0%) |
| $500 to $799 | 58 (17.4%) | 0 (0.0%) |
| $800 to $999 | 0 (0.0%) | 0 (0.0%) |
| $1,000 to $1,499 | 79 (23.6%) | 5 (100.0%) |
| $1,500 to $1,999 | 0 (0.0%) | 0 (0.0%) |
| $2,000 to $2,499 | 0 (0.0%) | 0 (0.0%) |
| $2,500 to $2,999 | 0 (0.0%) | 0 (0.0%) |
| $3,000 or more | 0 (0.0%) | 0 (0.0%) |
| Total | 334 (100.0%) | 5 (100.0%) |
Physical Housing Characteristics in Buras
Housing Structures in Buras
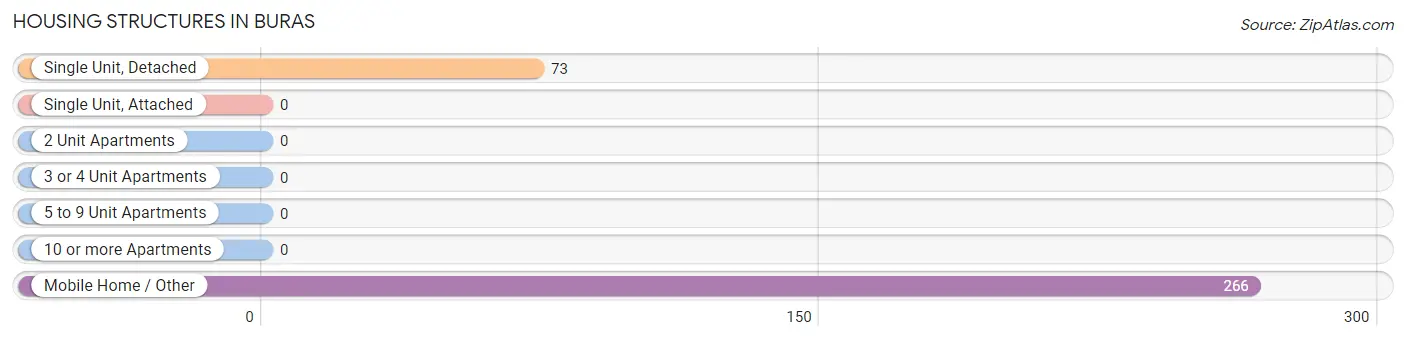
| Structure Type | # Housing Units | % Housing Units |
| Single Unit, Detached | 73 | 21.5% |
| Single Unit, Attached | 0 | 0.0% |
| 2 Unit Apartments | 0 | 0.0% |
| 3 or 4 Unit Apartments | 0 | 0.0% |
| 5 to 9 Unit Apartments | 0 | 0.0% |
| 10 or more Apartments | 0 | 0.0% |
| Mobile Home / Other | 266 | 78.5% |
| Total | 339 | 100.0% |
Housing Structures by Occupancy in Buras
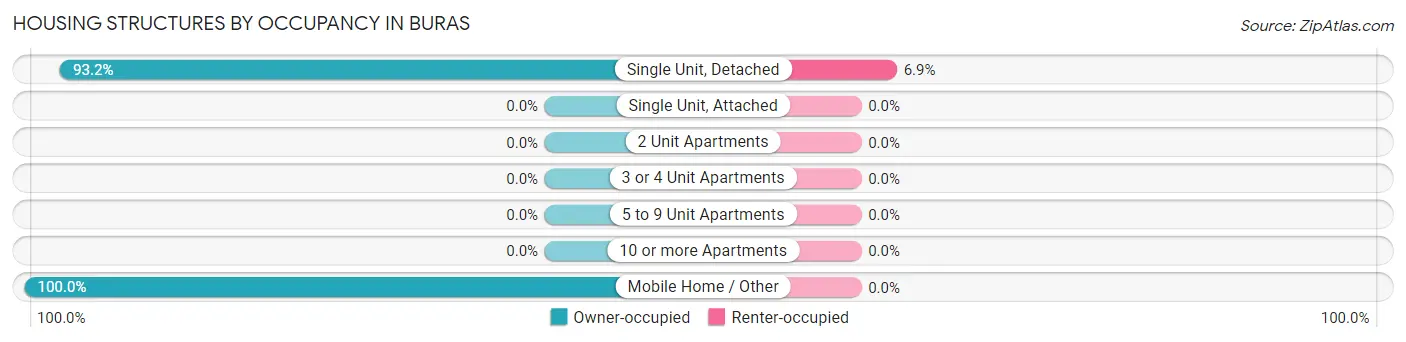
| Structure Type | Owner-occupied | Renter-occupied |
| Single Unit, Detached | 68 (93.1%) | 5 (6.9%) |
| Single Unit, Attached | 0 (0.0%) | 0 (0.0%) |
| 2 Unit Apartments | 0 (0.0%) | 0 (0.0%) |
| 3 or 4 Unit Apartments | 0 (0.0%) | 0 (0.0%) |
| 5 to 9 Unit Apartments | 0 (0.0%) | 0 (0.0%) |
| 10 or more Apartments | 0 (0.0%) | 0 (0.0%) |
| Mobile Home / Other | 266 (100.0%) | 0 (0.0%) |
| Total | 334 (98.5%) | 5 (1.5%) |
Housing Structures by Number of Rooms in Buras
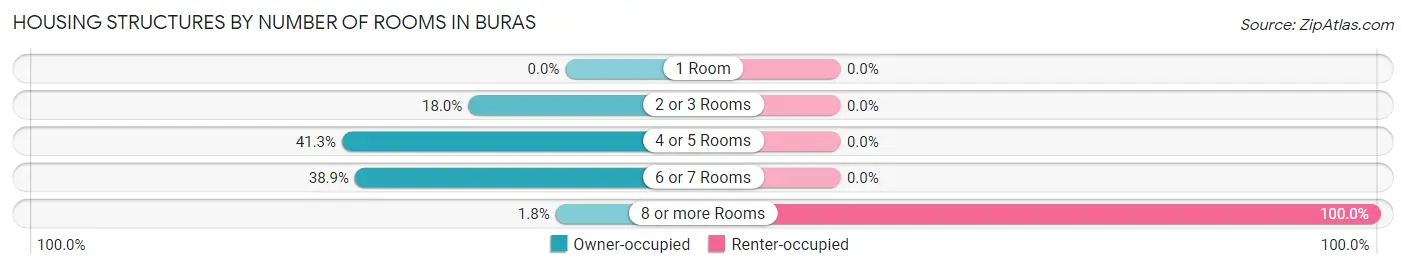
| Number of Rooms | Owner-occupied | Renter-occupied |
| 1 Room | 0 (0.0%) | 0 (0.0%) |
| 2 or 3 Rooms | 60 (18.0%) | 0 (0.0%) |
| 4 or 5 Rooms | 138 (41.3%) | 0 (0.0%) |
| 6 or 7 Rooms | 130 (38.9%) | 0 (0.0%) |
| 8 or more Rooms | 6 (1.8%) | 5 (100.0%) |
| Total | 334 (100.0%) | 5 (100.0%) |
Housing Structure by Heating Type in Buras
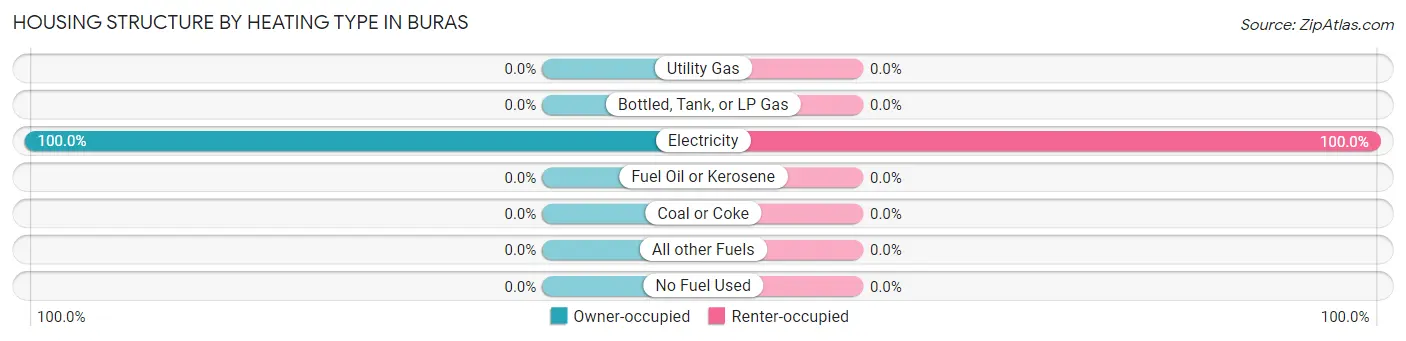
| Heating Type | Owner-occupied | Renter-occupied |
| Utility Gas | 0 (0.0%) | 0 (0.0%) |
| Bottled, Tank, or LP Gas | 0 (0.0%) | 0 (0.0%) |
| Electricity | 334 (100.0%) | 5 (100.0%) |
| Fuel Oil or Kerosene | 0 (0.0%) | 0 (0.0%) |
| Coal or Coke | 0 (0.0%) | 0 (0.0%) |
| All other Fuels | 0 (0.0%) | 0 (0.0%) |
| No Fuel Used | 0 (0.0%) | 0 (0.0%) |
| Total | 334 (100.0%) | 5 (100.0%) |
Household Vehicle Usage in Buras
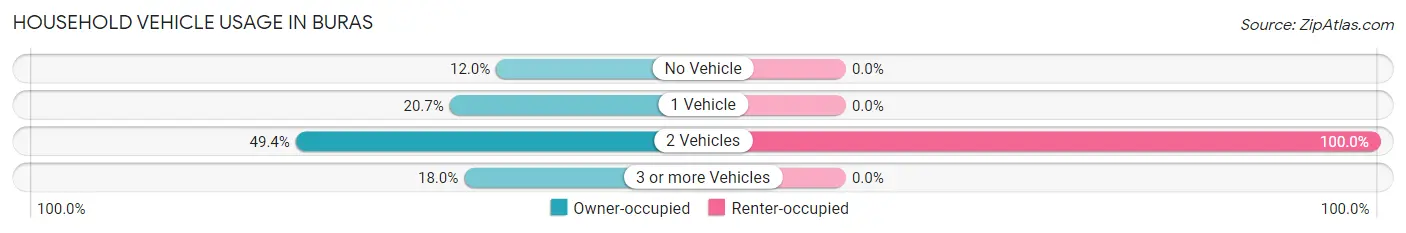
| Vehicles per Household | Owner-occupied | Renter-occupied |
| No Vehicle | 40 (12.0%) | 0 (0.0%) |
| 1 Vehicle | 69 (20.7%) | 0 (0.0%) |
| 2 Vehicles | 165 (49.4%) | 5 (100.0%) |
| 3 or more Vehicles | 60 (18.0%) | 0 (0.0%) |
| Total | 334 (100.0%) | 5 (100.0%) |
Real Estate & Mortgages in Buras
Real Estate and Mortgage Overview in Buras
| Characteristic | Without Mortgage | With Mortgage |
| Housing Units | 214 | 120 |
| Median Property Value | $47,600 | $305,900 |
| Median Household Income | - | - |
| Monthly Housing Costs | - | - |
| Real Estate Taxes | $209 | $28 |
Property Value by Mortgage Status in Buras
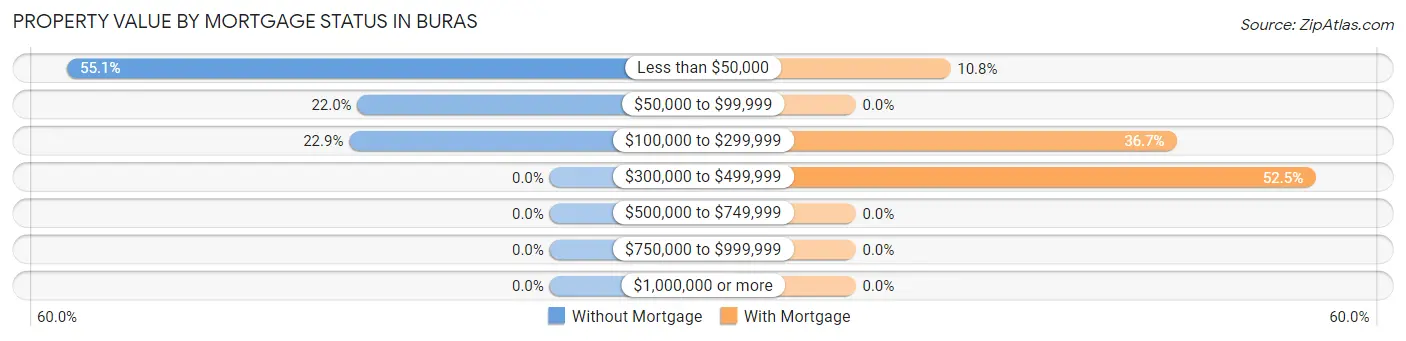
| Property Value | Without Mortgage | With Mortgage |
| Less than $50,000 | 118 (55.1%) | 13 (10.8%) |
| $50,000 to $99,999 | 47 (22.0%) | 0 (0.0%) |
| $100,000 to $299,999 | 49 (22.9%) | 44 (36.7%) |
| $300,000 to $499,999 | 0 (0.0%) | 63 (52.5%) |
| $500,000 to $749,999 | 0 (0.0%) | 0 (0.0%) |
| $750,000 to $999,999 | 0 (0.0%) | 0 (0.0%) |
| $1,000,000 or more | 0 (0.0%) | 0 (0.0%) |
| Total | 214 (100.0%) | 120 (100.0%) |
Household Income by Mortgage Status in Buras
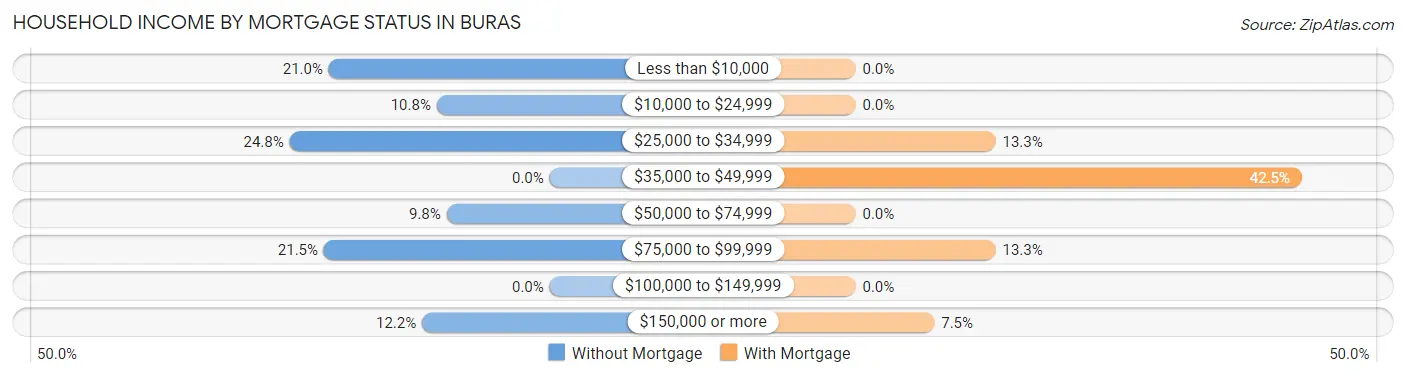
| Household Income | Without Mortgage | With Mortgage |
| Less than $10,000 | 45 (21.0%) | 0 (0.0%) |
| $10,000 to $24,999 | 23 (10.7%) | 0 (0.0%) |
| $25,000 to $34,999 | 53 (24.8%) | 16 (13.3%) |
| $35,000 to $49,999 | 0 (0.0%) | 51 (42.5%) |
| $50,000 to $74,999 | 21 (9.8%) | 0 (0.0%) |
| $75,000 to $99,999 | 46 (21.5%) | 16 (13.3%) |
| $100,000 to $149,999 | 0 (0.0%) | 0 (0.0%) |
| $150,000 or more | 26 (12.1%) | 9 (7.5%) |
| Total | 214 (100.0%) | 120 (100.0%) |
Property Value to Household Income Ratio in Buras
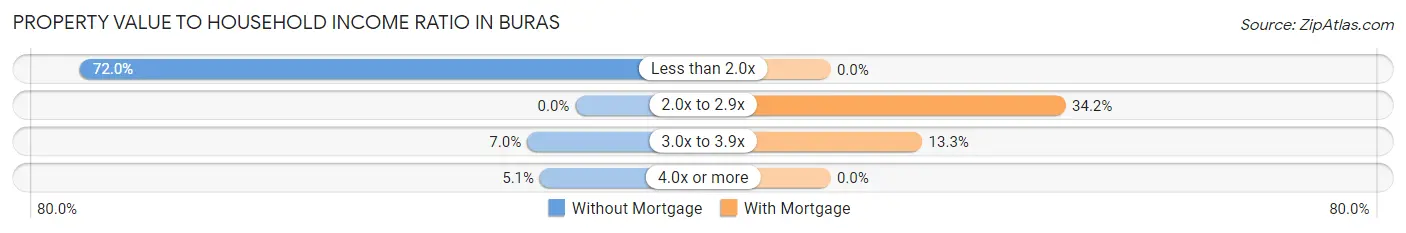
| Value-to-Income Ratio | Without Mortgage | With Mortgage |
| Less than 2.0x | 154 (72.0%) | 0 (0.0%) |
| 2.0x to 2.9x | 0 (0.0%) | 41 (34.2%) |
| 3.0x to 3.9x | 15 (7.0%) | 16 (13.3%) |
| 4.0x or more | 11 (5.1%) | 0 (0.0%) |
| Total | 214 (100.0%) | 120 (100.0%) |
Real Estate Taxes by Mortgage Status in Buras
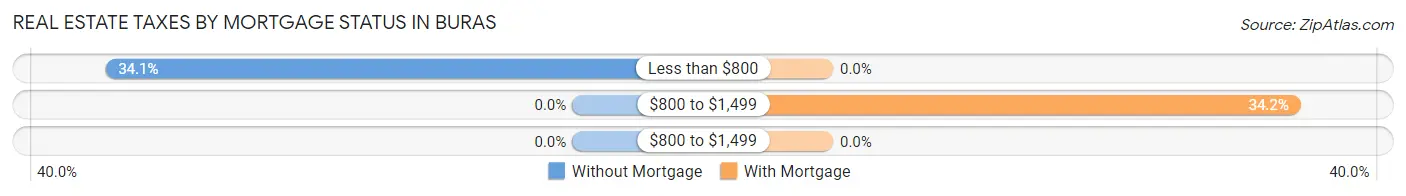
| Property Taxes | Without Mortgage | With Mortgage |
| Less than $800 | 73 (34.1%) | 0 (0.0%) |
| $800 to $1,499 | 0 (0.0%) | 41 (34.2%) |
| $800 to $1,499 | 0 (0.0%) | 0 (0.0%) |
| Total | 214 (100.0%) | 120 (100.0%) |
Health & Disability in Buras
Health Insurance Coverage by Age in Buras
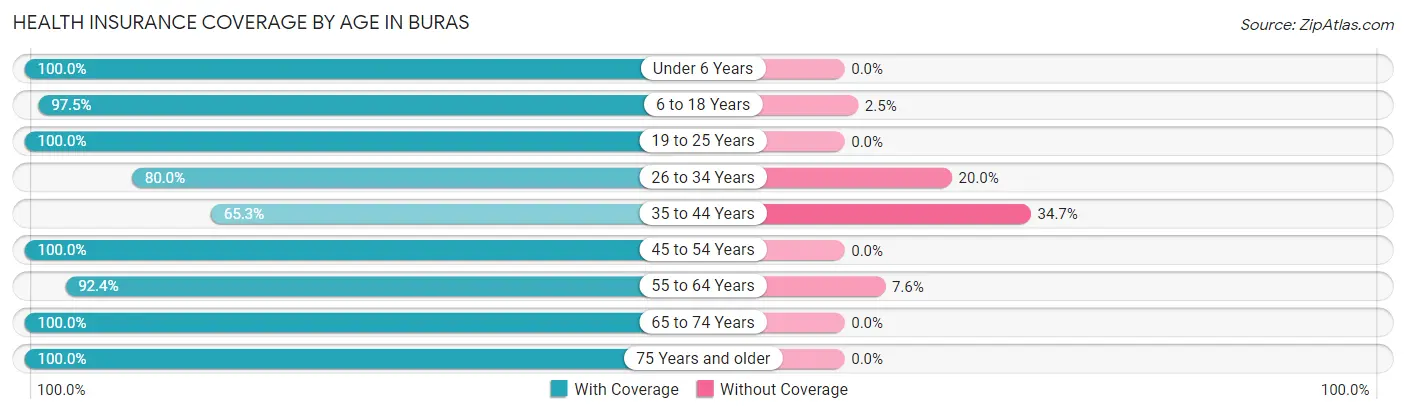
| Age Bracket | With Coverage | Without Coverage |
| Under 6 Years | 55 (100.0%) | 0 (0.0%) |
| 6 to 18 Years | 192 (97.5%) | 5 (2.5%) |
| 19 to 25 Years | 65 (100.0%) | 0 (0.0%) |
| 26 to 34 Years | 84 (80.0%) | 21 (20.0%) |
| 35 to 44 Years | 62 (65.3%) | 33 (34.7%) |
| 45 to 54 Years | 124 (100.0%) | 0 (0.0%) |
| 55 to 64 Years | 183 (92.4%) | 15 (7.6%) |
| 65 to 74 Years | 78 (100.0%) | 0 (0.0%) |
| 75 Years and older | 4 (100.0%) | 0 (0.0%) |
| Total | 847 (92.0%) | 74 (8.0%) |
Health Insurance Coverage by Citizenship Status in Buras
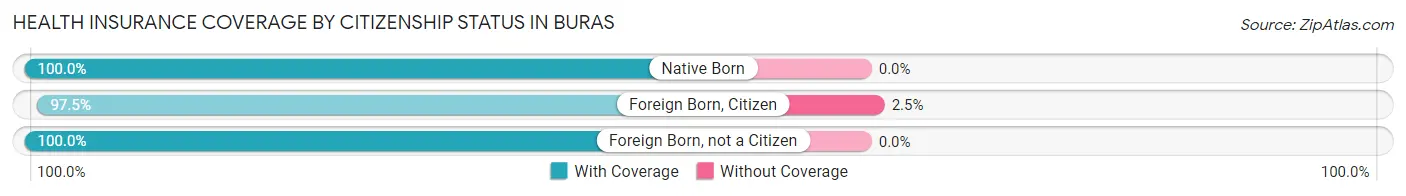
| Citizenship Status | With Coverage | Without Coverage |
| Native Born | 55 (100.0%) | 0 (0.0%) |
| Foreign Born, Citizen | 192 (97.5%) | 5 (2.5%) |
| Foreign Born, not a Citizen | 65 (100.0%) | 0 (0.0%) |
Health Insurance Coverage by Household Income in Buras
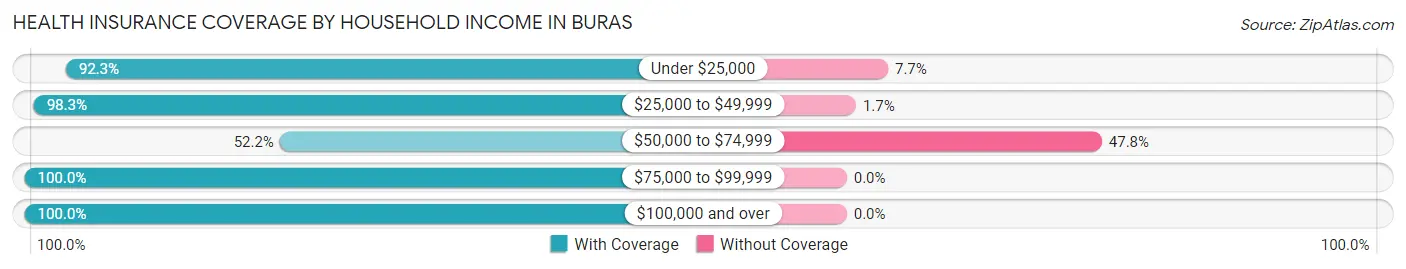
| Household Income | With Coverage | Without Coverage |
| Under $25,000 | 179 (92.3%) | 15 (7.7%) |
| $25,000 to $49,999 | 286 (98.3%) | 5 (1.7%) |
| $50,000 to $74,999 | 59 (52.2%) | 54 (47.8%) |
| $75,000 to $99,999 | 88 (100.0%) | 0 (0.0%) |
| $100,000 and over | 235 (100.0%) | 0 (0.0%) |
Public vs Private Health Insurance Coverage by Age in Buras
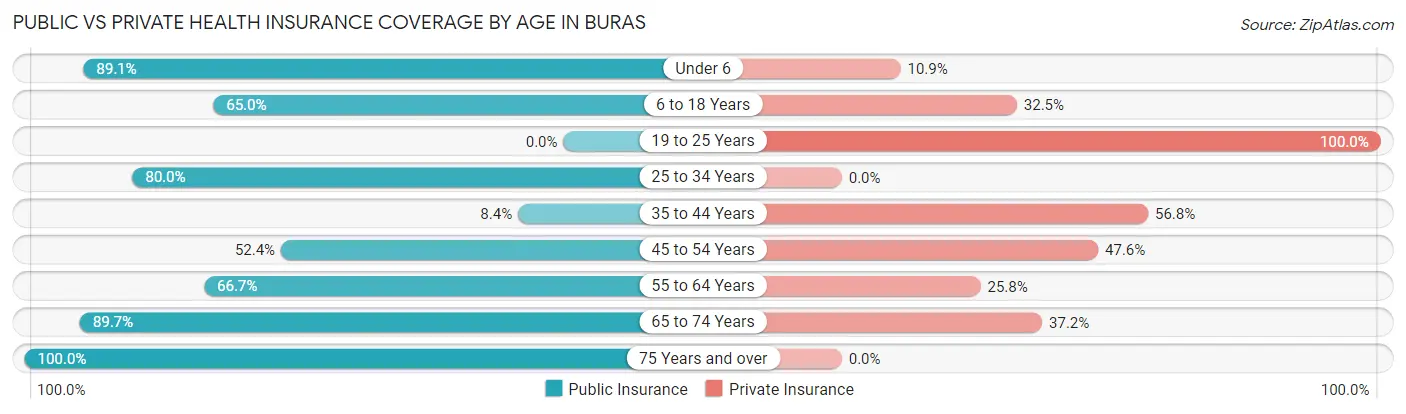
| Age Bracket | Public Insurance | Private Insurance |
| Under 6 | 49 (89.1%) | 6 (10.9%) |
| 6 to 18 Years | 128 (65.0%) | 64 (32.5%) |
| 19 to 25 Years | 0 (0.0%) | 65 (100.0%) |
| 25 to 34 Years | 84 (80.0%) | 0 (0.0%) |
| 35 to 44 Years | 8 (8.4%) | 54 (56.8%) |
| 45 to 54 Years | 65 (52.4%) | 59 (47.6%) |
| 55 to 64 Years | 132 (66.7%) | 51 (25.8%) |
| 65 to 74 Years | 70 (89.7%) | 29 (37.2%) |
| 75 Years and over | 4 (100.0%) | 0 (0.0%) |
| Total | 540 (58.6%) | 328 (35.6%) |
Disability Status by Sex by Age in Buras
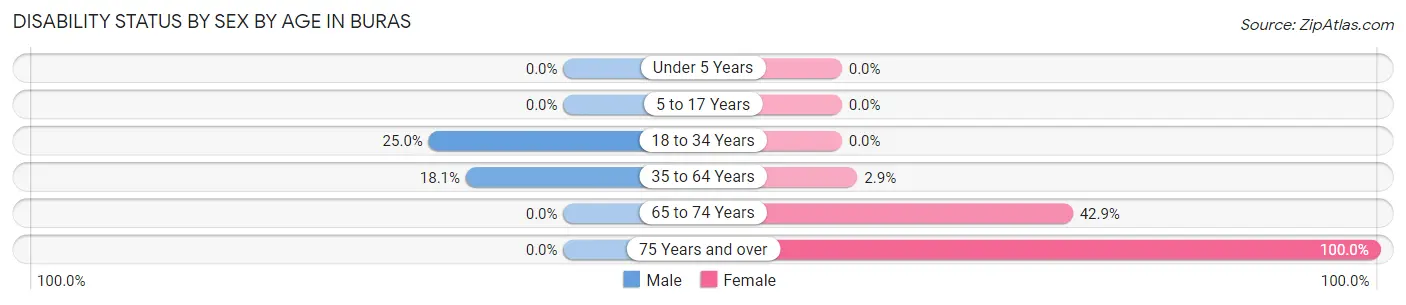
| Age Bracket | Male | Female |
| Under 5 Years | 0 (0.0%) | 0 (0.0%) |
| 5 to 17 Years | 0 (0.0%) | 0 (0.0%) |
| 18 to 34 Years | 8 (25.0%) | 0 (0.0%) |
| 35 to 64 Years | 38 (18.1%) | 6 (2.9%) |
| 65 to 74 Years | 0 (0.0%) | 9 (42.9%) |
| 75 Years and over | 0 (0.0%) | 4 (100.0%) |
Disability Class by Sex by Age in Buras
Disability Class: Hearing Difficulty
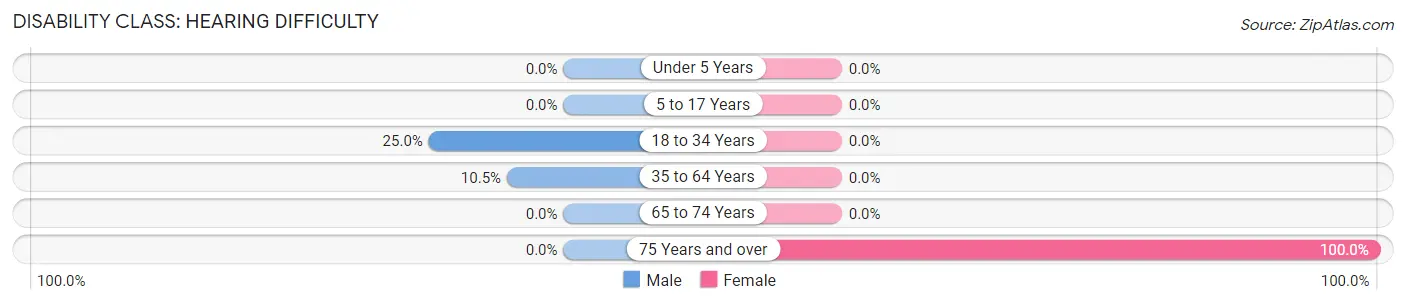
| Age Bracket | Male | Female |
| Under 5 Years | 0 (0.0%) | 0 (0.0%) |
| 5 to 17 Years | 0 (0.0%) | 0 (0.0%) |
| 18 to 34 Years | 8 (25.0%) | 0 (0.0%) |
| 35 to 64 Years | 22 (10.5%) | 0 (0.0%) |
| 65 to 74 Years | 0 (0.0%) | 0 (0.0%) |
| 75 Years and over | 0 (0.0%) | 4 (100.0%) |
Disability Class: Vision Difficulty
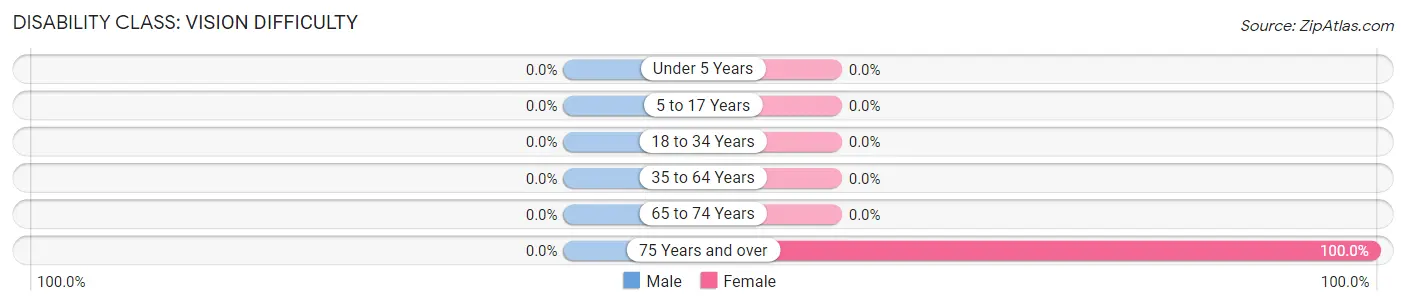
| Age Bracket | Male | Female |
| Under 5 Years | 0 (0.0%) | 0 (0.0%) |
| 5 to 17 Years | 0 (0.0%) | 0 (0.0%) |
| 18 to 34 Years | 0 (0.0%) | 0 (0.0%) |
| 35 to 64 Years | 0 (0.0%) | 0 (0.0%) |
| 65 to 74 Years | 0 (0.0%) | 0 (0.0%) |
| 75 Years and over | 0 (0.0%) | 4 (100.0%) |
Disability Class: Cognitive Difficulty
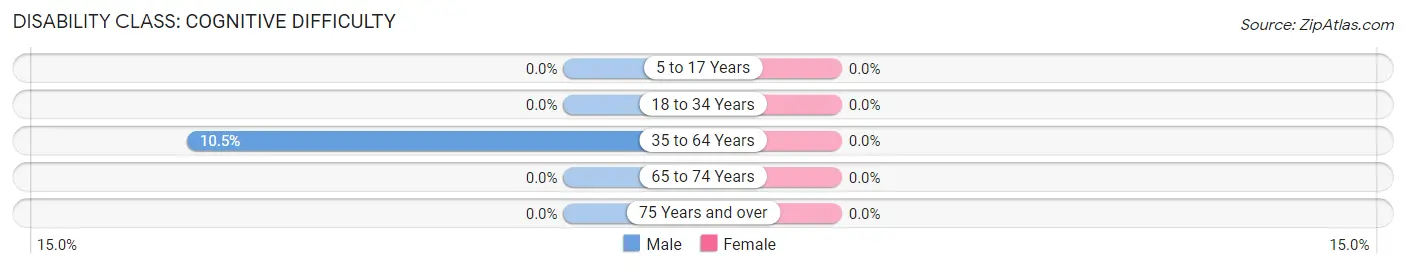
| Age Bracket | Male | Female |
| 5 to 17 Years | 0 (0.0%) | 0 (0.0%) |
| 18 to 34 Years | 0 (0.0%) | 0 (0.0%) |
| 35 to 64 Years | 22 (10.5%) | 0 (0.0%) |
| 65 to 74 Years | 0 (0.0%) | 0 (0.0%) |
| 75 Years and over | 0 (0.0%) | 0 (0.0%) |
Disability Class: Ambulatory Difficulty
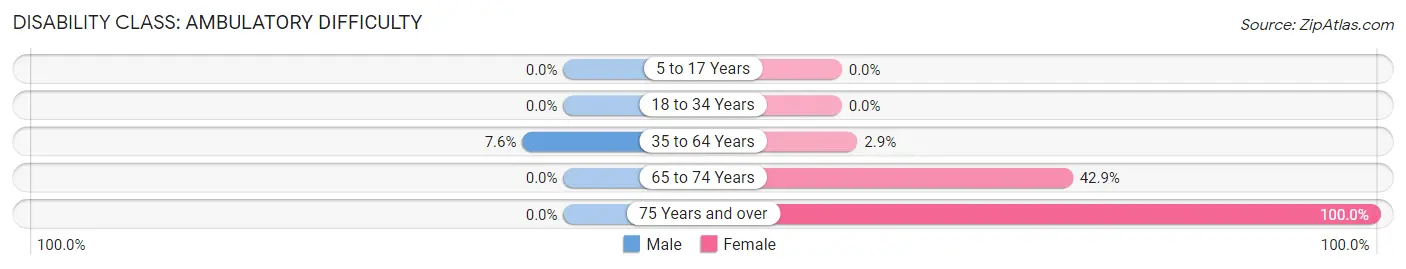
| Age Bracket | Male | Female |
| 5 to 17 Years | 0 (0.0%) | 0 (0.0%) |
| 18 to 34 Years | 0 (0.0%) | 0 (0.0%) |
| 35 to 64 Years | 16 (7.6%) | 6 (2.9%) |
| 65 to 74 Years | 0 (0.0%) | 9 (42.9%) |
| 75 Years and over | 0 (0.0%) | 4 (100.0%) |
Disability Class: Self-Care Difficulty
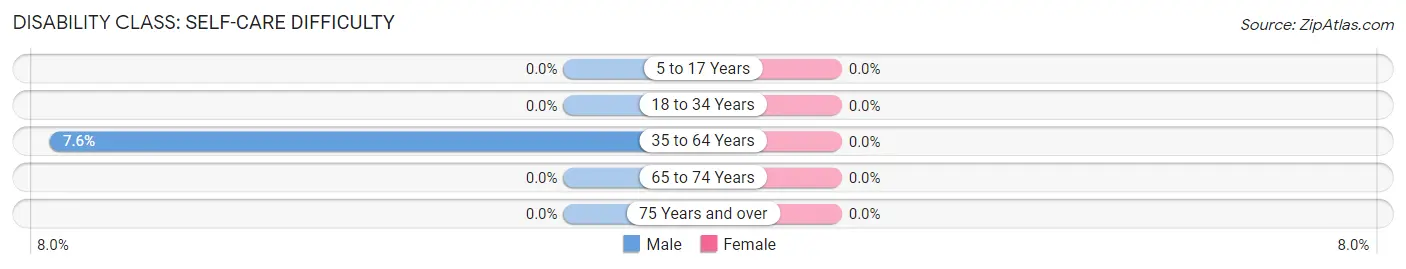
| Age Bracket | Male | Female |
| 5 to 17 Years | 0 (0.0%) | 0 (0.0%) |
| 18 to 34 Years | 0 (0.0%) | 0 (0.0%) |
| 35 to 64 Years | 16 (7.6%) | 0 (0.0%) |
| 65 to 74 Years | 0 (0.0%) | 0 (0.0%) |
| 75 Years and over | 0 (0.0%) | 0 (0.0%) |
Technology Access in Buras
Computing Device Access in Buras
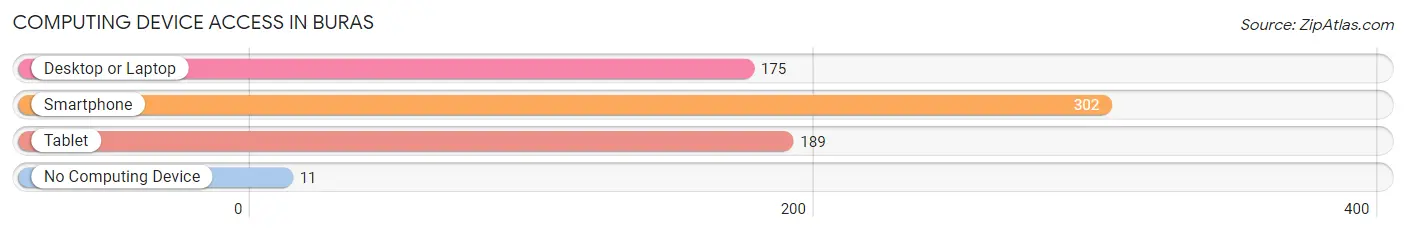
| Device Type | # Households | % Households |
| Desktop or Laptop | 175 | 51.6% |
| Smartphone | 302 | 89.1% |
| Tablet | 189 | 55.7% |
| No Computing Device | 11 | 3.2% |
| Total | 339 | 100.0% |
Internet Access in Buras
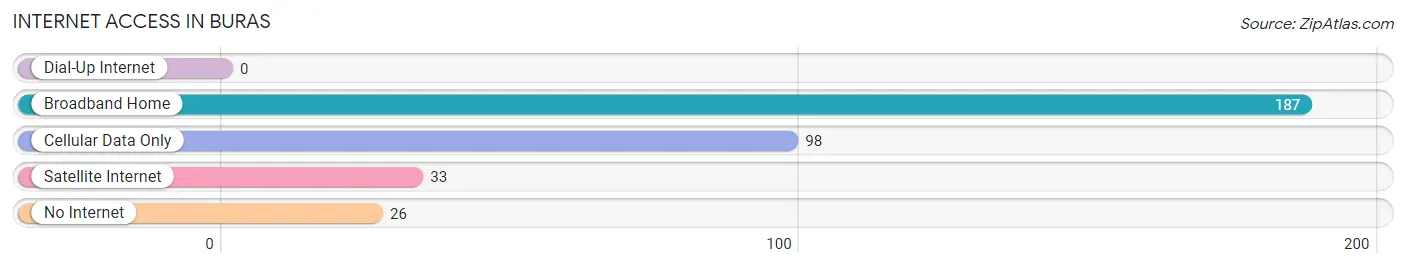
| Internet Type | # Households | % Households |
| Dial-Up Internet | 0 | 0.0% |
| Broadband Home | 187 | 55.2% |
| Cellular Data Only | 98 | 28.9% |
| Satellite Internet | 33 | 9.7% |
| No Internet | 26 | 7.7% |
| Total | 339 | 100.0% |
Buras Summary
Buras is a small unincorporated community located in Plaquemines Parish, Louisiana. It is situated on the west bank of the Mississippi River, approximately 25 miles south of New Orleans. The population of Buras was 1,845 at the 2010 census.
History
Buras was first settled in the early 1800s by French settlers. The town was originally known as “Bourg des Buras”, which translates to “Village of the Buras”. The name “Buras” is derived from the Choctaw word “bura”, which means “river”. The town was officially incorporated in 1848.
In the late 1800s, Buras was a thriving port town. It was home to several businesses, including a sawmill, a cotton gin, and a brickyard. The town also had a post office, a school, and a church.
In the early 1900s, Buras was a popular destination for fishermen and hunters. The town was also known for its oyster beds, which were harvested for their pearls.
In the 1950s, Buras was a popular tourist destination. The town was home to several restaurants, hotels, and other businesses.
Geography
Buras is located in Plaquemines Parish, Louisiana. It is situated on the west bank of the Mississippi River, approximately 25 miles south of New Orleans. The town is bordered by the Gulf of Mexico to the south and the Mississippi River to the north.
The terrain of Buras is mostly flat, with some low hills. The town is located in a humid subtropical climate zone, with hot, humid summers and mild winters.
Economy
The economy of Buras is largely based on fishing and tourism. The town is home to several seafood restaurants, as well as several hotels and bed and breakfasts.
The town is also home to several boatyards and marinas, which provide services to recreational and commercial fishermen.
Demographics
As of the 2010 census, the population of Buras was 1,845. The racial makeup of the town was 79.3% White, 17.2% African American, 0.7% Native American, 0.3% Asian, 0.1% Pacific Islander, and 2.4% from other races.
The median household income in Buras was $37,917, and the median family income was $45,625. The per capita income was $19,945. About 17.2% of the population was below the poverty line.
Common Questions
What is Per Capita Income in Buras?
Per Capita income in Buras is $24,126.
What is the Median Family Income in Buras?
Median Family Income in Buras is $34,076.
What is the Median Household income in Buras?
Median Household Income in Buras is $34,518.
What is Inequality or Gini Index in Buras?
Inequality or Gini Index in Buras is 0.50.
What is the Total Population of Buras?
Total Population of Buras is 921.
What is the Total Male Population of Buras?
Total Male Population of Buras is 426.
What is the Total Female Population of Buras?
Total Female Population of Buras is 495.
What is the Ratio of Males per 100 Females in Buras?
There are 86.06 Males per 100 Females in Buras.
What is the Ratio of Females per 100 Males in Buras?
There are 116.20 Females per 100 Males in Buras.
What is the Median Population Age in Buras?
Median Population Age in Buras is 36.2 Years.
What is the Average Family Size in Buras
Average Family Size in Buras is 3.2 People.
What is the Average Household Size in Buras
Average Household Size in Buras is 2.7 People.
How Large is the Labor Force in Buras?
There are 333 People in the Labor Forcein in Buras.
What is the Percentage of People in the Labor Force in Buras?
46.4% of People are in the Labor Force in Buras.