Bayou La Batre, AL Map & Demographics
Bayou La Batre Map
Bayou La Batre Overview
$18,620
PER CAPITA INCOME
$41,250
AVG FAMILY INCOME
$40,000
AVG HOUSEHOLD INCOME
36.3%
WAGE / INCOME GAP [ % ]
63.7¢/ $1
WAGE / INCOME GAP [ $ ]
0.40
INEQUALITY / GINI INDEX
2,215
TOTAL POPULATION
988
MALE POPULATION
1,227
FEMALE POPULATION
80.52
MALES / 100 FEMALES
124.19
FEMALES / 100 MALES
42.4
MEDIAN AGE
3.5
AVG FAMILY SIZE
2.8
AVG HOUSEHOLD SIZE
864
LABOR FORCE [ PEOPLE ]
48.1%
PERCENT IN LABOR FORCE
2.4%
UNEMPLOYMENT RATE
Bayou La Batre Zip Codes
Bayou La Batre Area Codes
Income in Bayou La Batre
Income Overview in Bayou La Batre
Per Capita Income in Bayou La Batre is $18,620, while median incomes of families and households are $41,250 and $40,000 respectively.
| Characteristic | Number | Measure |
| Per Capita Income | 2,215 | $18,620 |
| Median Family Income | 499 | $41,250 |
| Mean Family Income | 499 | $52,817 |
| Median Household Income | 800 | $40,000 |
| Mean Household Income | 800 | $46,973 |
| Income Deficit | 499 | $0 |
| Wage / Income Gap (%) | 2,215 | 36.35% |
| Wage / Income Gap ($) | 2,215 | 63.65¢ per $1 |
| Gini / Inequality Index | 2,215 | 0.40 |
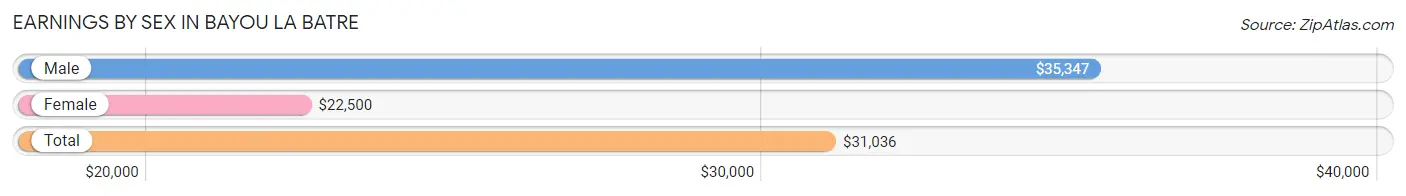
Earnings by Sex in Bayou La Batre
Average Earnings in Bayou La Batre are $31,036, $35,347 for men and $22,500 for women, a difference of 36.3%.
| Sex | Number | Average Earnings |
| Male | 487 (54.7%) | $35,347 |
| Female | 404 (45.3%) | $22,500 |
| Total | 891 (100.0%) | $31,036 |
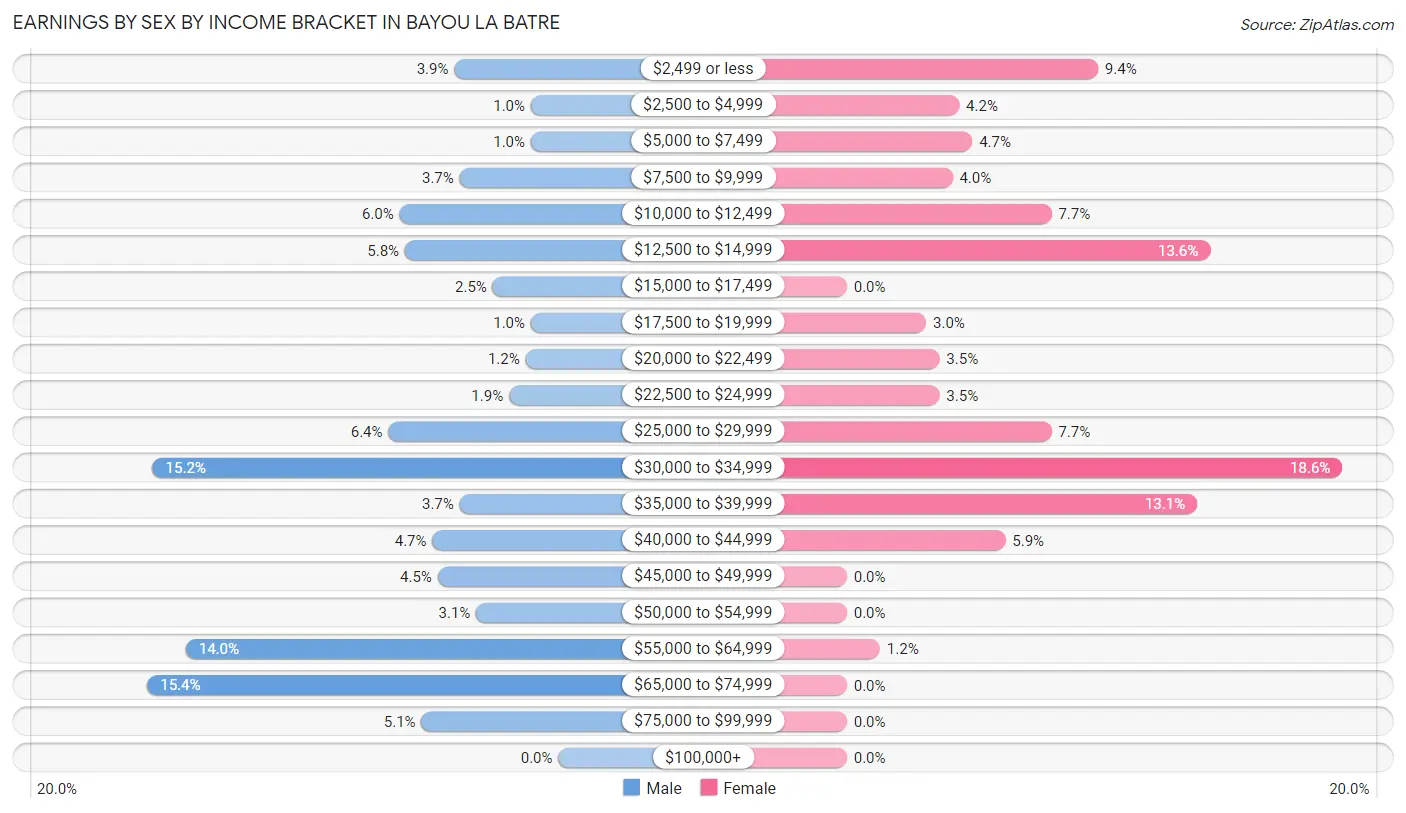
Earnings by Sex by Income Bracket in Bayou La Batre
The most common earnings brackets in Bayou La Batre are $65,000 to $74,999 for men (75 | 15.4%) and $30,000 to $34,999 for women (75 | 18.6%).
| Income | Male | Female |
| $2,499 or less | 19 (3.9%) | 38 (9.4%) |
| $2,500 to $4,999 | 5 (1.0%) | 17 (4.2%) |
| $5,000 to $7,499 | 5 (1.0%) | 19 (4.7%) |
| $7,500 to $9,999 | 18 (3.7%) | 16 (4.0%) |
| $10,000 to $12,499 | 29 (5.9%) | 31 (7.7%) |
| $12,500 to $14,999 | 28 (5.8%) | 55 (13.6%) |
| $15,000 to $17,499 | 12 (2.5%) | 0 (0.0%) |
| $17,500 to $19,999 | 5 (1.0%) | 12 (3.0%) |
| $20,000 to $22,499 | 6 (1.2%) | 14 (3.5%) |
| $22,500 to $24,999 | 9 (1.8%) | 14 (3.5%) |
| $25,000 to $29,999 | 31 (6.4%) | 31 (7.7%) |
| $30,000 to $34,999 | 74 (15.2%) | 75 (18.6%) |
| $35,000 to $39,999 | 18 (3.7%) | 53 (13.1%) |
| $40,000 to $44,999 | 23 (4.7%) | 24 (5.9%) |
| $45,000 to $49,999 | 22 (4.5%) | 0 (0.0%) |
| $50,000 to $54,999 | 15 (3.1%) | 0 (0.0%) |
| $55,000 to $64,999 | 68 (14.0%) | 5 (1.2%) |
| $65,000 to $74,999 | 75 (15.4%) | 0 (0.0%) |
| $75,000 to $99,999 | 25 (5.1%) | 0 (0.0%) |
| $100,000+ | 0 (0.0%) | 0 (0.0%) |
| Total | 487 (100.0%) | 404 (100.0%) |
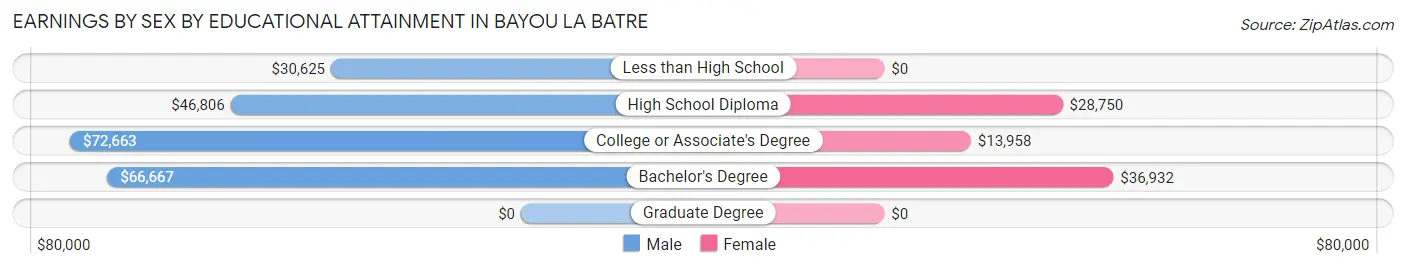
Earnings by Sex by Educational Attainment in Bayou La Batre
Average earnings in Bayou La Batre are $47,083 for men and $20,469 for women, a difference of 56.5%. Men with an educational attainment of college or associate's degree enjoy the highest average annual earnings of $72,663, while those with less than high school education earn the least with $30,625. Women with an educational attainment of bachelor's degree earn the most with the average annual earnings of $36,932, while those with college or associate's degree education have the smallest earnings of $13,958.
| Educational Attainment | Male Income | Female Income |
| Less than High School | $30,625 | $0 |
| High School Diploma | $46,806 | $28,750 |
| College or Associate's Degree | $72,663 | $13,958 |
| Bachelor's Degree | $66,667 | $36,932 |
| Graduate Degree | - | - |
| Total | $47,083 | $20,469 |
Family Income in Bayou La Batre
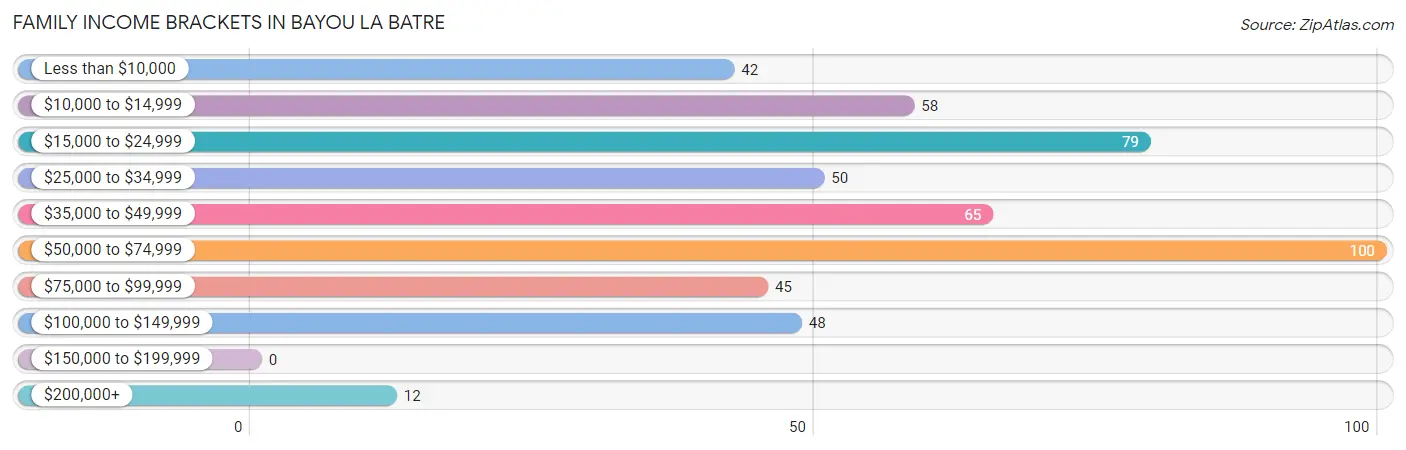
Family Income Brackets in Bayou La Batre
According to the Bayou La Batre family income data, there are 100 families falling into the $50,000 to $74,999 income range, which is the most common income bracket and makes up 20.0% of all families.
| Income Bracket | # Families | % Families |
| Less than $10,000 | 42 | 8.4% |
| $10,000 to $14,999 | 58 | 11.6% |
| $15,000 to $24,999 | 79 | 15.8% |
| $25,000 to $34,999 | 50 | 10.0% |
| $35,000 to $49,999 | 65 | 13.0% |
| $50,000 to $74,999 | 100 | 20.0% |
| $75,000 to $99,999 | 45 | 9.0% |
| $100,000 to $149,999 | 48 | 9.6% |
| $150,000 to $199,999 | 0 | 0.0% |
| $200,000+ | 12 | 2.4% |
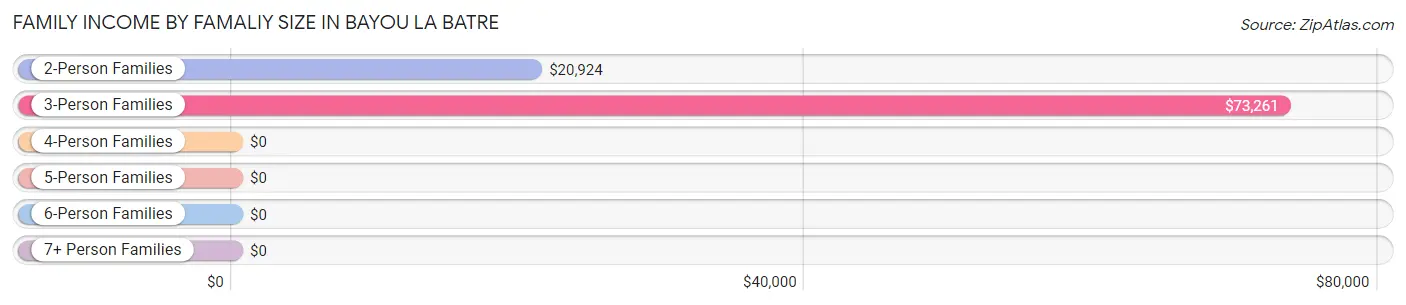
Family Income by Famaliy Size in Bayou La Batre
3-person families (160 | 32.1%) account for the highest median family income in Bayou La Batre with $73,261 per family, while 3-person families (160 | 32.1%) have the highest median income of $24,420 per family member.
| Income Bracket | # Families | Median Income |
| 2-Person Families | 223 (44.7%) | $20,924 |
| 3-Person Families | 160 (32.1%) | $73,261 |
| 4-Person Families | 34 (6.8%) | $0 |
| 5-Person Families | 28 (5.6%) | $0 |
| 6-Person Families | 18 (3.6%) | $0 |
| 7+ Person Families | 36 (7.2%) | $0 |
| Total | 499 (100.0%) | $41,250 |
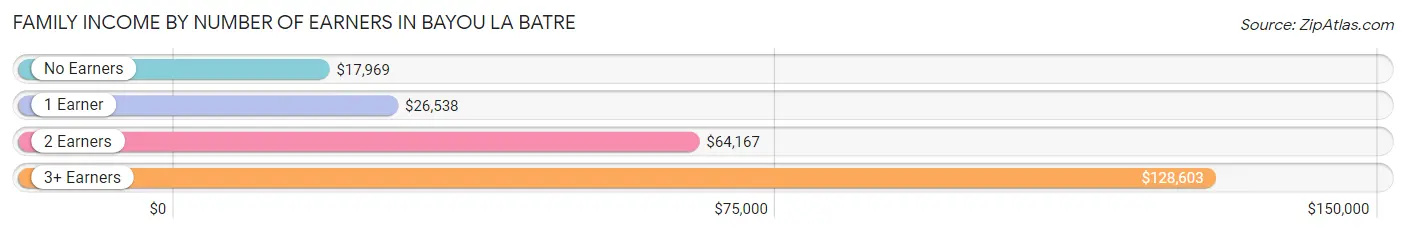
Family Income by Number of Earners in Bayou La Batre
The median family income in Bayou La Batre is $41,250, with families comprising 3+ earners (50) having the highest median family income of $128,603, while families with no earners (129) have the lowest median family income of $17,969, accounting for 10.0% and 25.9% of families, respectively.
| Number of Earners | # Families | Median Income |
| No Earners | 129 (25.9%) | $17,969 |
| 1 Earner | 200 (40.1%) | $26,538 |
| 2 Earners | 120 (24.0%) | $64,167 |
| 3+ Earners | 50 (10.0%) | $128,603 |
| Total | 499 (100.0%) | $41,250 |
Household Income in Bayou La Batre
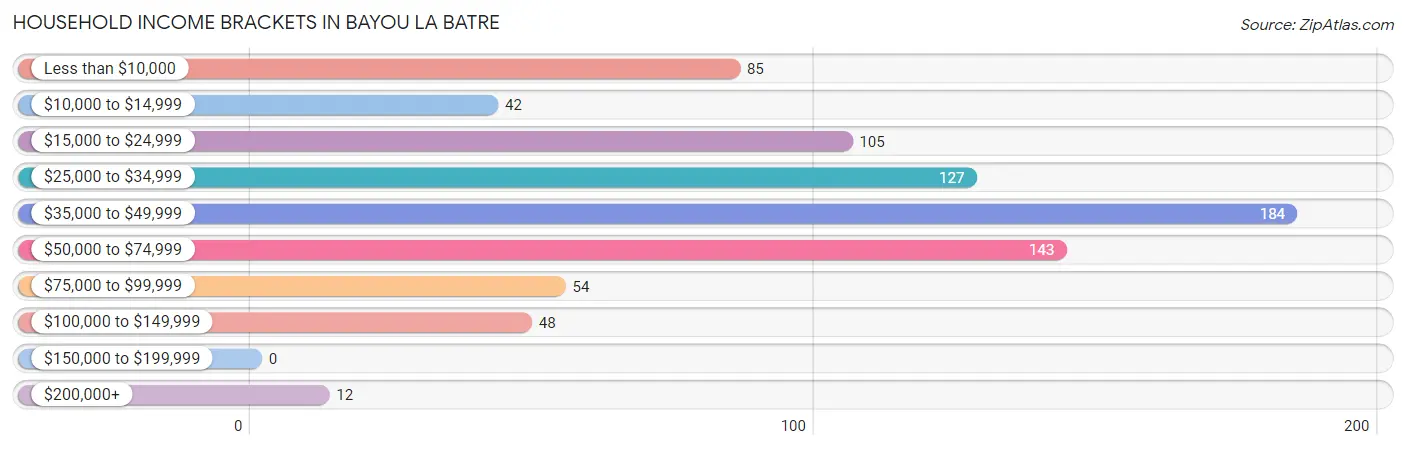
Household Income Brackets in Bayou La Batre
With 184 households falling in the category, the $35,000 to $49,999 income range is the most frequent in Bayou La Batre, accounting for 23.0% of all households.
| Income Bracket | # Households | % Households |
| Less than $10,000 | 85 | 10.6% |
| $10,000 to $14,999 | 42 | 5.3% |
| $15,000 to $24,999 | 105 | 13.1% |
| $25,000 to $34,999 | 127 | 15.9% |
| $35,000 to $49,999 | 184 | 23.0% |
| $50,000 to $74,999 | 143 | 17.9% |
| $75,000 to $99,999 | 54 | 6.8% |
| $100,000 to $149,999 | 48 | 6.0% |
| $150,000 to $199,999 | 0 | 0.0% |
| $200,000+ | 12 | 1.5% |
Household Income by Householder Age in Bayou La Batre
The median household income in Bayou La Batre is $40,000, with the highest median household income of $49,656 found in the 45 to 64 years age bracket for the primary householder. A total of 295 households (36.9%) fall into this category. Meanwhile, the 15 to 24 years age bracket for the primary householder has the lowest median household income of $31,569, with 71 households (8.9%) in this group.
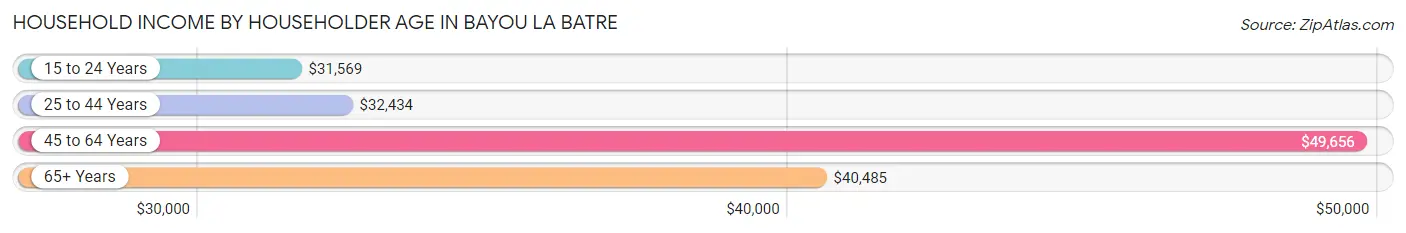
| Income Bracket | # Households | Median Income |
| 15 to 24 Years | 71 (8.9%) | $31,569 |
| 25 to 44 Years | 200 (25.0%) | $32,434 |
| 45 to 64 Years | 295 (36.9%) | $49,656 |
| 65+ Years | 234 (29.2%) | $40,485 |
| Total | 800 (100.0%) | $40,000 |
Poverty in Bayou La Batre
Income Below Poverty by Sex and Age in Bayou La Batre
With 25.2% poverty level for males and 29.3% for females among the residents of Bayou La Batre, 12 to 14 year old males and 75 year old and over females are the most vulnerable to poverty, with 22 males (100.0%) and 68 females (61.3%) in their respective age groups living below the poverty level.
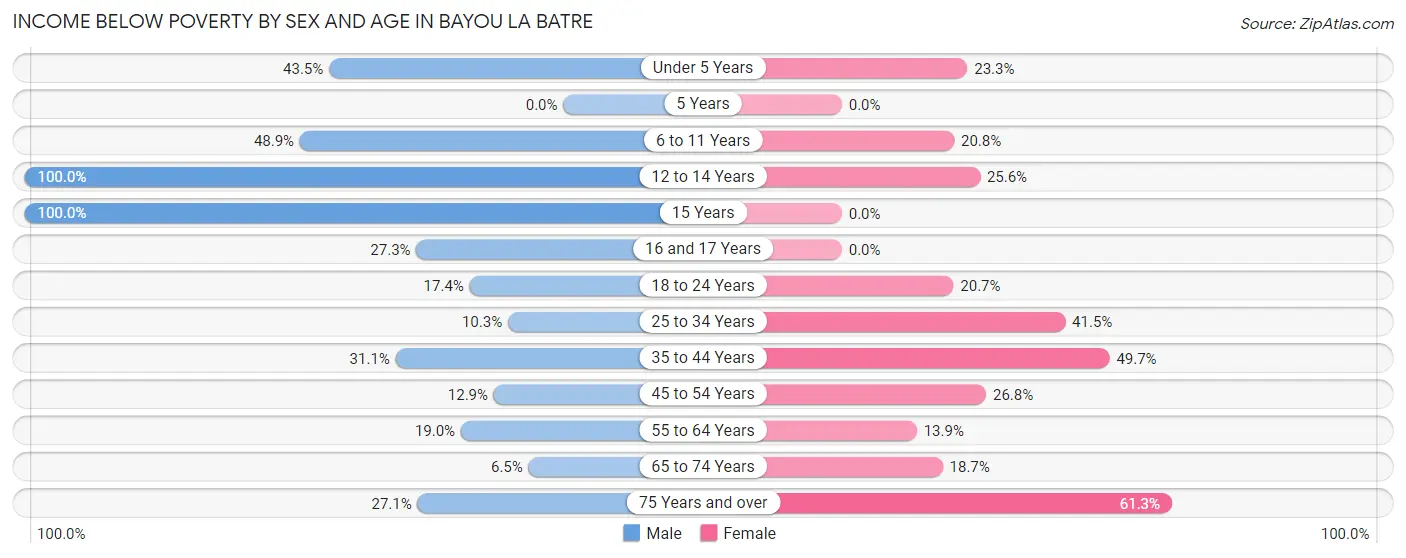
| Age Bracket | Male | Female |
| Under 5 Years | 20 (43.5%) | 17 (23.3%) |
| 5 Years | 0 (0.0%) | 0 (0.0%) |
| 6 to 11 Years | 22 (48.9%) | 25 (20.8%) |
| 12 to 14 Years | 22 (100.0%) | 10 (25.6%) |
| 15 Years | 30 (100.0%) | 0 (0.0%) |
| 16 and 17 Years | 12 (27.3%) | 0 (0.0%) |
| 18 to 24 Years | 16 (17.4%) | 29 (20.7%) |
| 25 to 34 Years | 11 (10.3%) | 51 (41.5%) |
| 35 to 44 Years | 33 (31.1%) | 77 (49.7%) |
| 45 to 54 Years | 24 (12.9%) | 34 (26.8%) |
| 55 to 64 Years | 27 (19.0%) | 21 (13.9%) |
| 65 to 74 Years | 4 (6.5%) | 26 (18.7%) |
| 75 Years and over | 23 (27.1%) | 68 (61.3%) |
| Total | 244 (25.2%) | 358 (29.3%) |
Income Above Poverty by Sex and Age in Bayou La Batre
According to the poverty statistics in Bayou La Batre, males aged 65 to 74 years and females aged 15 years are the age groups that are most secure financially, with 93.5% of males and 100.0% of females in these age groups living above the poverty line.
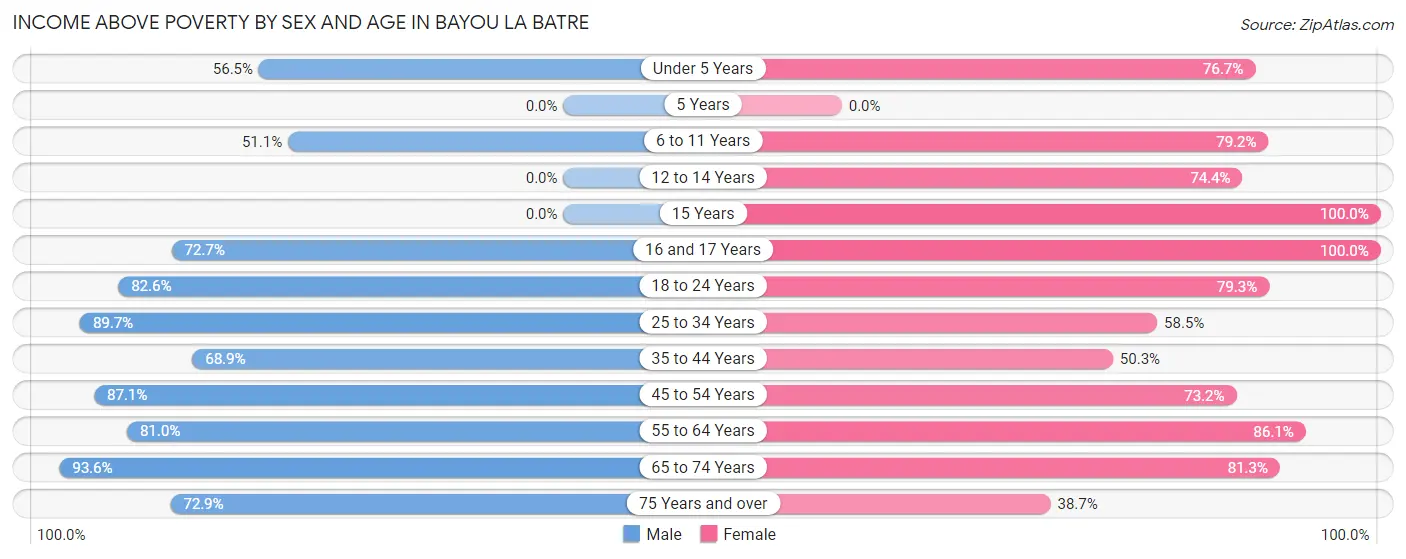
| Age Bracket | Male | Female |
| Under 5 Years | 26 (56.5%) | 56 (76.7%) |
| 5 Years | 0 (0.0%) | 0 (0.0%) |
| 6 to 11 Years | 23 (51.1%) | 95 (79.2%) |
| 12 to 14 Years | 0 (0.0%) | 29 (74.4%) |
| 15 Years | 0 (0.0%) | 17 (100.0%) |
| 16 and 17 Years | 32 (72.7%) | 26 (100.0%) |
| 18 to 24 Years | 76 (82.6%) | 111 (79.3%) |
| 25 to 34 Years | 96 (89.7%) | 72 (58.5%) |
| 35 to 44 Years | 73 (68.9%) | 78 (50.3%) |
| 45 to 54 Years | 162 (87.1%) | 93 (73.2%) |
| 55 to 64 Years | 115 (81.0%) | 130 (86.1%) |
| 65 to 74 Years | 58 (93.5%) | 113 (81.3%) |
| 75 Years and over | 62 (72.9%) | 43 (38.7%) |
| Total | 723 (74.8%) | 863 (70.7%) |
Income Below Poverty Among Married-Couple Families in Bayou La Batre
The poverty statistics for married-couple families in Bayou La Batre show that 17.8% or 49 of the total 275 families live below the poverty line. Families with no children have the highest poverty rate of 27.1%, comprising of 49 families. On the other hand, families with 1 or 2 children have the lowest poverty rate of 0.0%, which includes 0 families.
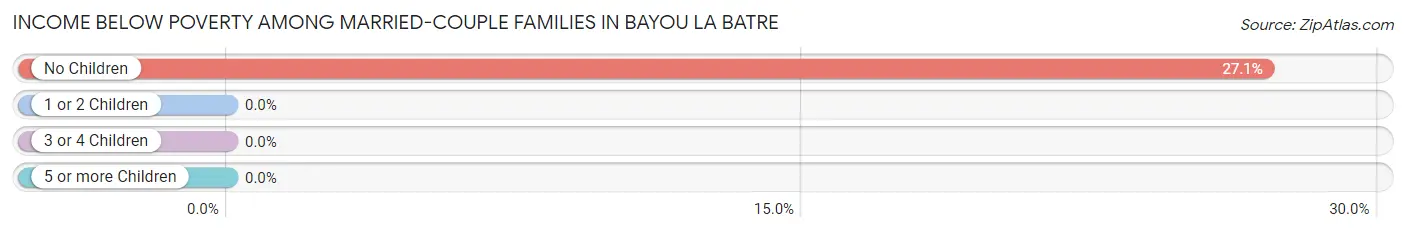
| Children | Above Poverty | Below Poverty |
| No Children | 132 (72.9%) | 49 (27.1%) |
| 1 or 2 Children | 71 (100.0%) | 0 (0.0%) |
| 3 or 4 Children | 23 (100.0%) | 0 (0.0%) |
| 5 or more Children | 0 (0.0%) | 0 (0.0%) |
| Total | 226 (82.2%) | 49 (17.8%) |
Income Below Poverty Among Single-Parent Households in Bayou La Batre
According to the poverty data in Bayou La Batre, 29.9% or 35 single-father households and 55.1% or 59 single-mother households are living below the poverty line. Among single-father households, those with 1 or 2 children have the highest poverty rate, with 11 households (36.7%) experiencing poverty. Likewise, among single-mother households, those with 5 or more children have the highest poverty rate, with 25 households (100.0%) falling below the poverty line.
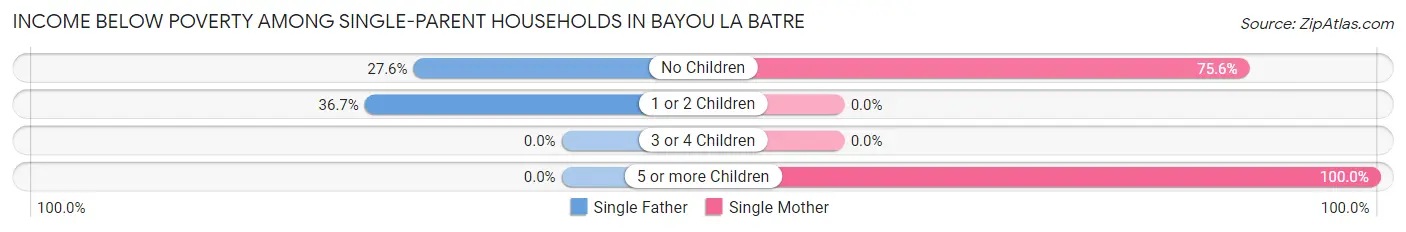
| Children | Single Father | Single Mother |
| No Children | 24 (27.6%) | 34 (75.6%) |
| 1 or 2 Children | 11 (36.7%) | 0 (0.0%) |
| 3 or 4 Children | 0 (0.0%) | 0 (0.0%) |
| 5 or more Children | 0 (0.0%) | 25 (100.0%) |
| Total | 35 (29.9%) | 59 (55.1%) |
Income Below Poverty Among Married-Couple vs Single-Parent Households in Bayou La Batre
The poverty data for Bayou La Batre shows that 49 of the married-couple family households (17.8%) and 94 of the single-parent households (42.0%) are living below the poverty level. Within the married-couple family households, those with no children have the highest poverty rate, with 49 households (27.1%) falling below the poverty line. Among the single-parent households, those with 5 or more children have the highest poverty rate, with 25 household (100.0%) living below poverty.
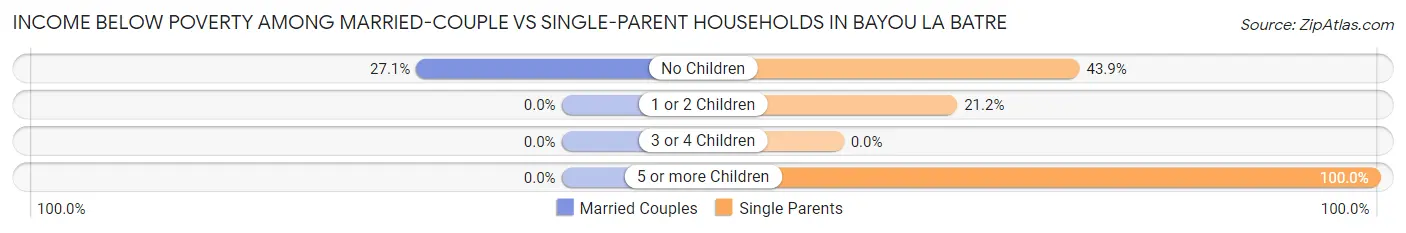
| Children | Married-Couple Families | Single-Parent Households |
| No Children | 49 (27.1%) | 58 (43.9%) |
| 1 or 2 Children | 0 (0.0%) | 11 (21.1%) |
| 3 or 4 Children | 0 (0.0%) | 0 (0.0%) |
| 5 or more Children | 0 (0.0%) | 25 (100.0%) |
| Total | 49 (17.8%) | 94 (42.0%) |
Race in Bayou La Batre
The most populous races in Bayou La Batre are White / Caucasian (1,287 | 58.1%), Asian (535 | 24.1%), and Black / African American (180 | 8.1%).
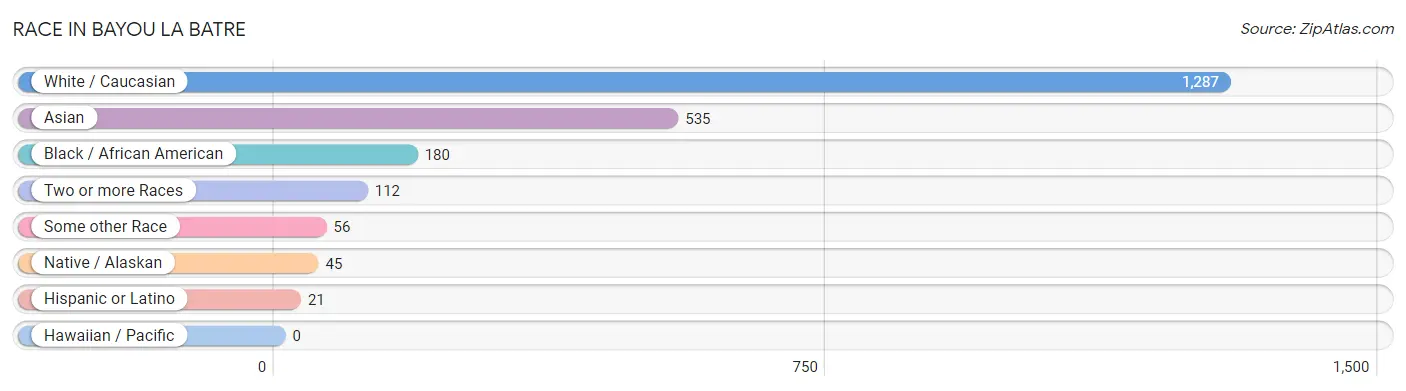
| Race | # Population | % Population |
| Asian | 535 | 24.1% |
| Black / African American | 180 | 8.1% |
| Hawaiian / Pacific | 0 | 0.0% |
| Hispanic or Latino | 21 | 0.9% |
| Native / Alaskan | 45 | 2.0% |
| White / Caucasian | 1,287 | 58.1% |
| Two or more Races | 112 | 5.1% |
| Some other Race | 56 | 2.5% |
| Total | 2,215 | 100.0% |
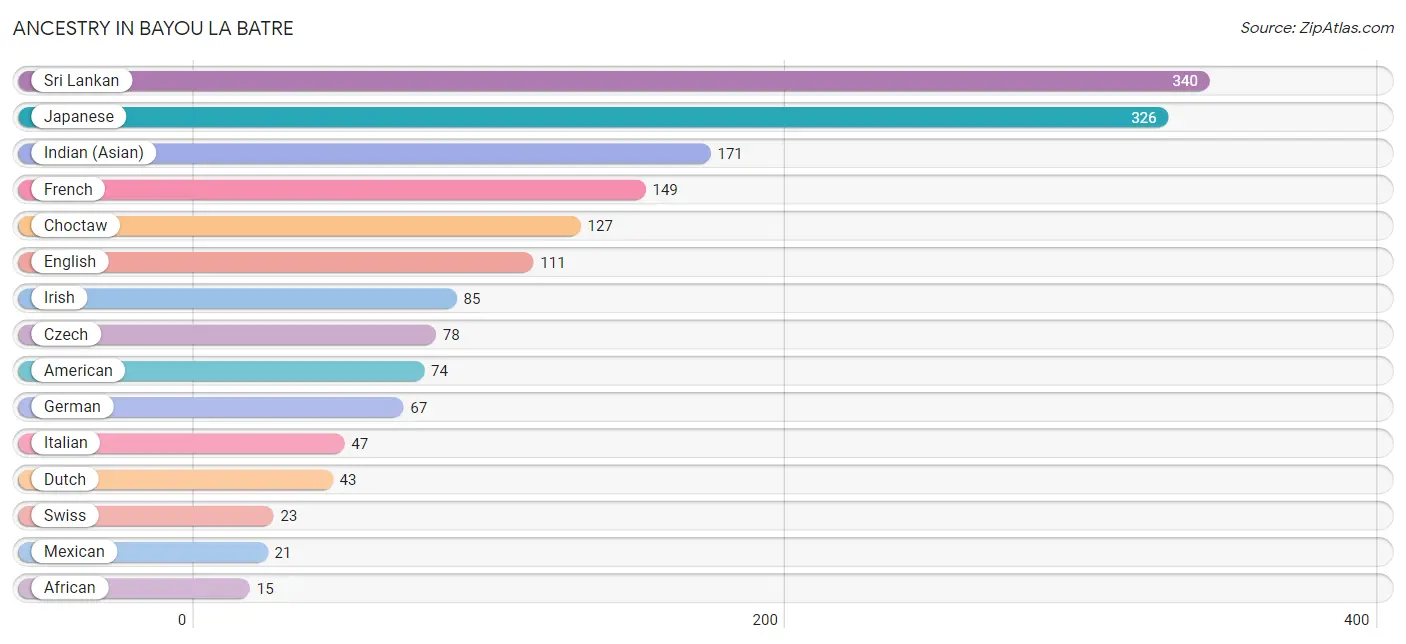
Ancestry in Bayou La Batre
The most populous ancestries reported in Bayou La Batre are Sri Lankan (340 | 15.3%), Japanese (326 | 14.7%), Indian (Asian) (171 | 7.7%), French (149 | 6.7%), and Choctaw (127 | 5.7%), together accounting for 50.2% of all Bayou La Batre residents.
| Ancestry | # Population | % Population |
| African | 15 | 0.7% |
| American | 74 | 3.3% |
| British | 12 | 0.5% |
| Cherokee | 4 | 0.2% |
| Choctaw | 127 | 5.7% |
| Creek | 4 | 0.2% |
| Czech | 78 | 3.5% |
| Dutch | 43 | 1.9% |
| English | 111 | 5.0% |
| French | 149 | 6.7% |
| French Canadian | 3 | 0.1% |
| German | 67 | 3.0% |
| Indian (Asian) | 171 | 7.7% |
| Irish | 85 | 3.8% |
| Italian | 47 | 2.1% |
| Japanese | 326 | 14.7% |
| Mexican | 21 | 0.9% |
| Pakistani | 14 | 0.6% |
| Portuguese | 5 | 0.2% |
| Scotch-Irish | 6 | 0.3% |
| Sri Lankan | 340 | 15.3% |
| Subsaharan African | 15 | 0.7% |
| Swiss | 23 | 1.0% | View All 23 Rows |
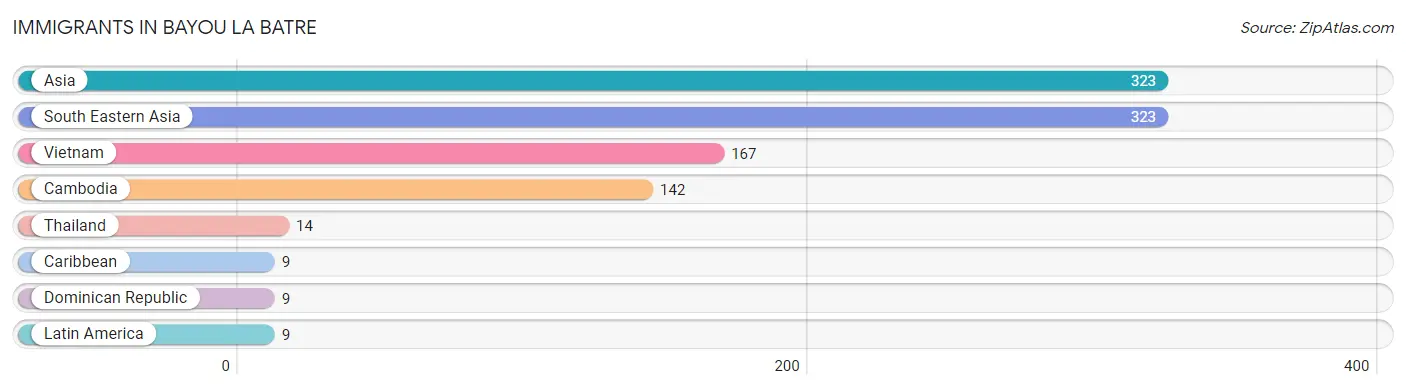
Immigrants in Bayou La Batre
The most numerous immigrant groups reported in Bayou La Batre came from Asia (323 | 14.6%), South Eastern Asia (323 | 14.6%), Vietnam (167 | 7.5%), Cambodia (142 | 6.4%), and Thailand (14 | 0.6%), together accounting for 43.7% of all Bayou La Batre residents.
| Immigration Origin | # Population | % Population |
| Asia | 323 | 14.6% |
| Cambodia | 142 | 6.4% |
| Caribbean | 9 | 0.4% |
| Dominican Republic | 9 | 0.4% |
| Latin America | 9 | 0.4% |
| South Eastern Asia | 323 | 14.6% |
| Thailand | 14 | 0.6% |
| Vietnam | 167 | 7.5% | View All 8 Rows |
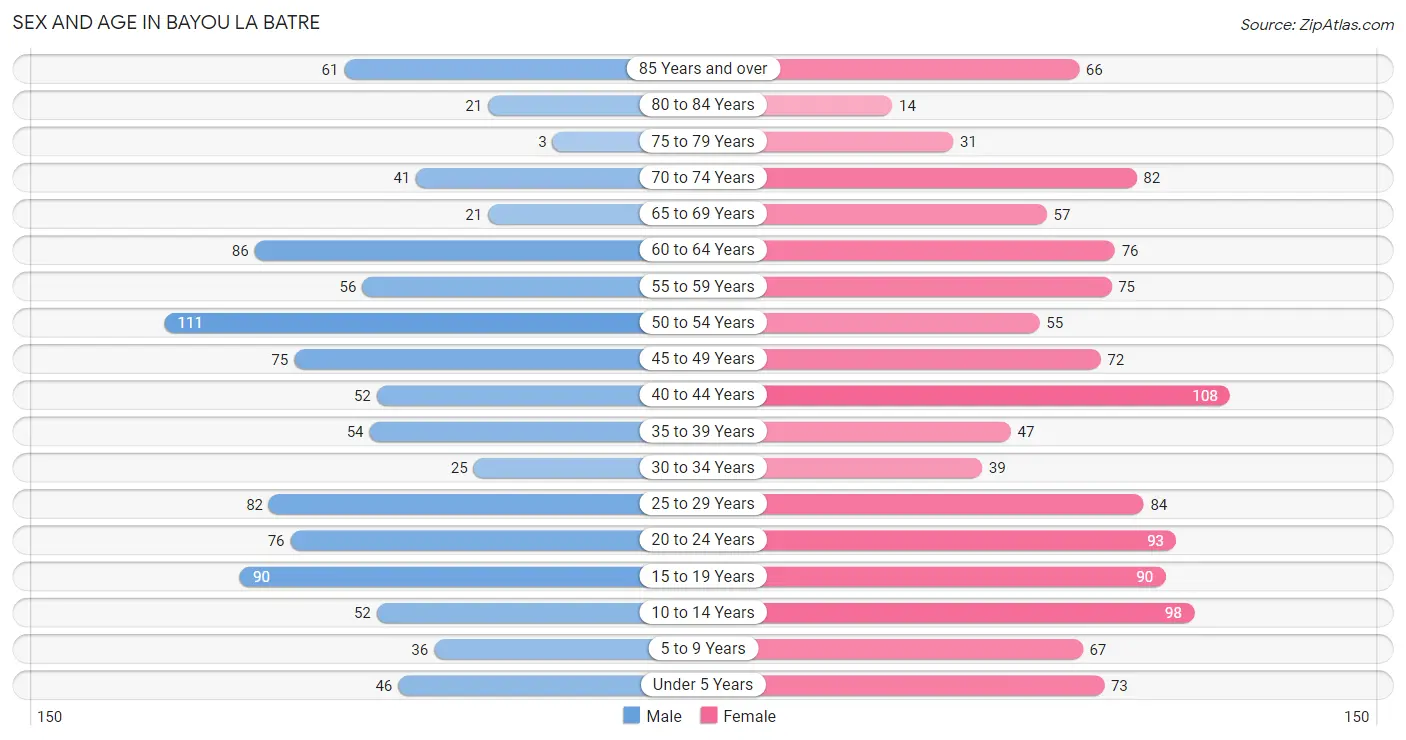
Sex and Age in Bayou La Batre
Sex and Age in Bayou La Batre
The most populous age groups in Bayou La Batre are 50 to 54 Years (111 | 11.2%) for men and 40 to 44 Years (108 | 8.8%) for women.
| Age Bracket | Male | Female |
| Under 5 Years | 46 (4.7%) | 73 (5.9%) |
| 5 to 9 Years | 36 (3.6%) | 67 (5.5%) |
| 10 to 14 Years | 52 (5.3%) | 98 (8.0%) |
| 15 to 19 Years | 90 (9.1%) | 90 (7.3%) |
| 20 to 24 Years | 76 (7.7%) | 93 (7.6%) |
| 25 to 29 Years | 82 (8.3%) | 84 (6.9%) |
| 30 to 34 Years | 25 (2.5%) | 39 (3.2%) |
| 35 to 39 Years | 54 (5.5%) | 47 (3.8%) |
| 40 to 44 Years | 52 (5.3%) | 108 (8.8%) |
| 45 to 49 Years | 75 (7.6%) | 72 (5.9%) |
| 50 to 54 Years | 111 (11.2%) | 55 (4.5%) |
| 55 to 59 Years | 56 (5.7%) | 75 (6.1%) |
| 60 to 64 Years | 86 (8.7%) | 76 (6.2%) |
| 65 to 69 Years | 21 (2.1%) | 57 (4.6%) |
| 70 to 74 Years | 41 (4.2%) | 82 (6.7%) |
| 75 to 79 Years | 3 (0.3%) | 31 (2.5%) |
| 80 to 84 Years | 21 (2.1%) | 14 (1.1%) |
| 85 Years and over | 61 (6.2%) | 66 (5.4%) |
| Total | 988 (100.0%) | 1,227 (100.0%) |
Families and Households in Bayou La Batre
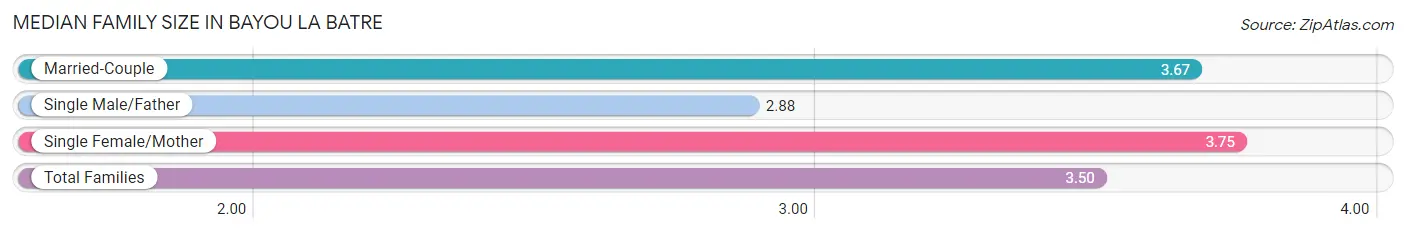
Median Family Size in Bayou La Batre
The median family size in Bayou La Batre is 3.50 persons per family, with single female/mother families (107 | 21.4%) accounting for the largest median family size of 3.75 persons per family. On the other hand, single male/father families (117 | 23.4%) represent the smallest median family size with 2.88 persons per family.
| Family Type | # Families | Family Size |
| Married-Couple | 275 (55.1%) | 3.67 |
| Single Male/Father | 117 (23.4%) | 2.88 |
| Single Female/Mother | 107 (21.4%) | 3.75 |
| Total Families | 499 (100.0%) | 3.50 |
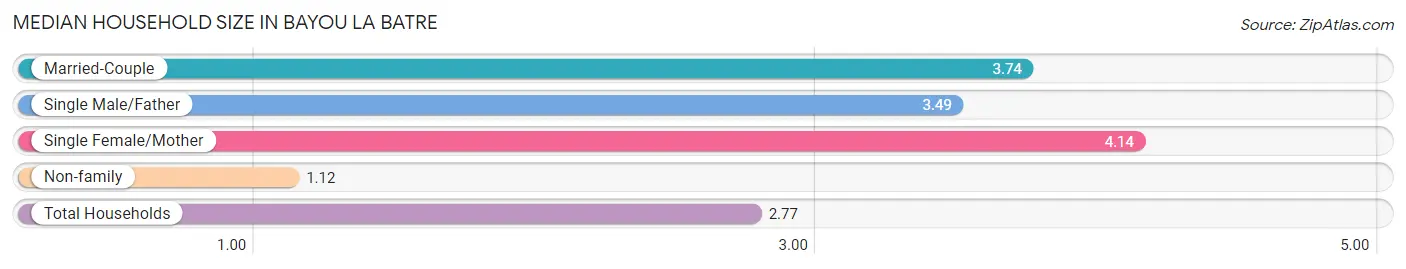
Median Household Size in Bayou La Batre
The median household size in Bayou La Batre is 2.77 persons per household, with single female/mother households (107 | 13.4%) accounting for the largest median household size of 4.14 persons per household. non-family households (301 | 37.6%) represent the smallest median household size with 1.12 persons per household.
| Household Type | # Households | Household Size |
| Married-Couple | 275 (34.4%) | 3.74 |
| Single Male/Father | 117 (14.6%) | 3.49 |
| Single Female/Mother | 107 (13.4%) | 4.14 |
| Non-family | 301 (37.6%) | 1.12 |
| Total Households | 800 (100.0%) | 2.77 |
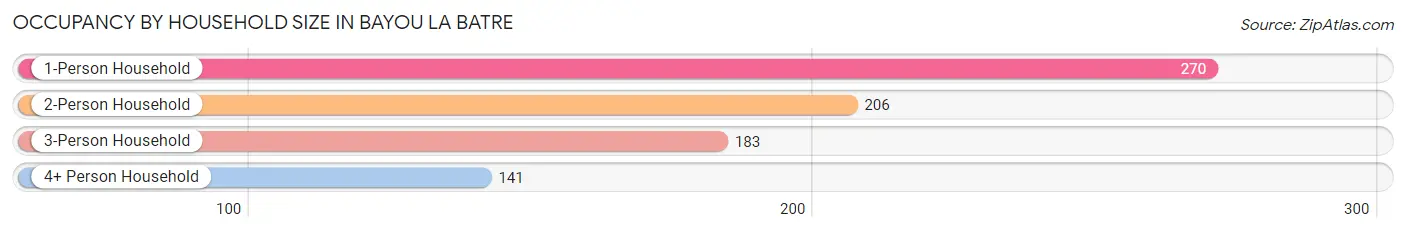
Household Size by Marriage Status in Bayou La Batre
Out of a total of 800 households in Bayou La Batre, 499 (62.4%) are family households, while 301 (37.6%) are nonfamily households. The most numerous type of family households are 3-person households, comprising 183, and the most common type of nonfamily households are 1-person households, comprising 270.
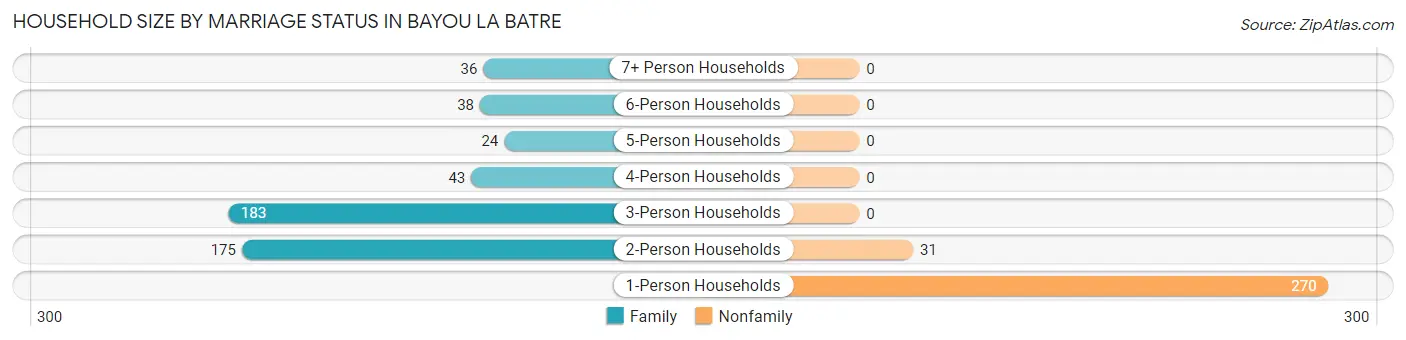
| Household Size | Family Households | Nonfamily Households |
| 1-Person Households | - | 270 (33.8%) |
| 2-Person Households | 175 (21.9%) | 31 (3.9%) |
| 3-Person Households | 183 (22.9%) | 0 (0.0%) |
| 4-Person Households | 43 (5.4%) | 0 (0.0%) |
| 5-Person Households | 24 (3.0%) | 0 (0.0%) |
| 6-Person Households | 38 (4.8%) | 0 (0.0%) |
| 7+ Person Households | 36 (4.5%) | 0 (0.0%) |
| Total | 499 (62.4%) | 301 (37.6%) |
Female Fertility in Bayou La Batre
Fertility by Age in Bayou La Batre
Average fertility rate in Bayou La Batre is 31.0 births per 1,000 women. Women in the age bracket of 20 to 34 years have the highest fertility rate with 42.0 births per 1,000 women. Women in the age bracket of 20 to 34 years acount for 52.9% of all women with births.
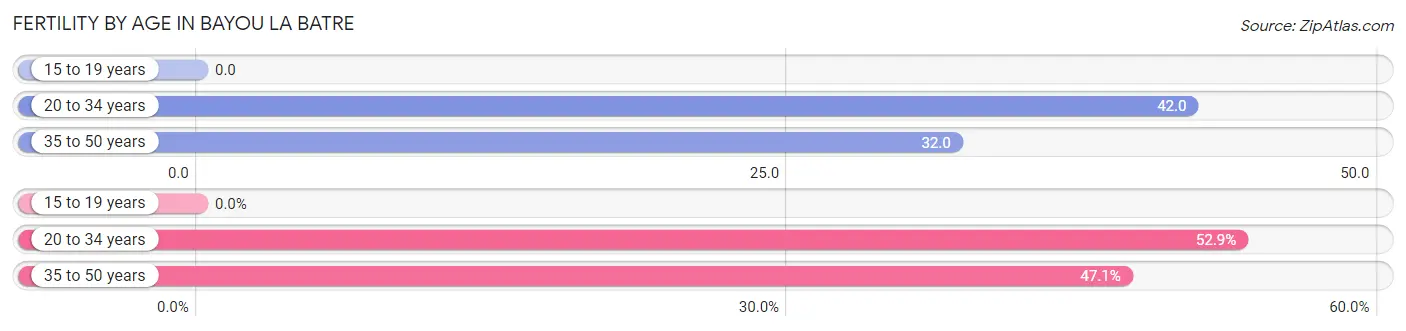
| Age Bracket | Women with Births | Births / 1,000 Women |
| 15 to 19 years | 0 (0.0%) | 0.0 |
| 20 to 34 years | 9 (52.9%) | 42.0 |
| 35 to 50 years | 8 (47.1%) | 32.0 |
| Total | 17 (100.0%) | 31.0 |
Fertility by Age by Marriage Status in Bayou La Batre
64.7% of women with births (17) in Bayou La Batre are married. The highest percentage of unmarried women with births falls into 20 to 34 years age bracket with 66.7% of them unmarried at the time of birth, while the lowest percentage of unmarried women with births belong to 35 to 50 years age bracket with 0.0% of them unmarried.
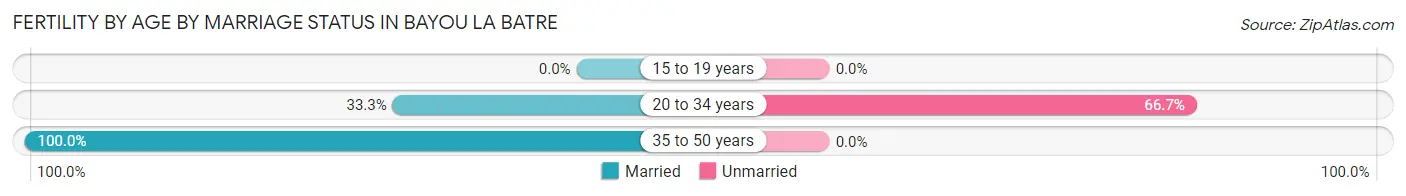
| Age Bracket | Married | Unmarried |
| 15 to 19 years | 0 (0.0%) | 0 (0.0%) |
| 20 to 34 years | 3 (33.3%) | 6 (66.7%) |
| 35 to 50 years | 8 (100.0%) | 0 (0.0%) |
| Total | 11 (64.7%) | 6 (35.3%) |
Fertility by Education in Bayou La Batre
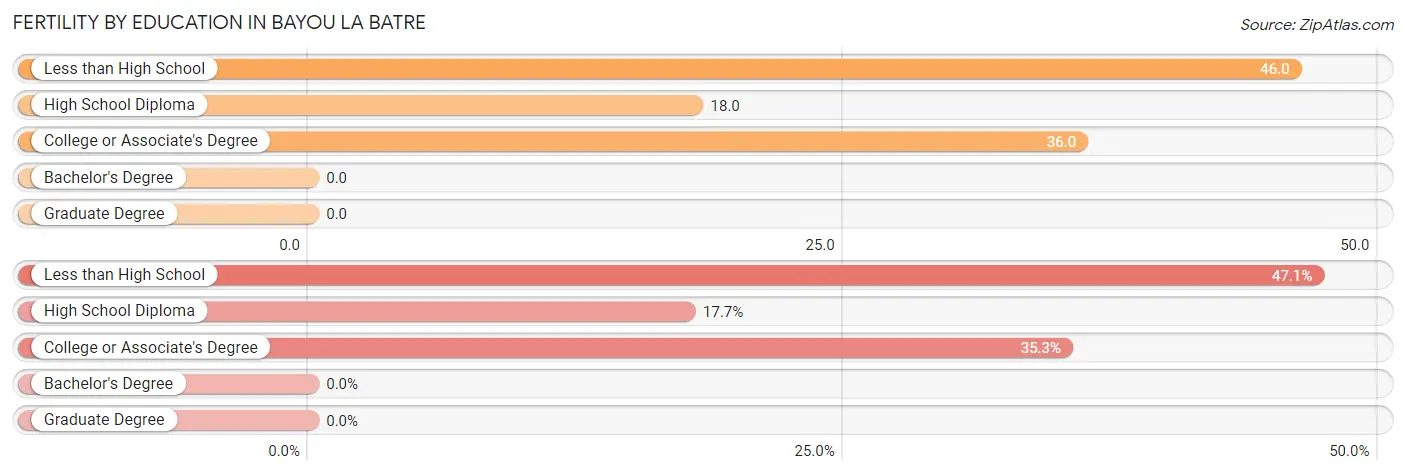
| Educational Attainment | Women with Births | Births / 1,000 Women |
| Less than High School | 8 (47.1%) | 46.0 |
| High School Diploma | 3 (17.6%) | 18.0 |
| College or Associate's Degree | 6 (35.3%) | 36.0 |
| Bachelor's Degree | 0 (0.0%) | 0.0 |
| Graduate Degree | 0 (0.0%) | 0.0 |
| Total | 17 (100.0%) | 31.0 |
Fertility by Education by Marriage Status in Bayou La Batre
35.3% of women with births in Bayou La Batre are unmarried. Women with the educational attainment of less than high school are most likely to be married with 100.0% of them married at childbirth, while women with the educational attainment of college or associate's degree are least likely to be married with 100.0% of them unmarried at childbirth.
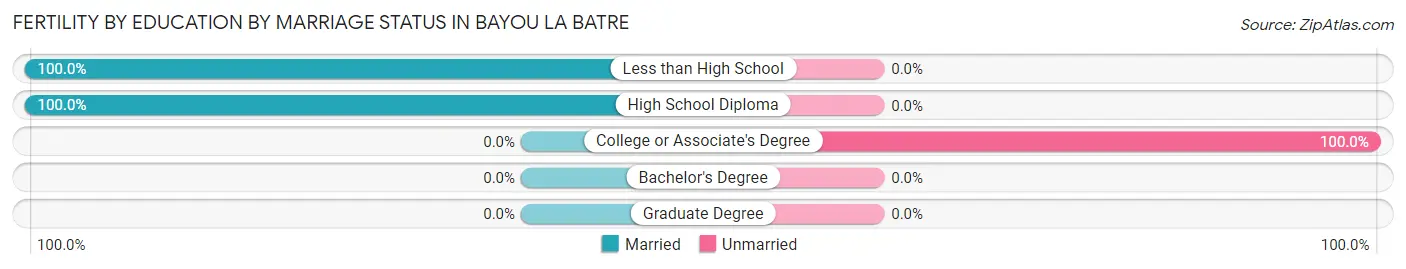
| Educational Attainment | Married | Unmarried |
| Less than High School | 8 (100.0%) | 0 (0.0%) |
| High School Diploma | 3 (100.0%) | 0 (0.0%) |
| College or Associate's Degree | 0 (0.0%) | 6 (100.0%) |
| Bachelor's Degree | 0 (0.0%) | 0 (0.0%) |
| Graduate Degree | 0 (0.0%) | 0 (0.0%) |
| Total | 11 (64.7%) | 6 (35.3%) |
Employment Characteristics in Bayou La Batre
Employment by Class of Employer in Bayou La Batre
Among the 835 employed individuals in Bayou La Batre, private company employees (688 | 82.4%), self-employed (not incorporated) (55 | 6.6%), and local government employees (35 | 4.2%) make up the most common classes of employment.
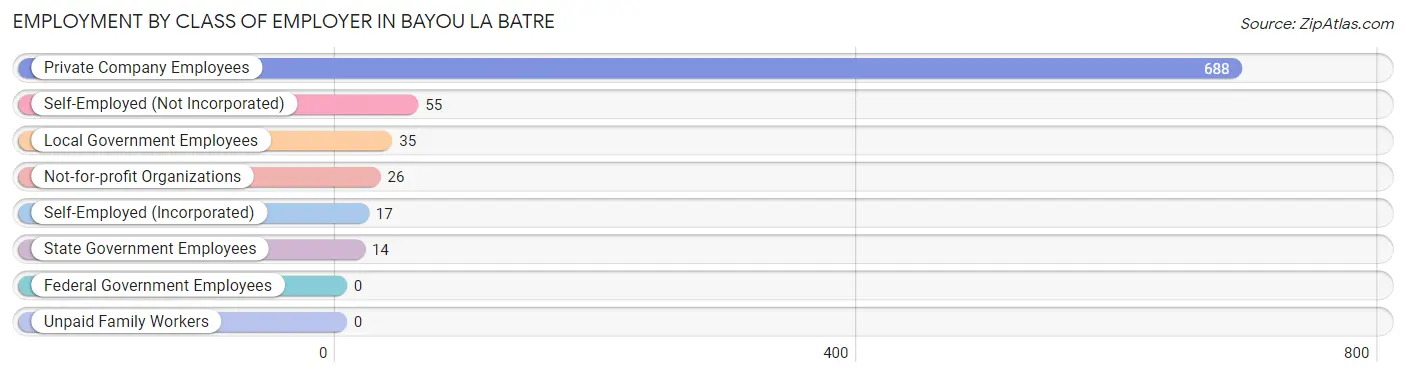
| Employer Class | # Employees | % Employees |
| Private Company Employees | 688 | 82.4% |
| Self-Employed (Incorporated) | 17 | 2.0% |
| Self-Employed (Not Incorporated) | 55 | 6.6% |
| Not-for-profit Organizations | 26 | 3.1% |
| Local Government Employees | 35 | 4.2% |
| State Government Employees | 14 | 1.7% |
| Federal Government Employees | 0 | 0.0% |
| Unpaid Family Workers | 0 | 0.0% |
| Total | 835 | 100.0% |
Employment Status by Age in Bayou La Batre
According to the labor force statistics for Bayou La Batre, out of the total population over 16 years of age (1,796), 48.1% or 864 individuals are in the labor force, with 2.4% or 21 of them unemployed. The age group with the highest labor force participation rate is 20 to 24 years, with 87.0% or 147 individuals in the labor force. Within the labor force, the 35 to 44 years age range has the highest percentage of unemployed individuals, with 16.5% or 21 of them being unemployed.
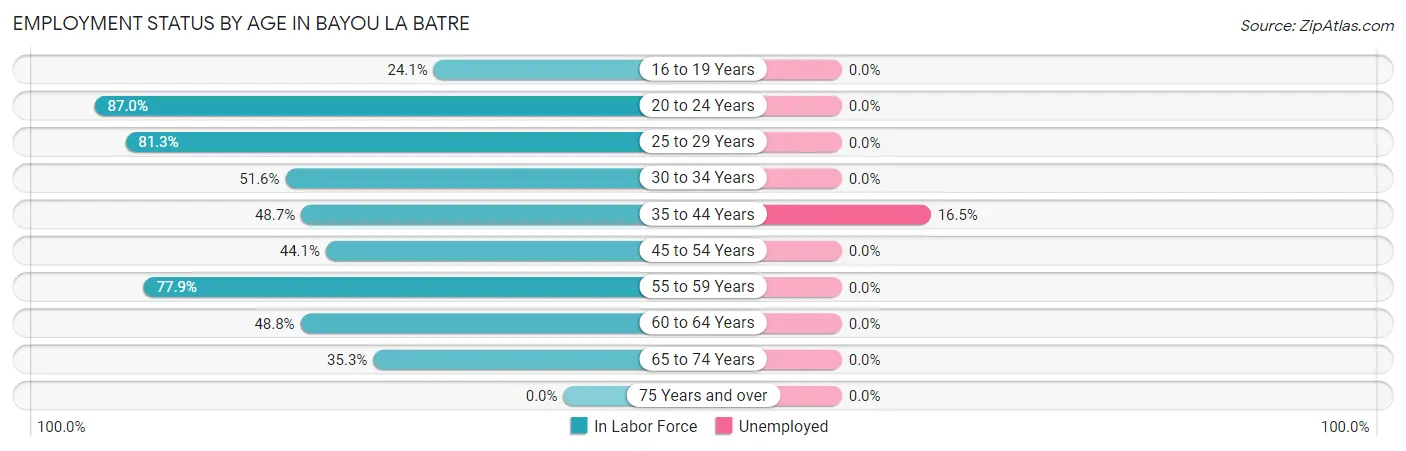
| Age Bracket | In Labor Force | Unemployed |
| 16 to 19 Years | 32 (24.1%) | 0 (0.0%) |
| 20 to 24 Years | 147 (87.0%) | 0 (0.0%) |
| 25 to 29 Years | 135 (81.3%) | 0 (0.0%) |
| 30 to 34 Years | 33 (51.6%) | 0 (0.0%) |
| 35 to 44 Years | 127 (48.7%) | 21 (16.5%) |
| 45 to 54 Years | 138 (44.1%) | 0 (0.0%) |
| 55 to 59 Years | 102 (77.9%) | 0 (0.0%) |
| 60 to 64 Years | 79 (48.8%) | 0 (0.0%) |
| 65 to 74 Years | 71 (35.3%) | 0 (0.0%) |
| 75 Years and over | 0 (0.0%) | 0 (0.0%) |
| Total | 864 (48.1%) | 21 (2.4%) |
Employment Status by Educational Attainment in Bayou La Batre
According to labor force statistics for Bayou La Batre, 56.0% of individuals (614) out of the total population between 25 and 64 years of age (1,097) are in the labor force, with 3.4% or 21 of them being unemployed. The group with the highest labor force participation rate are those with the educational attainment of bachelor's degree or higher, with 79.8% or 99 individuals in the labor force. Within the labor force, individuals with less than high school education have the highest percentage of unemployment, with 12.1% or 15 of them being unemployed.
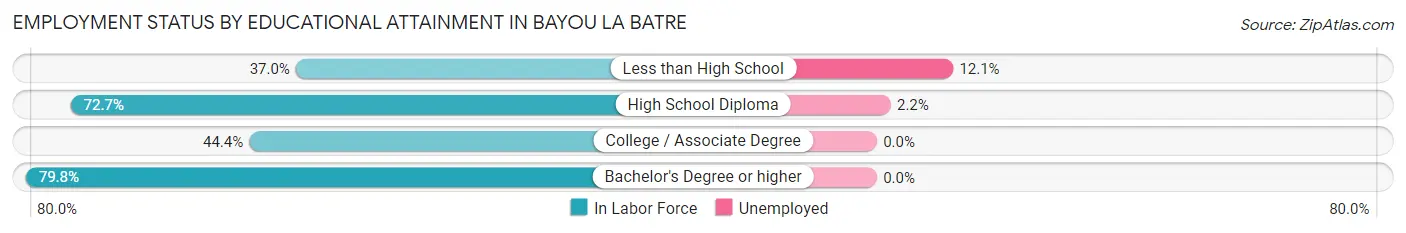
| Educational Attainment | In Labor Force | Unemployed |
| Less than High School | 124 (37.0%) | 41 (12.1%) |
| High School Diploma | 277 (72.7%) | 8 (2.2%) |
| College / Associate Degree | 114 (44.4%) | 0 (0.0%) |
| Bachelor's Degree or higher | 99 (79.8%) | 0 (0.0%) |
| Total | 614 (56.0%) | 37 (3.4%) |
Employment Occupations by Sex in Bayou La Batre
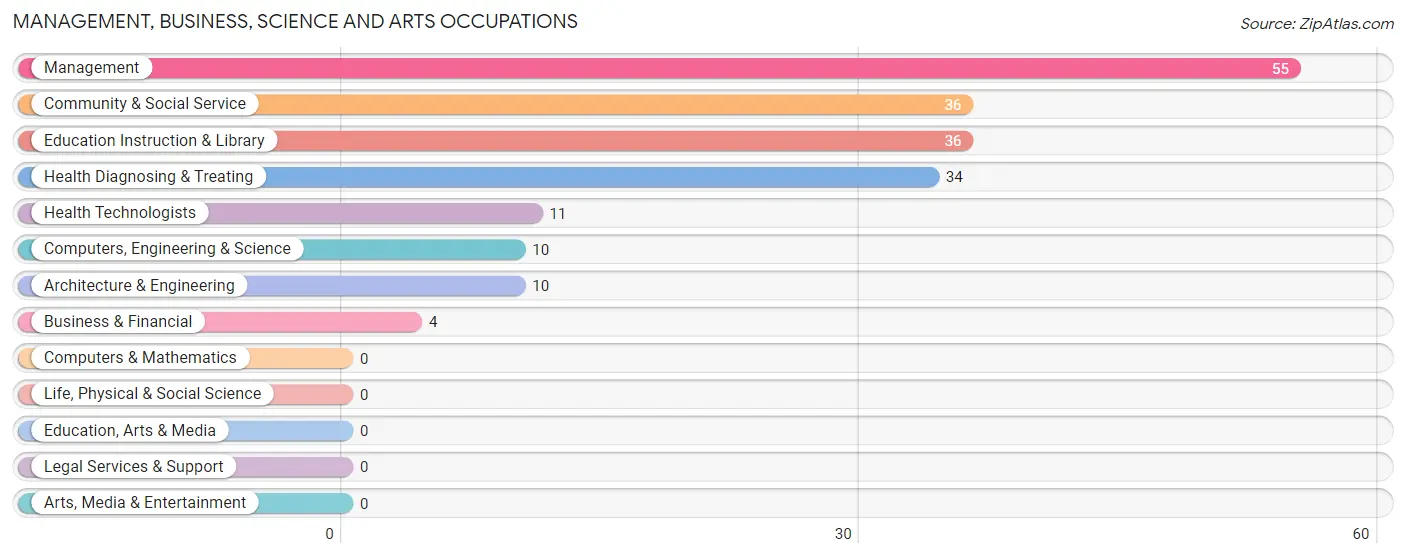
Management, Business, Science and Arts Occupations
The most common Management, Business, Science and Arts occupations in Bayou La Batre are Management (55 | 6.5%), Community & Social Service (36 | 4.3%), Education Instruction & Library (36 | 4.3%), Health Diagnosing & Treating (34 | 4.0%), and Health Technologists (11 | 1.3%).
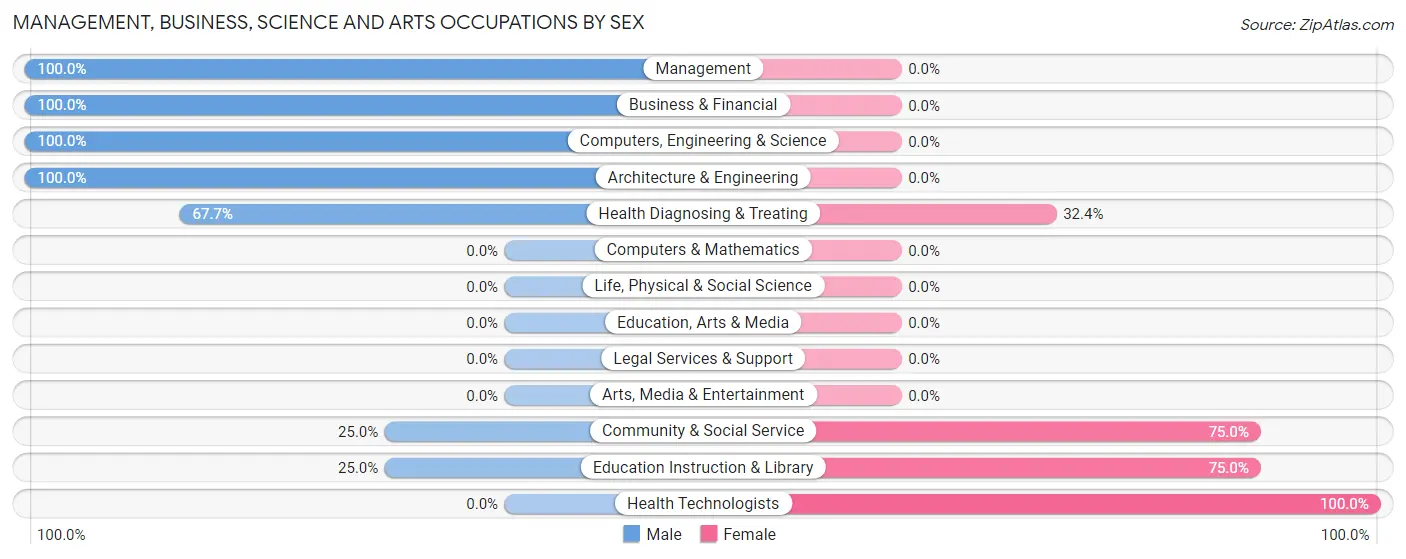
Management, Business, Science and Arts Occupations by Sex
Within the Management, Business, Science and Arts occupations in Bayou La Batre, the most male-oriented occupations are Management (100.0%), Business & Financial (100.0%), and Computers, Engineering & Science (100.0%), while the most female-oriented occupations are Health Technologists (100.0%), Community & Social Service (75.0%), and Education Instruction & Library (75.0%).
| Occupation | Male | Female |
| Management | 55 (100.0%) | 0 (0.0%) |
| Business & Financial | 4 (100.0%) | 0 (0.0%) |
| Computers, Engineering & Science | 10 (100.0%) | 0 (0.0%) |
| Computers & Mathematics | 0 (0.0%) | 0 (0.0%) |
| Architecture & Engineering | 10 (100.0%) | 0 (0.0%) |
| Life, Physical & Social Science | 0 (0.0%) | 0 (0.0%) |
| Community & Social Service | 9 (25.0%) | 27 (75.0%) |
| Education, Arts & Media | 0 (0.0%) | 0 (0.0%) |
| Legal Services & Support | 0 (0.0%) | 0 (0.0%) |
| Education Instruction & Library | 9 (25.0%) | 27 (75.0%) |
| Arts, Media & Entertainment | 0 (0.0%) | 0 (0.0%) |
| Health Diagnosing & Treating | 23 (67.6%) | 11 (32.4%) |
| Health Technologists | 0 (0.0%) | 11 (100.0%) |
| Total (Category) | 101 (72.7%) | 38 (27.3%) |
| Total (Overall) | 478 (56.7%) | 365 (43.3%) |
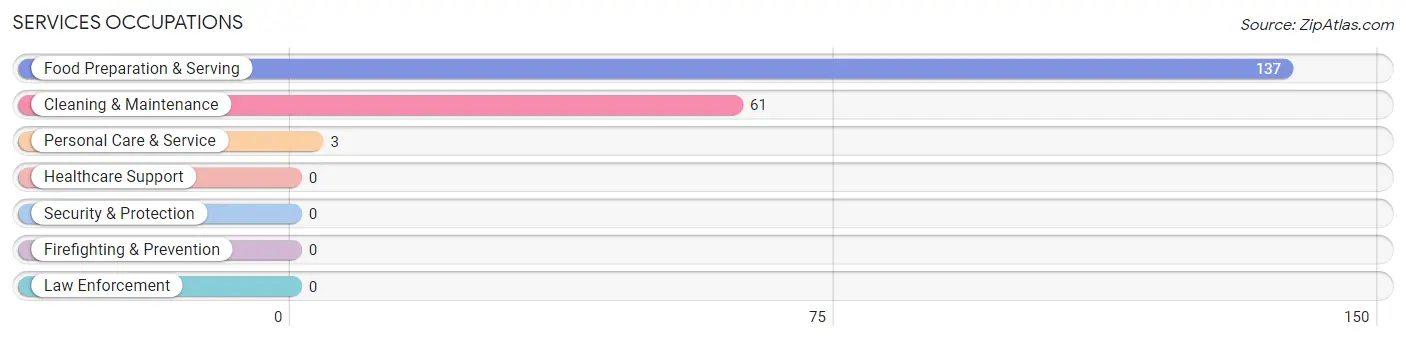
Services Occupations
The most common Services occupations in Bayou La Batre are Food Preparation & Serving (137 | 16.3%), Cleaning & Maintenance (61 | 7.2%), and Personal Care & Service (3 | 0.4%).
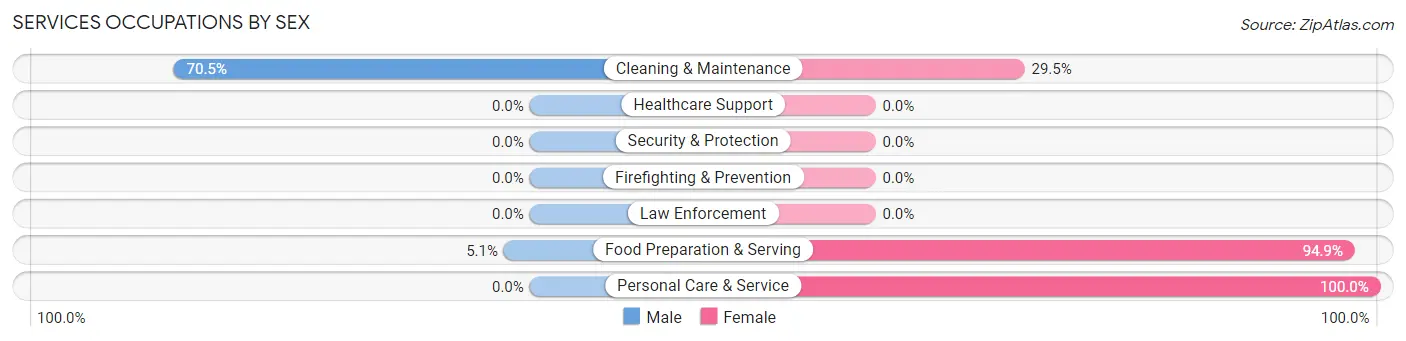
Services Occupations by Sex
Within the Services occupations in Bayou La Batre, the most male-oriented occupations are Cleaning & Maintenance (70.5%), and Food Preparation & Serving (5.1%), while the most female-oriented occupations are Personal Care & Service (100.0%), Food Preparation & Serving (94.9%), and Cleaning & Maintenance (29.5%).
| Occupation | Male | Female |
| Healthcare Support | 0 (0.0%) | 0 (0.0%) |
| Security & Protection | 0 (0.0%) | 0 (0.0%) |
| Firefighting & Prevention | 0 (0.0%) | 0 (0.0%) |
| Law Enforcement | 0 (0.0%) | 0 (0.0%) |
| Food Preparation & Serving | 7 (5.1%) | 130 (94.9%) |
| Cleaning & Maintenance | 43 (70.5%) | 18 (29.5%) |
| Personal Care & Service | 0 (0.0%) | 3 (100.0%) |
| Total (Category) | 50 (24.9%) | 151 (75.1%) |
| Total (Overall) | 478 (56.7%) | 365 (43.3%) |
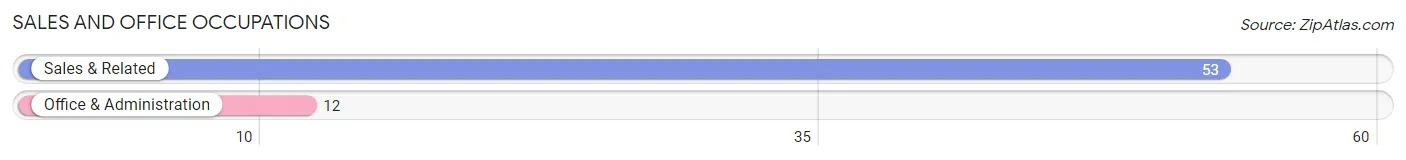
Sales and Office Occupations
The most common Sales and Office occupations in Bayou La Batre are Sales & Related (53 | 6.3%), and Office & Administration (12 | 1.4%).
Sales and Office Occupations by Sex
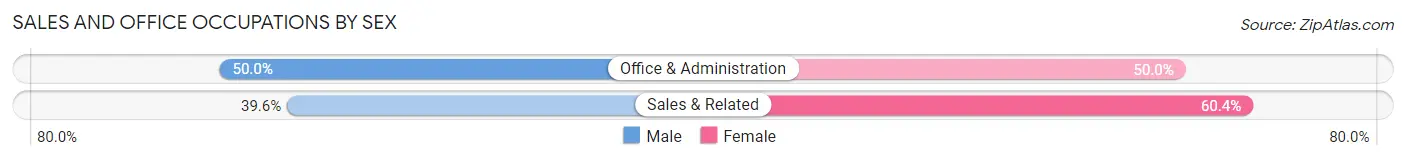
| Occupation | Male | Female |
| Sales & Related | 21 (39.6%) | 32 (60.4%) |
| Office & Administration | 6 (50.0%) | 6 (50.0%) |
| Total (Category) | 27 (41.5%) | 38 (58.5%) |
| Total (Overall) | 478 (56.7%) | 365 (43.3%) |
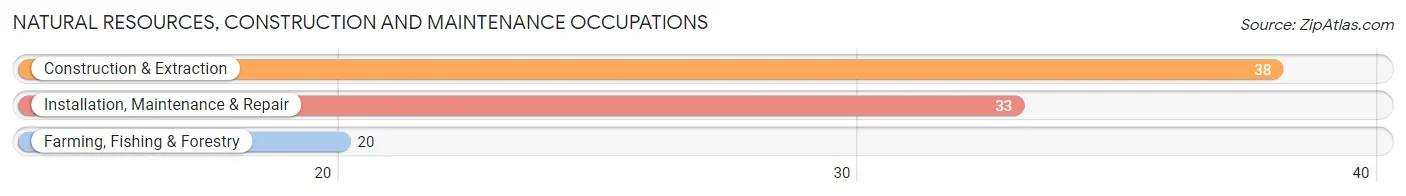
Natural Resources, Construction and Maintenance Occupations
The most common Natural Resources, Construction and Maintenance occupations in Bayou La Batre are Construction & Extraction (38 | 4.5%), Installation, Maintenance & Repair (33 | 3.9%), and Farming, Fishing & Forestry (20 | 2.4%).
Natural Resources, Construction and Maintenance Occupations by Sex
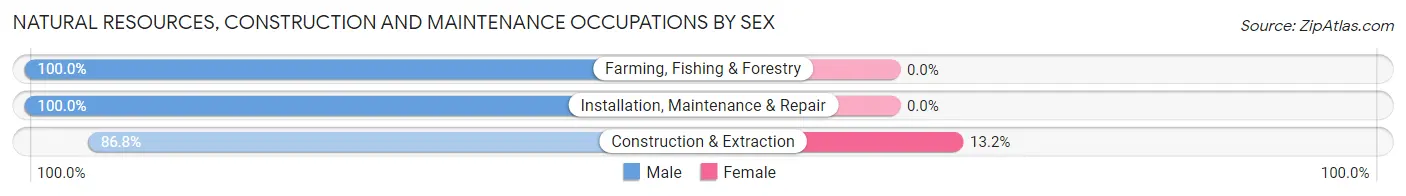
| Occupation | Male | Female |
| Farming, Fishing & Forestry | 20 (100.0%) | 0 (0.0%) |
| Construction & Extraction | 33 (86.8%) | 5 (13.2%) |
| Installation, Maintenance & Repair | 33 (100.0%) | 0 (0.0%) |
| Total (Category) | 86 (94.5%) | 5 (5.5%) |
| Total (Overall) | 478 (56.7%) | 365 (43.3%) |
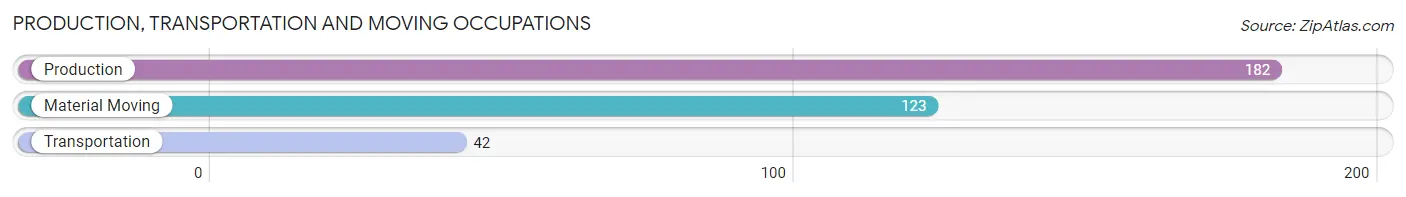
Production, Transportation and Moving Occupations
The most common Production, Transportation and Moving occupations in Bayou La Batre are Production (182 | 21.6%), Material Moving (123 | 14.6%), and Transportation (42 | 5.0%).
Production, Transportation and Moving Occupations by Sex
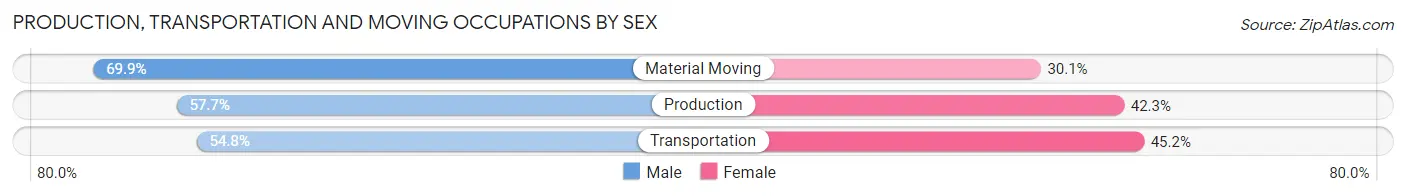
| Occupation | Male | Female |
| Production | 105 (57.7%) | 77 (42.3%) |
| Transportation | 23 (54.8%) | 19 (45.2%) |
| Material Moving | 86 (69.9%) | 37 (30.1%) |
| Total (Category) | 214 (61.7%) | 133 (38.3%) |
| Total (Overall) | 478 (56.7%) | 365 (43.3%) |
Employment Industries by Sex in Bayou La Batre
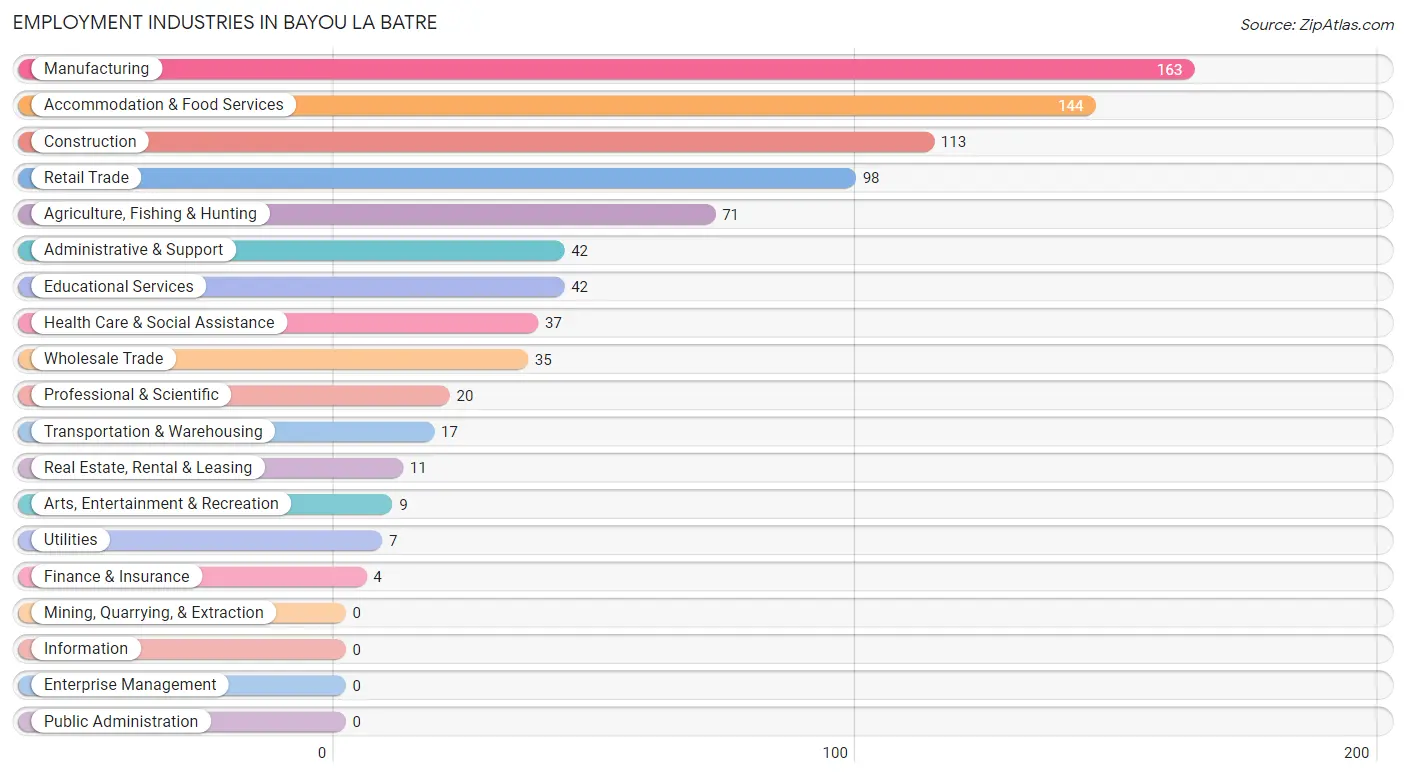
Employment Industries in Bayou La Batre
The major employment industries in Bayou La Batre include Manufacturing (163 | 19.3%), Accommodation & Food Services (144 | 17.1%), Construction (113 | 13.4%), Retail Trade (98 | 11.6%), and Agriculture, Fishing & Hunting (71 | 8.4%).
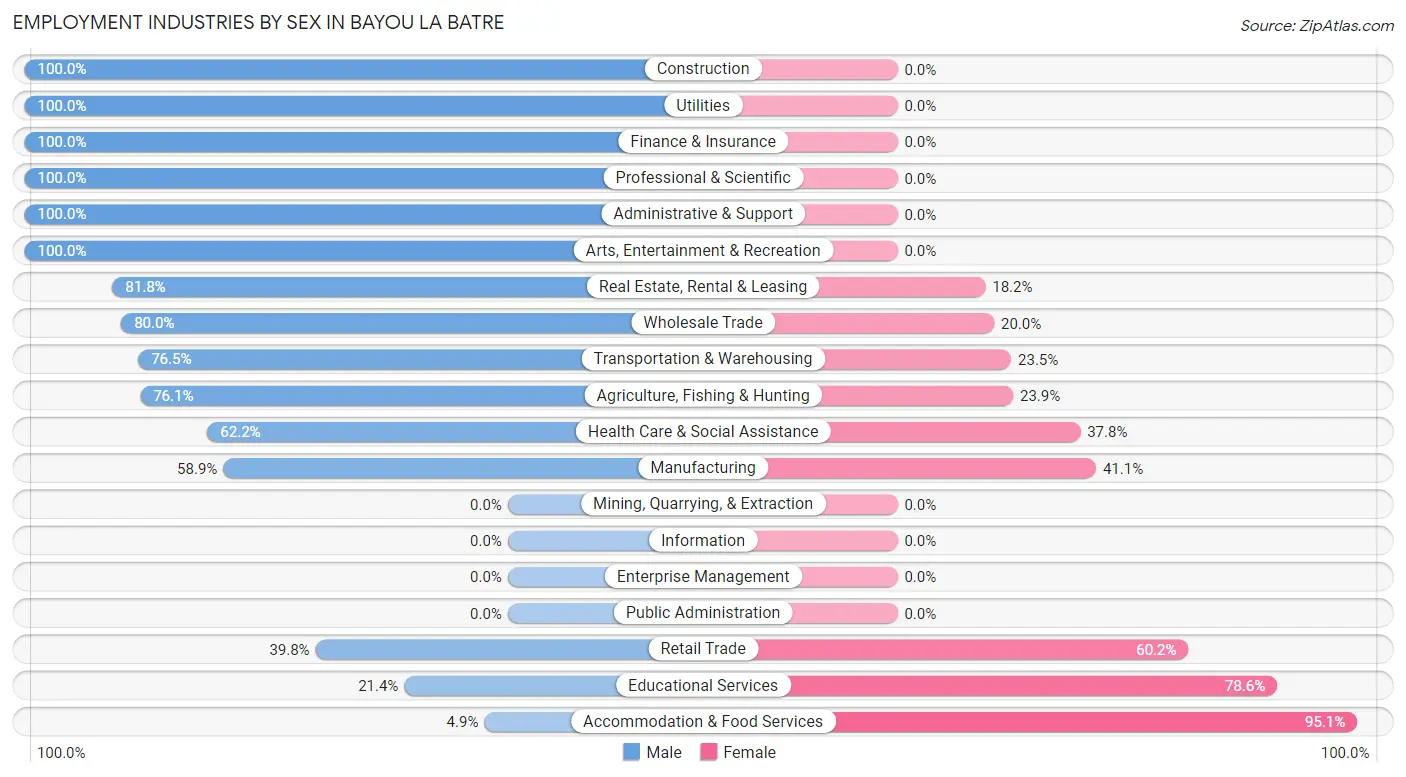
Employment Industries by Sex in Bayou La Batre
The Bayou La Batre industries that see more men than women are Construction (100.0%), Utilities (100.0%), and Finance & Insurance (100.0%), whereas the industries that tend to have a higher number of women are Accommodation & Food Services (95.1%), Educational Services (78.6%), and Retail Trade (60.2%).
| Industry | Male | Female |
| Agriculture, Fishing & Hunting | 54 (76.1%) | 17 (23.9%) |
| Mining, Quarrying, & Extraction | 0 (0.0%) | 0 (0.0%) |
| Construction | 113 (100.0%) | 0 (0.0%) |
| Manufacturing | 96 (58.9%) | 67 (41.1%) |
| Wholesale Trade | 28 (80.0%) | 7 (20.0%) |
| Retail Trade | 39 (39.8%) | 59 (60.2%) |
| Transportation & Warehousing | 13 (76.5%) | 4 (23.5%) |
| Utilities | 7 (100.0%) | 0 (0.0%) |
| Information | 0 (0.0%) | 0 (0.0%) |
| Finance & Insurance | 4 (100.0%) | 0 (0.0%) |
| Real Estate, Rental & Leasing | 9 (81.8%) | 2 (18.2%) |
| Professional & Scientific | 20 (100.0%) | 0 (0.0%) |
| Enterprise Management | 0 (0.0%) | 0 (0.0%) |
| Administrative & Support | 42 (100.0%) | 0 (0.0%) |
| Educational Services | 9 (21.4%) | 33 (78.6%) |
| Health Care & Social Assistance | 23 (62.2%) | 14 (37.8%) |
| Arts, Entertainment & Recreation | 9 (100.0%) | 0 (0.0%) |
| Accommodation & Food Services | 7 (4.9%) | 137 (95.1%) |
| Public Administration | 0 (0.0%) | 0 (0.0%) |
| Total | 478 (56.7%) | 365 (43.3%) |
Education in Bayou La Batre
School Enrollment in Bayou La Batre
The most common levels of schooling among the 509 students in Bayou La Batre are middle school (128 | 25.2%), college / undergraduate (121 | 23.8%), and elementary school (114 | 22.4%).
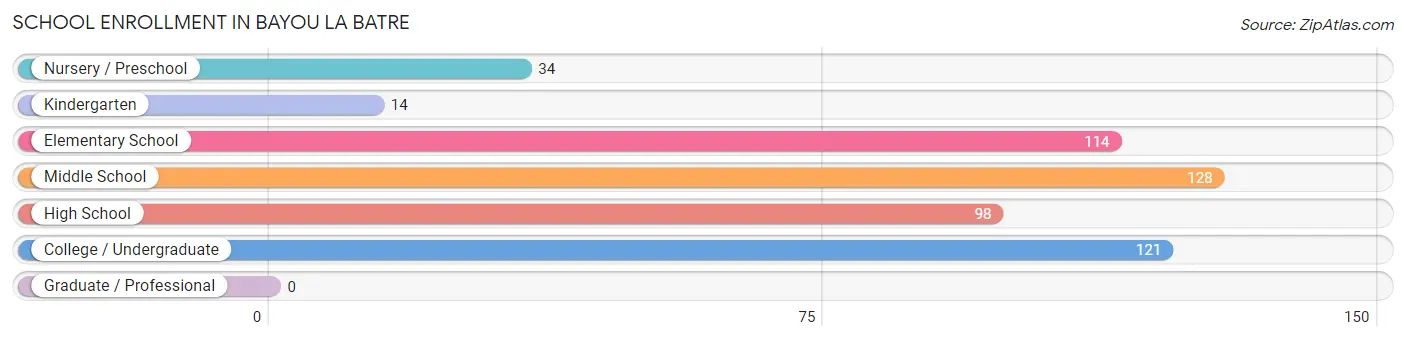
| School Level | # Students | % Students |
| Nursery / Preschool | 34 | 6.7% |
| Kindergarten | 14 | 2.8% |
| Elementary School | 114 | 22.4% |
| Middle School | 128 | 25.2% |
| High School | 98 | 19.3% |
| College / Undergraduate | 121 | 23.8% |
| Graduate / Professional | 0 | 0.0% |
| Total | 509 | 100.0% |
School Enrollment by Age by Funding Source in Bayou La Batre
Out of a total of 509 students who are enrolled in schools in Bayou La Batre, 51 (10.0%) attend a private institution, while the remaining 458 (90.0%) are enrolled in public schools. The age group of 15 to 17 year olds has the highest likelihood of being enrolled in private schools, with 21 (24.1% in the age bracket) enrolled. Conversely, the age group of 3 to 4 year olds has the lowest likelihood of being enrolled in a private school, with 34 (100.0% in the age bracket) attending a public institution.
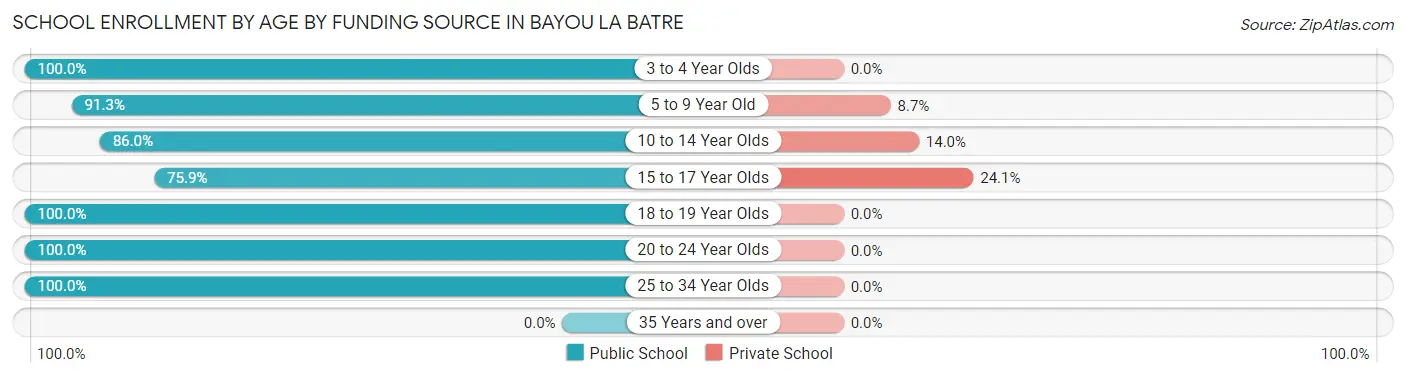
| Age Bracket | Public School | Private School |
| 3 to 4 Year Olds | 34 (100.0%) | 0 (0.0%) |
| 5 to 9 Year Old | 94 (91.3%) | 9 (8.7%) |
| 10 to 14 Year Olds | 129 (86.0%) | 21 (14.0%) |
| 15 to 17 Year Olds | 66 (75.9%) | 21 (24.1%) |
| 18 to 19 Year Olds | 55 (100.0%) | 0 (0.0%) |
| 20 to 24 Year Olds | 53 (100.0%) | 0 (0.0%) |
| 25 to 34 Year Olds | 27 (100.0%) | 0 (0.0%) |
| 35 Years and over | 0 (0.0%) | 0 (0.0%) |
| Total | 458 (90.0%) | 51 (10.0%) |
Educational Attainment by Field of Study in Bayou La Batre
Education (51 | 34.9%), science & technology (34 | 23.3%), business (32 | 21.9%), bio, nature & agricultural (14 | 9.6%), and engineering (10 | 6.9%) are the most common fields of study among 146 individuals in Bayou La Batre who have obtained a bachelor's degree or higher.
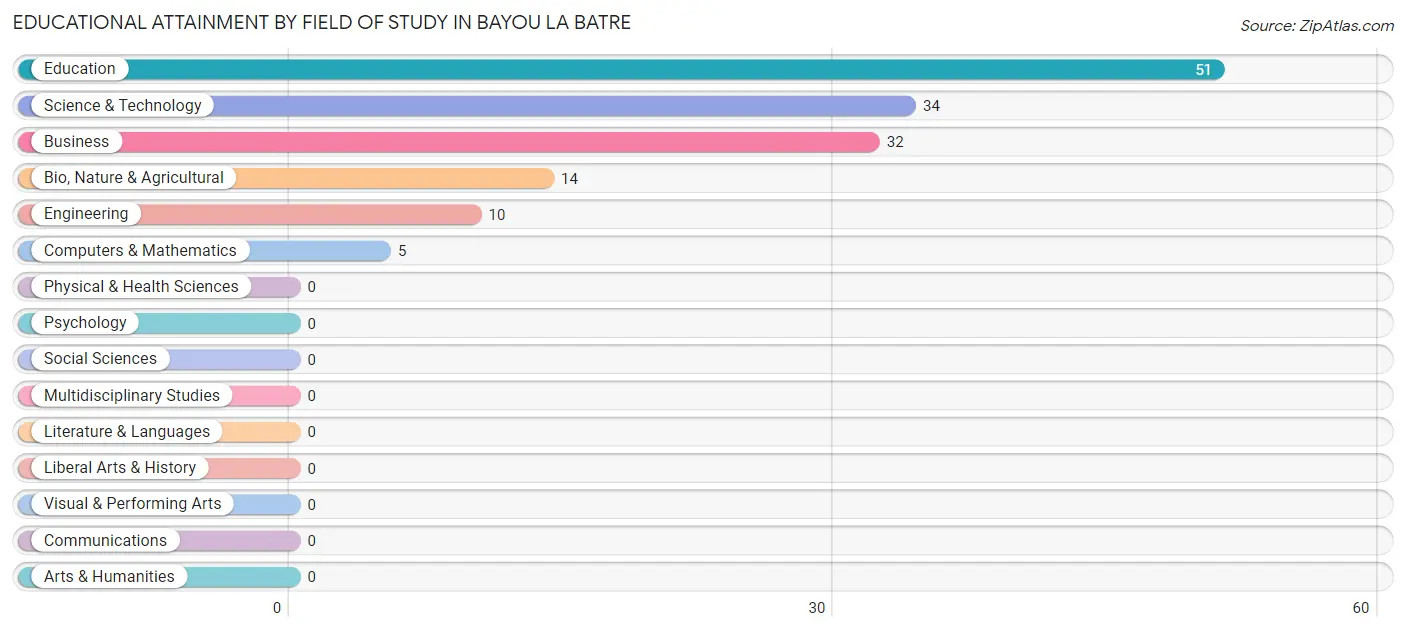
| Field of Study | # Graduates | % Graduates |
| Computers & Mathematics | 5 | 3.4% |
| Bio, Nature & Agricultural | 14 | 9.6% |
| Physical & Health Sciences | 0 | 0.0% |
| Psychology | 0 | 0.0% |
| Social Sciences | 0 | 0.0% |
| Engineering | 10 | 6.9% |
| Multidisciplinary Studies | 0 | 0.0% |
| Science & Technology | 34 | 23.3% |
| Business | 32 | 21.9% |
| Education | 51 | 34.9% |
| Literature & Languages | 0 | 0.0% |
| Liberal Arts & History | 0 | 0.0% |
| Visual & Performing Arts | 0 | 0.0% |
| Communications | 0 | 0.0% |
| Arts & Humanities | 0 | 0.0% |
| Total | 146 | 100.0% |
Transportation & Commute in Bayou La Batre
Vehicle Availability by Sex in Bayou La Batre
The most prevalent vehicle ownership categories in Bayou La Batre are males with 2 vehicles (191, accounting for 40.0%) and females with 2 vehicles (135, making up 53.5%).
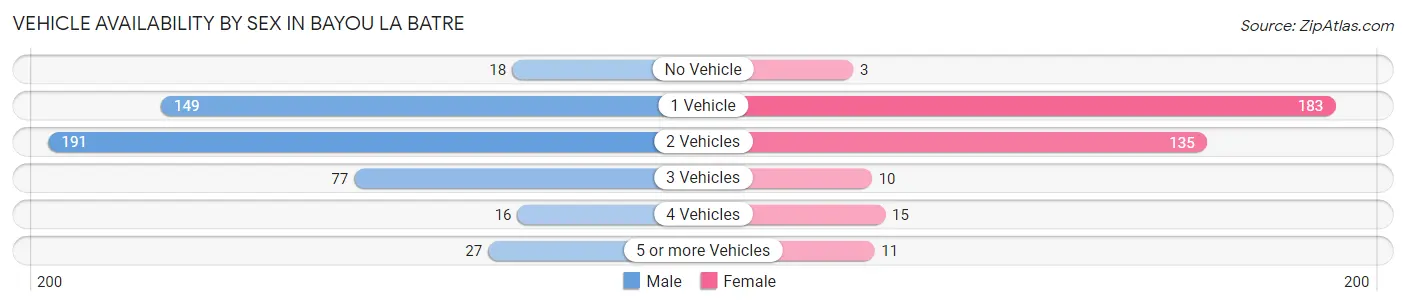
| Vehicles Available | Male | Female |
| No Vehicle | 18 (3.8%) | 3 (0.8%) |
| 1 Vehicle | 149 (31.2%) | 183 (51.3%) |
| 2 Vehicles | 191 (40.0%) | 135 (37.8%) |
| 3 Vehicles | 77 (16.1%) | 10 (2.8%) |
| 4 Vehicles | 16 (3.4%) | 15 (4.2%) |
| 5 or more Vehicles | 27 (5.7%) | 11 (3.1%) |
| Total | 478 (100.0%) | 357 (100.0%) |
Commute Time in Bayou La Batre
The most frequently occuring commute durations in Bayou La Batre are 5 to 9 minutes (210 commuters, 26.6%), 30 to 34 minutes (137 commuters, 17.4%), and 20 to 24 minutes (99 commuters, 12.6%).
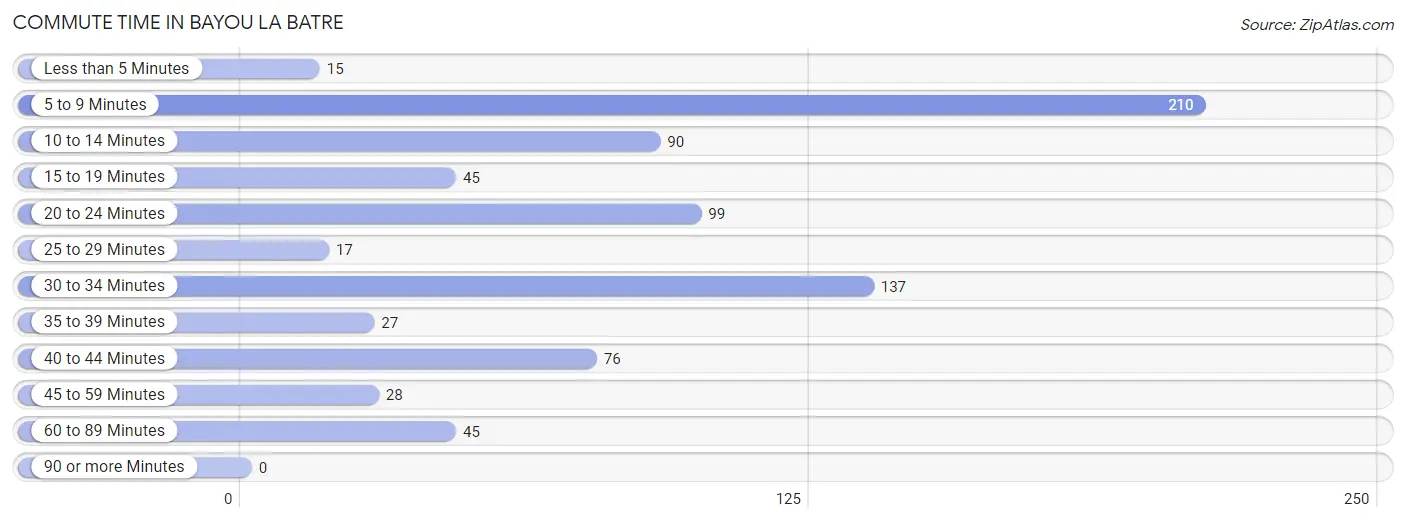
| Commute Time | # Commuters | % Commuters |
| Less than 5 Minutes | 15 | 1.9% |
| 5 to 9 Minutes | 210 | 26.6% |
| 10 to 14 Minutes | 90 | 11.4% |
| 15 to 19 Minutes | 45 | 5.7% |
| 20 to 24 Minutes | 99 | 12.6% |
| 25 to 29 Minutes | 17 | 2.1% |
| 30 to 34 Minutes | 137 | 17.4% |
| 35 to 39 Minutes | 27 | 3.4% |
| 40 to 44 Minutes | 76 | 9.6% |
| 45 to 59 Minutes | 28 | 3.5% |
| 60 to 89 Minutes | 45 | 5.7% |
| 90 or more Minutes | 0 | 0.0% |
Commute Time by Sex in Bayou La Batre
The most common commute times in Bayou La Batre are 30 to 34 minutes (91 commuters, 20.9%) for males and 5 to 9 minutes (125 commuters, 35.3%) for females.
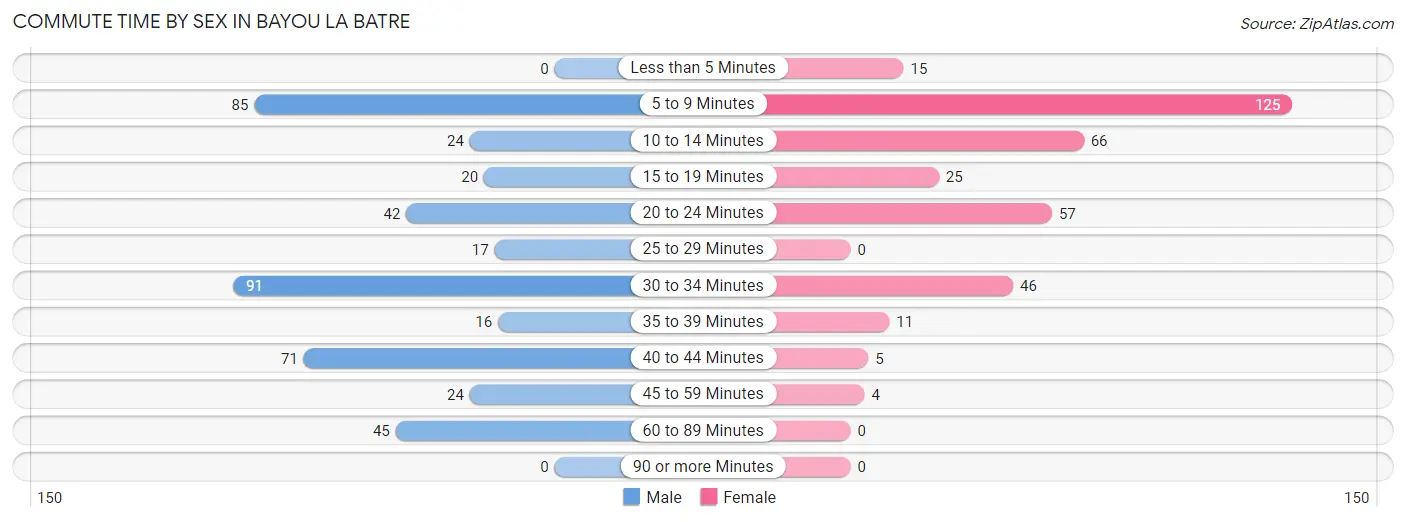
| Commute Time | Male | Female |
| Less than 5 Minutes | 0 (0.0%) | 15 (4.2%) |
| 5 to 9 Minutes | 85 (19.5%) | 125 (35.3%) |
| 10 to 14 Minutes | 24 (5.5%) | 66 (18.6%) |
| 15 to 19 Minutes | 20 (4.6%) | 25 (7.1%) |
| 20 to 24 Minutes | 42 (9.7%) | 57 (16.1%) |
| 25 to 29 Minutes | 17 (3.9%) | 0 (0.0%) |
| 30 to 34 Minutes | 91 (20.9%) | 46 (13.0%) |
| 35 to 39 Minutes | 16 (3.7%) | 11 (3.1%) |
| 40 to 44 Minutes | 71 (16.3%) | 5 (1.4%) |
| 45 to 59 Minutes | 24 (5.5%) | 4 (1.1%) |
| 60 to 89 Minutes | 45 (10.3%) | 0 (0.0%) |
| 90 or more Minutes | 0 (0.0%) | 0 (0.0%) |
Time of Departure to Work by Sex in Bayou La Batre
The most frequent times of departure to work in Bayou La Batre are 12:00 AM to 4:59 AM (97, 22.3%) for males and 12:00 AM to 4:59 AM (110, 31.1%) for females.
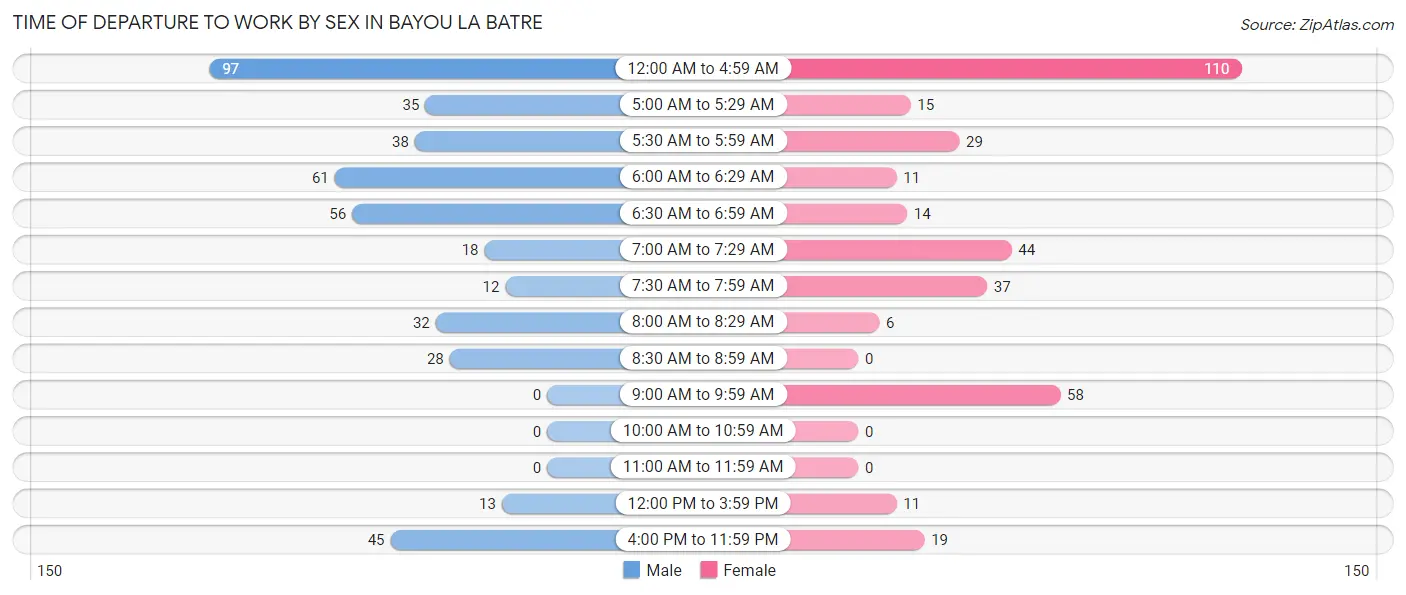
| Time of Departure | Male | Female |
| 12:00 AM to 4:59 AM | 97 (22.3%) | 110 (31.1%) |
| 5:00 AM to 5:29 AM | 35 (8.1%) | 15 (4.2%) |
| 5:30 AM to 5:59 AM | 38 (8.7%) | 29 (8.2%) |
| 6:00 AM to 6:29 AM | 61 (14.0%) | 11 (3.1%) |
| 6:30 AM to 6:59 AM | 56 (12.9%) | 14 (4.0%) |
| 7:00 AM to 7:29 AM | 18 (4.1%) | 44 (12.4%) |
| 7:30 AM to 7:59 AM | 12 (2.8%) | 37 (10.4%) |
| 8:00 AM to 8:29 AM | 32 (7.4%) | 6 (1.7%) |
| 8:30 AM to 8:59 AM | 28 (6.4%) | 0 (0.0%) |
| 9:00 AM to 9:59 AM | 0 (0.0%) | 58 (16.4%) |
| 10:00 AM to 10:59 AM | 0 (0.0%) | 0 (0.0%) |
| 11:00 AM to 11:59 AM | 0 (0.0%) | 0 (0.0%) |
| 12:00 PM to 3:59 PM | 13 (3.0%) | 11 (3.1%) |
| 4:00 PM to 11:59 PM | 45 (10.3%) | 19 (5.4%) |
| Total | 435 (100.0%) | 354 (100.0%) |
Housing Occupancy in Bayou La Batre
Occupancy by Ownership in Bayou La Batre
Of the total 800 dwellings in Bayou La Batre, owner-occupied units account for 431 (53.9%), while renter-occupied units make up 369 (46.1%).
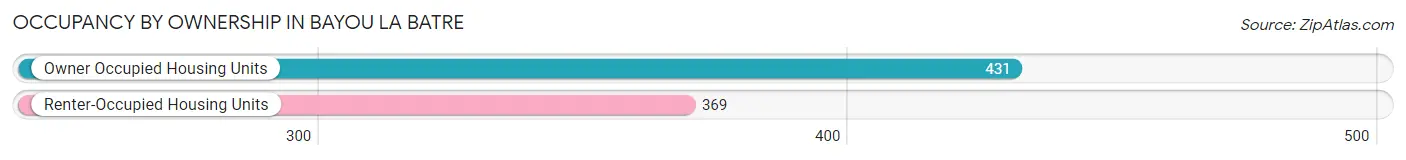
| Occupancy | # Housing Units | % Housing Units |
| Owner Occupied Housing Units | 431 | 53.9% |
| Renter-Occupied Housing Units | 369 | 46.1% |
| Total Occupied Housing Units | 800 | 100.0% |
Occupancy by Household Size in Bayou La Batre
| Household Size | # Housing Units | % Housing Units |
| 1-Person Household | 270 | 33.8% |
| 2-Person Household | 206 | 25.8% |
| 3-Person Household | 183 | 22.9% |
| 4+ Person Household | 141 | 17.6% |
| Total Housing Units | 800 | 100.0% |
Occupancy by Ownership by Household Size in Bayou La Batre
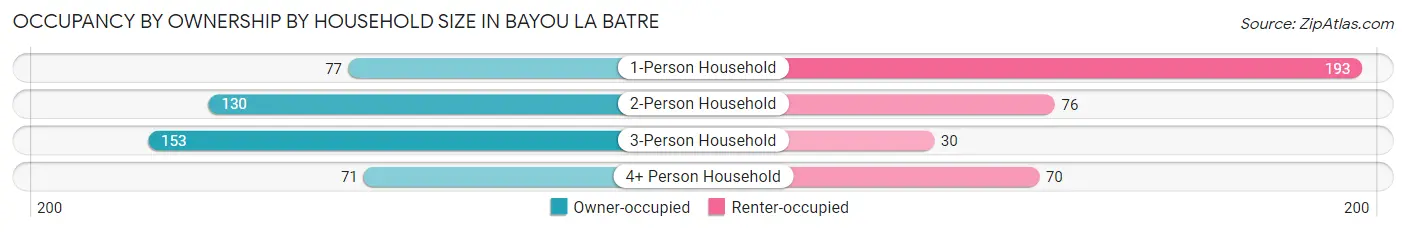
| Household Size | Owner-occupied | Renter-occupied |
| 1-Person Household | 77 (28.5%) | 193 (71.5%) |
| 2-Person Household | 130 (63.1%) | 76 (36.9%) |
| 3-Person Household | 153 (83.6%) | 30 (16.4%) |
| 4+ Person Household | 71 (50.3%) | 70 (49.6%) |
| Total Housing Units | 431 (53.9%) | 369 (46.1%) |
Occupancy by Educational Attainment in Bayou La Batre
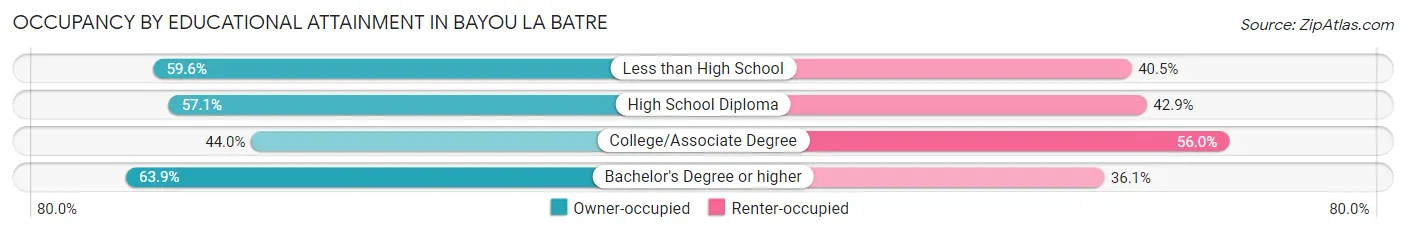
| Household Size | Owner-occupied | Renter-occupied |
| Less than High School | 131 (59.6%) | 89 (40.5%) |
| High School Diploma | 132 (57.1%) | 99 (42.9%) |
| College/Associate Degree | 122 (44.0%) | 155 (56.0%) |
| Bachelor's Degree or higher | 46 (63.9%) | 26 (36.1%) |
Occupancy by Age of Householder in Bayou La Batre
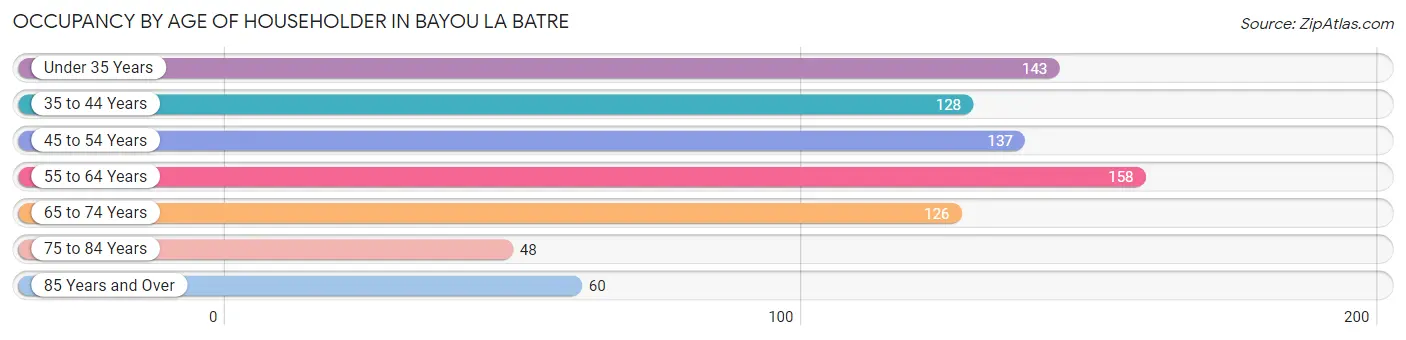
| Age Bracket | # Households | % Households |
| Under 35 Years | 143 | 17.9% |
| 35 to 44 Years | 128 | 16.0% |
| 45 to 54 Years | 137 | 17.1% |
| 55 to 64 Years | 158 | 19.8% |
| 65 to 74 Years | 126 | 15.8% |
| 75 to 84 Years | 48 | 6.0% |
| 85 Years and Over | 60 | 7.5% |
| Total | 800 | 100.0% |
Housing Finances in Bayou La Batre
Median Income by Occupancy in Bayou La Batre
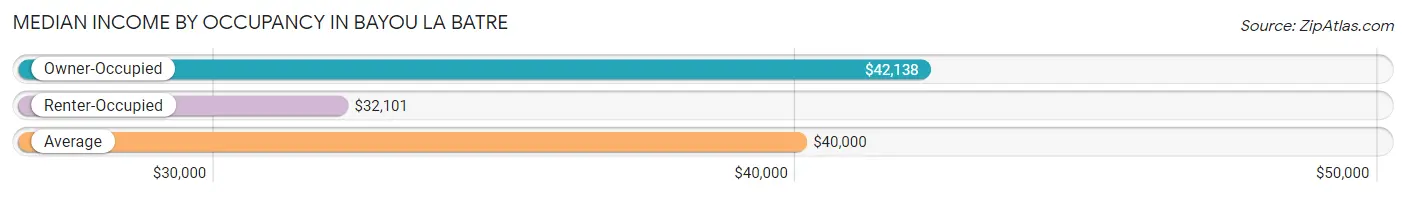
| Occupancy Type | # Households | Median Income |
| Owner-Occupied | 431 (53.9%) | $42,138 |
| Renter-Occupied | 369 (46.1%) | $32,101 |
| Average | 800 (100.0%) | $40,000 |
Occupancy by Householder Income Bracket in Bayou La Batre
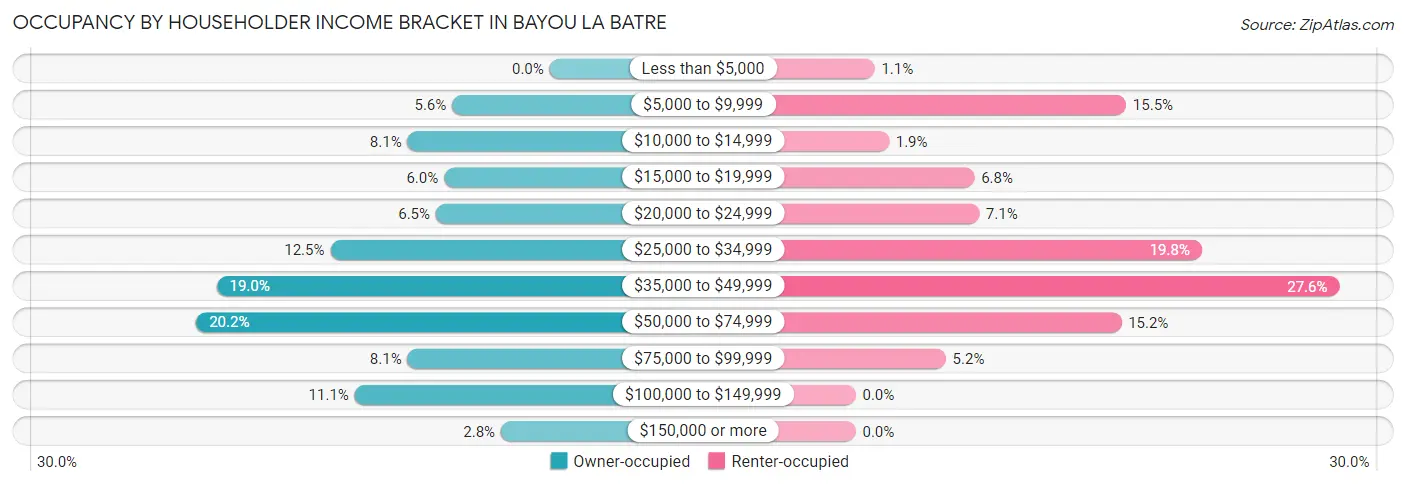
| Income Bracket | Owner-occupied | Renter-occupied |
| Less than $5,000 | 0 (0.0%) | 4 (1.1%) |
| $5,000 to $9,999 | 24 (5.6%) | 57 (15.4%) |
| $10,000 to $14,999 | 35 (8.1%) | 7 (1.9%) |
| $15,000 to $19,999 | 26 (6.0%) | 25 (6.8%) |
| $20,000 to $24,999 | 28 (6.5%) | 26 (7.0%) |
| $25,000 to $34,999 | 54 (12.5%) | 73 (19.8%) |
| $35,000 to $49,999 | 82 (19.0%) | 102 (27.6%) |
| $50,000 to $74,999 | 87 (20.2%) | 56 (15.2%) |
| $75,000 to $99,999 | 35 (8.1%) | 19 (5.1%) |
| $100,000 to $149,999 | 48 (11.1%) | 0 (0.0%) |
| $150,000 or more | 12 (2.8%) | 0 (0.0%) |
| Total | 431 (100.0%) | 369 (100.0%) |
Monthly Housing Cost Tiers in Bayou La Batre
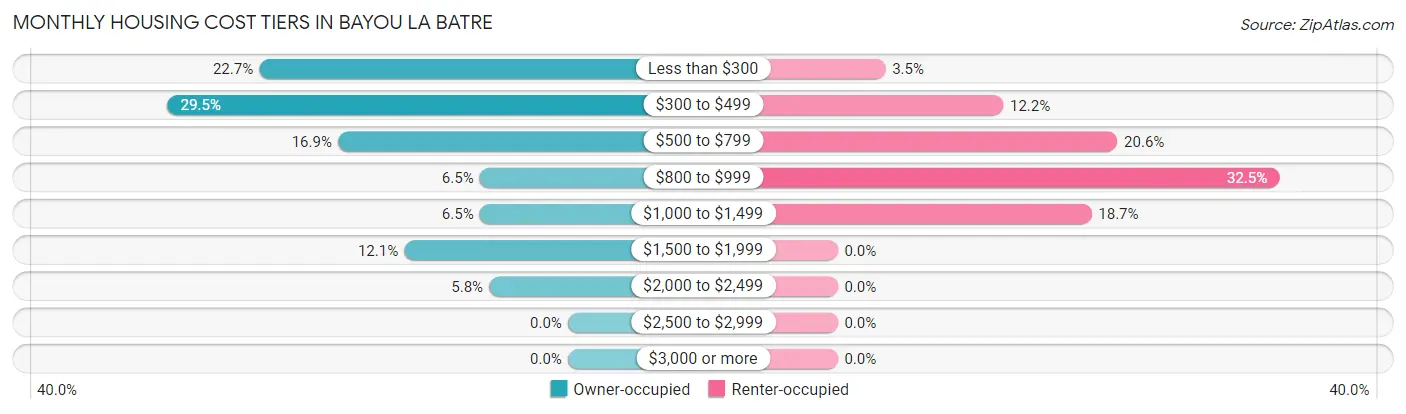
| Monthly Cost | Owner-occupied | Renter-occupied |
| Less than $300 | 98 (22.7%) | 13 (3.5%) |
| $300 to $499 | 127 (29.5%) | 45 (12.2%) |
| $500 to $799 | 73 (16.9%) | 76 (20.6%) |
| $800 to $999 | 28 (6.5%) | 120 (32.5%) |
| $1,000 to $1,499 | 28 (6.5%) | 69 (18.7%) |
| $1,500 to $1,999 | 52 (12.1%) | 0 (0.0%) |
| $2,000 to $2,499 | 25 (5.8%) | 0 (0.0%) |
| $2,500 to $2,999 | 0 (0.0%) | 0 (0.0%) |
| $3,000 or more | 0 (0.0%) | 0 (0.0%) |
| Total | 431 (100.0%) | 369 (100.0%) |
Physical Housing Characteristics in Bayou La Batre
Housing Structures in Bayou La Batre
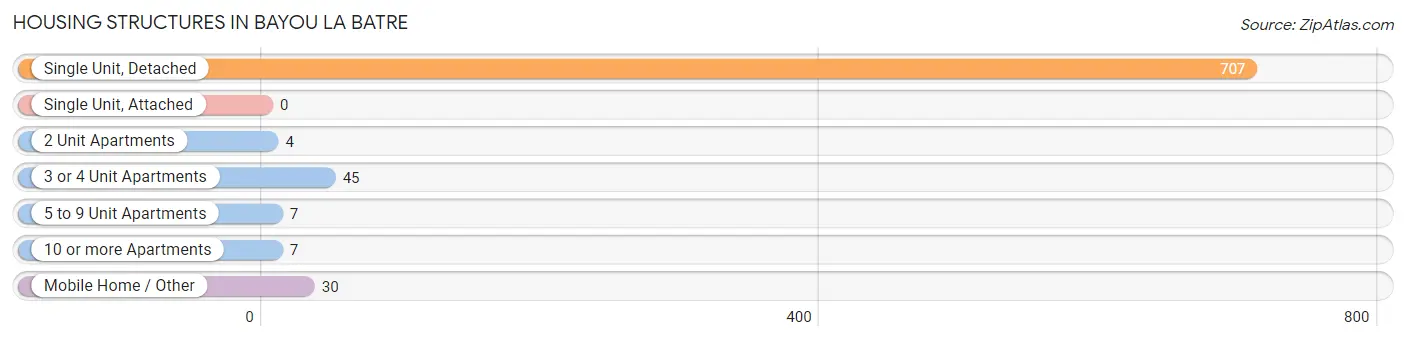
| Structure Type | # Housing Units | % Housing Units |
| Single Unit, Detached | 707 | 88.4% |
| Single Unit, Attached | 0 | 0.0% |
| 2 Unit Apartments | 4 | 0.5% |
| 3 or 4 Unit Apartments | 45 | 5.6% |
| 5 to 9 Unit Apartments | 7 | 0.9% |
| 10 or more Apartments | 7 | 0.9% |
| Mobile Home / Other | 30 | 3.7% |
| Total | 800 | 100.0% |
Housing Structures by Occupancy in Bayou La Batre
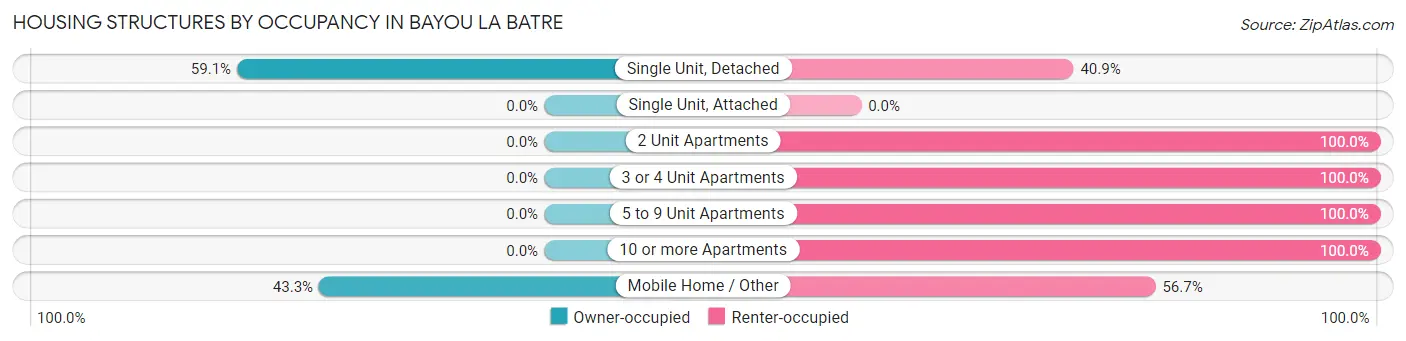
| Structure Type | Owner-occupied | Renter-occupied |
| Single Unit, Detached | 418 (59.1%) | 289 (40.9%) |
| Single Unit, Attached | 0 (0.0%) | 0 (0.0%) |
| 2 Unit Apartments | 0 (0.0%) | 4 (100.0%) |
| 3 or 4 Unit Apartments | 0 (0.0%) | 45 (100.0%) |
| 5 to 9 Unit Apartments | 0 (0.0%) | 7 (100.0%) |
| 10 or more Apartments | 0 (0.0%) | 7 (100.0%) |
| Mobile Home / Other | 13 (43.3%) | 17 (56.7%) |
| Total | 431 (53.9%) | 369 (46.1%) |
Housing Structures by Number of Rooms in Bayou La Batre
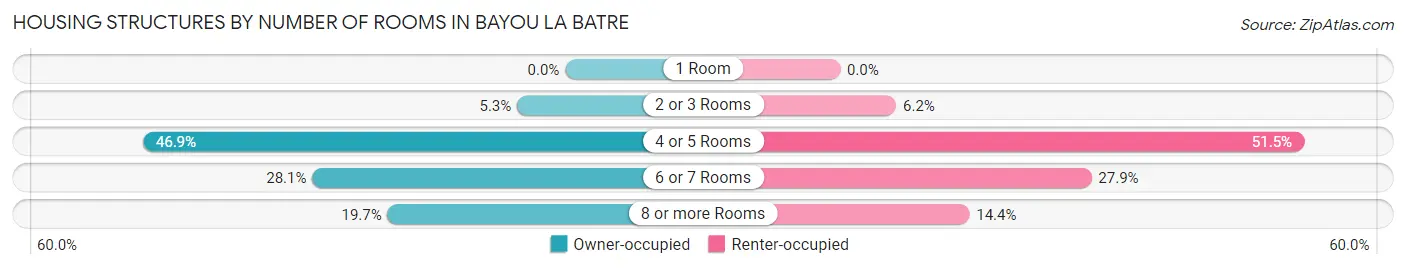
| Number of Rooms | Owner-occupied | Renter-occupied |
| 1 Room | 0 (0.0%) | 0 (0.0%) |
| 2 or 3 Rooms | 23 (5.3%) | 23 (6.2%) |
| 4 or 5 Rooms | 202 (46.9%) | 190 (51.5%) |
| 6 or 7 Rooms | 121 (28.1%) | 103 (27.9%) |
| 8 or more Rooms | 85 (19.7%) | 53 (14.4%) |
| Total | 431 (100.0%) | 369 (100.0%) |
Housing Structure by Heating Type in Bayou La Batre
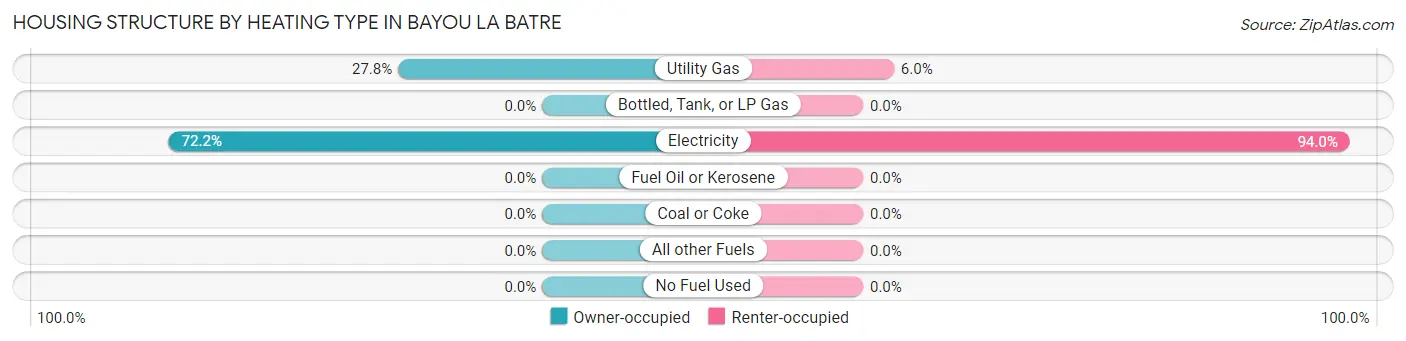
| Heating Type | Owner-occupied | Renter-occupied |
| Utility Gas | 120 (27.8%) | 22 (6.0%) |
| Bottled, Tank, or LP Gas | 0 (0.0%) | 0 (0.0%) |
| Electricity | 311 (72.2%) | 347 (94.0%) |
| Fuel Oil or Kerosene | 0 (0.0%) | 0 (0.0%) |
| Coal or Coke | 0 (0.0%) | 0 (0.0%) |
| All other Fuels | 0 (0.0%) | 0 (0.0%) |
| No Fuel Used | 0 (0.0%) | 0 (0.0%) |
| Total | 431 (100.0%) | 369 (100.0%) |
Household Vehicle Usage in Bayou La Batre
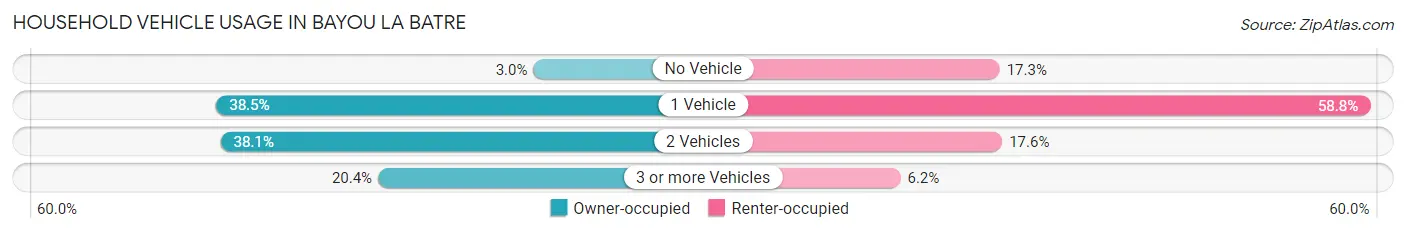
| Vehicles per Household | Owner-occupied | Renter-occupied |
| No Vehicle | 13 (3.0%) | 64 (17.3%) |
| 1 Vehicle | 166 (38.5%) | 217 (58.8%) |
| 2 Vehicles | 164 (38.1%) | 65 (17.6%) |
| 3 or more Vehicles | 88 (20.4%) | 23 (6.2%) |
| Total | 431 (100.0%) | 369 (100.0%) |
Real Estate & Mortgages in Bayou La Batre
Real Estate and Mortgage Overview in Bayou La Batre
| Characteristic | Without Mortgage | With Mortgage |
| Housing Units | 284 | 147 |
| Median Property Value | $69,400 | $112,900 |
| Median Household Income | $40,461 | $6 |
| Monthly Housing Costs | $342 | $0 |
| Real Estate Taxes | $337 | $16 |
Property Value by Mortgage Status in Bayou La Batre
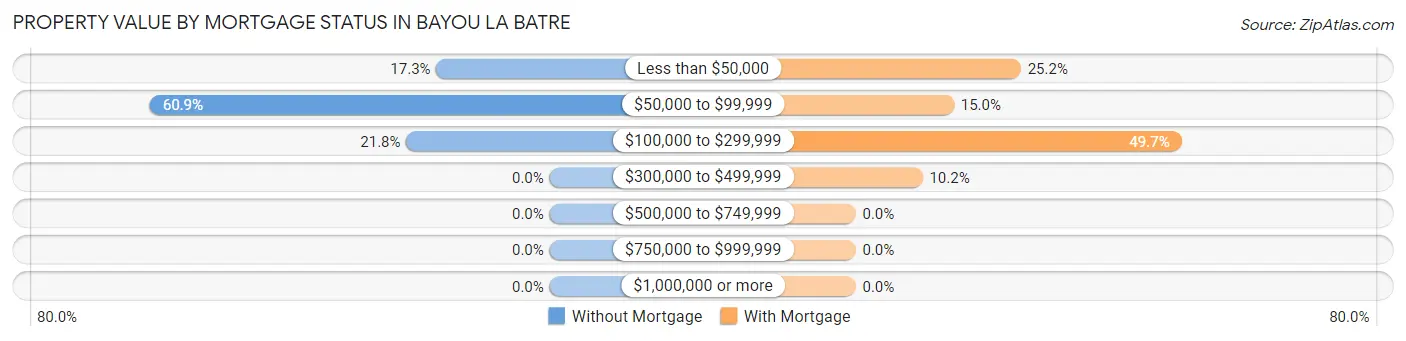
| Property Value | Without Mortgage | With Mortgage |
| Less than $50,000 | 49 (17.2%) | 37 (25.2%) |
| $50,000 to $99,999 | 173 (60.9%) | 22 (15.0%) |
| $100,000 to $299,999 | 62 (21.8%) | 73 (49.7%) |
| $300,000 to $499,999 | 0 (0.0%) | 15 (10.2%) |
| $500,000 to $749,999 | 0 (0.0%) | 0 (0.0%) |
| $750,000 to $999,999 | 0 (0.0%) | 0 (0.0%) |
| $1,000,000 or more | 0 (0.0%) | 0 (0.0%) |
| Total | 284 (100.0%) | 147 (100.0%) |
Household Income by Mortgage Status in Bayou La Batre
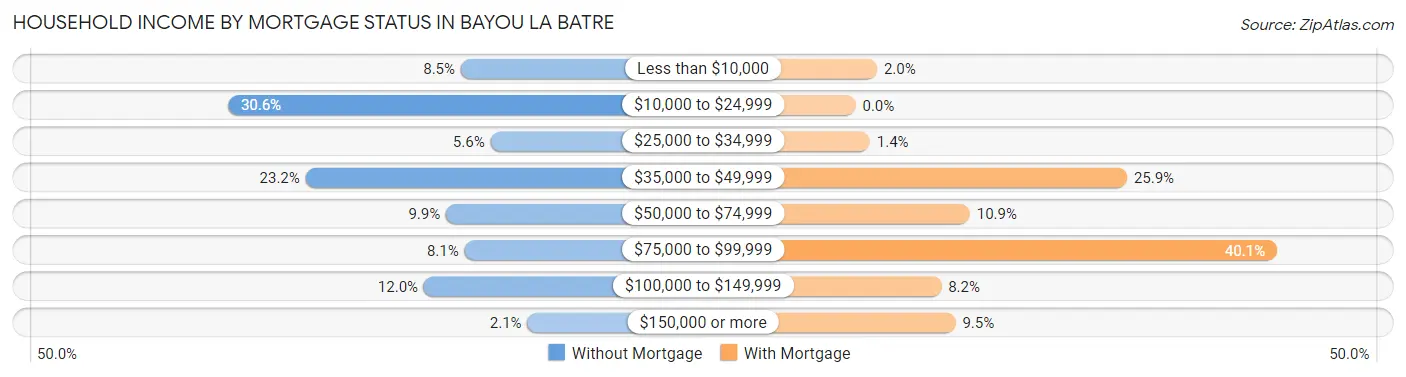
| Household Income | Without Mortgage | With Mortgage |
| Less than $10,000 | 24 (8.5%) | 3 (2.0%) |
| $10,000 to $24,999 | 87 (30.6%) | 0 (0.0%) |
| $25,000 to $34,999 | 16 (5.6%) | 2 (1.4%) |
| $35,000 to $49,999 | 66 (23.2%) | 38 (25.9%) |
| $50,000 to $74,999 | 28 (9.9%) | 16 (10.9%) |
| $75,000 to $99,999 | 23 (8.1%) | 59 (40.1%) |
| $100,000 to $149,999 | 34 (12.0%) | 12 (8.2%) |
| $150,000 or more | 6 (2.1%) | 14 (9.5%) |
| Total | 284 (100.0%) | 147 (100.0%) |
Property Value to Household Income Ratio in Bayou La Batre
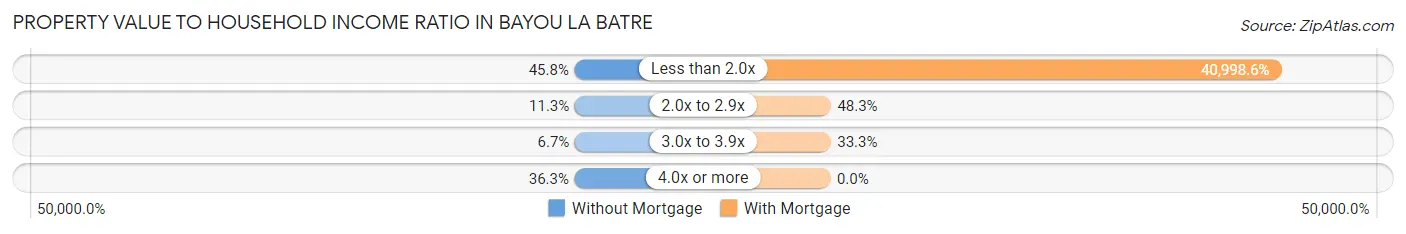
| Value-to-Income Ratio | Without Mortgage | With Mortgage |
| Less than 2.0x | 130 (45.8%) | 60,268 (40,998.6%) |
| 2.0x to 2.9x | 32 (11.3%) | 71 (48.3%) |
| 3.0x to 3.9x | 19 (6.7%) | 49 (33.3%) |
| 4.0x or more | 103 (36.3%) | 0 (0.0%) |
| Total | 284 (100.0%) | 147 (100.0%) |
Real Estate Taxes by Mortgage Status in Bayou La Batre
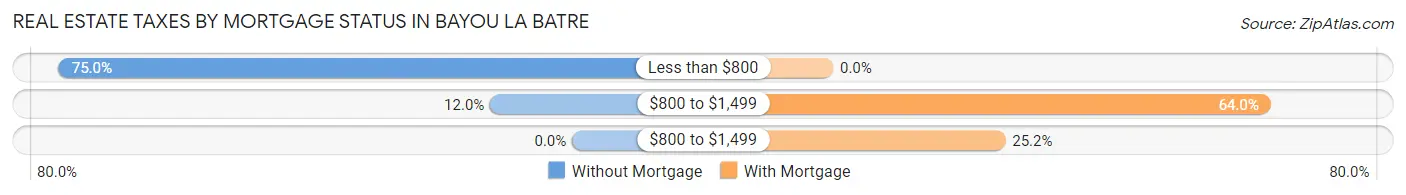
| Property Taxes | Without Mortgage | With Mortgage |
| Less than $800 | 213 (75.0%) | 0 (0.0%) |
| $800 to $1,499 | 34 (12.0%) | 94 (63.9%) |
| $800 to $1,499 | 0 (0.0%) | 37 (25.2%) |
| Total | 284 (100.0%) | 147 (100.0%) |
Health & Disability in Bayou La Batre
Health Insurance Coverage by Age in Bayou La Batre
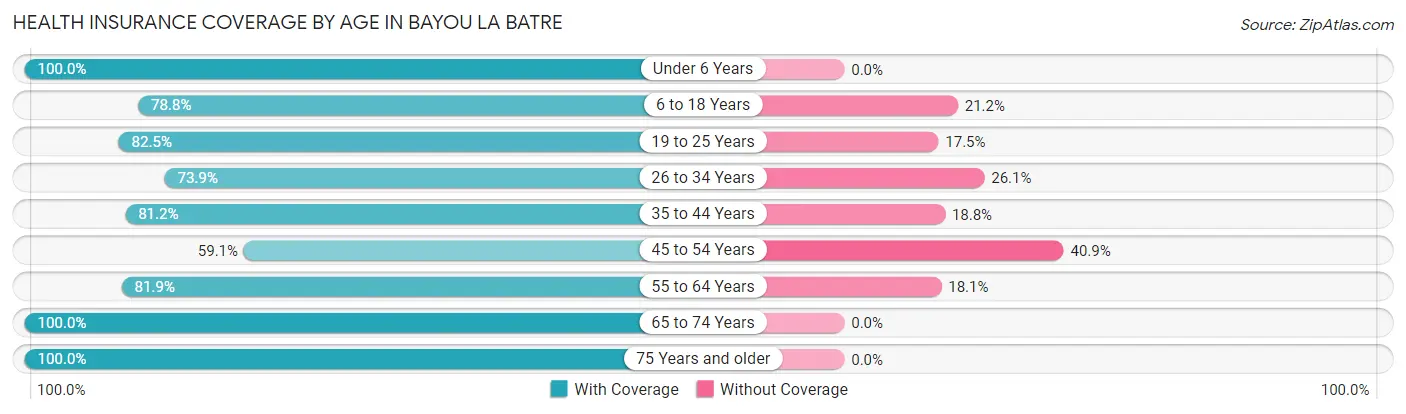
| Age Bracket | With Coverage | Without Coverage |
| Under 6 Years | 125 (100.0%) | 0 (0.0%) |
| 6 to 18 Years | 298 (78.8%) | 80 (21.2%) |
| 19 to 25 Years | 221 (82.5%) | 47 (17.5%) |
| 26 to 34 Years | 133 (73.9%) | 47 (26.1%) |
| 35 to 44 Years | 212 (81.2%) | 49 (18.8%) |
| 45 to 54 Years | 185 (59.1%) | 128 (40.9%) |
| 55 to 64 Years | 240 (81.9%) | 53 (18.1%) |
| 65 to 74 Years | 201 (100.0%) | 0 (0.0%) |
| 75 Years and older | 196 (100.0%) | 0 (0.0%) |
| Total | 1,811 (81.8%) | 404 (18.2%) |
Health Insurance Coverage by Citizenship Status in Bayou La Batre
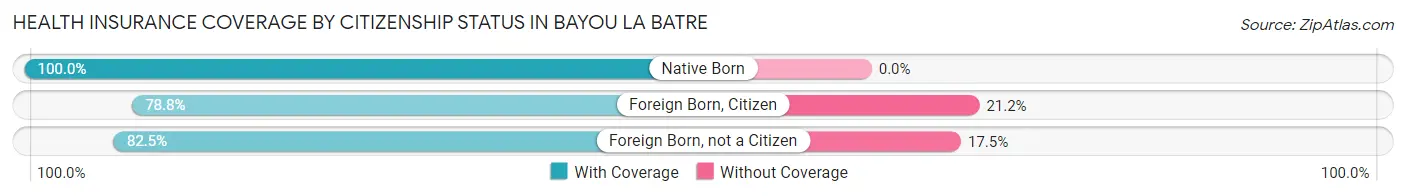
| Citizenship Status | With Coverage | Without Coverage |
| Native Born | 125 (100.0%) | 0 (0.0%) |
| Foreign Born, Citizen | 298 (78.8%) | 80 (21.2%) |
| Foreign Born, not a Citizen | 221 (82.5%) | 47 (17.5%) |
Health Insurance Coverage by Household Income in Bayou La Batre
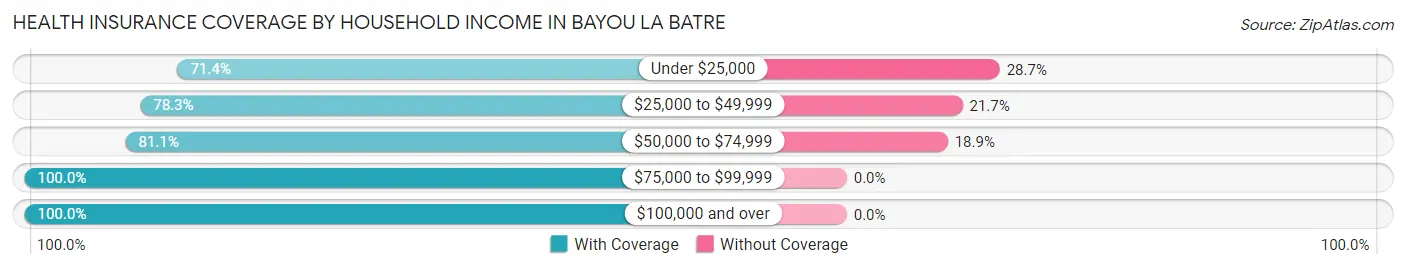
| Household Income | With Coverage | Without Coverage |
| Under $25,000 | 376 (71.4%) | 151 (28.6%) |
| $25,000 to $49,999 | 625 (78.3%) | 173 (21.7%) |
| $50,000 to $74,999 | 343 (81.1%) | 80 (18.9%) |
| $75,000 to $99,999 | 258 (100.0%) | 0 (0.0%) |
| $100,000 and over | 209 (100.0%) | 0 (0.0%) |
Public vs Private Health Insurance Coverage by Age in Bayou La Batre
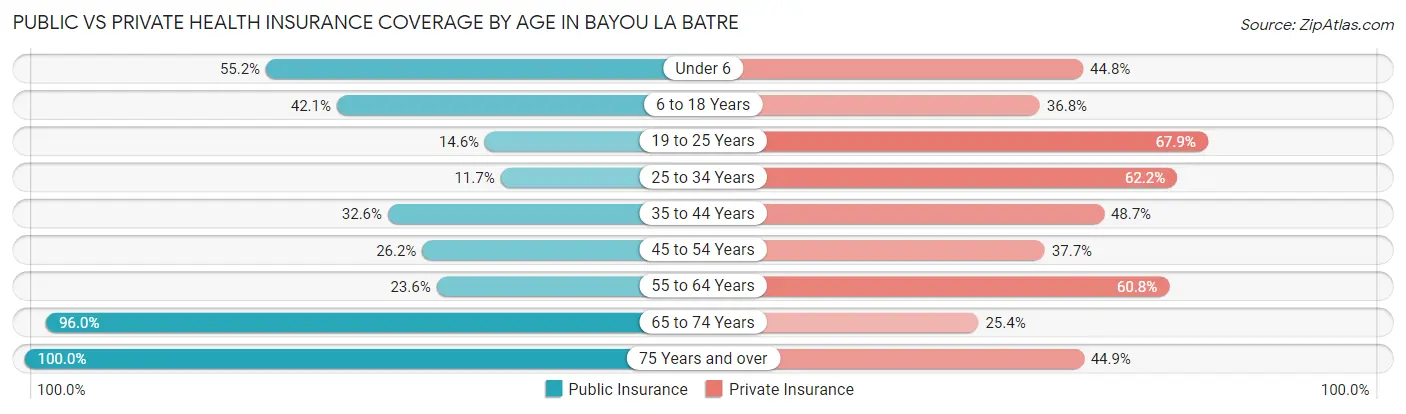
| Age Bracket | Public Insurance | Private Insurance |
| Under 6 | 69 (55.2%) | 56 (44.8%) |
| 6 to 18 Years | 159 (42.1%) | 139 (36.8%) |
| 19 to 25 Years | 39 (14.5%) | 182 (67.9%) |
| 25 to 34 Years | 21 (11.7%) | 112 (62.2%) |
| 35 to 44 Years | 85 (32.6%) | 127 (48.7%) |
| 45 to 54 Years | 82 (26.2%) | 118 (37.7%) |
| 55 to 64 Years | 69 (23.5%) | 178 (60.8%) |
| 65 to 74 Years | 193 (96.0%) | 51 (25.4%) |
| 75 Years and over | 196 (100.0%) | 88 (44.9%) |
| Total | 913 (41.2%) | 1,051 (47.4%) |
Disability Status by Sex by Age in Bayou La Batre
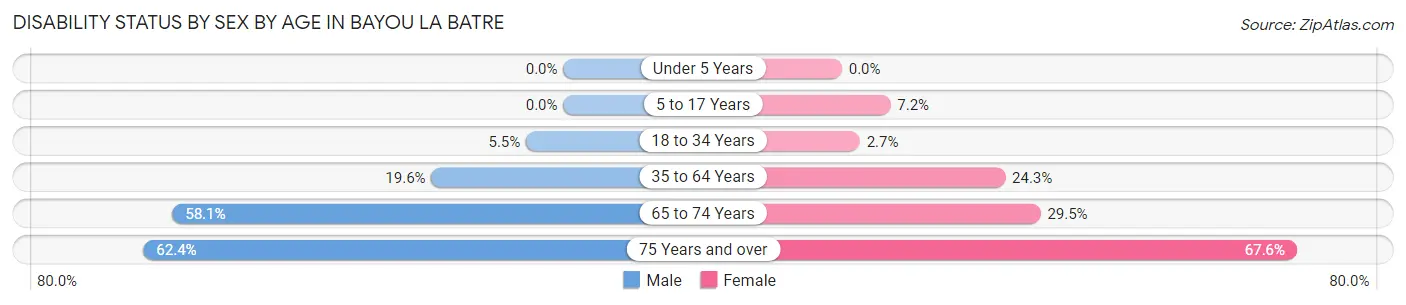
| Age Bracket | Male | Female |
| Under 5 Years | 0 (0.0%) | 0 (0.0%) |
| 5 to 17 Years | 0 (0.0%) | 15 (7.2%) |
| 18 to 34 Years | 11 (5.5%) | 7 (2.7%) |
| 35 to 64 Years | 85 (19.6%) | 105 (24.2%) |
| 65 to 74 Years | 36 (58.1%) | 41 (29.5%) |
| 75 Years and over | 53 (62.4%) | 75 (67.6%) |
Disability Class by Sex by Age in Bayou La Batre
Disability Class: Hearing Difficulty
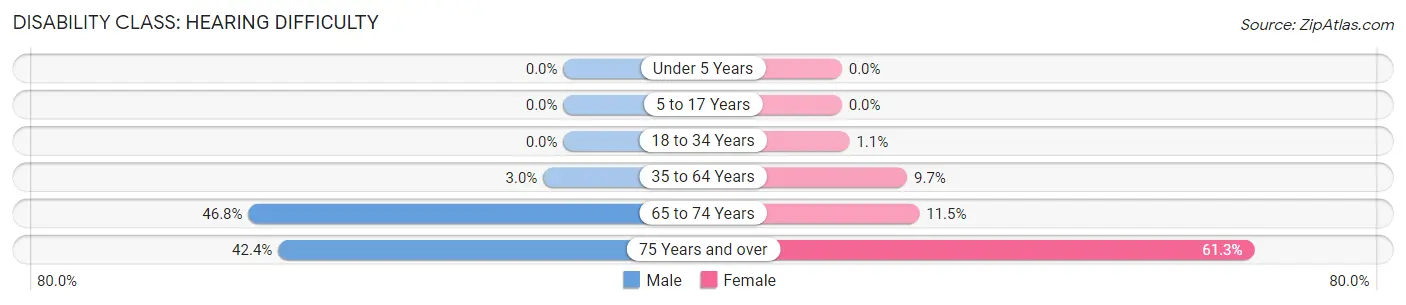
| Age Bracket | Male | Female |
| Under 5 Years | 0 (0.0%) | 0 (0.0%) |
| 5 to 17 Years | 0 (0.0%) | 0 (0.0%) |
| 18 to 34 Years | 0 (0.0%) | 3 (1.1%) |
| 35 to 64 Years | 13 (3.0%) | 42 (9.7%) |
| 65 to 74 Years | 29 (46.8%) | 16 (11.5%) |
| 75 Years and over | 36 (42.3%) | 68 (61.3%) |
Disability Class: Vision Difficulty
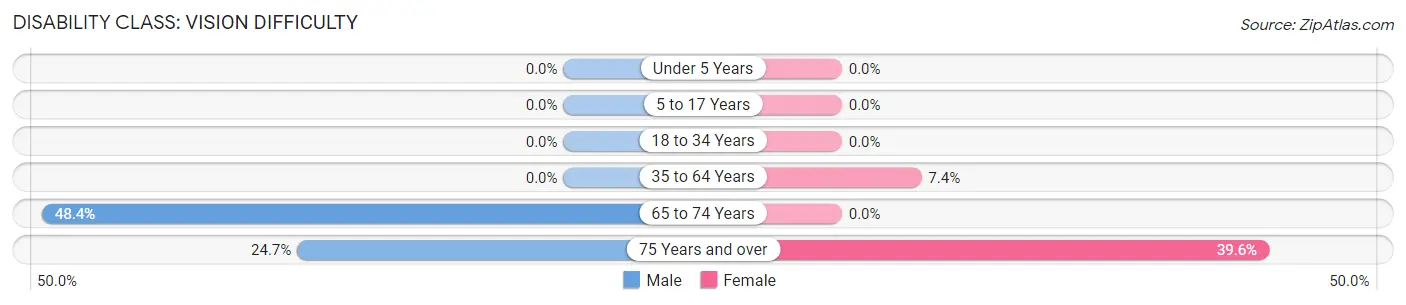
| Age Bracket | Male | Female |
| Under 5 Years | 0 (0.0%) | 0 (0.0%) |
| 5 to 17 Years | 0 (0.0%) | 0 (0.0%) |
| 18 to 34 Years | 0 (0.0%) | 0 (0.0%) |
| 35 to 64 Years | 0 (0.0%) | 32 (7.4%) |
| 65 to 74 Years | 30 (48.4%) | 0 (0.0%) |
| 75 Years and over | 21 (24.7%) | 44 (39.6%) |
Disability Class: Cognitive Difficulty
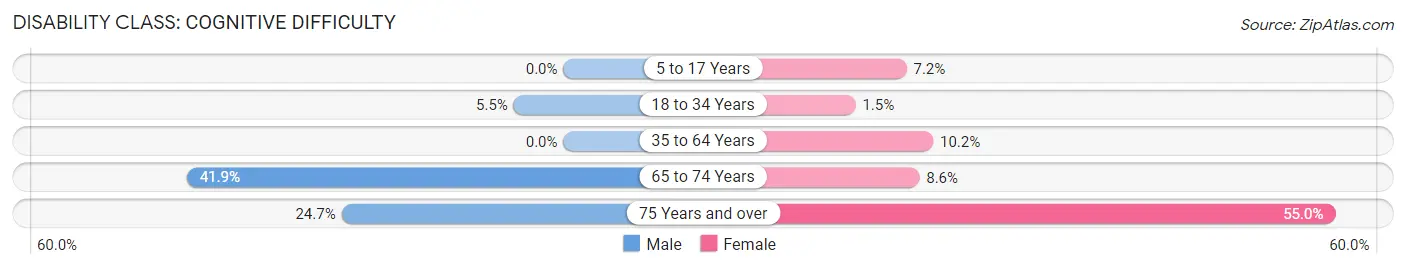
| Age Bracket | Male | Female |
| 5 to 17 Years | 0 (0.0%) | 15 (7.2%) |
| 18 to 34 Years | 11 (5.5%) | 4 (1.5%) |
| 35 to 64 Years | 0 (0.0%) | 44 (10.2%) |
| 65 to 74 Years | 26 (41.9%) | 12 (8.6%) |
| 75 Years and over | 21 (24.7%) | 61 (54.9%) |
Disability Class: Ambulatory Difficulty
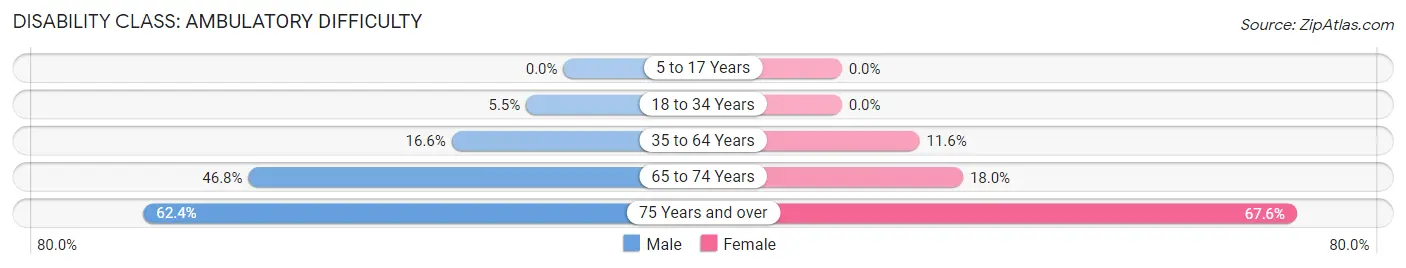
| Age Bracket | Male | Female |
| 5 to 17 Years | 0 (0.0%) | 0 (0.0%) |
| 18 to 34 Years | 11 (5.5%) | 0 (0.0%) |
| 35 to 64 Years | 72 (16.6%) | 50 (11.6%) |
| 65 to 74 Years | 29 (46.8%) | 25 (18.0%) |
| 75 Years and over | 53 (62.4%) | 75 (67.6%) |
Disability Class: Self-Care Difficulty
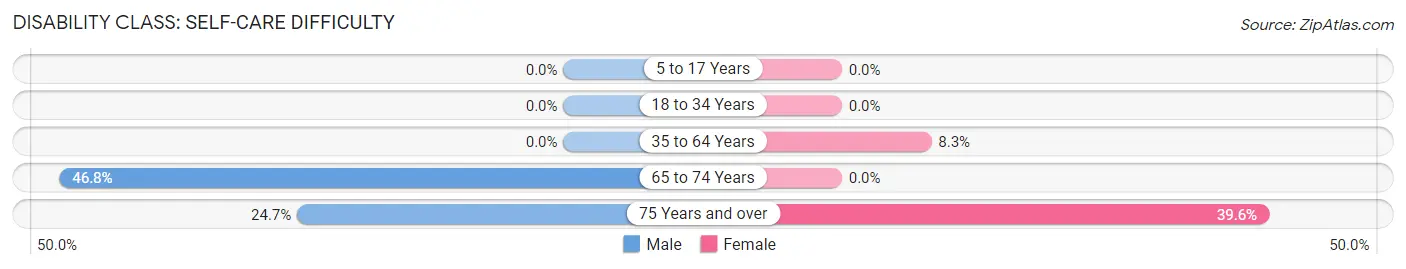
| Age Bracket | Male | Female |
| 5 to 17 Years | 0 (0.0%) | 0 (0.0%) |
| 18 to 34 Years | 0 (0.0%) | 0 (0.0%) |
| 35 to 64 Years | 0 (0.0%) | 36 (8.3%) |
| 65 to 74 Years | 29 (46.8%) | 0 (0.0%) |
| 75 Years and over | 21 (24.7%) | 44 (39.6%) |
Technology Access in Bayou La Batre
Computing Device Access in Bayou La Batre
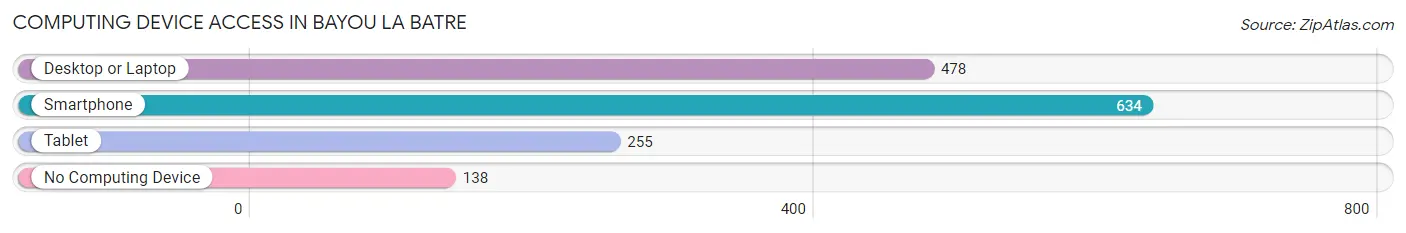
| Device Type | # Households | % Households |
| Desktop or Laptop | 478 | 59.8% |
| Smartphone | 634 | 79.2% |
| Tablet | 255 | 31.9% |
| No Computing Device | 138 | 17.2% |
| Total | 800 | 100.0% |
Internet Access in Bayou La Batre
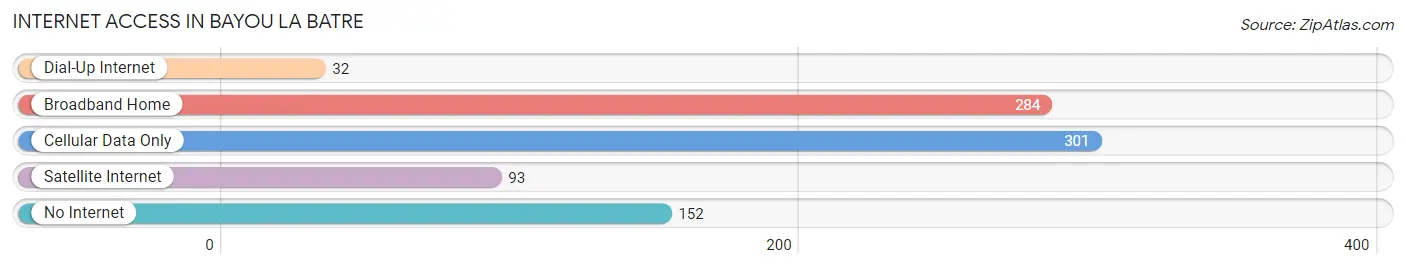
| Internet Type | # Households | % Households |
| Dial-Up Internet | 32 | 4.0% |
| Broadband Home | 284 | 35.5% |
| Cellular Data Only | 301 | 37.6% |
| Satellite Internet | 93 | 11.6% |
| No Internet | 152 | 19.0% |
| Total | 800 | 100.0% |
Bayou La Batre Summary
Bayou La Batre is a small fishing village located in Mobile County, Alabama. It is situated on the Gulf of Mexico, approximately 15 miles south of Mobile. The town is known for its seafood industry, which has been a major part of the local economy since the early 19th century.
History
The area that is now Bayou La Batre was originally inhabited by Native Americans, including the Choctaw and Creek tribes. The first European settlers arrived in the area in the early 1800s, and the town was officially founded in 1813. The town was named after a French settler, Jean Baptiste La Batre, who had settled in the area in the late 1700s.
In the early 19th century, the town was a major port for the lumber industry, and it was also a popular destination for shrimpers and oystermen. The seafood industry has been a major part of the local economy ever since.
In the late 19th century, the town was a popular destination for immigrants from Europe, particularly from Italy and Croatia. These immigrants brought with them their own culture and traditions, which have been preserved in the town to this day.
Geography
Bayou La Batre is located on the Gulf of Mexico, approximately 15 miles south of Mobile. The town is situated on a bayou, which is a slow-moving river or stream. The bayou is fed by the Pascagoula River, which flows into the Gulf of Mexico.
The town is surrounded by wetlands, which are home to a variety of wildlife, including birds, fish, and other animals. The wetlands also provide a habitat for a variety of plant species, including cypress trees and other vegetation.
The town is located in a humid subtropical climate zone, which means that it experiences hot, humid summers and mild winters. The average temperature in the summer is around 90 degrees Fahrenheit, and the average temperature in the winter is around 50 degrees Fahrenheit.
Economy
The economy of Bayou La Batre is largely based on the seafood industry. The town is home to a number of seafood processing plants, which process and package seafood for distribution throughout the United States. The town is also home to a number of fishing boats, which bring in a variety of seafood, including shrimp, oysters, and crabs.
The town is also home to a number of other businesses, including restaurants, retail stores, and boat repair shops. The town is also home to a number of marinas, which provide docking and storage for boats.
Demographics
As of the 2010 census, the population of Bayou La Batre was 2,558. The town is predominantly white, with a small African American population. The town is also home to a large number of immigrants from Europe, particularly from Italy and Croatia.
The median household income in Bayou La Batre is $37,917, and the median home value is $90,000. The town has a poverty rate of 22.3%, which is higher than the national average.
Conclusion
Bayou La Batre is a small fishing village located in Mobile County, Alabama. The town is known for its seafood industry, which has been a major part of the local economy since the early 19th century. The town is predominantly white, with a small African American population. The town is also home to a large number of immigrants from Europe, particularly from Italy and Croatia. The economy of Bayou La Batre is largely based on the seafood industry, and the town is also home to a number of other businesses.
Common Questions
What is Per Capita Income in Bayou La Batre?
Per Capita income in Bayou La Batre is $18,620.
What is the Median Family Income in Bayou La Batre?
Median Family Income in Bayou La Batre is $41,250.
What is the Median Household income in Bayou La Batre?
Median Household Income in Bayou La Batre is $40,000.
What is Income or Wage Gap in Bayou La Batre?
Income or Wage Gap in Bayou La Batre is 36.3%.
Women in Bayou La Batre earn 63.7 cents for every dollar earned by a man.
What is Inequality or Gini Index in Bayou La Batre?
Inequality or Gini Index in Bayou La Batre is 0.40.
What is the Total Population of Bayou La Batre?
Total Population of Bayou La Batre is 2,215.
What is the Total Male Population of Bayou La Batre?
Total Male Population of Bayou La Batre is 988.
What is the Total Female Population of Bayou La Batre?
Total Female Population of Bayou La Batre is 1,227.
What is the Ratio of Males per 100 Females in Bayou La Batre?
There are 80.52 Males per 100 Females in Bayou La Batre.
What is the Ratio of Females per 100 Males in Bayou La Batre?
There are 124.19 Females per 100 Males in Bayou La Batre.
What is the Median Population Age in Bayou La Batre?
Median Population Age in Bayou La Batre is 42.4 Years.
What is the Average Family Size in Bayou La Batre
Average Family Size in Bayou La Batre is 3.5 People.
What is the Average Household Size in Bayou La Batre
Average Household Size in Bayou La Batre is 2.8 People.
How Large is the Labor Force in Bayou La Batre?
There are 864 People in the Labor Forcein in Bayou La Batre.
What is the Percentage of People in the Labor Force in Bayou La Batre?
48.1% of People are in the Labor Force in Bayou La Batre.
What is the Unemployment Rate in Bayou La Batre?
Unemployment Rate in Bayou La Batre is 2.4%.