Penngrove, CA Map & Demographics
Penngrove Map
Penngrove Overview
$70,780
PER CAPITA INCOME
$135,789
AVG FAMILY INCOME
$97,237
AVG HOUSEHOLD INCOME
36.4%
WAGE / INCOME GAP [ % ]
63.6¢/ $1
WAGE / INCOME GAP [ $ ]
0.50
INEQUALITY / GINI INDEX
2,184
TOTAL POPULATION
972
MALE POPULATION
1,212
FEMALE POPULATION
80.20
MALES / 100 FEMALES
124.69
FEMALES / 100 MALES
59.0
MEDIAN AGE
2.7
AVG FAMILY SIZE
2.2
AVG HOUSEHOLD SIZE
1,030
LABOR FORCE [ PEOPLE ]
56.3%
PERCENT IN LABOR FORCE
6.3%
UNEMPLOYMENT RATE
Penngrove Zip Codes
Penngrove Area Codes
Income in Penngrove
Income Overview in Penngrove
Per Capita Income in Penngrove is $70,780, while median incomes of families and households are $135,789 and $97,237 respectively.
| Characteristic | Number | Measure |
| Per Capita Income | 2,184 | $70,780 |
| Median Family Income | 558 | $135,789 |
| Mean Family Income | 558 | $214,551 |
| Median Household Income | 1,008 | $97,237 |
| Mean Household Income | 1,008 | $151,203 |
| Income Deficit | 558 | $0 |
| Wage / Income Gap (%) | 2,184 | 36.43% |
| Wage / Income Gap ($) | 2,184 | 63.57¢ per $1 |
| Gini / Inequality Index | 2,184 | 0.50 |
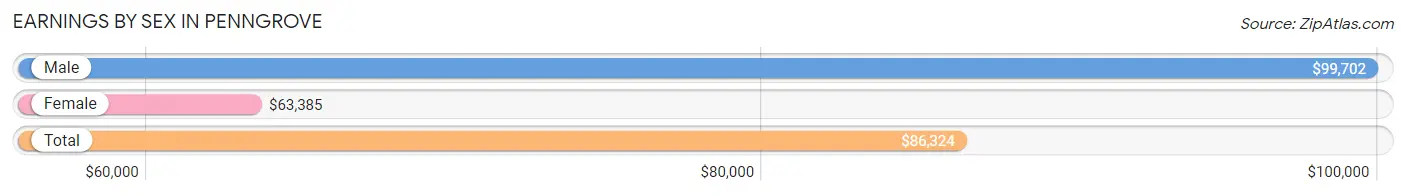
Earnings by Sex in Penngrove
Average Earnings in Penngrove are $86,324, $99,702 for men and $63,385 for women, a difference of 36.4%.
| Sex | Number | Average Earnings |
| Male | 473 (41.9%) | $99,702 |
| Female | 655 (58.1%) | $63,385 |
| Total | 1,128 (100.0%) | $86,324 |
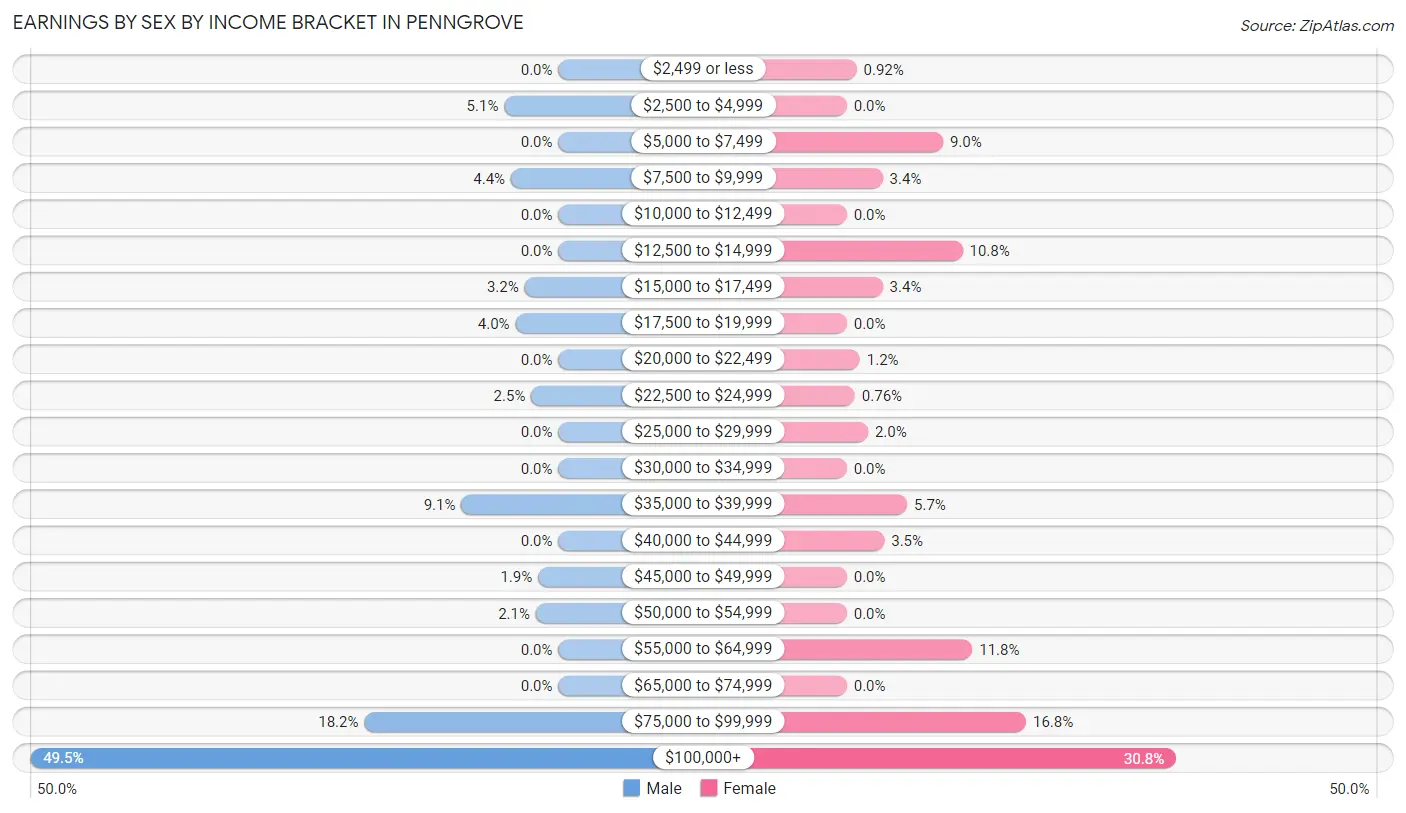
Earnings by Sex by Income Bracket in Penngrove
The most common earnings brackets in Penngrove are $100,000+ for men (234 | 49.5%) and $100,000+ for women (202 | 30.8%).
| Income | Male | Female |
| $2,499 or less | 0 (0.0%) | 6 (0.9%) |
| $2,500 to $4,999 | 24 (5.1%) | 0 (0.0%) |
| $5,000 to $7,499 | 0 (0.0%) | 59 (9.0%) |
| $7,500 to $9,999 | 21 (4.4%) | 22 (3.4%) |
| $10,000 to $12,499 | 0 (0.0%) | 0 (0.0%) |
| $12,500 to $14,999 | 0 (0.0%) | 71 (10.8%) |
| $15,000 to $17,499 | 15 (3.2%) | 22 (3.4%) |
| $17,500 to $19,999 | 19 (4.0%) | 0 (0.0%) |
| $20,000 to $22,499 | 0 (0.0%) | 8 (1.2%) |
| $22,500 to $24,999 | 12 (2.5%) | 5 (0.8%) |
| $25,000 to $29,999 | 0 (0.0%) | 13 (2.0%) |
| $30,000 to $34,999 | 0 (0.0%) | 0 (0.0%) |
| $35,000 to $39,999 | 43 (9.1%) | 37 (5.7%) |
| $40,000 to $44,999 | 0 (0.0%) | 23 (3.5%) |
| $45,000 to $49,999 | 9 (1.9%) | 0 (0.0%) |
| $50,000 to $54,999 | 10 (2.1%) | 0 (0.0%) |
| $55,000 to $64,999 | 0 (0.0%) | 77 (11.8%) |
| $65,000 to $74,999 | 0 (0.0%) | 0 (0.0%) |
| $75,000 to $99,999 | 86 (18.2%) | 110 (16.8%) |
| $100,000+ | 234 (49.5%) | 202 (30.8%) |
| Total | 473 (100.0%) | 655 (100.0%) |
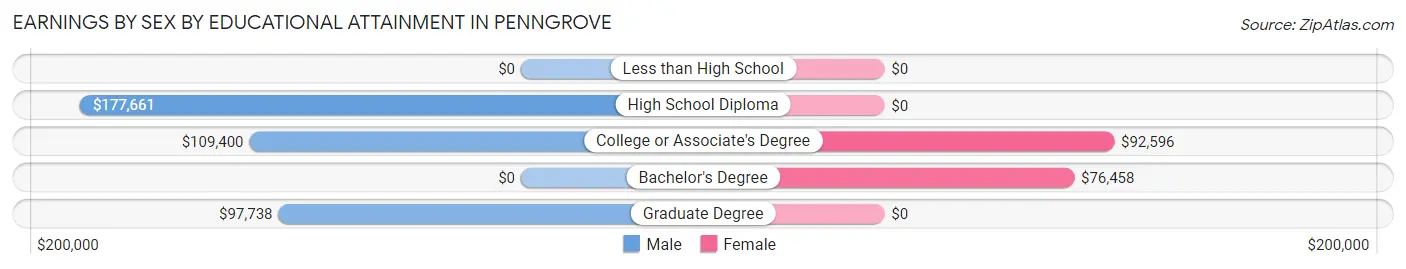
Earnings by Sex by Educational Attainment in Penngrove
Average earnings in Penngrove are $107,650 for men and $76,602 for women, a difference of 28.8%. Men with an educational attainment of high school diploma enjoy the highest average annual earnings of $177,661, while those with graduate degree education earn the least with $97,738. Women with an educational attainment of college or associate's degree earn the most with the average annual earnings of $92,596, while those with bachelor's degree education have the smallest earnings of $76,458.
| Educational Attainment | Male Income | Female Income |
| Less than High School | - | - |
| High School Diploma | $177,661 | $0 |
| College or Associate's Degree | $109,400 | $92,596 |
| Bachelor's Degree | - | - |
| Graduate Degree | $97,738 | $0 |
| Total | $107,650 | $76,602 |
Family Income in Penngrove
Family Income Brackets in Penngrove
According to the Penngrove family income data, there are 233 families falling into the $200,000+ income range, which is the most common income bracket and makes up 41.8% of all families.
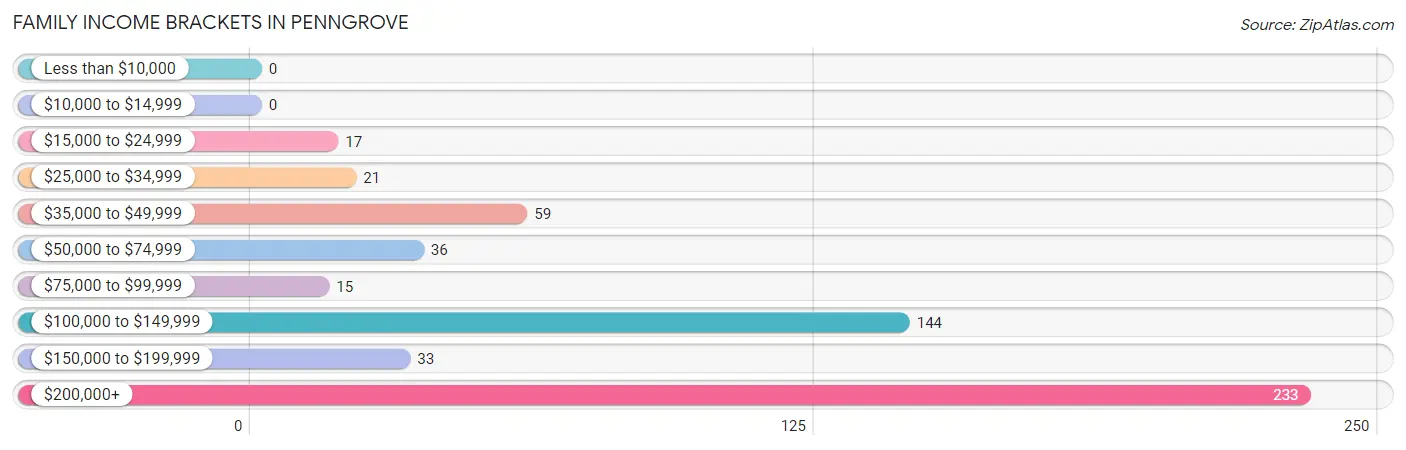
| Income Bracket | # Families | % Families |
| Less than $10,000 | 0 | 0.0% |
| $10,000 to $14,999 | 0 | 0.0% |
| $15,000 to $24,999 | 17 | 3.0% |
| $25,000 to $34,999 | 21 | 3.8% |
| $35,000 to $49,999 | 59 | 10.6% |
| $50,000 to $74,999 | 36 | 6.5% |
| $75,000 to $99,999 | 15 | 2.7% |
| $100,000 to $149,999 | 144 | 25.8% |
| $150,000 to $199,999 | 33 | 5.9% |
| $200,000+ | 233 | 41.8% |
Family Income by Famaliy Size in Penngrove
4-person families (35 | 6.3%) account for the highest median family income in Penngrove with $250,001 per family, while 4-person families (35 | 6.3%) have the highest median income of $62,500 per family member.
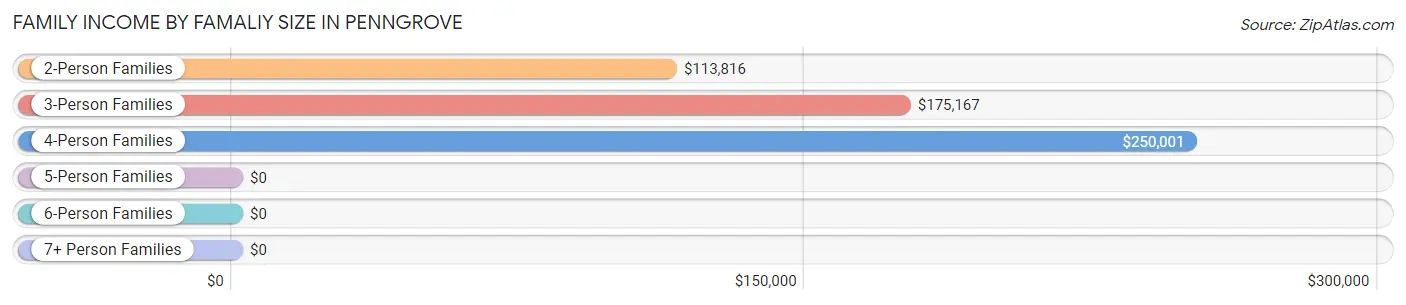
| Income Bracket | # Families | Median Income |
| 2-Person Families | 376 (67.4%) | $113,816 |
| 3-Person Families | 110 (19.7%) | $175,167 |
| 4-Person Families | 35 (6.3%) | $250,001 |
| 5-Person Families | 19 (3.4%) | $0 |
| 6-Person Families | 0 (0.0%) | $0 |
| 7+ Person Families | 18 (3.2%) | $0 |
| Total | 558 (100.0%) | $135,789 |
Family Income by Number of Earners in Penngrove
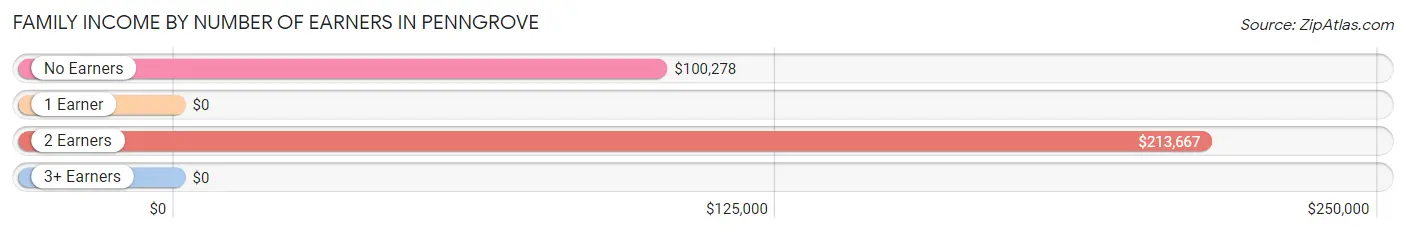
| Number of Earners | # Families | Median Income |
| No Earners | 134 (24.0%) | $100,278 |
| 1 Earner | 85 (15.2%) | $0 |
| 2 Earners | 248 (44.4%) | $213,667 |
| 3+ Earners | 91 (16.3%) | $0 |
| Total | 558 (100.0%) | $135,789 |
Household Income in Penngrove
Household Income Brackets in Penngrove
With 233 households falling in the category, the $200,000+ income range is the most frequent in Penngrove, accounting for 23.1% of all households.
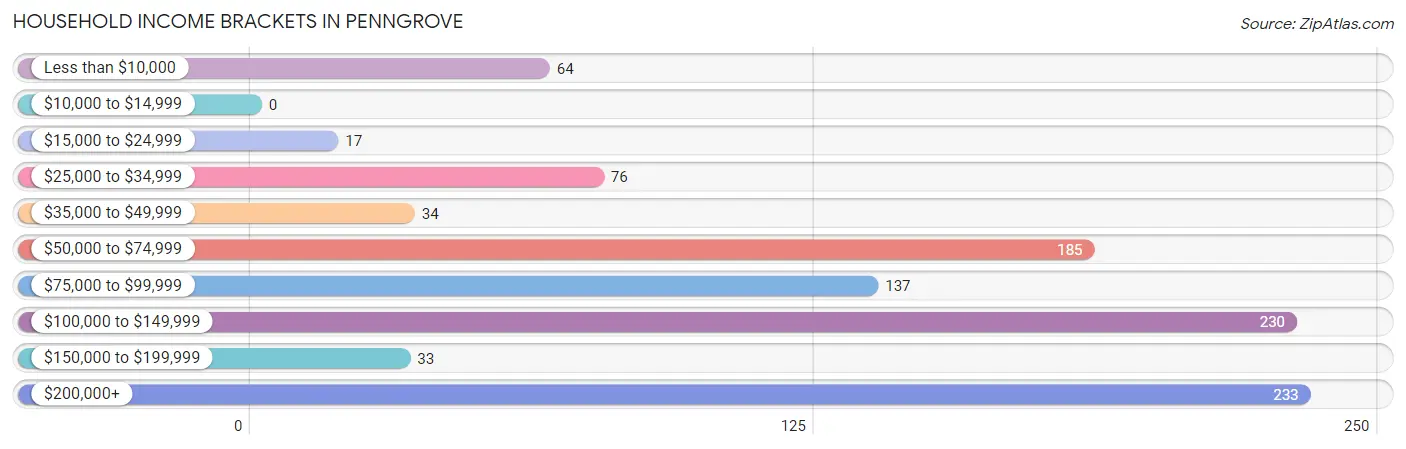
| Income Bracket | # Households | % Households |
| Less than $10,000 | 64 | 6.3% |
| $10,000 to $14,999 | 0 | 0.0% |
| $15,000 to $24,999 | 17 | 1.7% |
| $25,000 to $34,999 | 76 | 7.5% |
| $35,000 to $49,999 | 34 | 3.4% |
| $50,000 to $74,999 | 185 | 18.4% |
| $75,000 to $99,999 | 137 | 13.6% |
| $100,000 to $149,999 | 230 | 22.8% |
| $150,000 to $199,999 | 33 | 3.3% |
| $200,000+ | 233 | 23.1% |
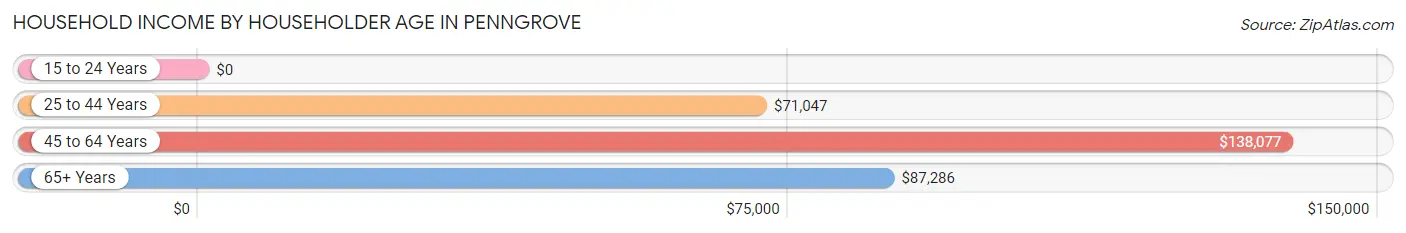
Household Income by Householder Age in Penngrove
The median household income in Penngrove is $97,237, with the highest median household income of $138,077 found in the 45 to 64 years age bracket for the primary householder. A total of 320 households (31.8%) fall into this category. Meanwhile, the 15 to 24 years age bracket for the primary householder has the lowest median household income of $0, with 13 households (1.3%) in this group.
| Income Bracket | # Households | Median Income |
| 15 to 24 Years | 13 (1.3%) | $0 |
| 25 to 44 Years | 155 (15.4%) | $71,047 |
| 45 to 64 Years | 320 (31.8%) | $138,077 |
| 65+ Years | 520 (51.6%) | $87,286 |
| Total | 1,008 (100.0%) | $97,237 |
Poverty in Penngrove
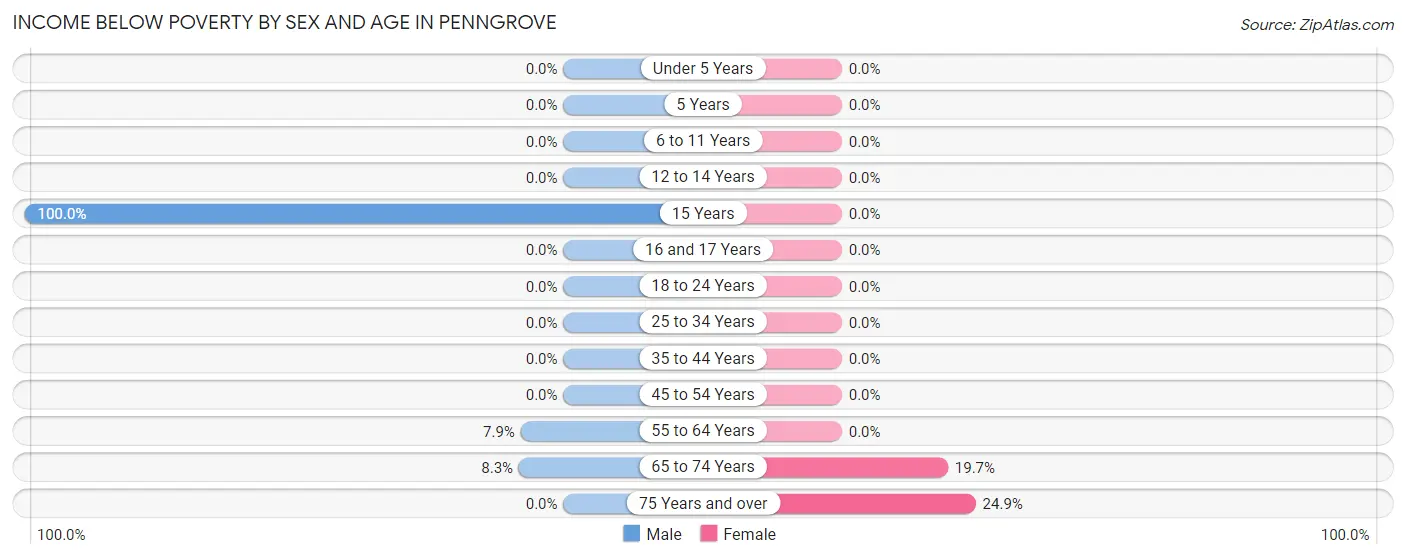
Income Below Poverty by Sex and Age in Penngrove
With 10.3% poverty level for males and 9.7% for females among the residents of Penngrove, 15 year old males and 75 year old and over females are the most vulnerable to poverty, with 56 males (100.0%) and 42 females (24.8%) in their respective age groups living below the poverty level.
| Age Bracket | Male | Female |
| Under 5 Years | 0 (0.0%) | 0 (0.0%) |
| 5 Years | 0 (0.0%) | 0 (0.0%) |
| 6 to 11 Years | 0 (0.0%) | 0 (0.0%) |
| 12 to 14 Years | 0 (0.0%) | 0 (0.0%) |
| 15 Years | 56 (100.0%) | 0 (0.0%) |
| 16 and 17 Years | 0 (0.0%) | 0 (0.0%) |
| 18 to 24 Years | 0 (0.0%) | 0 (0.0%) |
| 25 to 34 Years | 0 (0.0%) | 0 (0.0%) |
| 35 to 44 Years | 0 (0.0%) | 0 (0.0%) |
| 45 to 54 Years | 0 (0.0%) | 0 (0.0%) |
| 55 to 64 Years | 21 (7.9%) | 0 (0.0%) |
| 65 to 74 Years | 17 (8.3%) | 75 (19.7%) |
| 75 Years and over | 0 (0.0%) | 42 (24.8%) |
| Total | 94 (10.3%) | 117 (9.7%) |
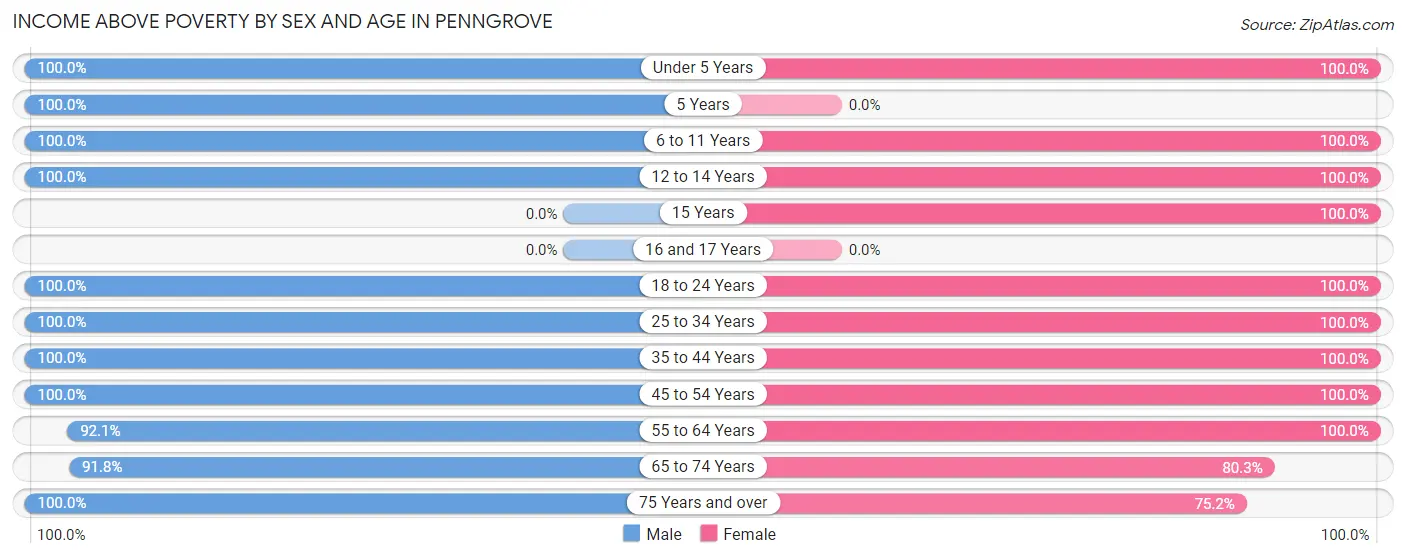
Income Above Poverty by Sex and Age in Penngrove
According to the poverty statistics in Penngrove, males aged under 5 years and females aged under 5 years are the age groups that are most secure financially, with 100.0% of males and 100.0% of females in these age groups living above the poverty line.
| Age Bracket | Male | Female |
| Under 5 Years | 65 (100.0%) | 23 (100.0%) |
| 5 Years | 7 (100.0%) | 0 (0.0%) |
| 6 to 11 Years | 23 (100.0%) | 68 (100.0%) |
| 12 to 14 Years | 9 (100.0%) | 23 (100.0%) |
| 15 Years | 0 (0.0%) | 23 (100.0%) |
| 16 and 17 Years | 0 (0.0%) | 0 (0.0%) |
| 18 to 24 Years | 24 (100.0%) | 93 (100.0%) |
| 25 to 34 Years | 80 (100.0%) | 107 (100.0%) |
| 35 to 44 Years | 53 (100.0%) | 53 (100.0%) |
| 45 to 54 Years | 59 (100.0%) | 105 (100.0%) |
| 55 to 64 Years | 244 (92.1%) | 167 (100.0%) |
| 65 to 74 Years | 189 (91.7%) | 306 (80.3%) |
| 75 Years and over | 68 (100.0%) | 127 (75.1%) |
| Total | 821 (89.7%) | 1,095 (90.3%) |
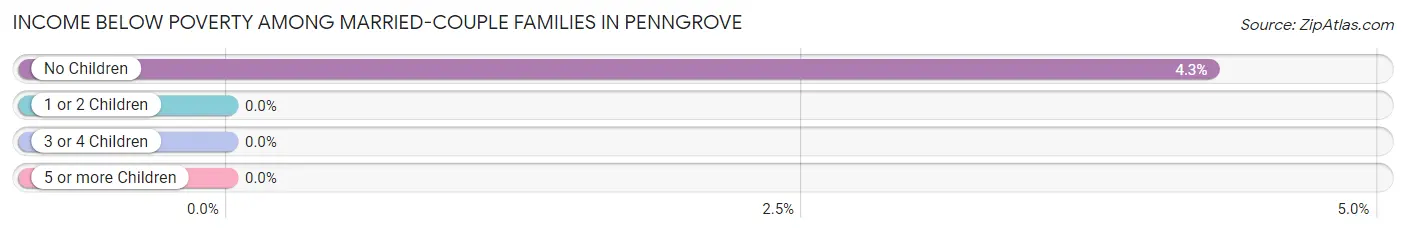
Income Below Poverty Among Married-Couple Families in Penngrove
The poverty statistics for married-couple families in Penngrove show that 3.5% or 17 of the total 485 families live below the poverty line. Families with no children have the highest poverty rate of 4.3%, comprising of 17 families. On the other hand, families with 1 or 2 children have the lowest poverty rate of 0.0%, which includes 0 families.
| Children | Above Poverty | Below Poverty |
| No Children | 381 (95.7%) | 17 (4.3%) |
| 1 or 2 Children | 69 (100.0%) | 0 (0.0%) |
| 3 or 4 Children | 18 (100.0%) | 0 (0.0%) |
| 5 or more Children | 0 (0.0%) | 0 (0.0%) |
| Total | 468 (96.5%) | 17 (3.5%) |
Income Below Poverty Among Single-Parent Households in Penngrove
| Children | Single Father | Single Mother |
| No Children | 0 (0.0%) | 0 (0.0%) |
| 1 or 2 Children | 0 (0.0%) | 0 (0.0%) |
| 3 or 4 Children | 0 (0.0%) | 0 (0.0%) |
| 5 or more Children | 0 (0.0%) | 0 (0.0%) |
| Total | 0 (0.0%) | 0 (0.0%) |
Income Below Poverty Among Married-Couple vs Single-Parent Households in Penngrove
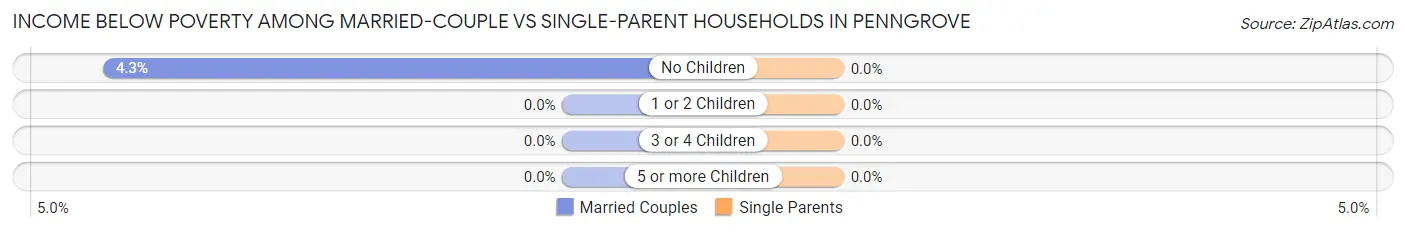
| Children | Married-Couple Families | Single-Parent Households |
| No Children | 17 (4.3%) | 0 (0.0%) |
| 1 or 2 Children | 0 (0.0%) | 0 (0.0%) |
| 3 or 4 Children | 0 (0.0%) | 0 (0.0%) |
| 5 or more Children | 0 (0.0%) | 0 (0.0%) |
| Total | 17 (3.5%) | 0 (0.0%) |
Race in Penngrove
The most populous races in Penngrove are White / Caucasian (1,854 | 84.9%), Hispanic or Latino (594 | 27.2%), and Two or more Races (198 | 9.1%).
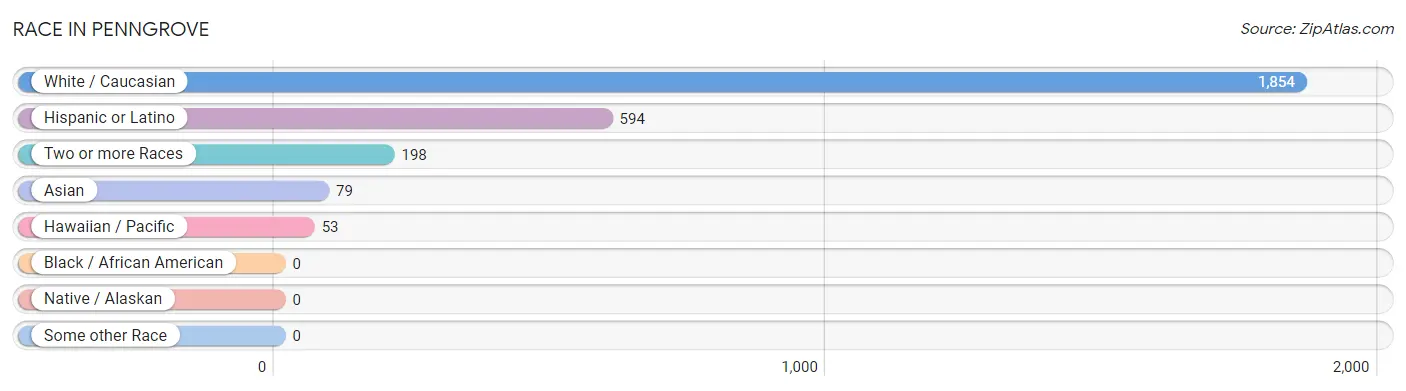
| Race | # Population | % Population |
| Asian | 79 | 3.6% |
| Black / African American | 0 | 0.0% |
| Hawaiian / Pacific | 53 | 2.4% |
| Hispanic or Latino | 594 | 27.2% |
| Native / Alaskan | 0 | 0.0% |
| White / Caucasian | 1,854 | 84.9% |
| Two or more Races | 198 | 9.1% |
| Some other Race | 0 | 0.0% |
| Total | 2,184 | 100.0% |
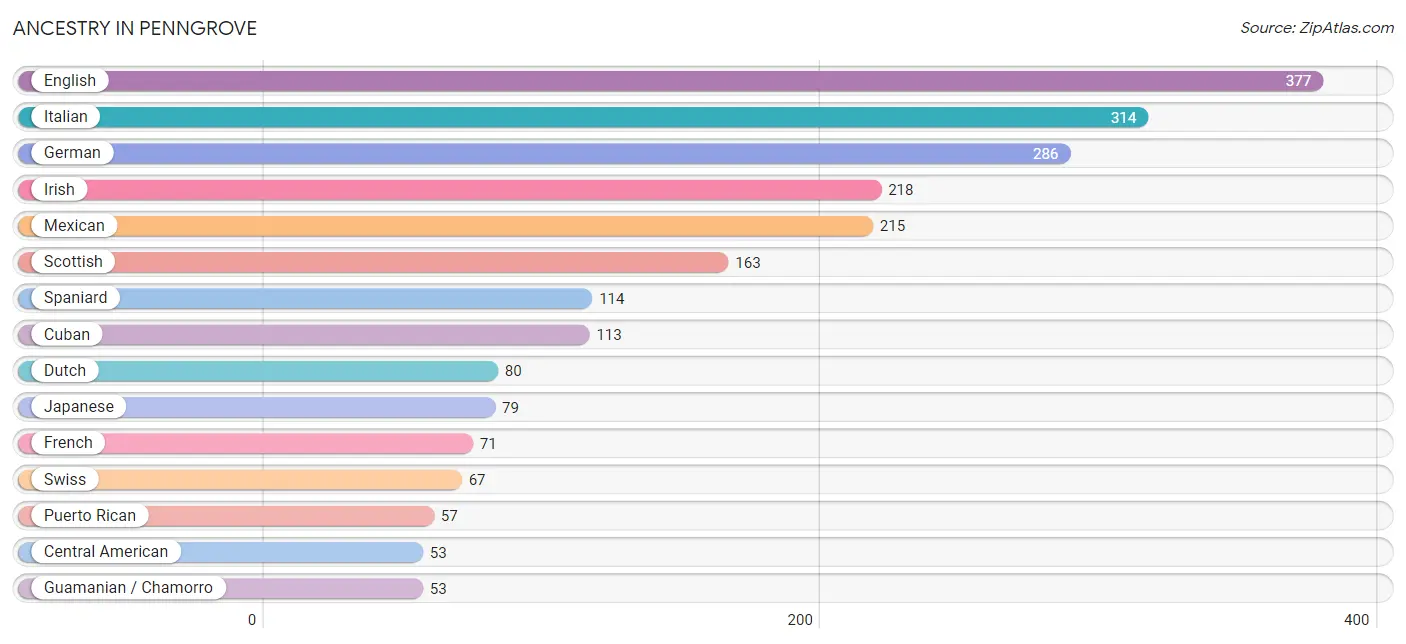
Ancestry in Penngrove
The most populous ancestries reported in Penngrove are English (377 | 17.3%), Italian (314 | 14.4%), German (286 | 13.1%), Irish (218 | 10.0%), and Mexican (215 | 9.8%), together accounting for 64.6% of all Penngrove residents.
| Ancestry | # Population | % Population |
| American | 29 | 1.3% |
| Argentinean | 42 | 1.9% |
| Bhutanese | 28 | 1.3% |
| British | 33 | 1.5% |
| Canadian | 18 | 0.8% |
| Central American | 53 | 2.4% |
| Cuban | 113 | 5.2% |
| Danish | 19 | 0.9% |
| Dutch | 80 | 3.7% |
| English | 377 | 17.3% |
| European | 26 | 1.2% |
| Finnish | 18 | 0.8% |
| French | 71 | 3.3% |
| French Canadian | 16 | 0.7% |
| German | 286 | 13.1% |
| Guamanian / Chamorro | 53 | 2.4% |
| Hungarian | 21 | 1.0% |
| Irish | 218 | 10.0% |
| Italian | 314 | 14.4% |
| Japanese | 79 | 3.6% |
| Korean | 14 | 0.6% |
| Laotian | 14 | 0.6% |
| Mexican | 215 | 9.8% |
| Northern European | 35 | 1.6% |
| Norwegian | 18 | 0.8% |
| Polish | 35 | 1.6% |
| Puerto Rican | 57 | 2.6% |
| Russian | 21 | 1.0% |
| Salvadoran | 53 | 2.4% |
| Scandinavian | 26 | 1.2% |
| Scotch-Irish | 13 | 0.6% |
| Scottish | 163 | 7.5% |
| Slovak | 19 | 0.9% |
| South American | 42 | 1.9% |
| Spaniard | 114 | 5.2% |
| Swedish | 50 | 2.3% |
| Swiss | 67 | 3.1% |
| Ukrainian | 5 | 0.2% | View All 38 Rows |
Immigrants in Penngrove
The most numerous immigrant groups reported in Penngrove came from Europe (63 | 2.9%), Northern Europe (57 | 2.6%), Asia (51 | 2.3%), South Eastern Asia (51 | 2.3%), and Cambodia (37 | 1.7%), together accounting for 11.9% of all Penngrove residents.
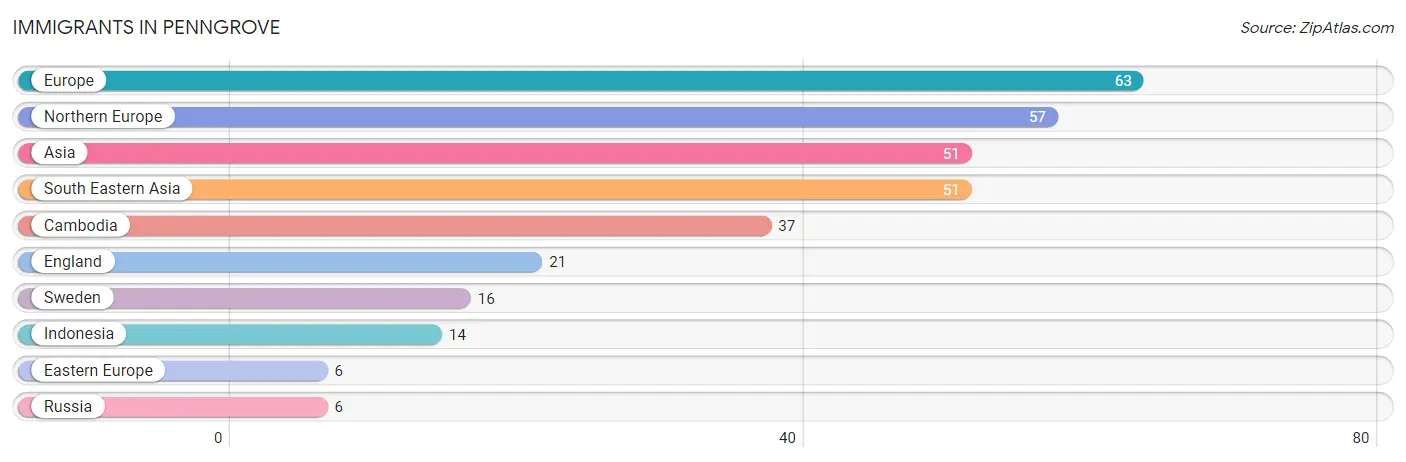
| Immigration Origin | # Population | % Population |
| Asia | 51 | 2.3% |
| Cambodia | 37 | 1.7% |
| Eastern Europe | 6 | 0.3% |
| England | 21 | 1.0% |
| Europe | 63 | 2.9% |
| Indonesia | 14 | 0.6% |
| Northern Europe | 57 | 2.6% |
| Russia | 6 | 0.3% |
| South Eastern Asia | 51 | 2.3% |
| Sweden | 16 | 0.7% | View All 10 Rows |
Sex and Age in Penngrove
Sex and Age in Penngrove
The most populous age groups in Penngrove are 55 to 59 Years (155 | 16.0%) for men and 65 to 69 Years (363 | 29.9%) for women.
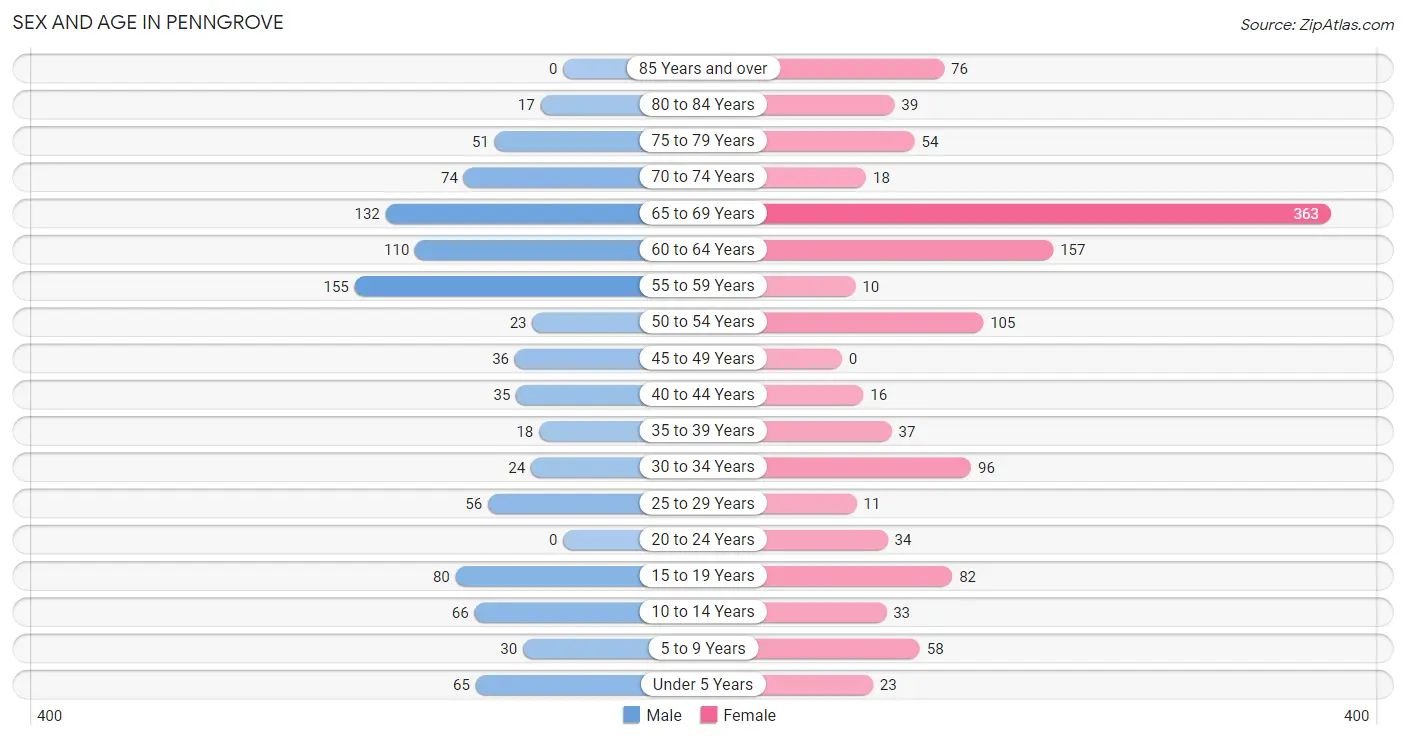
| Age Bracket | Male | Female |
| Under 5 Years | 65 (6.7%) | 23 (1.9%) |
| 5 to 9 Years | 30 (3.1%) | 58 (4.8%) |
| 10 to 14 Years | 66 (6.8%) | 33 (2.7%) |
| 15 to 19 Years | 80 (8.2%) | 82 (6.8%) |
| 20 to 24 Years | 0 (0.0%) | 34 (2.8%) |
| 25 to 29 Years | 56 (5.8%) | 11 (0.9%) |
| 30 to 34 Years | 24 (2.5%) | 96 (7.9%) |
| 35 to 39 Years | 18 (1.8%) | 37 (3.0%) |
| 40 to 44 Years | 35 (3.6%) | 16 (1.3%) |
| 45 to 49 Years | 36 (3.7%) | 0 (0.0%) |
| 50 to 54 Years | 23 (2.4%) | 105 (8.7%) |
| 55 to 59 Years | 155 (16.0%) | 10 (0.8%) |
| 60 to 64 Years | 110 (11.3%) | 157 (13.0%) |
| 65 to 69 Years | 132 (13.6%) | 363 (29.9%) |
| 70 to 74 Years | 74 (7.6%) | 18 (1.5%) |
| 75 to 79 Years | 51 (5.2%) | 54 (4.5%) |
| 80 to 84 Years | 17 (1.8%) | 39 (3.2%) |
| 85 Years and over | 0 (0.0%) | 76 (6.3%) |
| Total | 972 (100.0%) | 1,212 (100.0%) |
Families and Households in Penngrove
Median Family Size in Penngrove
The median family size in Penngrove is 2.69 persons per family, with single male/father families (15 | 2.7%) accounting for the largest median family size of 3.33 persons per family. On the other hand, single female/mother families (58 | 10.4%) represent the smallest median family size with 2.50 persons per family.
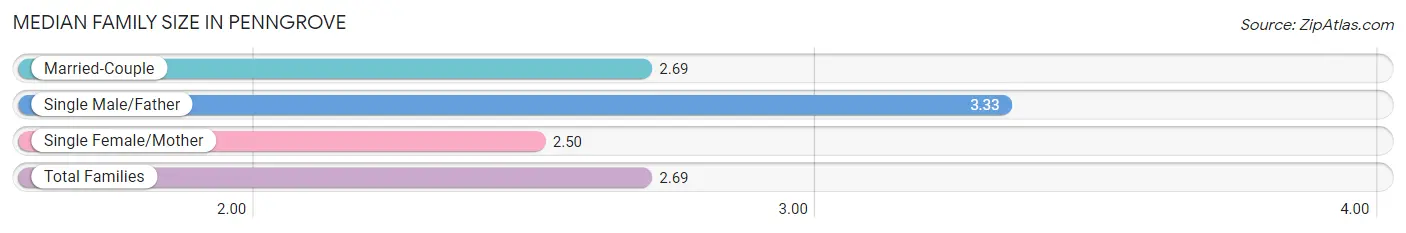
| Family Type | # Families | Family Size |
| Married-Couple | 485 (86.9%) | 2.69 |
| Single Male/Father | 15 (2.7%) | 3.33 |
| Single Female/Mother | 58 (10.4%) | 2.50 |
| Total Families | 558 (100.0%) | 2.69 |
Median Household Size in Penngrove
The median household size in Penngrove is 2.17 persons per household, with single male/father households (15 | 1.5%) accounting for the largest median household size of 3.33 persons per household. non-family households (450 | 44.6%) represent the smallest median household size with 1.13 persons per household.
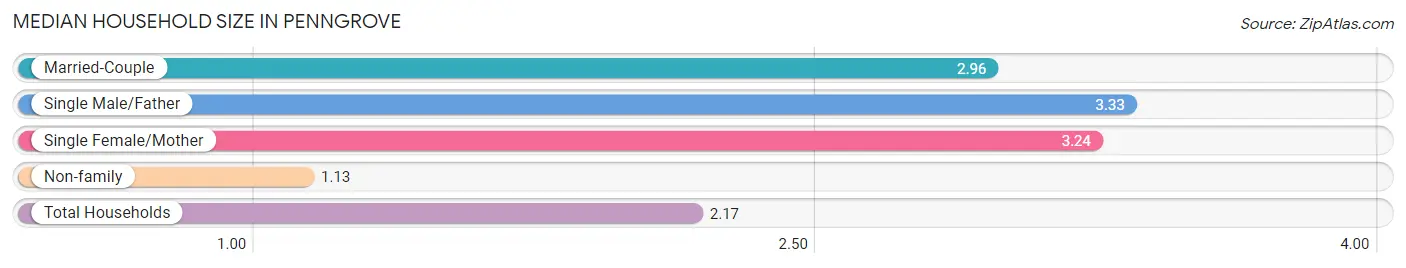
| Household Type | # Households | Household Size |
| Married-Couple | 485 (48.1%) | 2.96 |
| Single Male/Father | 15 (1.5%) | 3.33 |
| Single Female/Mother | 58 (5.8%) | 3.24 |
| Non-family | 450 (44.6%) | 1.13 |
| Total Households | 1,008 (100.0%) | 2.17 |
Household Size by Marriage Status in Penngrove
Out of a total of 1,008 households in Penngrove, 558 (55.4%) are family households, while 450 (44.6%) are nonfamily households. The most numerous type of family households are 2-person households, comprising 323, and the most common type of nonfamily households are 1-person households, comprising 392.
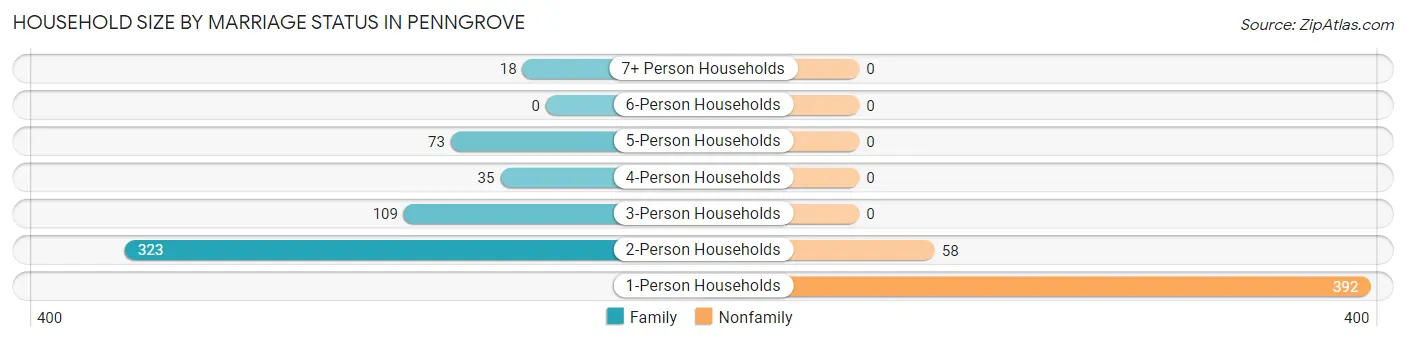
| Household Size | Family Households | Nonfamily Households |
| 1-Person Households | - | 392 (38.9%) |
| 2-Person Households | 323 (32.0%) | 58 (5.8%) |
| 3-Person Households | 109 (10.8%) | 0 (0.0%) |
| 4-Person Households | 35 (3.5%) | 0 (0.0%) |
| 5-Person Households | 73 (7.2%) | 0 (0.0%) |
| 6-Person Households | 0 (0.0%) | 0 (0.0%) |
| 7+ Person Households | 18 (1.8%) | 0 (0.0%) |
| Total | 558 (55.4%) | 450 (44.6%) |
Female Fertility in Penngrove
Fertility by Age in Penngrove
Average fertility rate in Penngrove is 72.0 births per 1,000 women. Women in the age bracket of 35 to 50 years have the highest fertility rate with 165.0 births per 1,000 women. Women in the age bracket of 35 to 50 years acount for 75.0% of all women with births.
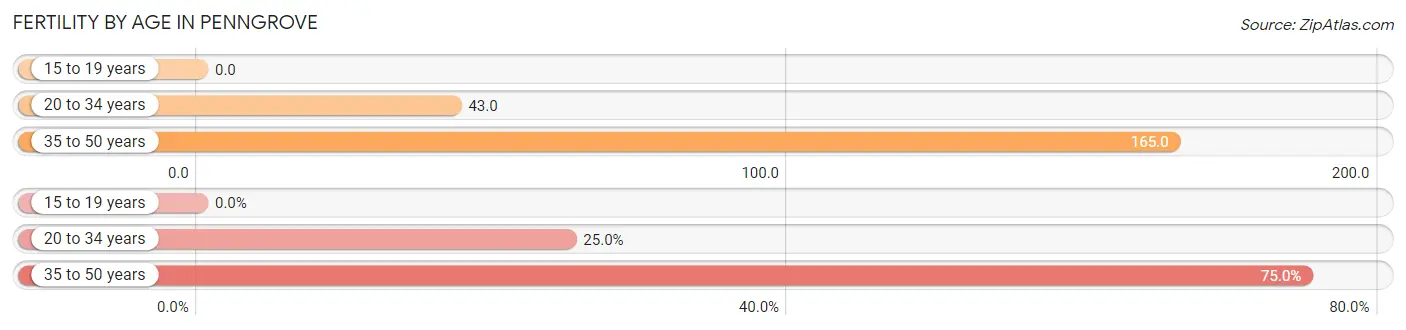
| Age Bracket | Women with Births | Births / 1,000 Women |
| 15 to 19 years | 0 (0.0%) | 0.0 |
| 20 to 34 years | 6 (25.0%) | 43.0 |
| 35 to 50 years | 18 (75.0%) | 165.0 |
| Total | 24 (100.0%) | 72.0 |
Fertility by Age by Marriage Status in Penngrove
75.0% of women with births (24) in Penngrove are married. The highest percentage of unmarried women with births falls into 20 to 34 years age bracket with 100.0% of them unmarried at the time of birth, while the lowest percentage of unmarried women with births belong to 35 to 50 years age bracket with 0.0% of them unmarried.
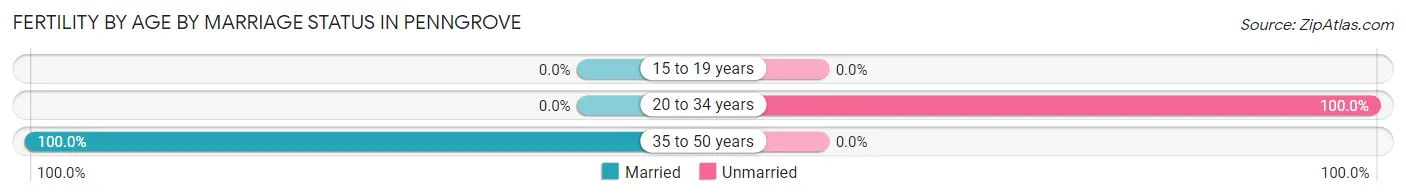
| Age Bracket | Married | Unmarried |
| 15 to 19 years | 0 (0.0%) | 0 (0.0%) |
| 20 to 34 years | 0 (0.0%) | 6 (100.0%) |
| 35 to 50 years | 18 (100.0%) | 0 (0.0%) |
| Total | 18 (75.0%) | 6 (25.0%) |
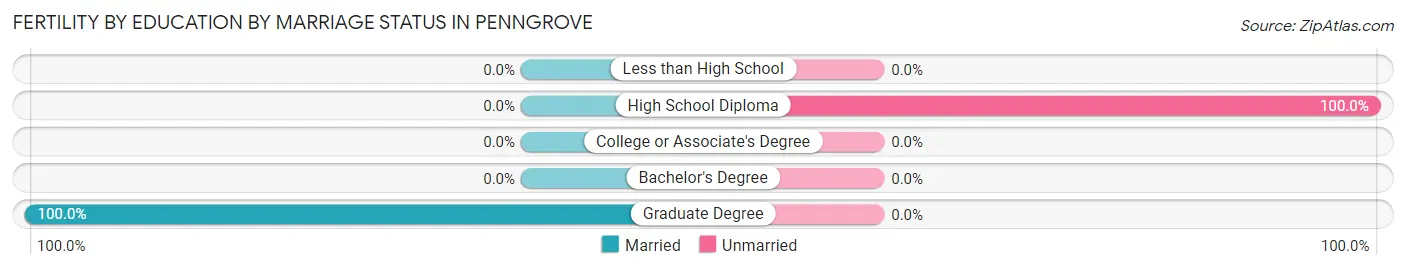
Fertility by Education in Penngrove
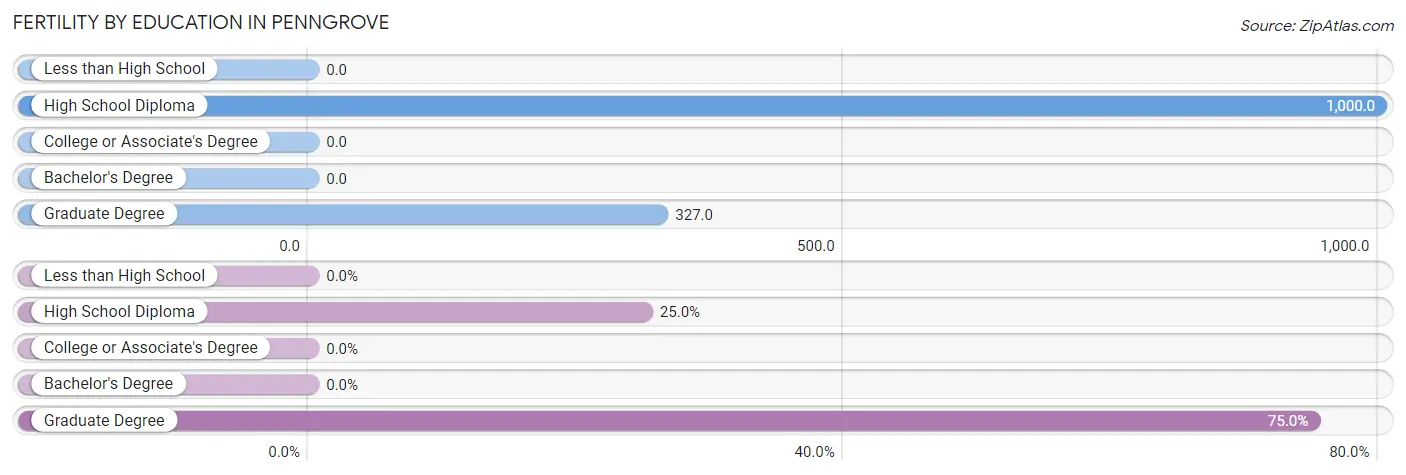
| Educational Attainment | Women with Births | Births / 1,000 Women |
| Less than High School | 0 (0.0%) | 0.0 |
| High School Diploma | 6 (25.0%) | 1,000.0 |
| College or Associate's Degree | 0 (0.0%) | 0.0 |
| Bachelor's Degree | 0 (0.0%) | 0.0 |
| Graduate Degree | 18 (75.0%) | 327.0 |
| Total | 24 (100.0%) | 72.0 |
Fertility by Education by Marriage Status in Penngrove
25.0% of women with births in Penngrove are unmarried. Women with the educational attainment of graduate degree are most likely to be married with 100.0% of them married at childbirth, while women with the educational attainment of high school diploma are least likely to be married with 100.0% of them unmarried at childbirth.
| Educational Attainment | Married | Unmarried |
| Less than High School | 0 (0.0%) | 0 (0.0%) |
| High School Diploma | 0 (0.0%) | 6 (100.0%) |
| College or Associate's Degree | 0 (0.0%) | 0 (0.0%) |
| Bachelor's Degree | 0 (0.0%) | 0 (0.0%) |
| Graduate Degree | 18 (100.0%) | 0 (0.0%) |
| Total | 18 (75.0%) | 6 (25.0%) |
Employment Characteristics in Penngrove
Employment by Class of Employer in Penngrove
Among the 949 employed individuals in Penngrove, private company employees (450 | 47.4%), local government employees (197 | 20.8%), and not-for-profit organizations (177 | 18.6%) make up the most common classes of employment.
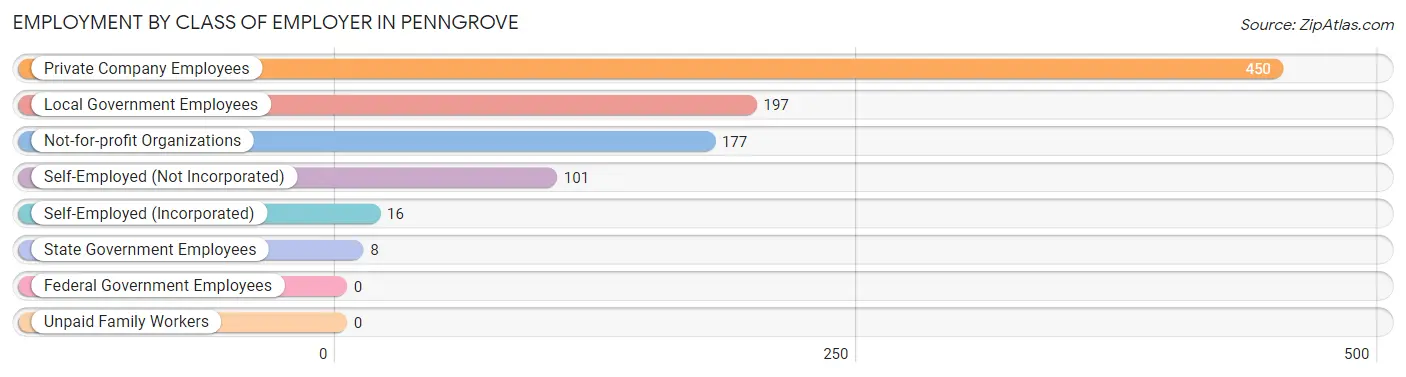
| Employer Class | # Employees | % Employees |
| Private Company Employees | 450 | 47.4% |
| Self-Employed (Incorporated) | 16 | 1.7% |
| Self-Employed (Not Incorporated) | 101 | 10.6% |
| Not-for-profit Organizations | 177 | 18.6% |
| Local Government Employees | 197 | 20.8% |
| State Government Employees | 8 | 0.8% |
| Federal Government Employees | 0 | 0.0% |
| Unpaid Family Workers | 0 | 0.0% |
| Total | 949 | 100.0% |
Employment Status by Age in Penngrove
According to the labor force statistics for Penngrove, out of the total population over 16 years of age (1,830), 56.3% or 1,030 individuals are in the labor force, with 6.3% or 65 of them unemployed. The age group with the highest labor force participation rate is 16 to 19 years, with 100.0% or 83 individuals in the labor force. Within the labor force, the 16 to 19 years age range has the highest percentage of unemployed individuals, with 28.9% or 24 of them being unemployed.
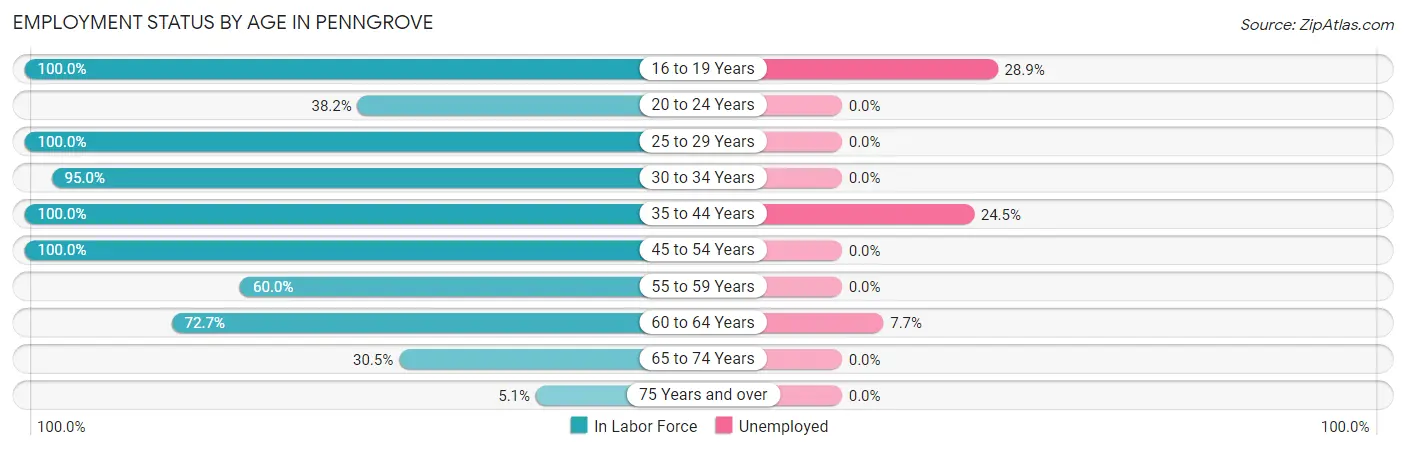
| Age Bracket | In Labor Force | Unemployed |
| 16 to 19 Years | 83 (100.0%) | 24 (28.9%) |
| 20 to 24 Years | 13 (38.2%) | 0 (0.0%) |
| 25 to 29 Years | 67 (100.0%) | 0 (0.0%) |
| 30 to 34 Years | 114 (95.0%) | 0 (0.0%) |
| 35 to 44 Years | 106 (100.0%) | 26 (24.5%) |
| 45 to 54 Years | 164 (100.0%) | 0 (0.0%) |
| 55 to 59 Years | 99 (60.0%) | 0 (0.0%) |
| 60 to 64 Years | 194 (72.7%) | 15 (7.7%) |
| 65 to 74 Years | 179 (30.5%) | 0 (0.0%) |
| 75 Years and over | 12 (5.1%) | 0 (0.0%) |
| Total | 1,030 (56.3%) | 65 (6.3%) |
Employment Status by Educational Attainment in Penngrove
According to labor force statistics for Penngrove, 83.7% of individuals (744) out of the total population between 25 and 64 years of age (889) are in the labor force, with 5.5% or 41 of them being unemployed. The group with the highest labor force participation rate are those with the educational attainment of bachelor's degree or higher, with 100.0% or 423 individuals in the labor force. Within the labor force, individuals with college / associate degree education have the highest percentage of unemployment, with 9.9% or 26 of them being unemployed.
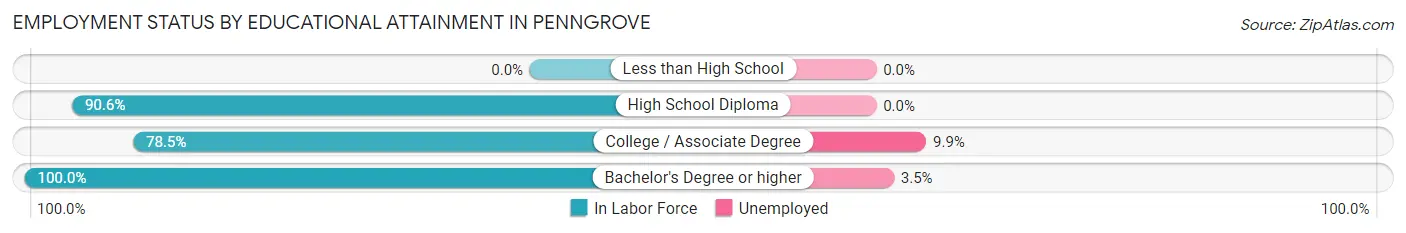
| Educational Attainment | In Labor Force | Unemployed |
| Less than High School | 0 (0.0%) | 0 (0.0%) |
| High School Diploma | 58 (90.6%) | 0 (0.0%) |
| College / Associate Degree | 263 (78.5%) | 33 (9.9%) |
| Bachelor's Degree or higher | 423 (100.0%) | 15 (3.5%) |
| Total | 744 (83.7%) | 49 (5.5%) |
Employment Occupations by Sex in Penngrove
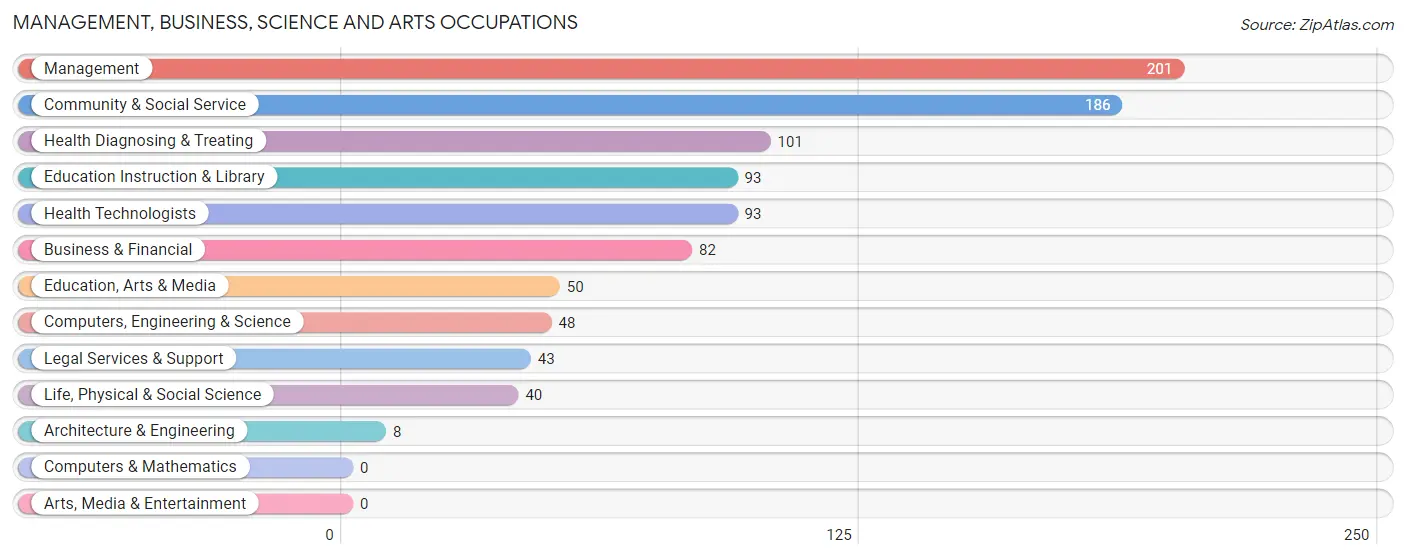
Management, Business, Science and Arts Occupations
The most common Management, Business, Science and Arts occupations in Penngrove are Management (201 | 20.8%), Community & Social Service (186 | 19.3%), Health Diagnosing & Treating (101 | 10.5%), Education Instruction & Library (93 | 9.6%), and Health Technologists (93 | 9.6%).
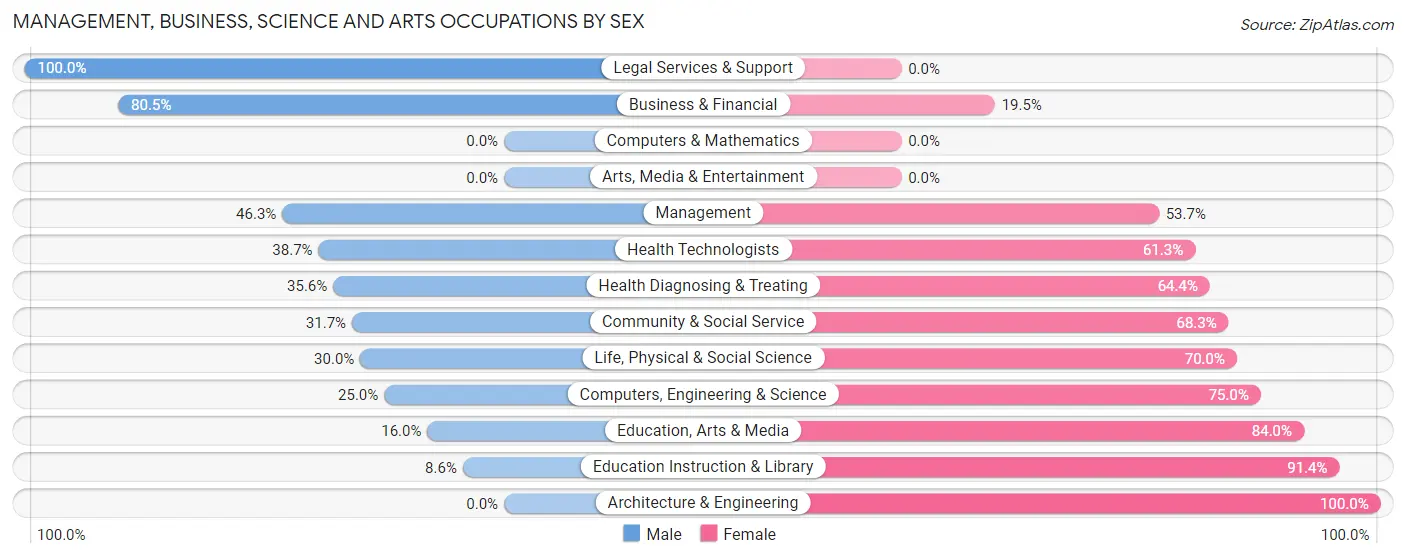
Management, Business, Science and Arts Occupations by Sex
Within the Management, Business, Science and Arts occupations in Penngrove, the most male-oriented occupations are Legal Services & Support (100.0%), Business & Financial (80.5%), and Management (46.3%), while the most female-oriented occupations are Architecture & Engineering (100.0%), Education Instruction & Library (91.4%), and Education, Arts & Media (84.0%).
| Occupation | Male | Female |
| Management | 93 (46.3%) | 108 (53.7%) |
| Business & Financial | 66 (80.5%) | 16 (19.5%) |
| Computers, Engineering & Science | 12 (25.0%) | 36 (75.0%) |
| Computers & Mathematics | 0 (0.0%) | 0 (0.0%) |
| Architecture & Engineering | 0 (0.0%) | 8 (100.0%) |
| Life, Physical & Social Science | 12 (30.0%) | 28 (70.0%) |
| Community & Social Service | 59 (31.7%) | 127 (68.3%) |
| Education, Arts & Media | 8 (16.0%) | 42 (84.0%) |
| Legal Services & Support | 43 (100.0%) | 0 (0.0%) |
| Education Instruction & Library | 8 (8.6%) | 85 (91.4%) |
| Arts, Media & Entertainment | 0 (0.0%) | 0 (0.0%) |
| Health Diagnosing & Treating | 36 (35.6%) | 65 (64.4%) |
| Health Technologists | 36 (38.7%) | 57 (61.3%) |
| Total (Category) | 266 (43.0%) | 352 (57.0%) |
| Total (Overall) | 357 (37.0%) | 609 (63.0%) |
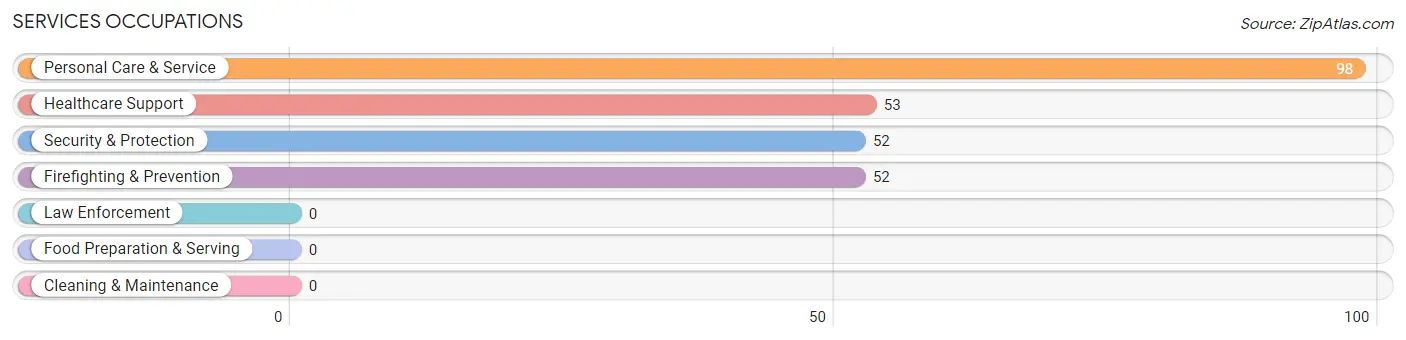
Services Occupations
The most common Services occupations in Penngrove are Personal Care & Service (98 | 10.1%), Healthcare Support (53 | 5.5%), Security & Protection (52 | 5.4%), and Firefighting & Prevention (52 | 5.4%).
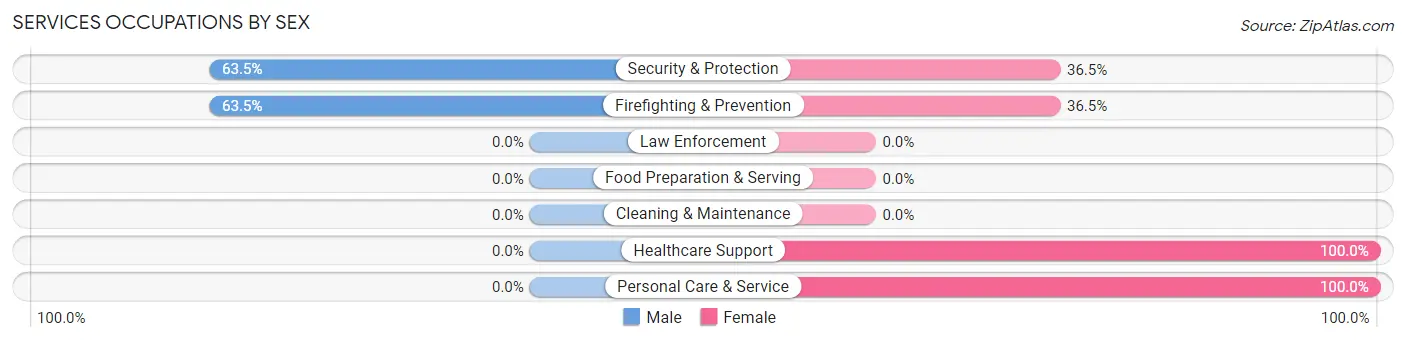
Services Occupations by Sex
Within the Services occupations in Penngrove, the most male-oriented occupations are Security & Protection (63.5%), and Firefighting & Prevention (63.5%), while the most female-oriented occupations are Healthcare Support (100.0%), Personal Care & Service (100.0%), and Security & Protection (36.5%).
| Occupation | Male | Female |
| Healthcare Support | 0 (0.0%) | 53 (100.0%) |
| Security & Protection | 33 (63.5%) | 19 (36.5%) |
| Firefighting & Prevention | 33 (63.5%) | 19 (36.5%) |
| Law Enforcement | 0 (0.0%) | 0 (0.0%) |
| Food Preparation & Serving | 0 (0.0%) | 0 (0.0%) |
| Cleaning & Maintenance | 0 (0.0%) | 0 (0.0%) |
| Personal Care & Service | 0 (0.0%) | 98 (100.0%) |
| Total (Category) | 33 (16.3%) | 170 (83.7%) |
| Total (Overall) | 357 (37.0%) | 609 (63.0%) |
Sales and Office Occupations
The most common Sales and Office occupations in Penngrove are Office & Administration (76 | 7.9%), and Sales & Related (21 | 2.2%).
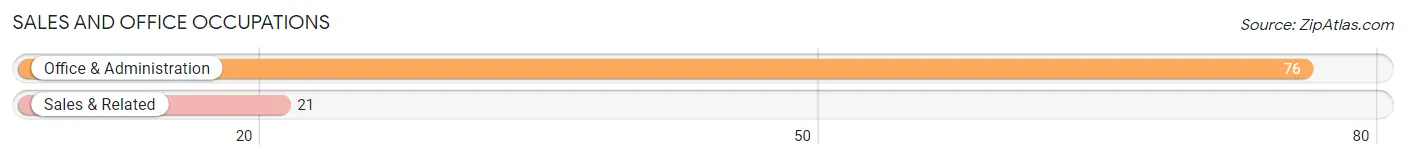
Sales and Office Occupations by Sex

| Occupation | Male | Female |
| Sales & Related | 21 (100.0%) | 0 (0.0%) |
| Office & Administration | 0 (0.0%) | 76 (100.0%) |
| Total (Category) | 21 (21.6%) | 76 (78.3%) |
| Total (Overall) | 357 (37.0%) | 609 (63.0%) |
Natural Resources, Construction and Maintenance Occupations
The most common Natural Resources, Construction and Maintenance occupations in Penngrove are , and Installation, Maintenance & Repair (37 | 3.8%).
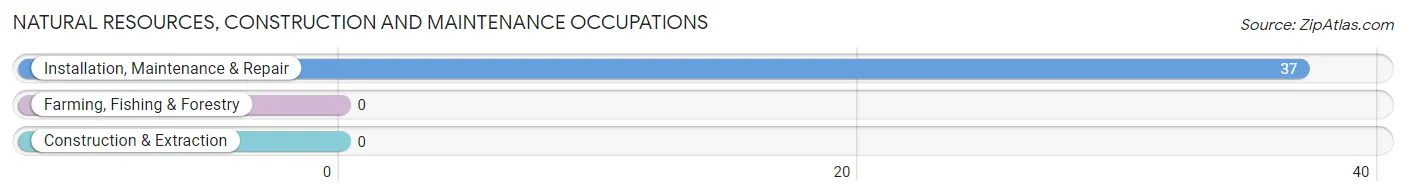
Natural Resources, Construction and Maintenance Occupations by Sex
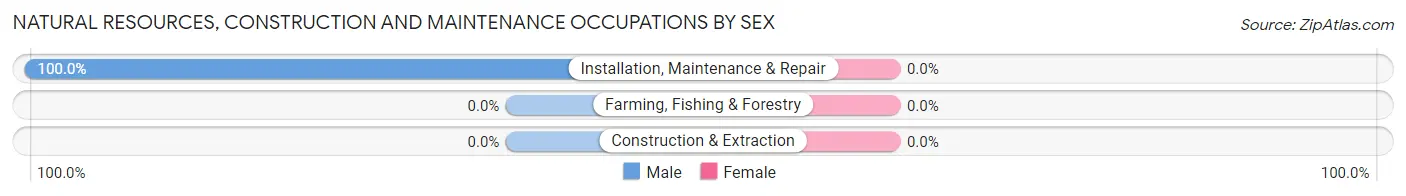
| Occupation | Male | Female |
| Farming, Fishing & Forestry | 0 (0.0%) | 0 (0.0%) |
| Construction & Extraction | 0 (0.0%) | 0 (0.0%) |
| Installation, Maintenance & Repair | 37 (100.0%) | 0 (0.0%) |
| Total (Category) | 37 (100.0%) | 0 (0.0%) |
| Total (Overall) | 357 (37.0%) | 609 (63.0%) |
Production, Transportation and Moving Occupations
The most common Production, Transportation and Moving occupations in Penngrove are , and Material Moving (11 | 1.1%).
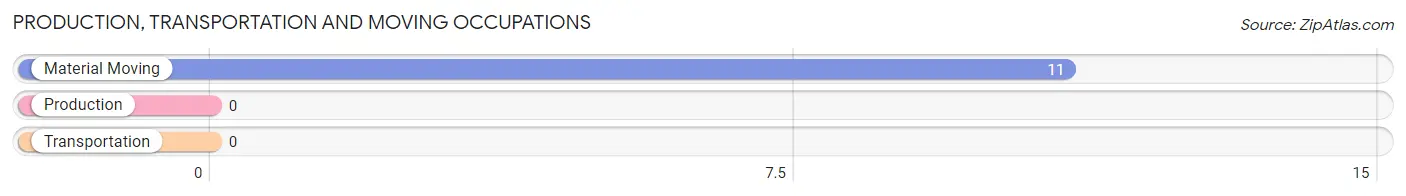
Production, Transportation and Moving Occupations by Sex

| Occupation | Male | Female |
| Production | 0 (0.0%) | 0 (0.0%) |
| Transportation | 0 (0.0%) | 0 (0.0%) |
| Material Moving | 0 (0.0%) | 11 (100.0%) |
| Total (Category) | 0 (0.0%) | 11 (100.0%) |
| Total (Overall) | 357 (37.0%) | 609 (63.0%) |
Employment Industries by Sex in Penngrove
Employment Industries in Penngrove
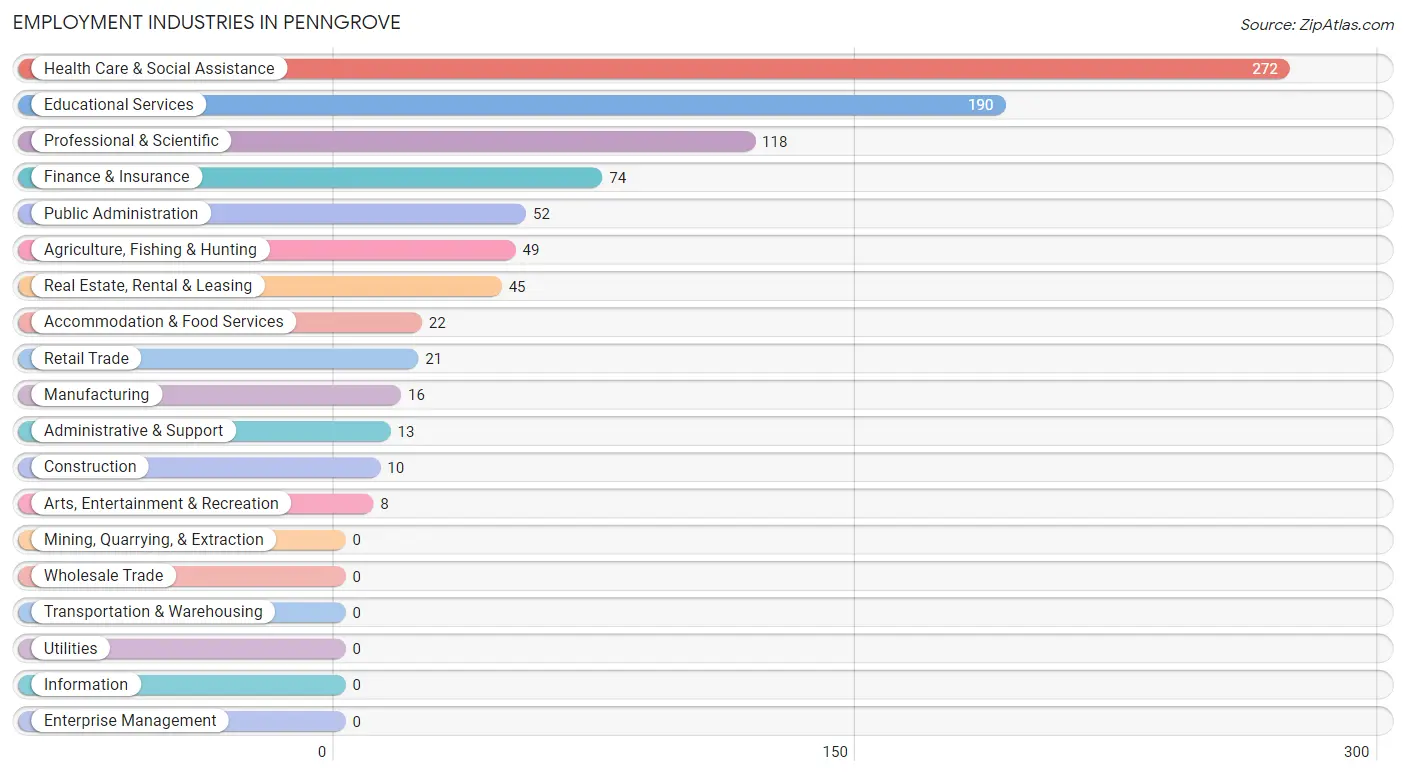
The major employment industries in Penngrove include Health Care & Social Assistance (272 | 28.2%), Educational Services (190 | 19.7%), Professional & Scientific (118 | 12.2%), Finance & Insurance (74 | 7.7%), and Public Administration (52 | 5.4%).
Employment Industries by Sex in Penngrove
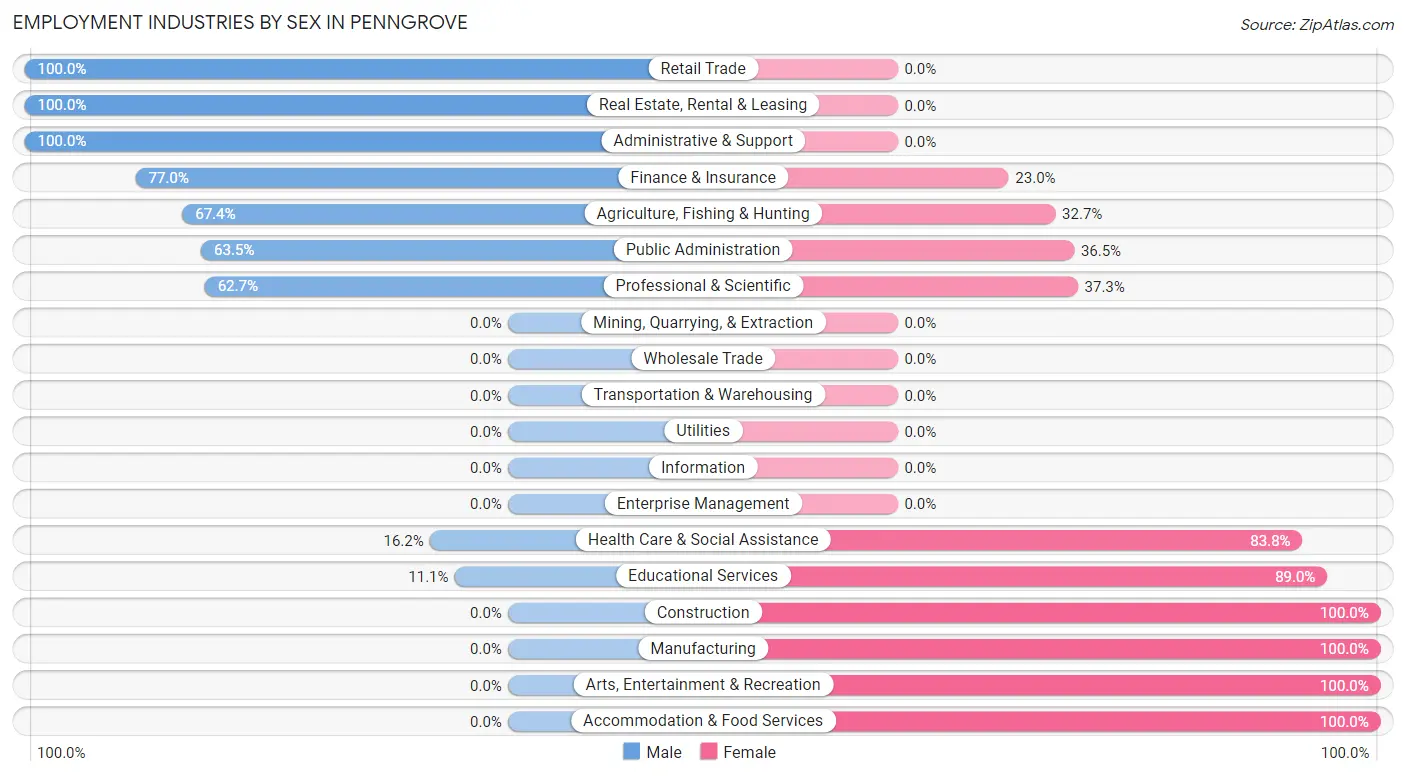
The Penngrove industries that see more men than women are Retail Trade (100.0%), Real Estate, Rental & Leasing (100.0%), and Administrative & Support (100.0%), whereas the industries that tend to have a higher number of women are Construction (100.0%), Manufacturing (100.0%), and Arts, Entertainment & Recreation (100.0%).
| Industry | Male | Female |
| Agriculture, Fishing & Hunting | 33 (67.3%) | 16 (32.7%) |
| Mining, Quarrying, & Extraction | 0 (0.0%) | 0 (0.0%) |
| Construction | 0 (0.0%) | 10 (100.0%) |
| Manufacturing | 0 (0.0%) | 16 (100.0%) |
| Wholesale Trade | 0 (0.0%) | 0 (0.0%) |
| Retail Trade | 21 (100.0%) | 0 (0.0%) |
| Transportation & Warehousing | 0 (0.0%) | 0 (0.0%) |
| Utilities | 0 (0.0%) | 0 (0.0%) |
| Information | 0 (0.0%) | 0 (0.0%) |
| Finance & Insurance | 57 (77.0%) | 17 (23.0%) |
| Real Estate, Rental & Leasing | 45 (100.0%) | 0 (0.0%) |
| Professional & Scientific | 74 (62.7%) | 44 (37.3%) |
| Enterprise Management | 0 (0.0%) | 0 (0.0%) |
| Administrative & Support | 13 (100.0%) | 0 (0.0%) |
| Educational Services | 21 (11.1%) | 169 (88.9%) |
| Health Care & Social Assistance | 44 (16.2%) | 228 (83.8%) |
| Arts, Entertainment & Recreation | 0 (0.0%) | 8 (100.0%) |
| Accommodation & Food Services | 0 (0.0%) | 22 (100.0%) |
| Public Administration | 33 (63.5%) | 19 (36.5%) |
| Total | 357 (37.0%) | 609 (63.0%) |
Education in Penngrove
School Enrollment in Penngrove
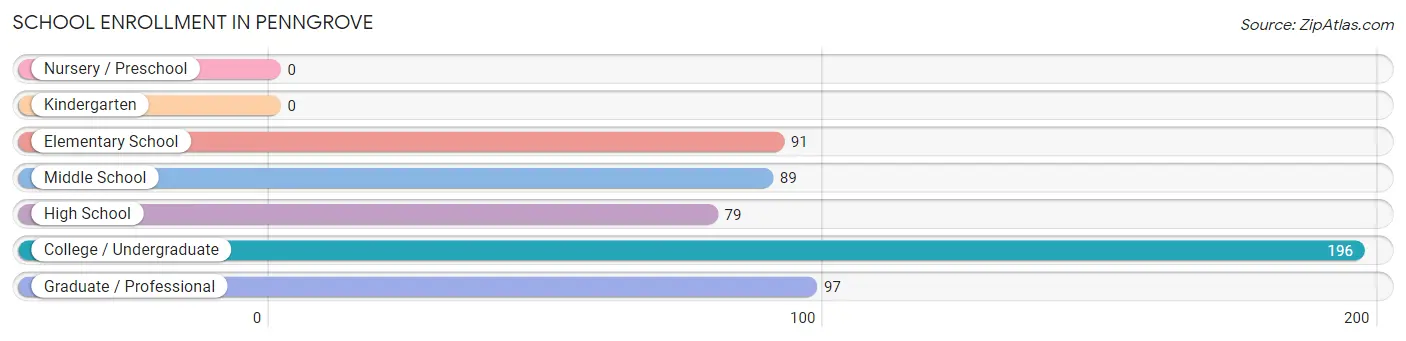
The most common levels of schooling among the 552 students in Penngrove are college / undergraduate (196 | 35.5%), graduate / professional (97 | 17.6%), and elementary school (91 | 16.5%).
| School Level | # Students | % Students |
| Nursery / Preschool | 0 | 0.0% |
| Kindergarten | 0 | 0.0% |
| Elementary School | 91 | 16.5% |
| Middle School | 89 | 16.1% |
| High School | 79 | 14.3% |
| College / Undergraduate | 196 | 35.5% |
| Graduate / Professional | 97 | 17.6% |
| Total | 552 | 100.0% |
School Enrollment by Age by Funding Source in Penngrove
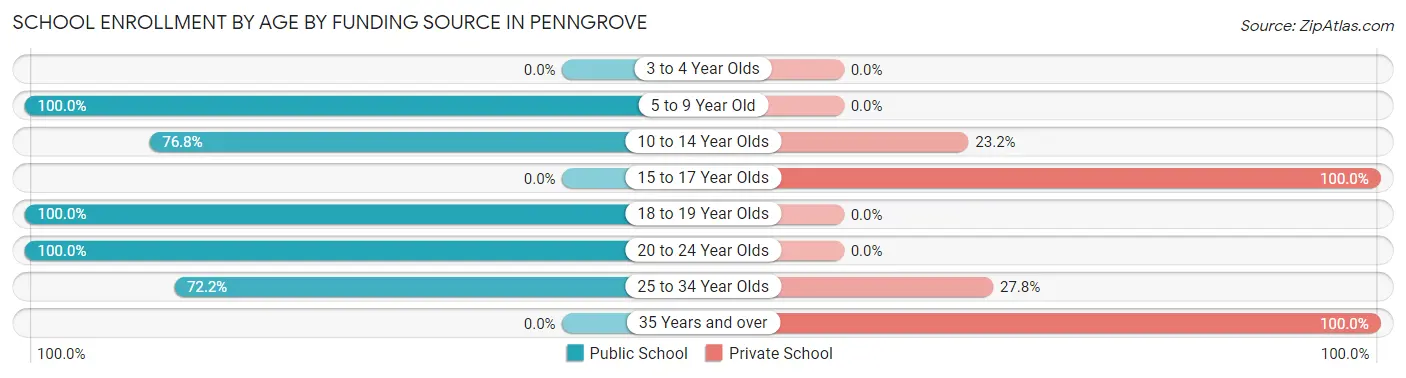
Out of a total of 552 students who are enrolled in schools in Penngrove, 182 (33.0%) attend a private institution, while the remaining 370 (67.0%) are enrolled in public schools. The age group of 15 to 17 year olds has the highest likelihood of being enrolled in private schools, with 79 (100.0% in the age bracket) enrolled. Conversely, the age group of 5 to 9 year old has the lowest likelihood of being enrolled in a private school, with 81 (100.0% in the age bracket) attending a public institution.
| Age Bracket | Public School | Private School |
| 3 to 4 Year Olds | 0 (0.0%) | 0 (0.0%) |
| 5 to 9 Year Old | 81 (100.0%) | 0 (0.0%) |
| 10 to 14 Year Olds | 76 (76.8%) | 23 (23.2%) |
| 15 to 17 Year Olds | 0 (0.0%) | 79 (100.0%) |
| 18 to 19 Year Olds | 83 (100.0%) | 0 (0.0%) |
| 20 to 24 Year Olds | 34 (100.0%) | 0 (0.0%) |
| 25 to 34 Year Olds | 96 (72.2%) | 37 (27.8%) |
| 35 Years and over | 0 (0.0%) | 43 (100.0%) |
| Total | 370 (67.0%) | 182 (33.0%) |
Educational Attainment by Field of Study in Penngrove
Social sciences (191 | 20.9%), business (188 | 20.6%), literature & languages (114 | 12.5%), bio, nature & agricultural (88 | 9.6%), and liberal arts & history (62 | 6.8%) are the most common fields of study among 913 individuals in Penngrove who have obtained a bachelor's degree or higher.
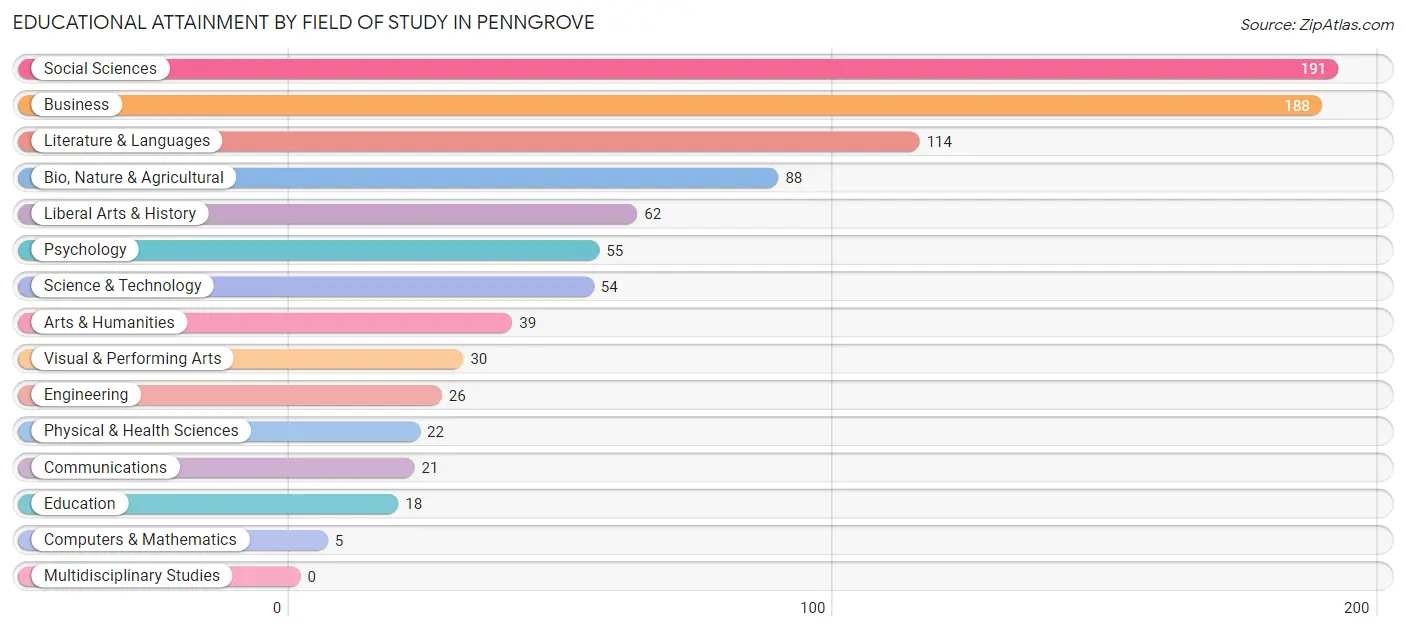
| Field of Study | # Graduates | % Graduates |
| Computers & Mathematics | 5 | 0.5% |
| Bio, Nature & Agricultural | 88 | 9.6% |
| Physical & Health Sciences | 22 | 2.4% |
| Psychology | 55 | 6.0% |
| Social Sciences | 191 | 20.9% |
| Engineering | 26 | 2.9% |
| Multidisciplinary Studies | 0 | 0.0% |
| Science & Technology | 54 | 5.9% |
| Business | 188 | 20.6% |
| Education | 18 | 2.0% |
| Literature & Languages | 114 | 12.5% |
| Liberal Arts & History | 62 | 6.8% |
| Visual & Performing Arts | 30 | 3.3% |
| Communications | 21 | 2.3% |
| Arts & Humanities | 39 | 4.3% |
| Total | 913 | 100.0% |
Transportation & Commute in Penngrove
Vehicle Availability by Sex in Penngrove
The most prevalent vehicle ownership categories in Penngrove are males with 2 vehicles (145, accounting for 40.6%) and females with 2 vehicles (223, making up 24.5%).
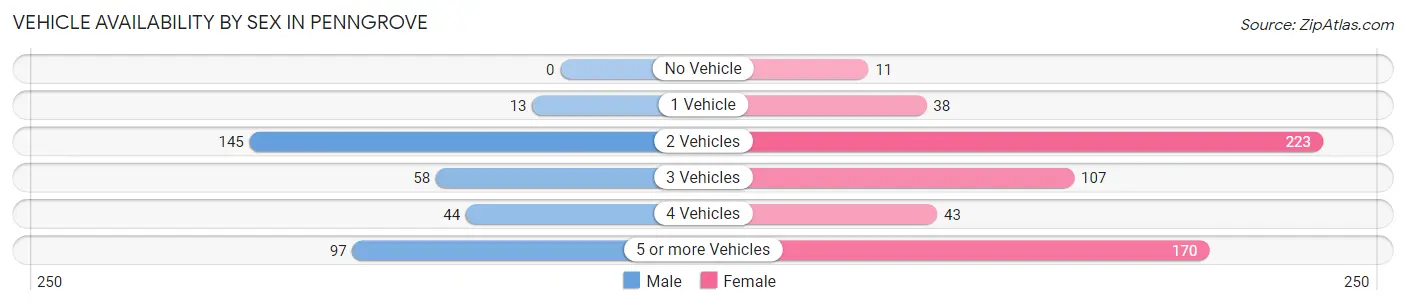
| Vehicles Available | Male | Female |
| No Vehicle | 0 (0.0%) | 11 (1.9%) |
| 1 Vehicle | 13 (3.6%) | 38 (6.4%) |
| 2 Vehicles | 145 (40.6%) | 223 (37.7%) |
| 3 Vehicles | 58 (16.3%) | 107 (18.1%) |
| 4 Vehicles | 44 (12.3%) | 43 (7.3%) |
| 5 or more Vehicles | 97 (27.2%) | 170 (28.7%) |
| Total | 357 (100.0%) | 592 (100.0%) |
Commute Time in Penngrove
The most frequently occuring commute durations in Penngrove are 20 to 24 minutes (167 commuters, 22.6%), 30 to 34 minutes (120 commuters, 16.2%), and 25 to 29 minutes (101 commuters, 13.7%).
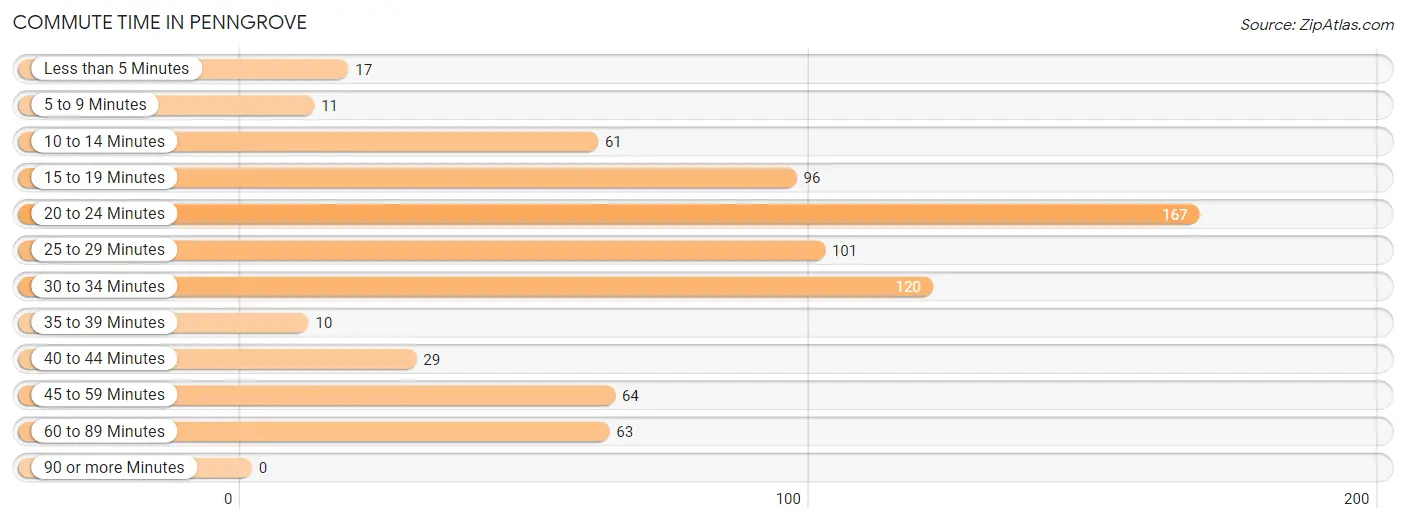
| Commute Time | # Commuters | % Commuters |
| Less than 5 Minutes | 17 | 2.3% |
| 5 to 9 Minutes | 11 | 1.5% |
| 10 to 14 Minutes | 61 | 8.3% |
| 15 to 19 Minutes | 96 | 13.0% |
| 20 to 24 Minutes | 167 | 22.6% |
| 25 to 29 Minutes | 101 | 13.7% |
| 30 to 34 Minutes | 120 | 16.2% |
| 35 to 39 Minutes | 10 | 1.3% |
| 40 to 44 Minutes | 29 | 3.9% |
| 45 to 59 Minutes | 64 | 8.7% |
| 60 to 89 Minutes | 63 | 8.5% |
| 90 or more Minutes | 0 | 0.0% |
Commute Time by Sex in Penngrove
The most common commute times in Penngrove are 25 to 29 minutes (79 commuters, 27.0%) for males and 20 to 24 minutes (104 commuters, 23.3%) for females.
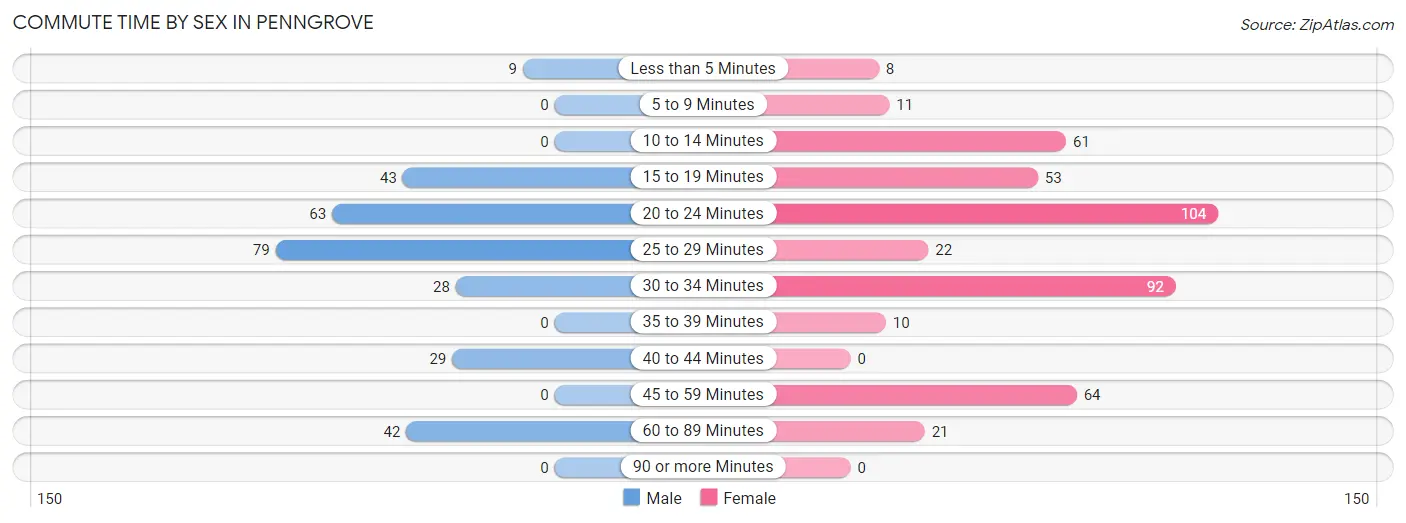
| Commute Time | Male | Female |
| Less than 5 Minutes | 9 (3.1%) | 8 (1.8%) |
| 5 to 9 Minutes | 0 (0.0%) | 11 (2.5%) |
| 10 to 14 Minutes | 0 (0.0%) | 61 (13.7%) |
| 15 to 19 Minutes | 43 (14.7%) | 53 (11.9%) |
| 20 to 24 Minutes | 63 (21.5%) | 104 (23.3%) |
| 25 to 29 Minutes | 79 (27.0%) | 22 (4.9%) |
| 30 to 34 Minutes | 28 (9.6%) | 92 (20.6%) |
| 35 to 39 Minutes | 0 (0.0%) | 10 (2.2%) |
| 40 to 44 Minutes | 29 (9.9%) | 0 (0.0%) |
| 45 to 59 Minutes | 0 (0.0%) | 64 (14.3%) |
| 60 to 89 Minutes | 42 (14.3%) | 21 (4.7%) |
| 90 or more Minutes | 0 (0.0%) | 0 (0.0%) |
Time of Departure to Work by Sex in Penngrove
The most frequent times of departure to work in Penngrove are 8:00 AM to 8:29 AM (57, 19.5%) for males and 8:00 AM to 8:29 AM (103, 23.1%) for females.
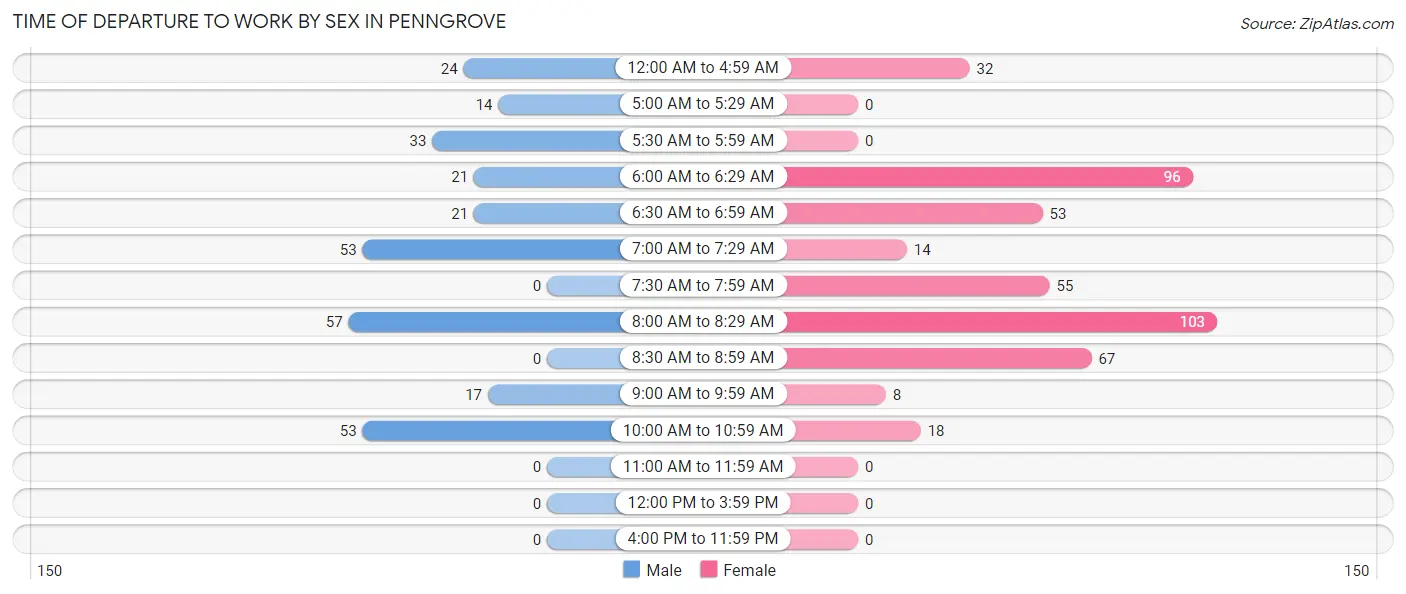
| Time of Departure | Male | Female |
| 12:00 AM to 4:59 AM | 24 (8.2%) | 32 (7.2%) |
| 5:00 AM to 5:29 AM | 14 (4.8%) | 0 (0.0%) |
| 5:30 AM to 5:59 AM | 33 (11.3%) | 0 (0.0%) |
| 6:00 AM to 6:29 AM | 21 (7.2%) | 96 (21.5%) |
| 6:30 AM to 6:59 AM | 21 (7.2%) | 53 (11.9%) |
| 7:00 AM to 7:29 AM | 53 (18.1%) | 14 (3.1%) |
| 7:30 AM to 7:59 AM | 0 (0.0%) | 55 (12.3%) |
| 8:00 AM to 8:29 AM | 57 (19.5%) | 103 (23.1%) |
| 8:30 AM to 8:59 AM | 0 (0.0%) | 67 (15.0%) |
| 9:00 AM to 9:59 AM | 17 (5.8%) | 8 (1.8%) |
| 10:00 AM to 10:59 AM | 53 (18.1%) | 18 (4.0%) |
| 11:00 AM to 11:59 AM | 0 (0.0%) | 0 (0.0%) |
| 12:00 PM to 3:59 PM | 0 (0.0%) | 0 (0.0%) |
| 4:00 PM to 11:59 PM | 0 (0.0%) | 0 (0.0%) |
| Total | 293 (100.0%) | 446 (100.0%) |
Housing Occupancy in Penngrove
Occupancy by Ownership in Penngrove
Of the total 1,008 dwellings in Penngrove, owner-occupied units account for 667 (66.2%), while renter-occupied units make up 341 (33.8%).
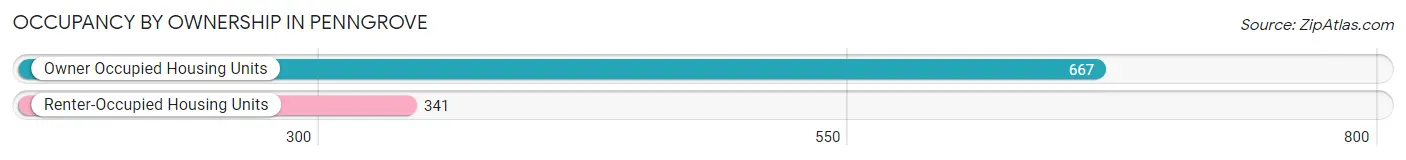
| Occupancy | # Housing Units | % Housing Units |
| Owner Occupied Housing Units | 667 | 66.2% |
| Renter-Occupied Housing Units | 341 | 33.8% |
| Total Occupied Housing Units | 1,008 | 100.0% |
Occupancy by Household Size in Penngrove
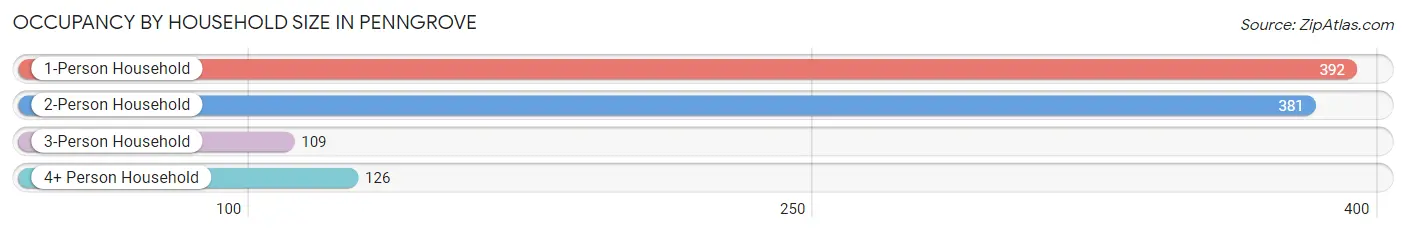
| Household Size | # Housing Units | % Housing Units |
| 1-Person Household | 392 | 38.9% |
| 2-Person Household | 381 | 37.8% |
| 3-Person Household | 109 | 10.8% |
| 4+ Person Household | 126 | 12.5% |
| Total Housing Units | 1,008 | 100.0% |
Occupancy by Ownership by Household Size in Penngrove
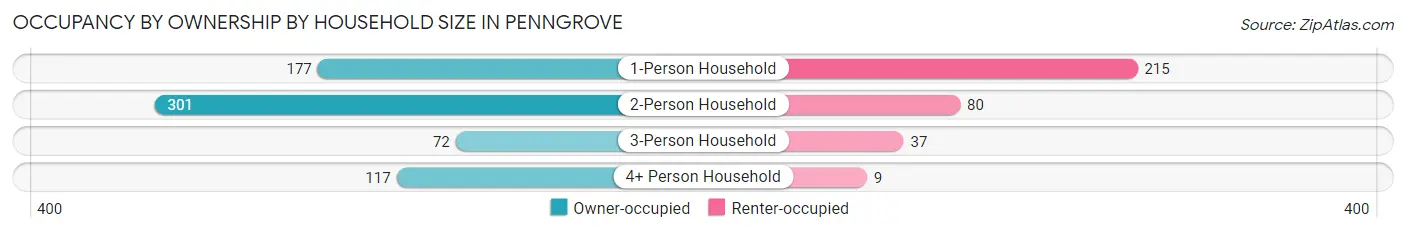
| Household Size | Owner-occupied | Renter-occupied |
| 1-Person Household | 177 (45.2%) | 215 (54.8%) |
| 2-Person Household | 301 (79.0%) | 80 (21.0%) |
| 3-Person Household | 72 (66.1%) | 37 (33.9%) |
| 4+ Person Household | 117 (92.9%) | 9 (7.1%) |
| Total Housing Units | 667 (66.2%) | 341 (33.8%) |
Occupancy by Educational Attainment in Penngrove
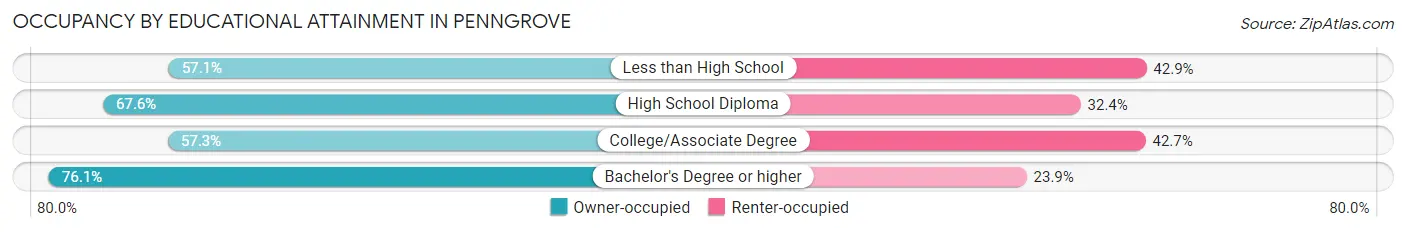
| Household Size | Owner-occupied | Renter-occupied |
| Less than High School | 28 (57.1%) | 21 (42.9%) |
| High School Diploma | 75 (67.6%) | 36 (32.4%) |
| College/Associate Degree | 248 (57.3%) | 185 (42.7%) |
| Bachelor's Degree or higher | 316 (76.1%) | 99 (23.9%) |
Occupancy by Age of Householder in Penngrove
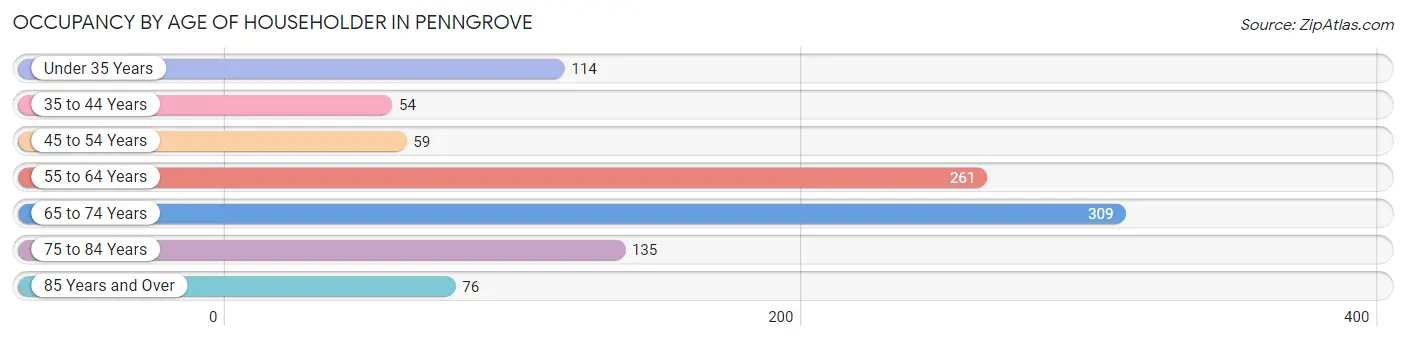
| Age Bracket | # Households | % Households |
| Under 35 Years | 114 | 11.3% |
| 35 to 44 Years | 54 | 5.4% |
| 45 to 54 Years | 59 | 5.9% |
| 55 to 64 Years | 261 | 25.9% |
| 65 to 74 Years | 309 | 30.6% |
| 75 to 84 Years | 135 | 13.4% |
| 85 Years and Over | 76 | 7.5% |
| Total | 1,008 | 100.0% |
Housing Finances in Penngrove
Median Income by Occupancy in Penngrove
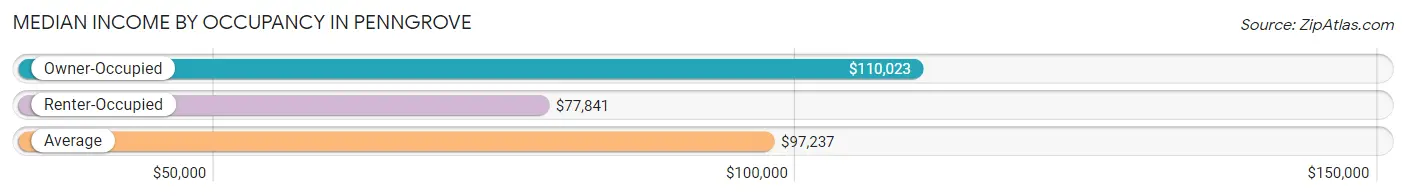
| Occupancy Type | # Households | Median Income |
| Owner-Occupied | 667 (66.2%) | $110,023 |
| Renter-Occupied | 341 (33.8%) | $77,841 |
| Average | 1,008 (100.0%) | $97,237 |
Occupancy by Householder Income Bracket in Penngrove
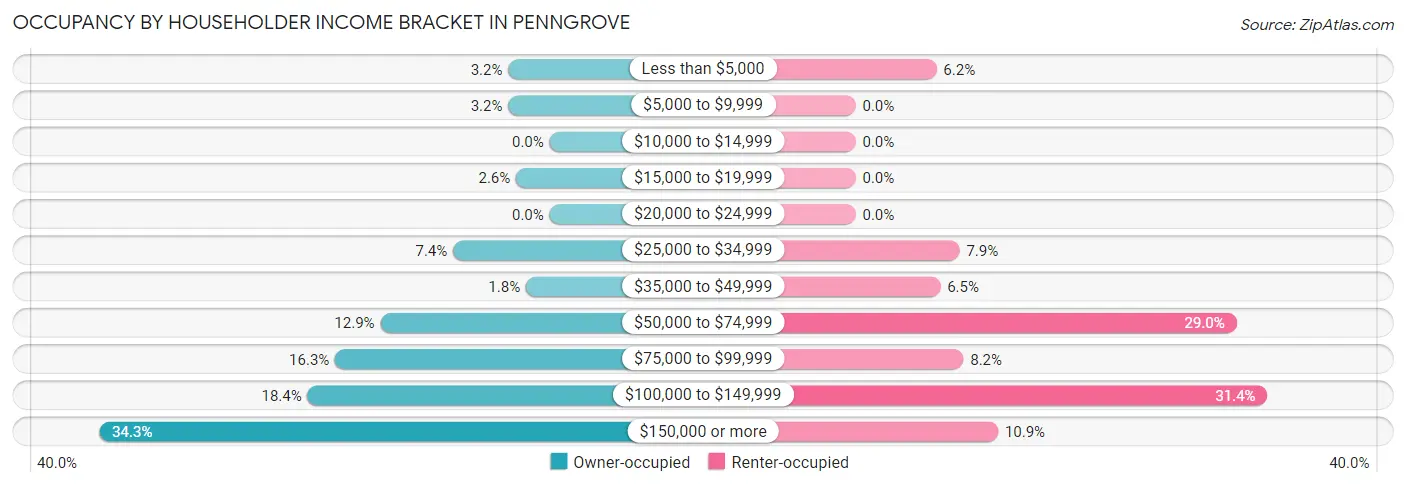
| Income Bracket | Owner-occupied | Renter-occupied |
| Less than $5,000 | 21 (3.2%) | 21 (6.2%) |
| $5,000 to $9,999 | 21 (3.2%) | 0 (0.0%) |
| $10,000 to $14,999 | 0 (0.0%) | 0 (0.0%) |
| $15,000 to $19,999 | 17 (2.5%) | 0 (0.0%) |
| $20,000 to $24,999 | 0 (0.0%) | 0 (0.0%) |
| $25,000 to $34,999 | 49 (7.3%) | 27 (7.9%) |
| $35,000 to $49,999 | 12 (1.8%) | 22 (6.5%) |
| $50,000 to $74,999 | 86 (12.9%) | 99 (29.0%) |
| $75,000 to $99,999 | 109 (16.3%) | 28 (8.2%) |
| $100,000 to $149,999 | 123 (18.4%) | 107 (31.4%) |
| $150,000 or more | 229 (34.3%) | 37 (10.8%) |
| Total | 667 (100.0%) | 341 (100.0%) |
Monthly Housing Cost Tiers in Penngrove
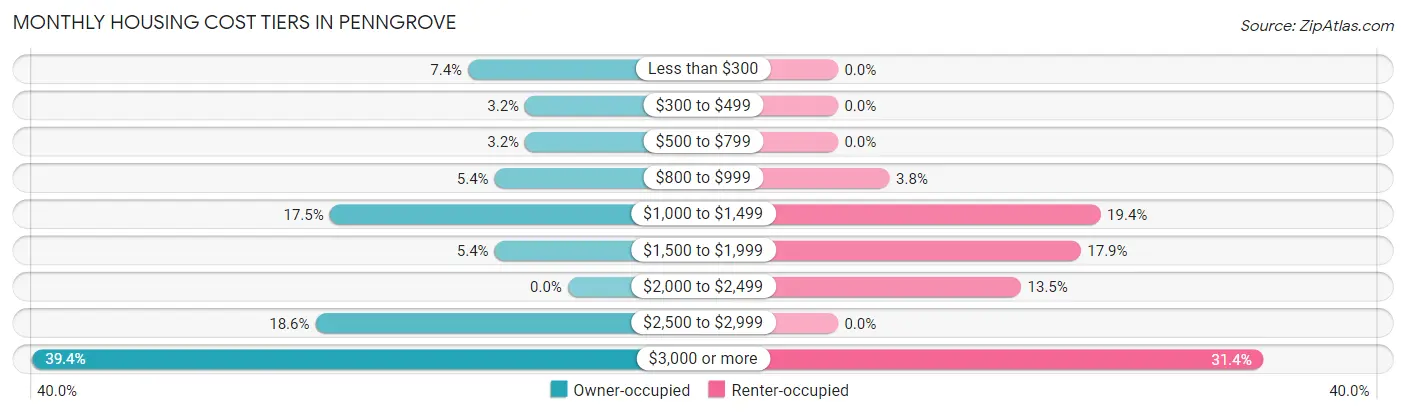
| Monthly Cost | Owner-occupied | Renter-occupied |
| Less than $300 | 49 (7.3%) | 0 (0.0%) |
| $300 to $499 | 21 (3.2%) | 0 (0.0%) |
| $500 to $799 | 21 (3.2%) | 0 (0.0%) |
| $800 to $999 | 36 (5.4%) | 13 (3.8%) |
| $1,000 to $1,499 | 117 (17.5%) | 66 (19.4%) |
| $1,500 to $1,999 | 36 (5.4%) | 61 (17.9%) |
| $2,000 to $2,499 | 0 (0.0%) | 46 (13.5%) |
| $2,500 to $2,999 | 124 (18.6%) | 0 (0.0%) |
| $3,000 or more | 263 (39.4%) | 107 (31.4%) |
| Total | 667 (100.0%) | 341 (100.0%) |
Physical Housing Characteristics in Penngrove
Housing Structures in Penngrove
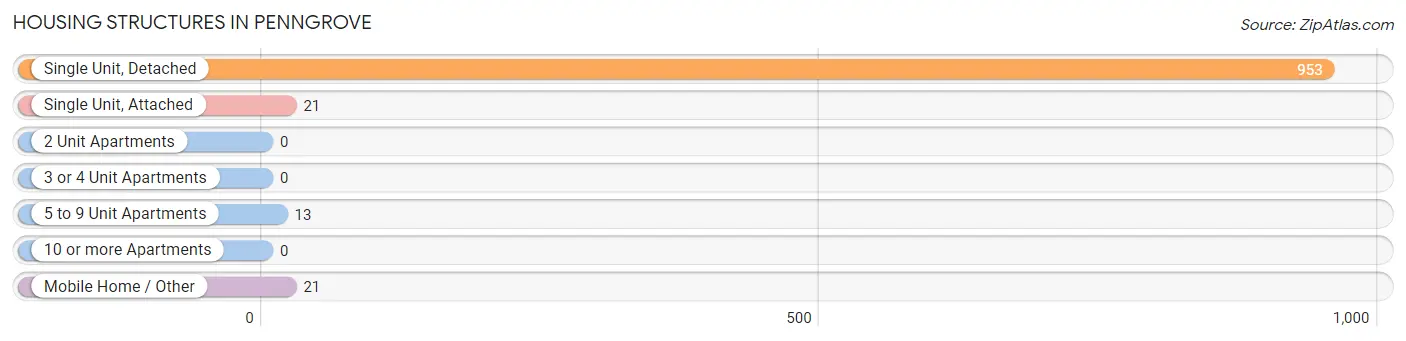
| Structure Type | # Housing Units | % Housing Units |
| Single Unit, Detached | 953 | 94.5% |
| Single Unit, Attached | 21 | 2.1% |
| 2 Unit Apartments | 0 | 0.0% |
| 3 or 4 Unit Apartments | 0 | 0.0% |
| 5 to 9 Unit Apartments | 13 | 1.3% |
| 10 or more Apartments | 0 | 0.0% |
| Mobile Home / Other | 21 | 2.1% |
| Total | 1,008 | 100.0% |
Housing Structures by Occupancy in Penngrove
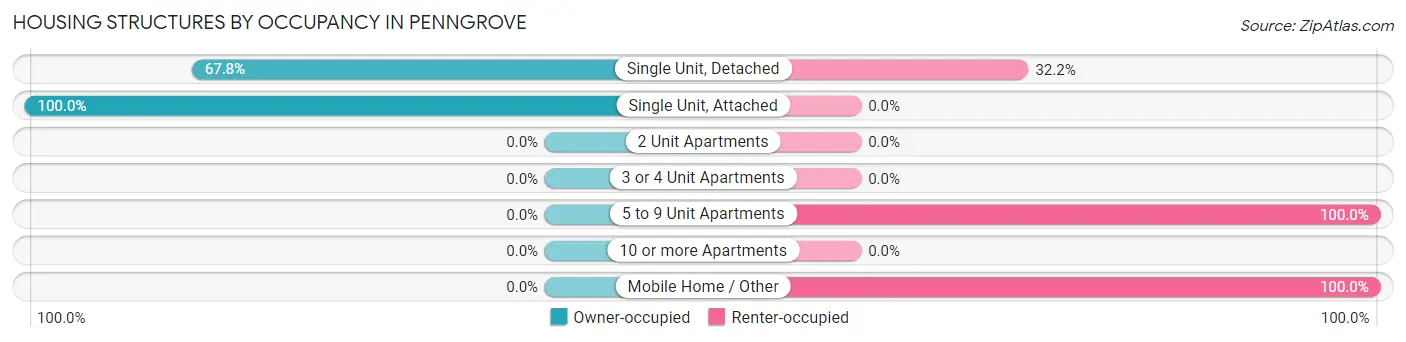
| Structure Type | Owner-occupied | Renter-occupied |
| Single Unit, Detached | 646 (67.8%) | 307 (32.2%) |
| Single Unit, Attached | 21 (100.0%) | 0 (0.0%) |
| 2 Unit Apartments | 0 (0.0%) | 0 (0.0%) |
| 3 or 4 Unit Apartments | 0 (0.0%) | 0 (0.0%) |
| 5 to 9 Unit Apartments | 0 (0.0%) | 13 (100.0%) |
| 10 or more Apartments | 0 (0.0%) | 0 (0.0%) |
| Mobile Home / Other | 0 (0.0%) | 21 (100.0%) |
| Total | 667 (66.2%) | 341 (33.8%) |
Housing Structures by Number of Rooms in Penngrove
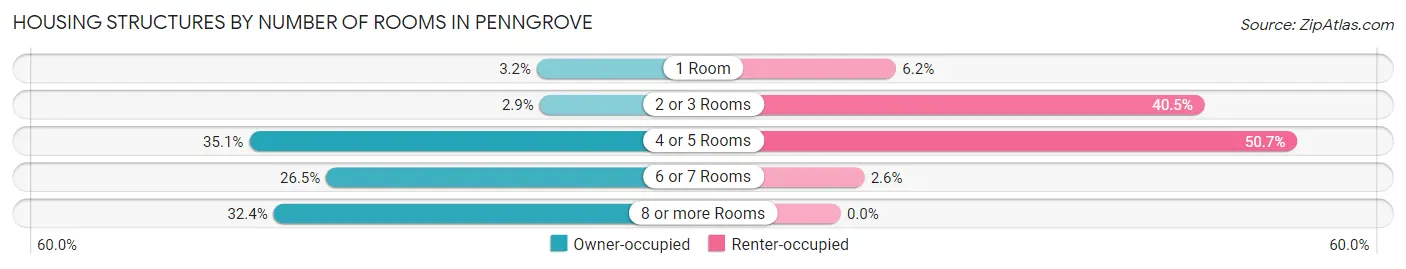
| Number of Rooms | Owner-occupied | Renter-occupied |
| 1 Room | 21 (3.2%) | 21 (6.2%) |
| 2 or 3 Rooms | 19 (2.9%) | 138 (40.5%) |
| 4 or 5 Rooms | 234 (35.1%) | 173 (50.7%) |
| 6 or 7 Rooms | 177 (26.5%) | 9 (2.6%) |
| 8 or more Rooms | 216 (32.4%) | 0 (0.0%) |
| Total | 667 (100.0%) | 341 (100.0%) |
Housing Structure by Heating Type in Penngrove
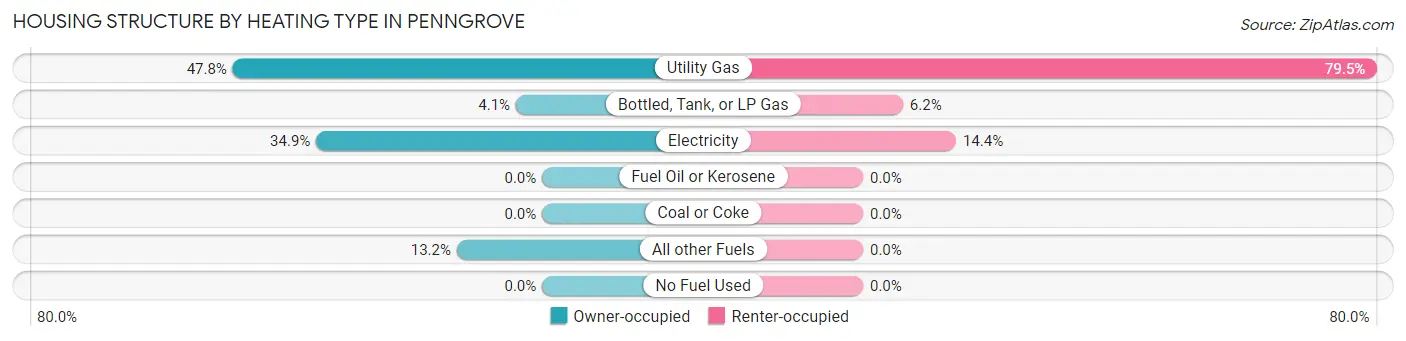
| Heating Type | Owner-occupied | Renter-occupied |
| Utility Gas | 319 (47.8%) | 271 (79.5%) |
| Bottled, Tank, or LP Gas | 27 (4.1%) | 21 (6.2%) |
| Electricity | 233 (34.9%) | 49 (14.4%) |
| Fuel Oil or Kerosene | 0 (0.0%) | 0 (0.0%) |
| Coal or Coke | 0 (0.0%) | 0 (0.0%) |
| All other Fuels | 88 (13.2%) | 0 (0.0%) |
| No Fuel Used | 0 (0.0%) | 0 (0.0%) |
| Total | 667 (100.0%) | 341 (100.0%) |
Household Vehicle Usage in Penngrove
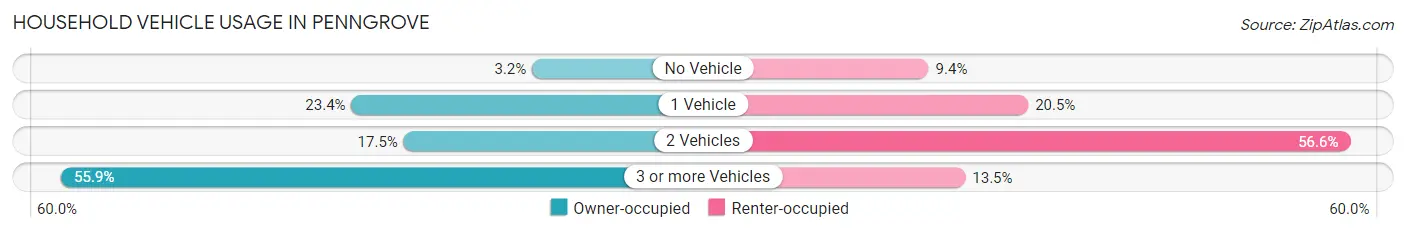
| Vehicles per Household | Owner-occupied | Renter-occupied |
| No Vehicle | 21 (3.2%) | 32 (9.4%) |
| 1 Vehicle | 156 (23.4%) | 70 (20.5%) |
| 2 Vehicles | 117 (17.5%) | 193 (56.6%) |
| 3 or more Vehicles | 373 (55.9%) | 46 (13.5%) |
| Total | 667 (100.0%) | 341 (100.0%) |
Real Estate & Mortgages in Penngrove
Real Estate and Mortgage Overview in Penngrove
| Characteristic | Without Mortgage | With Mortgage |
| Housing Units | 217 | 450 |
| Median Property Value | $1,005,600 | $1,215,000 |
| Median Household Income | - | - |
| Monthly Housing Costs | $923 | $263 |
| Real Estate Taxes | $5,938 | $0 |
Property Value by Mortgage Status in Penngrove
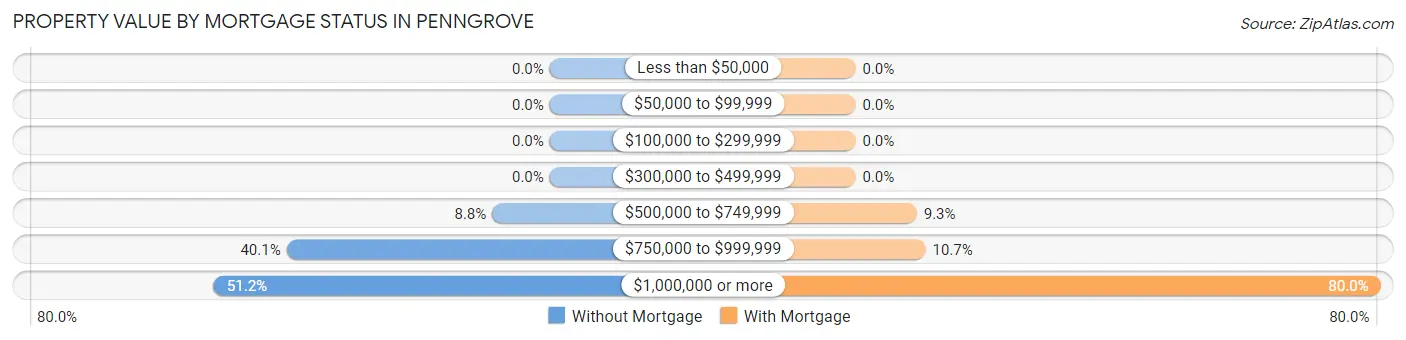
| Property Value | Without Mortgage | With Mortgage |
| Less than $50,000 | 0 (0.0%) | 0 (0.0%) |
| $50,000 to $99,999 | 0 (0.0%) | 0 (0.0%) |
| $100,000 to $299,999 | 0 (0.0%) | 0 (0.0%) |
| $300,000 to $499,999 | 0 (0.0%) | 0 (0.0%) |
| $500,000 to $749,999 | 19 (8.8%) | 42 (9.3%) |
| $750,000 to $999,999 | 87 (40.1%) | 48 (10.7%) |
| $1,000,000 or more | 111 (51.1%) | 360 (80.0%) |
| Total | 217 (100.0%) | 450 (100.0%) |
Household Income by Mortgage Status in Penngrove
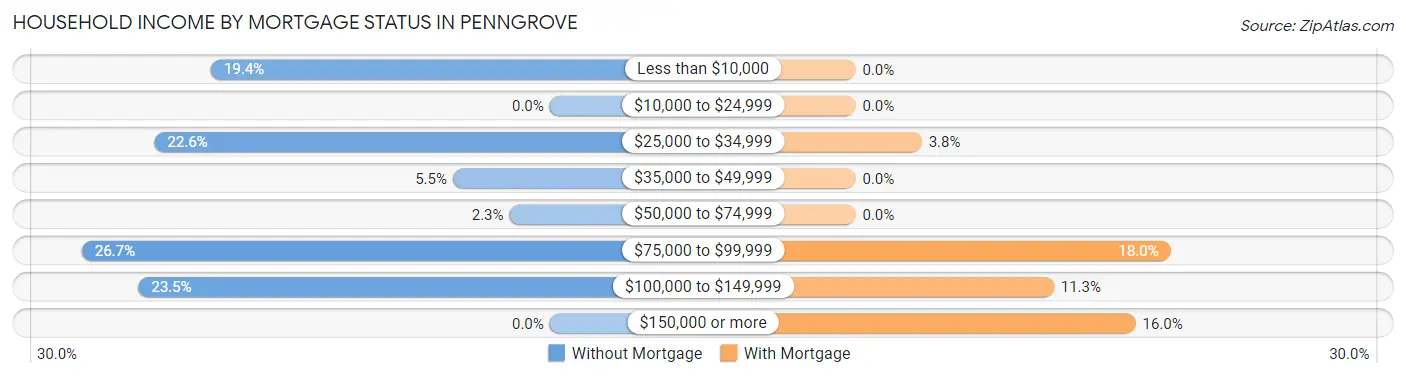
| Household Income | Without Mortgage | With Mortgage |
| Less than $10,000 | 42 (19.4%) | 0 (0.0%) |
| $10,000 to $24,999 | 0 (0.0%) | 0 (0.0%) |
| $25,000 to $34,999 | 49 (22.6%) | 17 (3.8%) |
| $35,000 to $49,999 | 12 (5.5%) | 0 (0.0%) |
| $50,000 to $74,999 | 5 (2.3%) | 0 (0.0%) |
| $75,000 to $99,999 | 58 (26.7%) | 81 (18.0%) |
| $100,000 to $149,999 | 51 (23.5%) | 51 (11.3%) |
| $150,000 or more | 0 (0.0%) | 72 (16.0%) |
| Total | 217 (100.0%) | 450 (100.0%) |
Property Value to Household Income Ratio in Penngrove
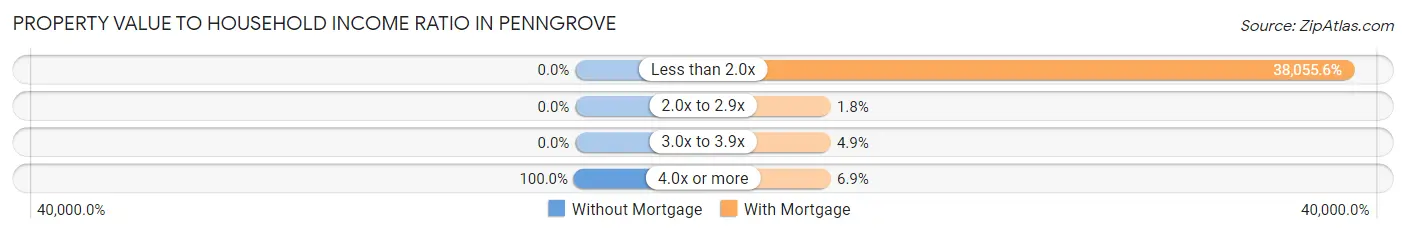
| Value-to-Income Ratio | Without Mortgage | With Mortgage |
| Less than 2.0x | 0 (0.0%) | 171,250 (38,055.6%) |
| 2.0x to 2.9x | 0 (0.0%) | 8 (1.8%) |
| 3.0x to 3.9x | 0 (0.0%) | 22 (4.9%) |
| 4.0x or more | 217 (100.0%) | 31 (6.9%) |
| Total | 217 (100.0%) | 450 (100.0%) |
Real Estate Taxes by Mortgage Status in Penngrove
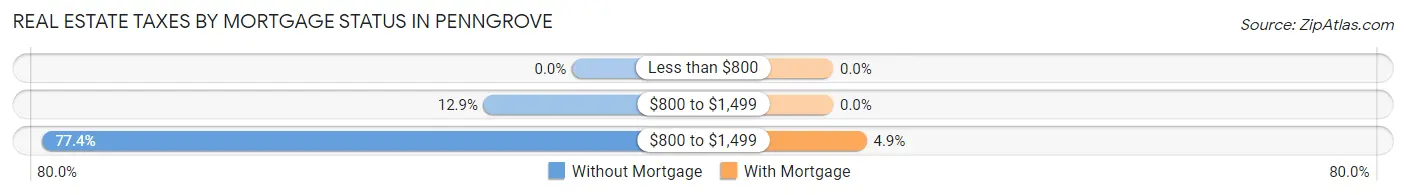
| Property Taxes | Without Mortgage | With Mortgage |
| Less than $800 | 0 (0.0%) | 0 (0.0%) |
| $800 to $1,499 | 28 (12.9%) | 0 (0.0%) |
| $800 to $1,499 | 168 (77.4%) | 22 (4.9%) |
| Total | 217 (100.0%) | 450 (100.0%) |
Health & Disability in Penngrove
Health Insurance Coverage by Age in Penngrove
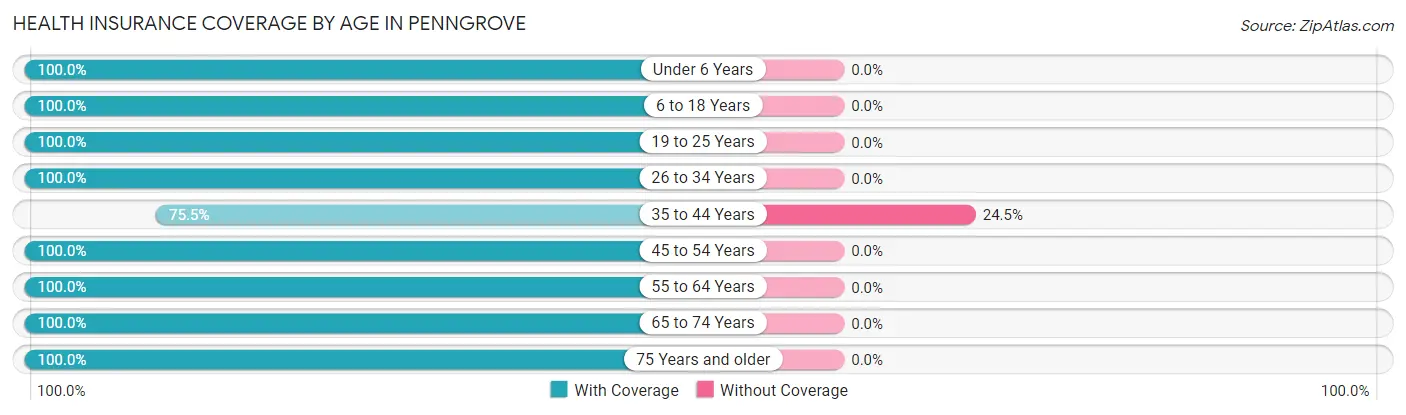
| Age Bracket | With Coverage | Without Coverage |
| Under 6 Years | 95 (100.0%) | 0 (0.0%) |
| 6 to 18 Years | 283 (100.0%) | 0 (0.0%) |
| 19 to 25 Years | 93 (100.0%) | 0 (0.0%) |
| 26 to 34 Years | 187 (100.0%) | 0 (0.0%) |
| 35 to 44 Years | 80 (75.5%) | 26 (24.5%) |
| 45 to 54 Years | 164 (100.0%) | 0 (0.0%) |
| 55 to 64 Years | 432 (100.0%) | 0 (0.0%) |
| 65 to 74 Years | 587 (100.0%) | 0 (0.0%) |
| 75 Years and older | 237 (100.0%) | 0 (0.0%) |
| Total | 2,158 (98.8%) | 26 (1.2%) |
Health Insurance Coverage by Citizenship Status in Penngrove
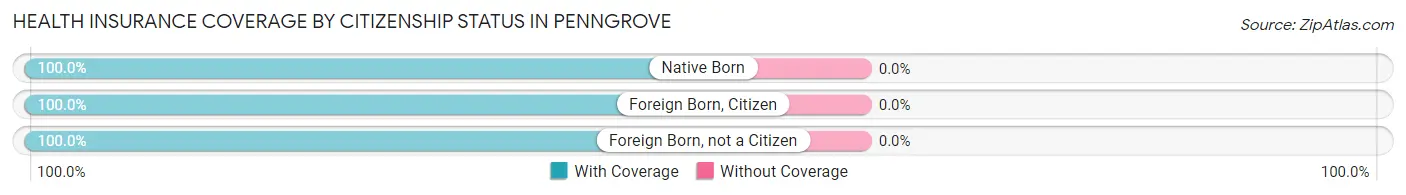
| Citizenship Status | With Coverage | Without Coverage |
| Native Born | 95 (100.0%) | 0 (0.0%) |
| Foreign Born, Citizen | 283 (100.0%) | 0 (0.0%) |
| Foreign Born, not a Citizen | 93 (100.0%) | 0 (0.0%) |
Health Insurance Coverage by Household Income in Penngrove
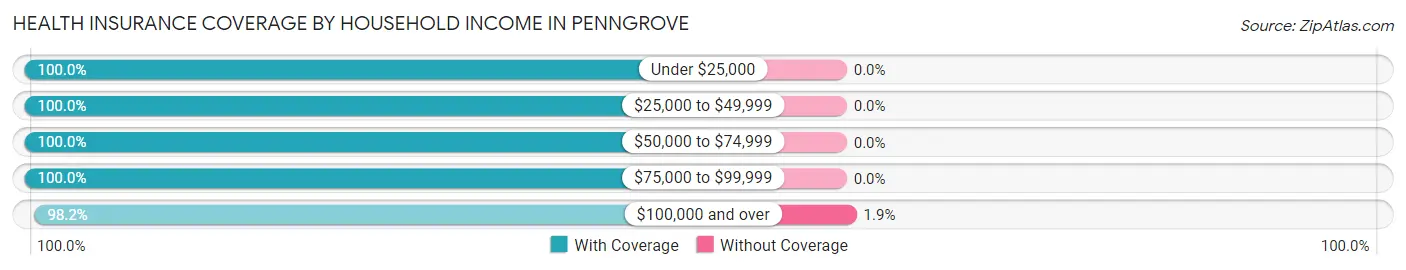
| Household Income | With Coverage | Without Coverage |
| Under $25,000 | 97 (100.0%) | 0 (0.0%) |
| $25,000 to $49,999 | 153 (100.0%) | 0 (0.0%) |
| $50,000 to $74,999 | 317 (100.0%) | 0 (0.0%) |
| $75,000 to $99,999 | 210 (100.0%) | 0 (0.0%) |
| $100,000 and over | 1,381 (98.2%) | 26 (1.8%) |
Public vs Private Health Insurance Coverage by Age in Penngrove
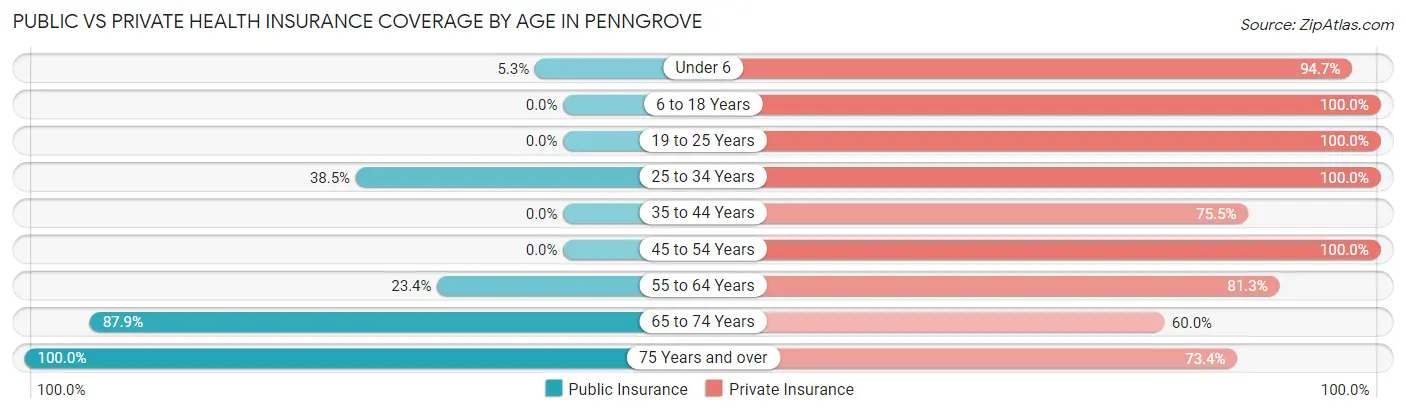
| Age Bracket | Public Insurance | Private Insurance |
| Under 6 | 5 (5.3%) | 90 (94.7%) |
| 6 to 18 Years | 0 (0.0%) | 283 (100.0%) |
| 19 to 25 Years | 0 (0.0%) | 93 (100.0%) |
| 25 to 34 Years | 72 (38.5%) | 187 (100.0%) |
| 35 to 44 Years | 0 (0.0%) | 80 (75.5%) |
| 45 to 54 Years | 0 (0.0%) | 164 (100.0%) |
| 55 to 64 Years | 101 (23.4%) | 351 (81.2%) |
| 65 to 74 Years | 516 (87.9%) | 352 (60.0%) |
| 75 Years and over | 237 (100.0%) | 174 (73.4%) |
| Total | 931 (42.6%) | 1,774 (81.2%) |
Disability Status by Sex by Age in Penngrove
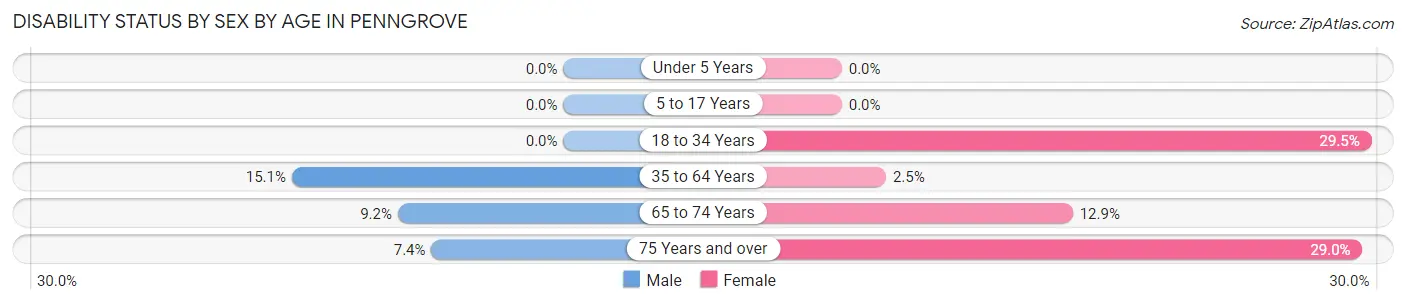
| Age Bracket | Male | Female |
| Under 5 Years | 0 (0.0%) | 0 (0.0%) |
| 5 to 17 Years | 0 (0.0%) | 0 (0.0%) |
| 18 to 34 Years | 0 (0.0%) | 59 (29.5%) |
| 35 to 64 Years | 57 (15.1%) | 8 (2.5%) |
| 65 to 74 Years | 19 (9.2%) | 49 (12.9%) |
| 75 Years and over | 5 (7.3%) | 49 (29.0%) |
Disability Class by Sex by Age in Penngrove
Disability Class: Hearing Difficulty
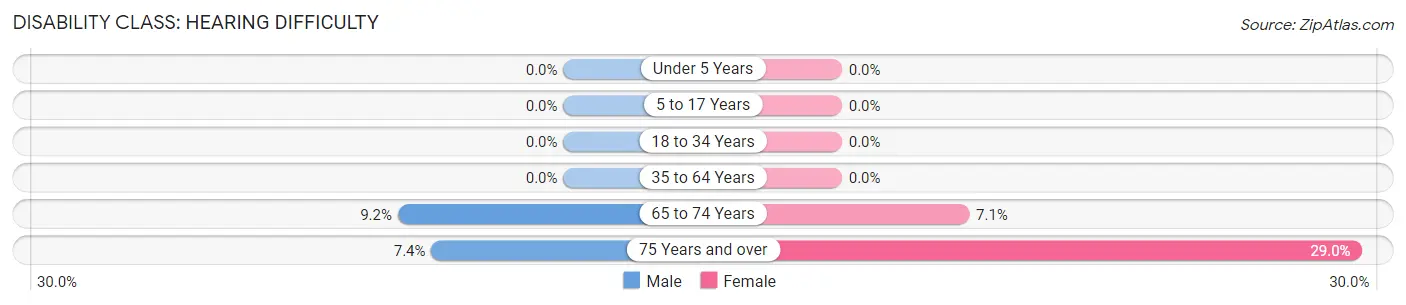
| Age Bracket | Male | Female |
| Under 5 Years | 0 (0.0%) | 0 (0.0%) |
| 5 to 17 Years | 0 (0.0%) | 0 (0.0%) |
| 18 to 34 Years | 0 (0.0%) | 0 (0.0%) |
| 35 to 64 Years | 0 (0.0%) | 0 (0.0%) |
| 65 to 74 Years | 19 (9.2%) | 27 (7.1%) |
| 75 Years and over | 5 (7.3%) | 49 (29.0%) |
Disability Class: Vision Difficulty
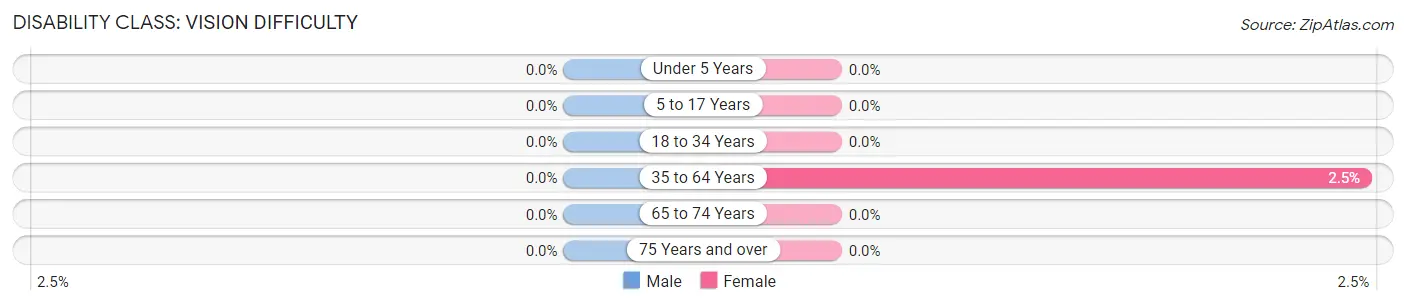
| Age Bracket | Male | Female |
| Under 5 Years | 0 (0.0%) | 0 (0.0%) |
| 5 to 17 Years | 0 (0.0%) | 0 (0.0%) |
| 18 to 34 Years | 0 (0.0%) | 0 (0.0%) |
| 35 to 64 Years | 0 (0.0%) | 8 (2.5%) |
| 65 to 74 Years | 0 (0.0%) | 0 (0.0%) |
| 75 Years and over | 0 (0.0%) | 0 (0.0%) |
Disability Class: Cognitive Difficulty
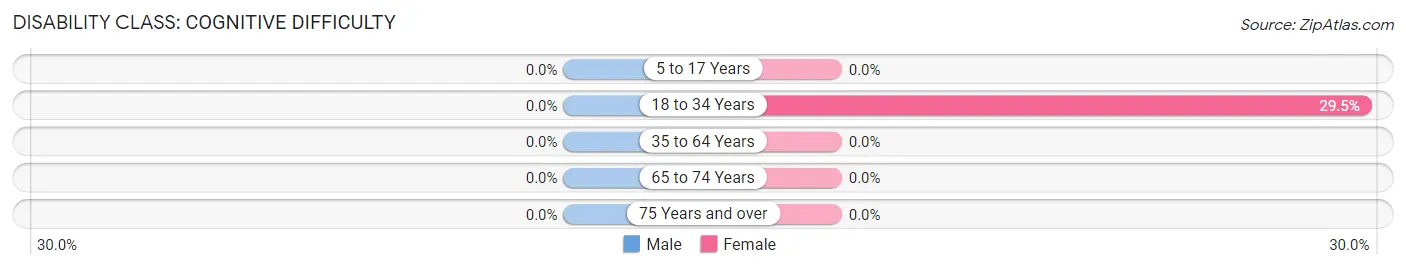
| Age Bracket | Male | Female |
| 5 to 17 Years | 0 (0.0%) | 0 (0.0%) |
| 18 to 34 Years | 0 (0.0%) | 59 (29.5%) |
| 35 to 64 Years | 0 (0.0%) | 0 (0.0%) |
| 65 to 74 Years | 0 (0.0%) | 0 (0.0%) |
| 75 Years and over | 0 (0.0%) | 0 (0.0%) |
Disability Class: Ambulatory Difficulty
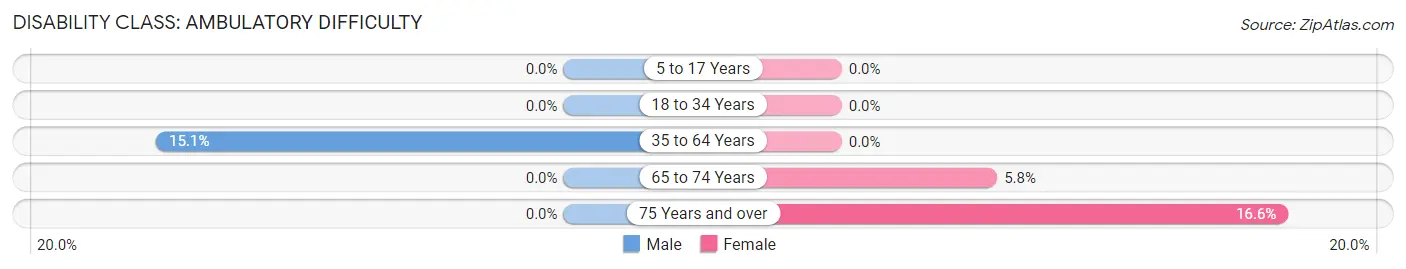
| Age Bracket | Male | Female |
| 5 to 17 Years | 0 (0.0%) | 0 (0.0%) |
| 18 to 34 Years | 0 (0.0%) | 0 (0.0%) |
| 35 to 64 Years | 57 (15.1%) | 0 (0.0%) |
| 65 to 74 Years | 0 (0.0%) | 22 (5.8%) |
| 75 Years and over | 0 (0.0%) | 28 (16.6%) |
Disability Class: Self-Care Difficulty
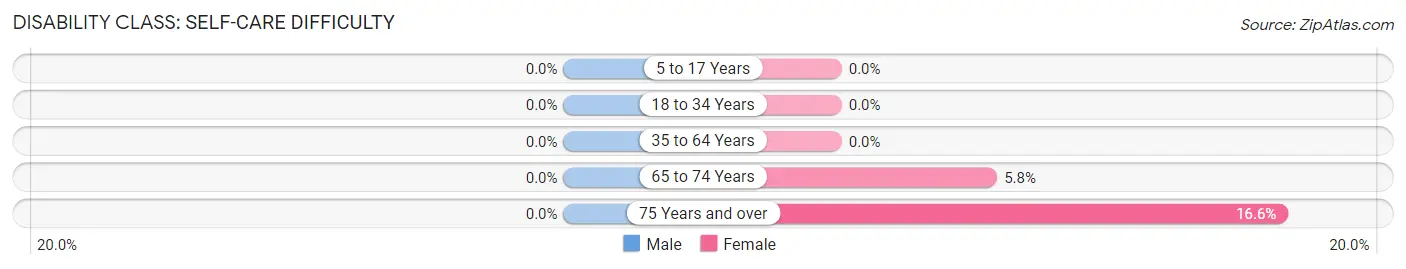
| Age Bracket | Male | Female |
| 5 to 17 Years | 0 (0.0%) | 0 (0.0%) |
| 18 to 34 Years | 0 (0.0%) | 0 (0.0%) |
| 35 to 64 Years | 0 (0.0%) | 0 (0.0%) |
| 65 to 74 Years | 0 (0.0%) | 22 (5.8%) |
| 75 Years and over | 0 (0.0%) | 28 (16.6%) |
Technology Access in Penngrove
Computing Device Access in Penngrove
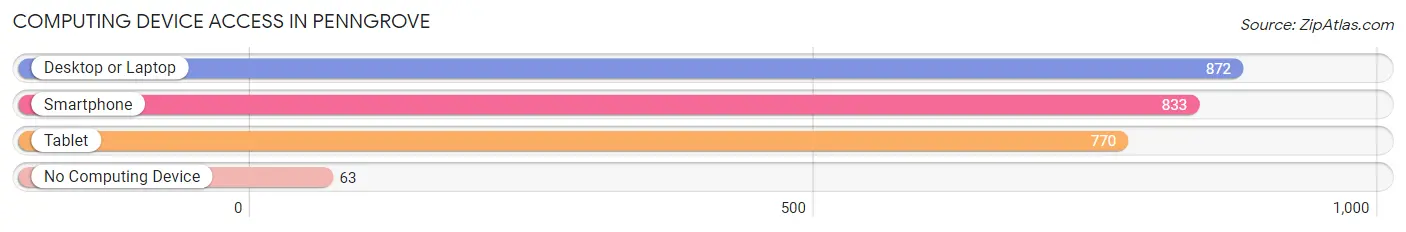
| Device Type | # Households | % Households |
| Desktop or Laptop | 872 | 86.5% |
| Smartphone | 833 | 82.6% |
| Tablet | 770 | 76.4% |
| No Computing Device | 63 | 6.2% |
| Total | 1,008 | 100.0% |
Internet Access in Penngrove
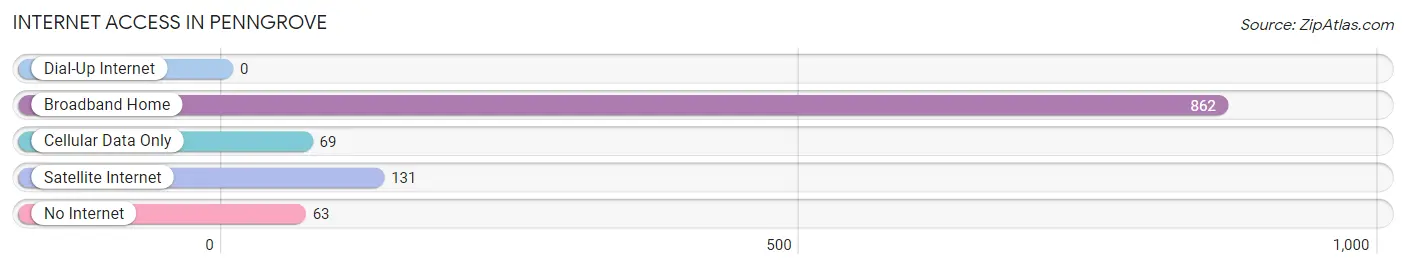
| Internet Type | # Households | % Households |
| Dial-Up Internet | 0 | 0.0% |
| Broadband Home | 862 | 85.5% |
| Cellular Data Only | 69 | 6.9% |
| Satellite Internet | 131 | 13.0% |
| No Internet | 63 | 6.2% |
| Total | 1,008 | 100.0% |
Penngrove Summary
Penngrove is a small unincorporated community located in Sonoma County, California. It is situated in the northern part of the county, about 10 miles north of the city of Santa Rosa. The population of Penngrove was estimated to be 2,522 in 2019.
History
Penngrove was founded in 1871 by William and Mary Penngrove, who purchased the land from the Mexican government. The Penngroves were among the first settlers in the area and established a successful dairy farm. The town was named after the Penngrove family and was officially incorporated in 1872.
In the early 1900s, Penngrove was a thriving agricultural community, with many farms and ranches in the area. The town was also home to a number of small businesses, including a blacksmith shop, a general store, and a post office.
In the 1950s, the town began to experience a decline in population as many of the farms and ranches closed down. However, in the late 1970s, the town experienced a resurgence in population as people began to move to the area for its rural charm and proximity to the city of Santa Rosa.
Geography
Penngrove is located in the northern part of Sonoma County, about 10 miles north of the city of Santa Rosa. The town is situated in a rural area, surrounded by rolling hills and open fields. The Petaluma River runs through the town, providing a scenic backdrop.
The climate in Penngrove is mild, with temperatures ranging from the mid-50s to the mid-70s throughout the year. The area receives an average of 25 inches of rain per year, with most of the precipitation occurring in the winter months.
Economy
The economy of Penngrove is largely based on agriculture and tourism. The town is home to several wineries and vineyards, as well as a number of small businesses. The town also has a number of restaurants, cafes, and shops.
The town is also home to a number of small manufacturing companies, including a furniture maker and a metal fabricator. The town is also home to a number of small technology companies, including a software development firm and a web design company.
Demographics
As of 2019, the population of Penngrove was estimated to be 2,522. The population is predominantly white (90.2%), with a small percentage of Hispanic (4.2%) and Asian (2.3%) residents. The median household income in Penngrove is $90,845, which is higher than the national average.
The town has a low crime rate and is considered to be a safe place to live. The town is served by the Penngrove Elementary School District, which provides education for students in grades K-8. The town is also home to a number of parks and recreational facilities, including a skate park and a community pool.
Common Questions
What is Per Capita Income in Penngrove?
Per Capita income in Penngrove is $70,780.
What is the Median Family Income in Penngrove?
Median Family Income in Penngrove is $135,789.
What is the Median Household income in Penngrove?
Median Household Income in Penngrove is $97,237.
What is Income or Wage Gap in Penngrove?
Income or Wage Gap in Penngrove is 36.4%.
Women in Penngrove earn 63.6 cents for every dollar earned by a man.
What is Inequality or Gini Index in Penngrove?
Inequality or Gini Index in Penngrove is 0.50.
What is the Total Population of Penngrove?
Total Population of Penngrove is 2,184.
What is the Total Male Population of Penngrove?
Total Male Population of Penngrove is 972.
What is the Total Female Population of Penngrove?
Total Female Population of Penngrove is 1,212.
What is the Ratio of Males per 100 Females in Penngrove?
There are 80.20 Males per 100 Females in Penngrove.
What is the Ratio of Females per 100 Males in Penngrove?
There are 124.69 Females per 100 Males in Penngrove.
What is the Median Population Age in Penngrove?
Median Population Age in Penngrove is 59.0 Years.
What is the Average Family Size in Penngrove
Average Family Size in Penngrove is 2.7 People.
What is the Average Household Size in Penngrove
Average Household Size in Penngrove is 2.2 People.
How Large is the Labor Force in Penngrove?
There are 1,030 People in the Labor Forcein in Penngrove.
What is the Percentage of People in the Labor Force in Penngrove?
56.3% of People are in the Labor Force in Penngrove.
What is the Unemployment Rate in Penngrove?
Unemployment Rate in Penngrove is 6.3%.