Carrollton, VA Map & Demographics
Carrollton Map
Carrollton Overview
$49,983
PER CAPITA INCOME
$123,750
AVG FAMILY INCOME
$108,953
AVG HOUSEHOLD INCOME
6.8%
WAGE / INCOME GAP [ % ]
93.2¢/ $1
WAGE / INCOME GAP [ $ ]
0.39
INEQUALITY / GINI INDEX
7,330
TOTAL POPULATION
4,117
MALE POPULATION
3,213
FEMALE POPULATION
128.14
MALES / 100 FEMALES
78.04
FEMALES / 100 MALES
37.4
MEDIAN AGE
3.2
AVG FAMILY SIZE
2.7
AVG HOUSEHOLD SIZE
4,150
LABOR FORCE [ PEOPLE ]
72.7%
PERCENT IN LABOR FORCE
11.8%
UNEMPLOYMENT RATE
Carrollton Zip Codes
Carrollton Area Codes
Income in Carrollton
Income Overview in Carrollton
Per Capita Income in Carrollton is $49,983, while median incomes of families and households are $123,750 and $108,953 respectively.
| Characteristic | Number | Measure |
| Per Capita Income | 7,330 | $49,983 |
| Median Family Income | 2,021 | $123,750 |
| Mean Family Income | 2,021 | $156,817 |
| Median Household Income | 2,732 | $108,953 |
| Mean Household Income | 2,732 | $136,425 |
| Income Deficit | 2,021 | $0 |
| Wage / Income Gap (%) | 7,330 | 6.84% |
| Wage / Income Gap ($) | 7,330 | 93.16¢ per $1 |
| Gini / Inequality Index | 7,330 | 0.39 |
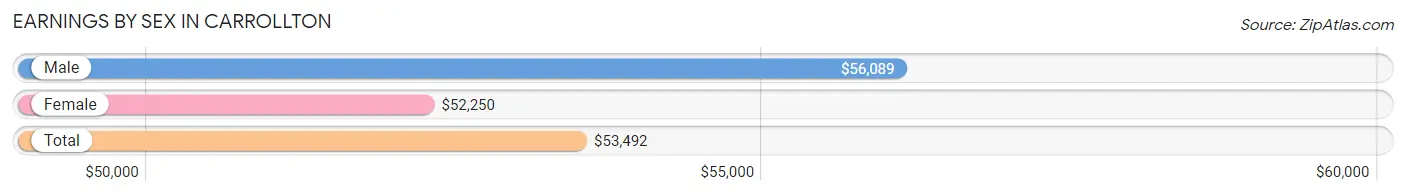
Earnings by Sex in Carrollton
Average Earnings in Carrollton are $53,492, $56,089 for men and $52,250 for women, a difference of 6.8%.
| Sex | Number | Average Earnings |
| Male | 2,417 (57.8%) | $56,089 |
| Female | 1,765 (42.2%) | $52,250 |
| Total | 4,182 (100.0%) | $53,492 |
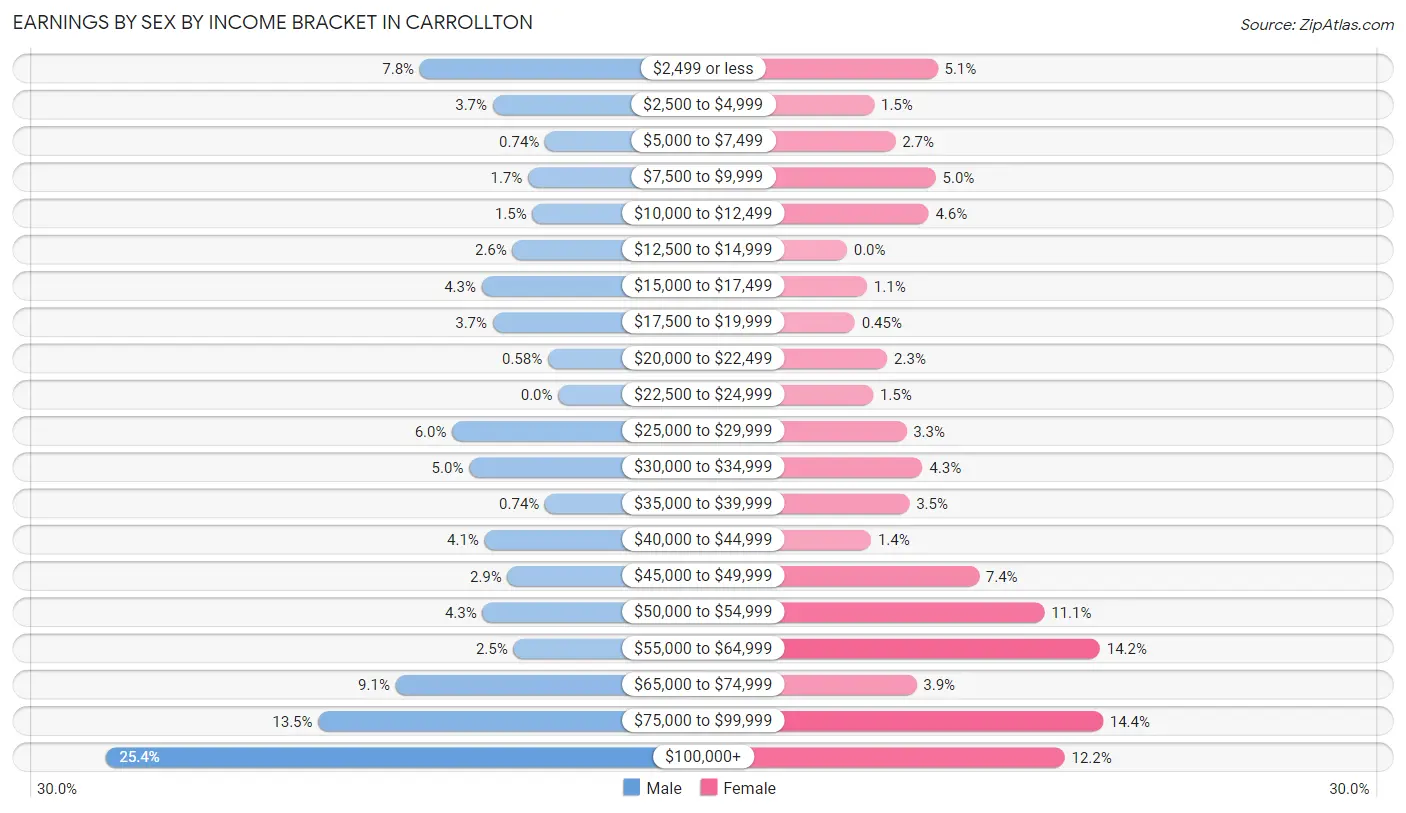
Earnings by Sex by Income Bracket in Carrollton
The most common earnings brackets in Carrollton are $100,000+ for men (614 | 25.4%) and $75,000 to $99,999 for women (254 | 14.4%).
| Income | Male | Female |
| $2,499 or less | 188 (7.8%) | 90 (5.1%) |
| $2,500 to $4,999 | 89 (3.7%) | 27 (1.5%) |
| $5,000 to $7,499 | 18 (0.7%) | 48 (2.7%) |
| $7,500 to $9,999 | 41 (1.7%) | 88 (5.0%) |
| $10,000 to $12,499 | 35 (1.5%) | 81 (4.6%) |
| $12,500 to $14,999 | 62 (2.6%) | 0 (0.0%) |
| $15,000 to $17,499 | 104 (4.3%) | 20 (1.1%) |
| $17,500 to $19,999 | 89 (3.7%) | 8 (0.4%) |
| $20,000 to $22,499 | 14 (0.6%) | 40 (2.3%) |
| $22,500 to $24,999 | 0 (0.0%) | 26 (1.5%) |
| $25,000 to $29,999 | 144 (6.0%) | 59 (3.3%) |
| $30,000 to $34,999 | 121 (5.0%) | 75 (4.3%) |
| $35,000 to $39,999 | 18 (0.7%) | 62 (3.5%) |
| $40,000 to $44,999 | 100 (4.1%) | 24 (1.4%) |
| $45,000 to $49,999 | 69 (2.9%) | 131 (7.4%) |
| $50,000 to $54,999 | 103 (4.3%) | 196 (11.1%) |
| $55,000 to $64,999 | 61 (2.5%) | 251 (14.2%) |
| $65,000 to $74,999 | 221 (9.1%) | 69 (3.9%) |
| $75,000 to $99,999 | 326 (13.5%) | 254 (14.4%) |
| $100,000+ | 614 (25.4%) | 216 (12.2%) |
| Total | 2,417 (100.0%) | 1,765 (100.0%) |
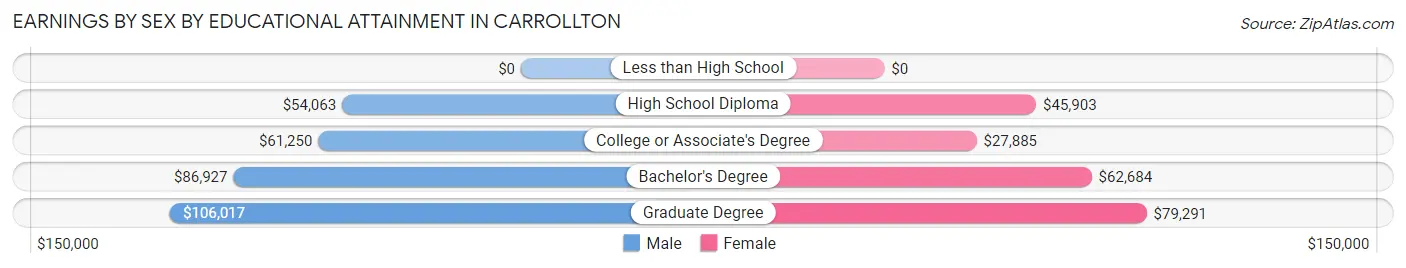
Earnings by Sex by Educational Attainment in Carrollton
Average earnings in Carrollton are $72,788 for men and $55,146 for women, a difference of 24.2%. Men with an educational attainment of graduate degree enjoy the highest average annual earnings of $106,017, while those with high school diploma education earn the least with $54,063. Women with an educational attainment of graduate degree earn the most with the average annual earnings of $79,291, while those with college or associate's degree education have the smallest earnings of $27,885.
| Educational Attainment | Male Income | Female Income |
| Less than High School | - | - |
| High School Diploma | $54,063 | $45,903 |
| College or Associate's Degree | $61,250 | $27,885 |
| Bachelor's Degree | $86,927 | $62,684 |
| Graduate Degree | $106,017 | $79,291 |
| Total | $72,788 | $55,146 |
Family Income in Carrollton
Family Income Brackets in Carrollton
According to the Carrollton family income data, there are 639 families falling into the $200,000+ income range, which is the most common income bracket and makes up 31.6% of all families.
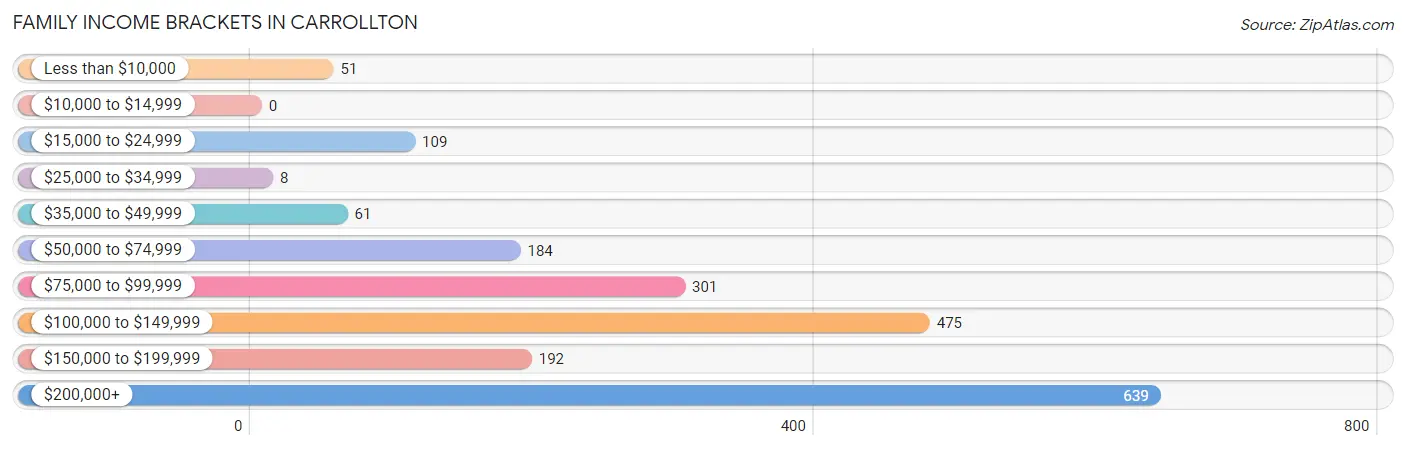
| Income Bracket | # Families | % Families |
| Less than $10,000 | 51 | 2.5% |
| $10,000 to $14,999 | 0 | 0.0% |
| $15,000 to $24,999 | 109 | 5.4% |
| $25,000 to $34,999 | 8 | 0.4% |
| $35,000 to $49,999 | 61 | 3.0% |
| $50,000 to $74,999 | 184 | 9.1% |
| $75,000 to $99,999 | 301 | 14.9% |
| $100,000 to $149,999 | 475 | 23.5% |
| $150,000 to $199,999 | 192 | 9.5% |
| $200,000+ | 639 | 31.6% |
Family Income by Famaliy Size in Carrollton
4-person families (278 | 13.8%) account for the highest median family income in Carrollton with $210,441 per family, while 4-person families (278 | 13.8%) have the highest median income of $52,610 per family member.
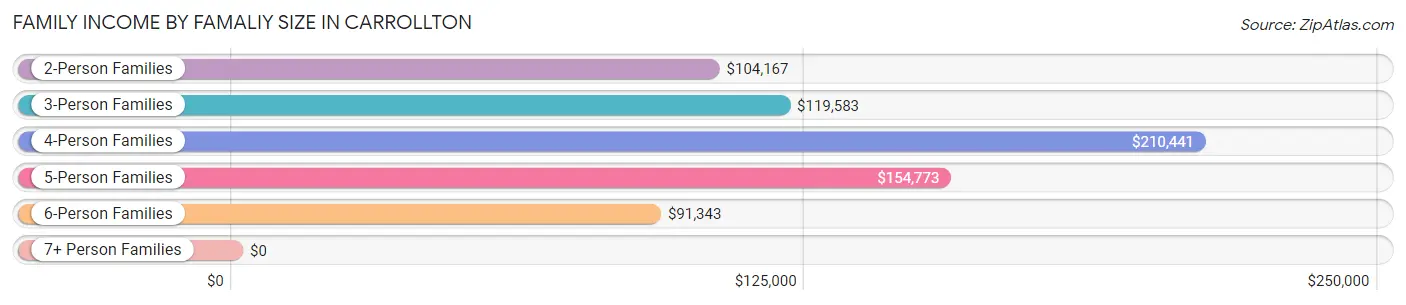
| Income Bracket | # Families | Median Income |
| 2-Person Families | 720 (35.6%) | $104,167 |
| 3-Person Families | 664 (32.9%) | $119,583 |
| 4-Person Families | 278 (13.8%) | $210,441 |
| 5-Person Families | 264 (13.1%) | $154,773 |
| 6-Person Families | 89 (4.4%) | $91,343 |
| 7+ Person Families | 6 (0.3%) | $0 |
| Total | 2,021 (100.0%) | $123,750 |
Family Income by Number of Earners in Carrollton
The median family income in Carrollton is $123,750, with families comprising 3+ earners (292) having the highest median family income of $194,118, while families with no earners (150) have the lowest median family income of $71,786, accounting for 14.4% and 7.4% of families, respectively.
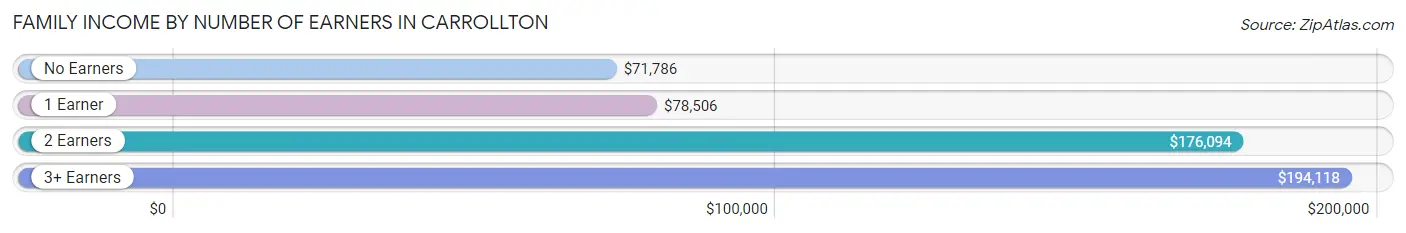
| Number of Earners | # Families | Median Income |
| No Earners | 150 (7.4%) | $71,786 |
| 1 Earner | 671 (33.2%) | $78,506 |
| 2 Earners | 908 (44.9%) | $176,094 |
| 3+ Earners | 292 (14.4%) | $194,118 |
| Total | 2,021 (100.0%) | $123,750 |
Household Income in Carrollton
Household Income Brackets in Carrollton
With 683 households falling in the category, the $100,000 to $149,999 income range is the most frequent in Carrollton, accounting for 25.0% of all households. In contrast, only 3 households (0.1%) fall into the less than $10,000 income bracket, making it the least populous group.
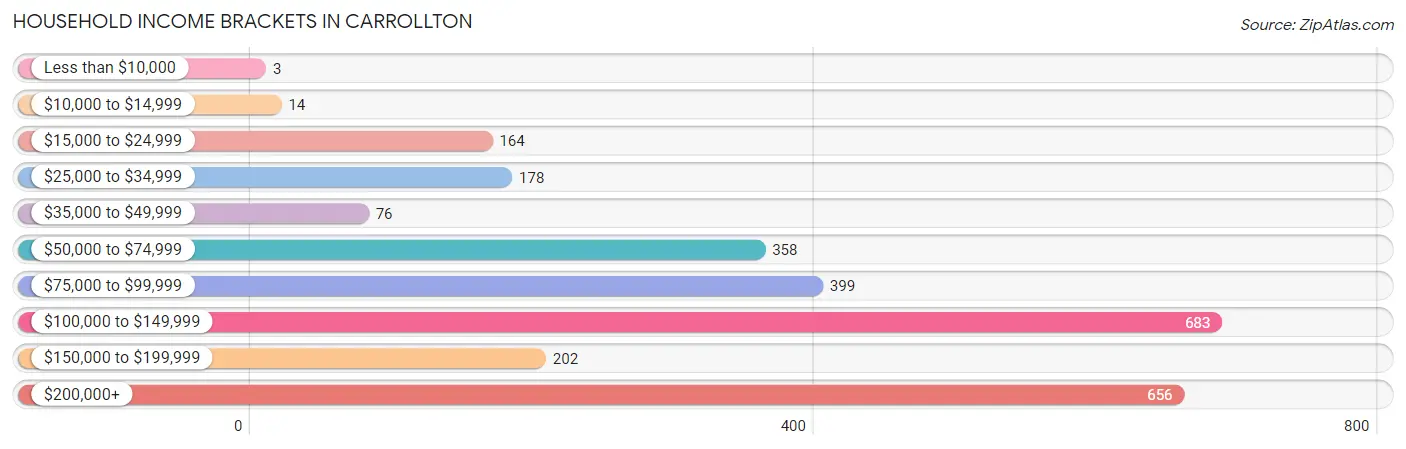
| Income Bracket | # Households | % Households |
| Less than $10,000 | 3 | 0.1% |
| $10,000 to $14,999 | 14 | 0.5% |
| $15,000 to $24,999 | 164 | 6.0% |
| $25,000 to $34,999 | 178 | 6.5% |
| $35,000 to $49,999 | 76 | 2.8% |
| $50,000 to $74,999 | 358 | 13.1% |
| $75,000 to $99,999 | 399 | 14.6% |
| $100,000 to $149,999 | 683 | 25.0% |
| $150,000 to $199,999 | 202 | 7.4% |
| $200,000+ | 656 | 24.0% |
Household Income by Householder Age in Carrollton
The median household income in Carrollton is $108,953, with the highest median household income of $137,309 found in the 45 to 64 years age bracket for the primary householder. A total of 1,045 households (38.3%) fall into this category. Meanwhile, the 65+ years age bracket for the primary householder has the lowest median household income of $73,125, with 518 households (19.0%) in this group.
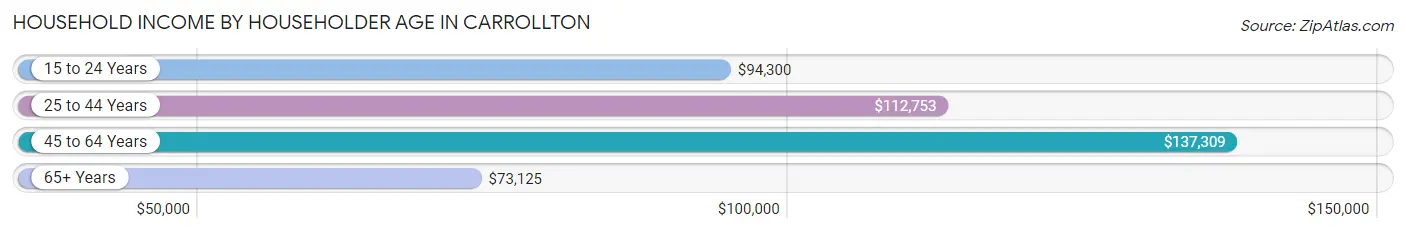
| Income Bracket | # Households | Median Income |
| 15 to 24 Years | 80 (2.9%) | $94,300 |
| 25 to 44 Years | 1,089 (39.9%) | $112,753 |
| 45 to 64 Years | 1,045 (38.3%) | $137,309 |
| 65+ Years | 518 (19.0%) | $73,125 |
| Total | 2,732 (100.0%) | $108,953 |
Poverty in Carrollton
Income Below Poverty by Sex and Age in Carrollton
With 4.2% poverty level for males and 5.7% for females among the residents of Carrollton, 6 to 11 year old males and under 5 year old females are the most vulnerable to poverty, with 61 males (13.8%) and 68 females (38.4%) in their respective age groups living below the poverty level.
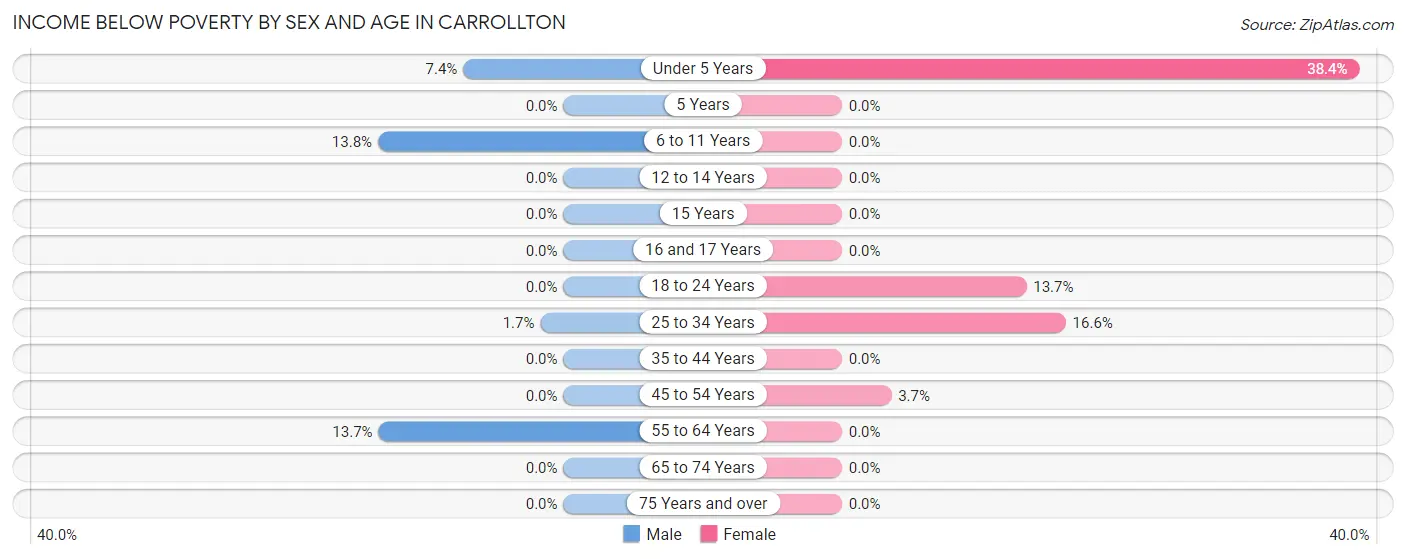
| Age Bracket | Male | Female |
| Under 5 Years | 18 (7.4%) | 68 (38.4%) |
| 5 Years | 0 (0.0%) | 0 (0.0%) |
| 6 to 11 Years | 61 (13.8%) | 0 (0.0%) |
| 12 to 14 Years | 0 (0.0%) | 0 (0.0%) |
| 15 Years | 0 (0.0%) | 0 (0.0%) |
| 16 and 17 Years | 0 (0.0%) | 0 (0.0%) |
| 18 to 24 Years | 0 (0.0%) | 37 (13.7%) |
| 25 to 34 Years | 8 (1.7%) | 59 (16.6%) |
| 35 to 44 Years | 0 (0.0%) | 0 (0.0%) |
| 45 to 54 Years | 0 (0.0%) | 17 (3.7%) |
| 55 to 64 Years | 85 (13.7%) | 0 (0.0%) |
| 65 to 74 Years | 0 (0.0%) | 0 (0.0%) |
| 75 Years and over | 0 (0.0%) | 0 (0.0%) |
| Total | 172 (4.2%) | 181 (5.7%) |
Income Above Poverty by Sex and Age in Carrollton
According to the poverty statistics in Carrollton, males aged 5 years and females aged 5 years are the age groups that are most secure financially, with 100.0% of males and 100.0% of females in these age groups living above the poverty line.
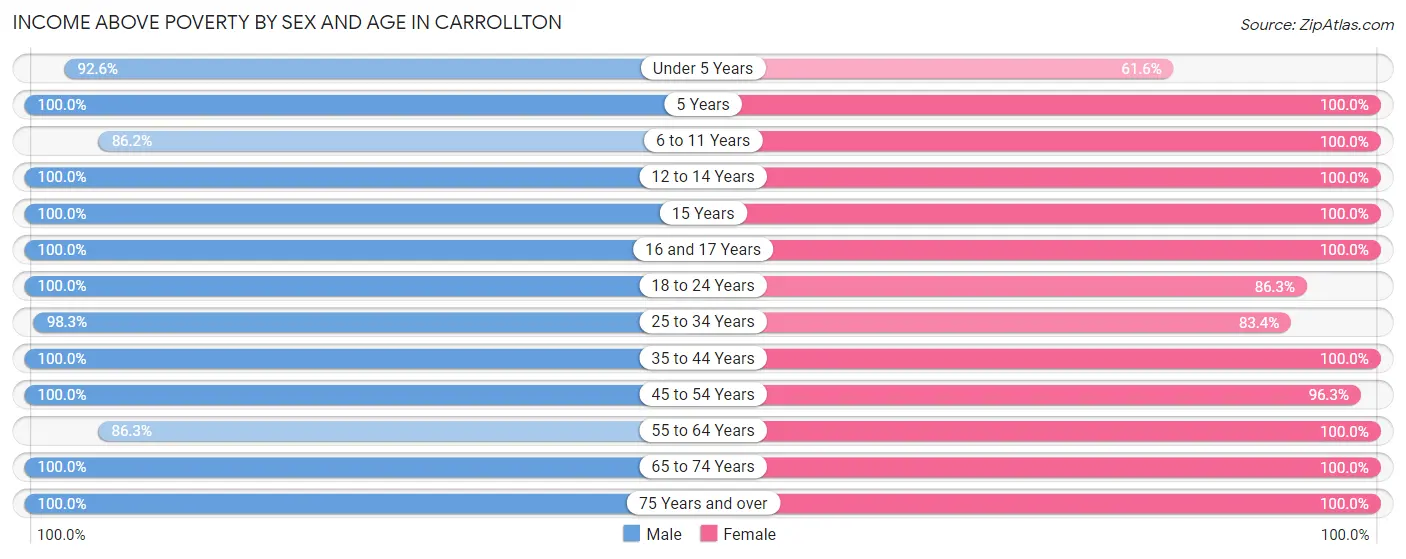
| Age Bracket | Male | Female |
| Under 5 Years | 224 (92.6%) | 109 (61.6%) |
| 5 Years | 10 (100.0%) | 13 (100.0%) |
| 6 to 11 Years | 382 (86.2%) | 310 (100.0%) |
| 12 to 14 Years | 202 (100.0%) | 134 (100.0%) |
| 15 Years | 25 (100.0%) | 51 (100.0%) |
| 16 and 17 Years | 187 (100.0%) | 31 (100.0%) |
| 18 to 24 Years | 506 (100.0%) | 233 (86.3%) |
| 25 to 34 Years | 460 (98.3%) | 296 (83.4%) |
| 35 to 44 Years | 629 (100.0%) | 535 (100.0%) |
| 45 to 54 Years | 372 (100.0%) | 446 (96.3%) |
| 55 to 64 Years | 534 (86.3%) | 417 (100.0%) |
| 65 to 74 Years | 285 (100.0%) | 308 (100.0%) |
| 75 Years and over | 124 (100.0%) | 139 (100.0%) |
| Total | 3,940 (95.8%) | 3,022 (94.4%) |
Income Below Poverty Among Married-Couple Families in Carrollton
The poverty statistics for married-couple families in Carrollton show that 5.3% or 89 of the total 1,683 families live below the poverty line. Families with no children have the highest poverty rate of 9.3%, comprising of 81 families. On the other hand, families with 1 or 2 children have the lowest poverty rate of 0.0%, which includes 0 families.
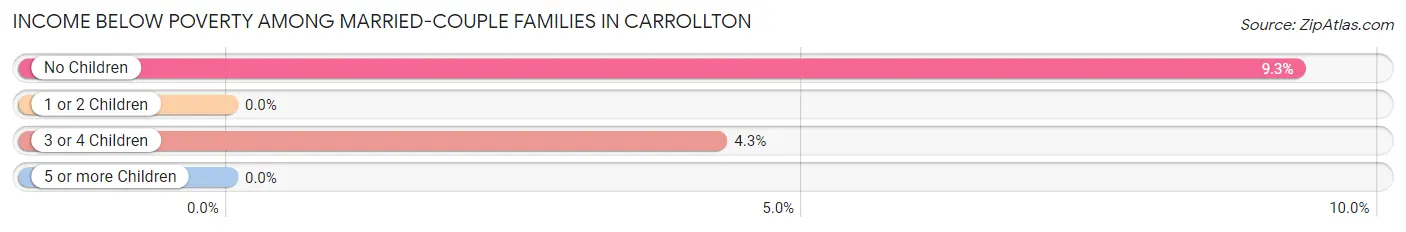
| Children | Above Poverty | Below Poverty |
| No Children | 791 (90.7%) | 81 (9.3%) |
| 1 or 2 Children | 623 (100.0%) | 0 (0.0%) |
| 3 or 4 Children | 180 (95.7%) | 8 (4.3%) |
| 5 or more Children | 0 (0.0%) | 0 (0.0%) |
| Total | 1,594 (94.7%) | 89 (5.3%) |
Income Below Poverty Among Single-Parent Households in Carrollton
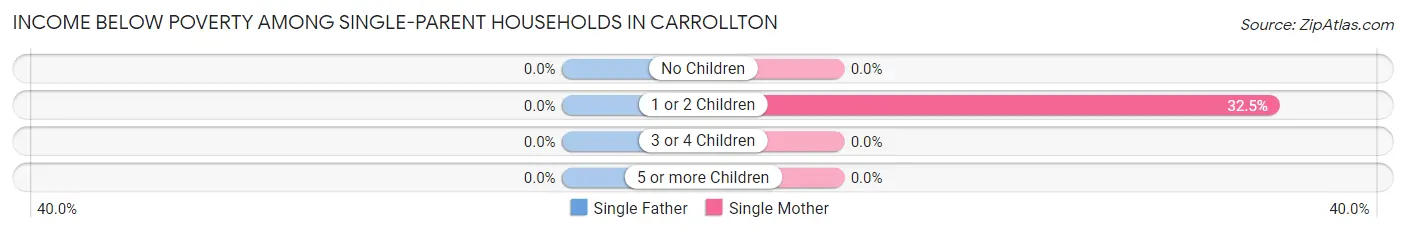
| Children | Single Father | Single Mother |
| No Children | 0 (0.0%) | 0 (0.0%) |
| 1 or 2 Children | 0 (0.0%) | 51 (32.5%) |
| 3 or 4 Children | 0 (0.0%) | 0 (0.0%) |
| 5 or more Children | 0 (0.0%) | 0 (0.0%) |
| Total | 0 (0.0%) | 51 (18.7%) |
Income Below Poverty Among Married-Couple vs Single-Parent Households in Carrollton
The poverty data for Carrollton shows that 89 of the married-couple family households (5.3%) and 51 of the single-parent households (15.1%) are living below the poverty level. Within the married-couple family households, those with no children have the highest poverty rate, with 81 households (9.3%) falling below the poverty line. Among the single-parent households, those with 1 or 2 children have the highest poverty rate, with 51 household (30.2%) living below poverty.
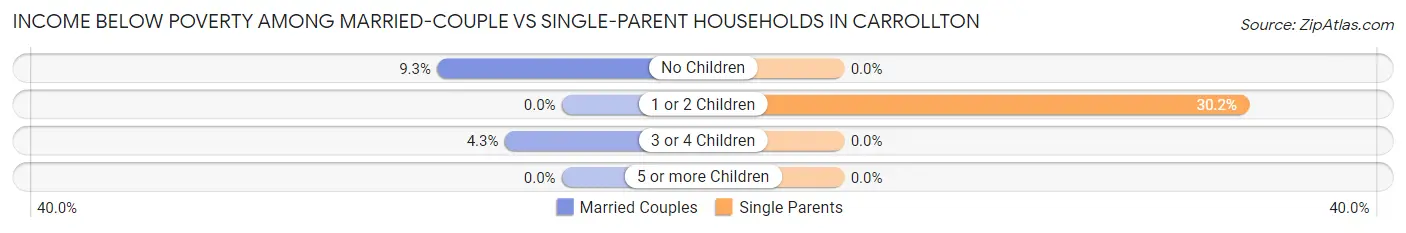
| Children | Married-Couple Families | Single-Parent Households |
| No Children | 81 (9.3%) | 0 (0.0%) |
| 1 or 2 Children | 0 (0.0%) | 51 (30.2%) |
| 3 or 4 Children | 8 (4.3%) | 0 (0.0%) |
| 5 or more Children | 0 (0.0%) | 0 (0.0%) |
| Total | 89 (5.3%) | 51 (15.1%) |
Race in Carrollton
The most populous races in Carrollton are White / Caucasian (4,834 | 65.9%), Black / African American (1,358 | 18.5%), and Hispanic or Latino (695 | 9.5%).
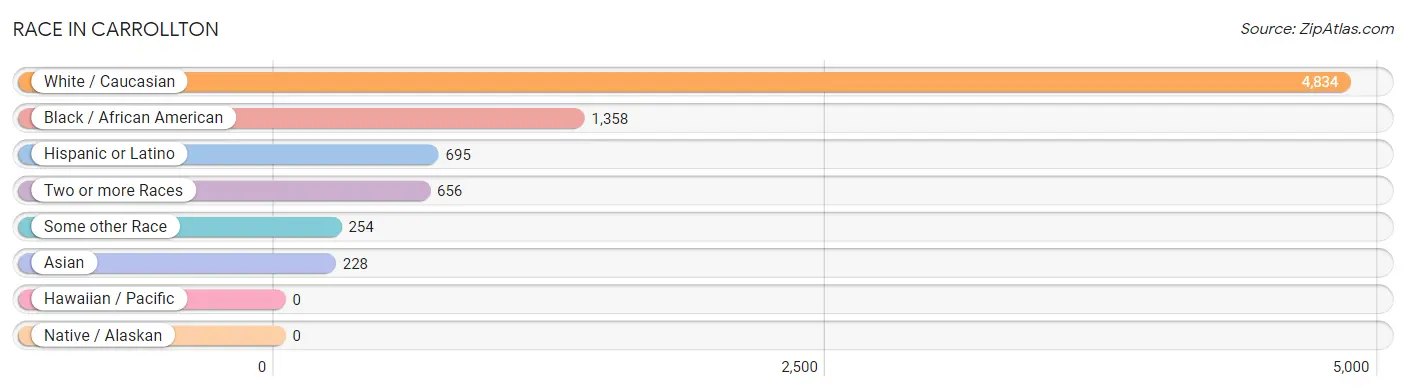
| Race | # Population | % Population |
| Asian | 228 | 3.1% |
| Black / African American | 1,358 | 18.5% |
| Hawaiian / Pacific | 0 | 0.0% |
| Hispanic or Latino | 695 | 9.5% |
| Native / Alaskan | 0 | 0.0% |
| White / Caucasian | 4,834 | 65.9% |
| Two or more Races | 656 | 8.9% |
| Some other Race | 254 | 3.5% |
| Total | 7,330 | 100.0% |
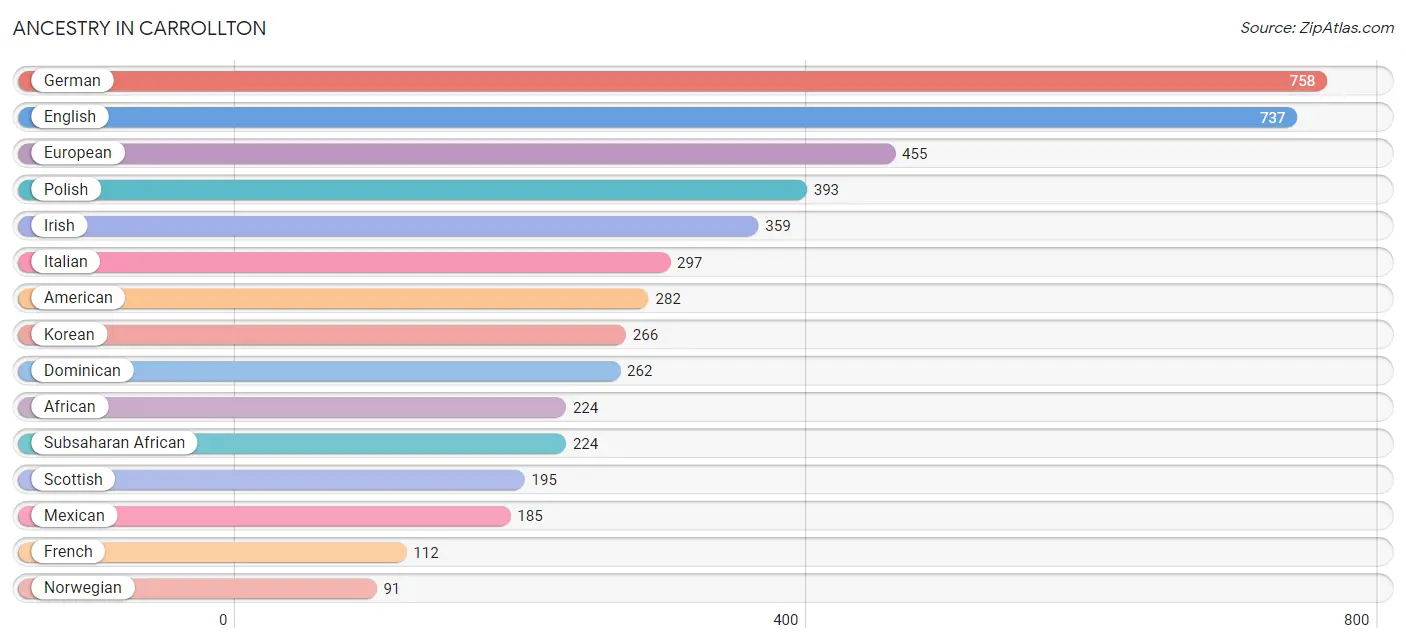
Ancestry in Carrollton
The most populous ancestries reported in Carrollton are German (758 | 10.3%), English (737 | 10.1%), European (455 | 6.2%), Polish (393 | 5.4%), and Irish (359 | 4.9%), together accounting for 36.9% of all Carrollton residents.
| Ancestry | # Population | % Population |
| African | 224 | 3.1% |
| American | 282 | 3.8% |
| Apache | 46 | 0.6% |
| Austrian | 26 | 0.4% |
| Belgian | 13 | 0.2% |
| Bhutanese | 7 | 0.1% |
| British | 69 | 0.9% |
| Burmese | 73 | 1.0% |
| Cuban | 81 | 1.1% |
| Czech | 52 | 0.7% |
| Danish | 65 | 0.9% |
| Dominican | 262 | 3.6% |
| Dutch | 11 | 0.2% |
| Eastern European | 24 | 0.3% |
| English | 737 | 10.1% |
| European | 455 | 6.2% |
| French | 112 | 1.5% |
| French Canadian | 59 | 0.8% |
| German | 758 | 10.3% |
| Greek | 57 | 0.8% |
| Irish | 359 | 4.9% |
| Italian | 297 | 4.1% |
| Korean | 266 | 3.6% |
| Malaysian | 39 | 0.5% |
| Mexican | 185 | 2.5% |
| Native Hawaiian | 75 | 1.0% |
| Norwegian | 91 | 1.2% |
| Peruvian | 41 | 0.6% |
| Polish | 393 | 5.4% |
| Portuguese | 9 | 0.1% |
| Puerto Rican | 76 | 1.0% |
| Romanian | 15 | 0.2% |
| Russian | 32 | 0.4% |
| Scandinavian | 46 | 0.6% |
| Scotch-Irish | 9 | 0.1% |
| Scottish | 195 | 2.7% |
| South American | 91 | 1.2% |
| Sri Lankan | 27 | 0.4% |
| Subsaharan African | 224 | 3.1% |
| Venezuelan | 50 | 0.7% |
| Welsh | 73 | 1.0% | View All 41 Rows |
Immigrants in Carrollton
The most numerous immigrant groups reported in Carrollton came from Latin America (380 | 5.2%), Caribbean (316 | 4.3%), Dominican Republic (235 | 3.2%), Asia (144 | 2.0%), and South Eastern Asia (131 | 1.8%), together accounting for 16.5% of all Carrollton residents.
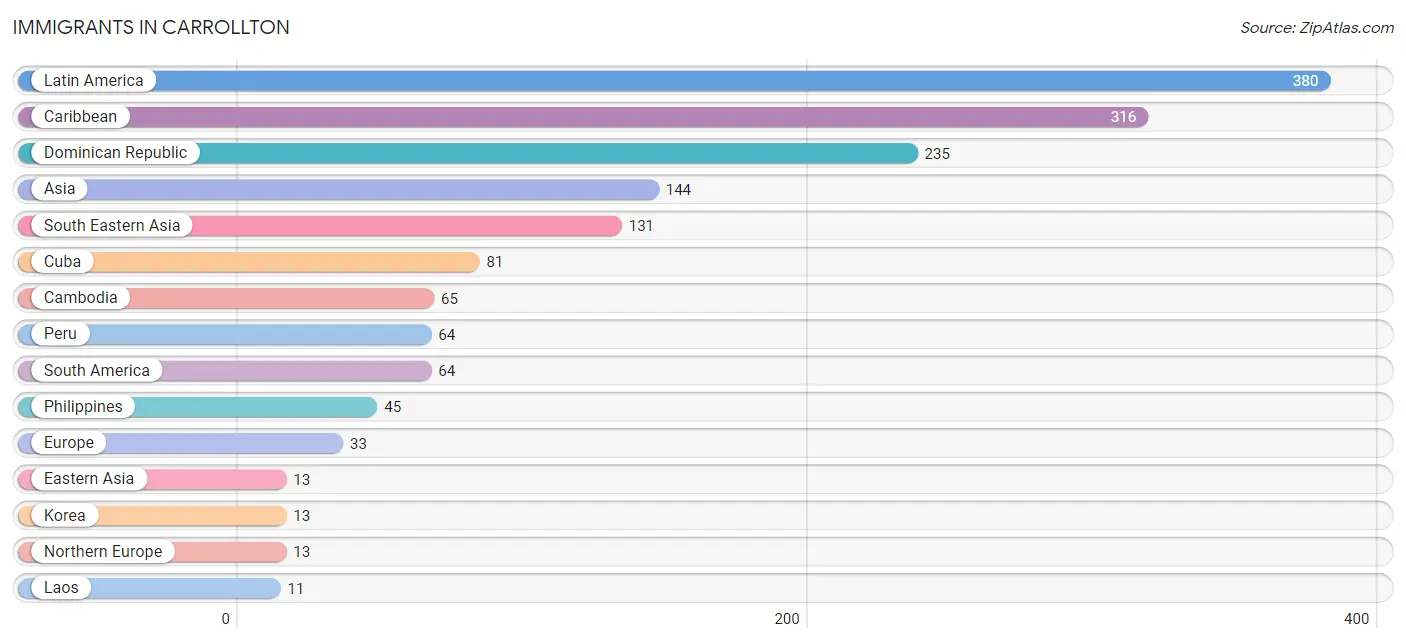
| Immigration Origin | # Population | % Population |
| Africa | 9 | 0.1% |
| Asia | 144 | 2.0% |
| Cambodia | 65 | 0.9% |
| Caribbean | 316 | 4.3% |
| Cuba | 81 | 1.1% |
| Dominican Republic | 235 | 3.2% |
| Eastern Africa | 9 | 0.1% |
| Eastern Asia | 13 | 0.2% |
| Europe | 33 | 0.4% |
| Korea | 13 | 0.2% |
| Laos | 11 | 0.2% |
| Latin America | 380 | 5.2% |
| Northern Europe | 13 | 0.2% |
| Peru | 64 | 0.9% |
| Philippines | 45 | 0.6% |
| South America | 64 | 0.9% |
| South Eastern Asia | 131 | 1.8% |
| Vietnam | 10 | 0.1% | View All 18 Rows |
Sex and Age in Carrollton
Sex and Age in Carrollton
The most populous age groups in Carrollton are 15 to 19 Years (376 | 9.1%) for men and 5 to 9 Years (309 | 9.6%) for women.
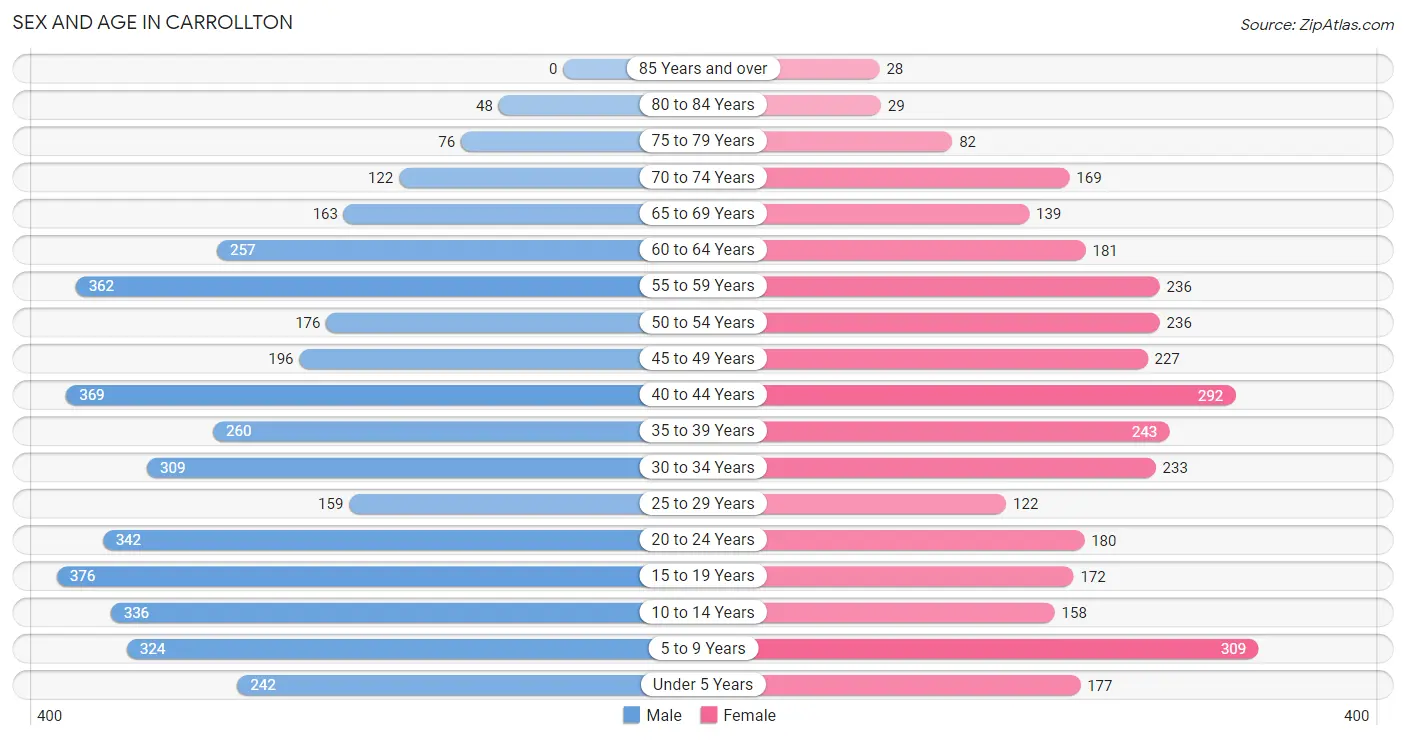
| Age Bracket | Male | Female |
| Under 5 Years | 242 (5.9%) | 177 (5.5%) |
| 5 to 9 Years | 324 (7.9%) | 309 (9.6%) |
| 10 to 14 Years | 336 (8.2%) | 158 (4.9%) |
| 15 to 19 Years | 376 (9.1%) | 172 (5.3%) |
| 20 to 24 Years | 342 (8.3%) | 180 (5.6%) |
| 25 to 29 Years | 159 (3.9%) | 122 (3.8%) |
| 30 to 34 Years | 309 (7.5%) | 233 (7.2%) |
| 35 to 39 Years | 260 (6.3%) | 243 (7.6%) |
| 40 to 44 Years | 369 (9.0%) | 292 (9.1%) |
| 45 to 49 Years | 196 (4.8%) | 227 (7.1%) |
| 50 to 54 Years | 176 (4.3%) | 236 (7.3%) |
| 55 to 59 Years | 362 (8.8%) | 236 (7.3%) |
| 60 to 64 Years | 257 (6.2%) | 181 (5.6%) |
| 65 to 69 Years | 163 (4.0%) | 139 (4.3%) |
| 70 to 74 Years | 122 (3.0%) | 169 (5.3%) |
| 75 to 79 Years | 76 (1.8%) | 82 (2.5%) |
| 80 to 84 Years | 48 (1.2%) | 29 (0.9%) |
| 85 Years and over | 0 (0.0%) | 28 (0.9%) |
| Total | 4,117 (100.0%) | 3,213 (100.0%) |
Families and Households in Carrollton
Median Family Size in Carrollton
The median family size in Carrollton is 3.20 persons per family, with single male/father families (65 | 3.2%) accounting for the largest median family size of 3.62 persons per family. On the other hand, single female/mother families (273 | 13.5%) represent the smallest median family size with 2.42 persons per family.
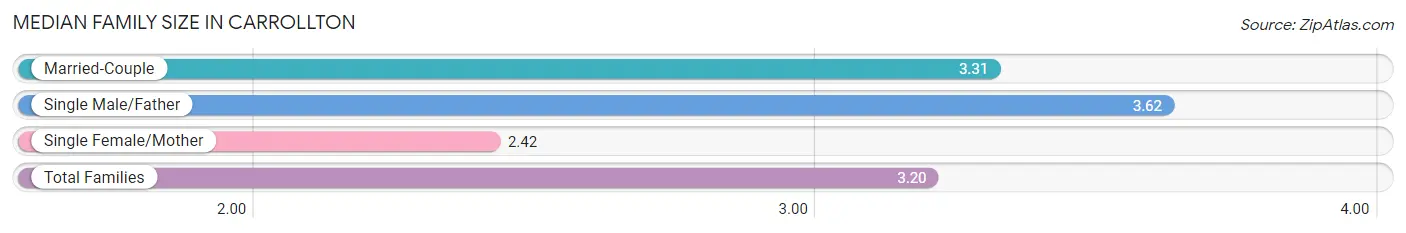
| Family Type | # Families | Family Size |
| Married-Couple | 1,683 (83.3%) | 3.31 |
| Single Male/Father | 65 (3.2%) | 3.62 |
| Single Female/Mother | 273 (13.5%) | 2.42 |
| Total Families | 2,021 (100.0%) | 3.20 |
Median Household Size in Carrollton
The median household size in Carrollton is 2.68 persons per household, with single male/father households (65 | 2.4%) accounting for the largest median household size of 4.26 persons per household. non-family households (711 | 26.0%) represent the smallest median household size with 1.07 persons per household.
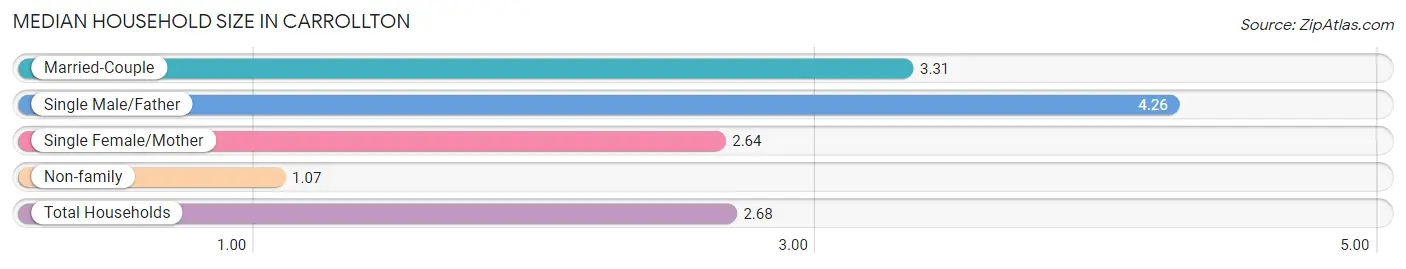
| Household Type | # Households | Household Size |
| Married-Couple | 1,683 (61.6%) | 3.31 |
| Single Male/Father | 65 (2.4%) | 4.26 |
| Single Female/Mother | 273 (10.0%) | 2.64 |
| Non-family | 711 (26.0%) | 1.07 |
| Total Households | 2,732 (100.0%) | 2.68 |
Household Size by Marriage Status in Carrollton
Out of a total of 2,732 households in Carrollton, 2,021 (74.0%) are family households, while 711 (26.0%) are nonfamily households. The most numerous type of family households are 2-person households, comprising 720, and the most common type of nonfamily households are 1-person households, comprising 640.
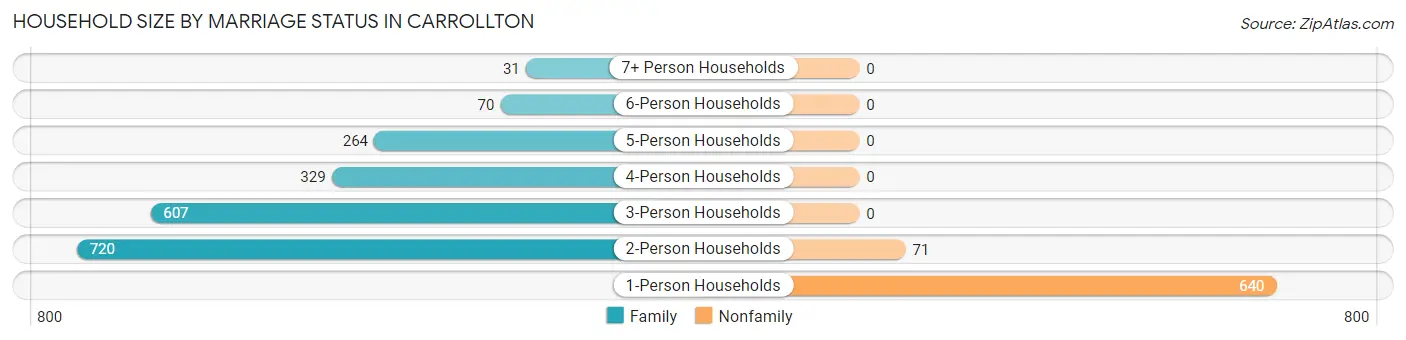
| Household Size | Family Households | Nonfamily Households |
| 1-Person Households | - | 640 (23.4%) |
| 2-Person Households | 720 (26.4%) | 71 (2.6%) |
| 3-Person Households | 607 (22.2%) | 0 (0.0%) |
| 4-Person Households | 329 (12.0%) | 0 (0.0%) |
| 5-Person Households | 264 (9.7%) | 0 (0.0%) |
| 6-Person Households | 70 (2.6%) | 0 (0.0%) |
| 7+ Person Households | 31 (1.1%) | 0 (0.0%) |
| Total | 2,021 (74.0%) | 711 (26.0%) |
Female Fertility in Carrollton
Fertility by Age in Carrollton
Average fertility rate in Carrollton is 19.0 births per 1,000 women. Women in the age bracket of 35 to 50 years have the highest fertility rate with 25.0 births per 1,000 women. Women in the age bracket of 35 to 50 years acount for 72.4% of all women with births.
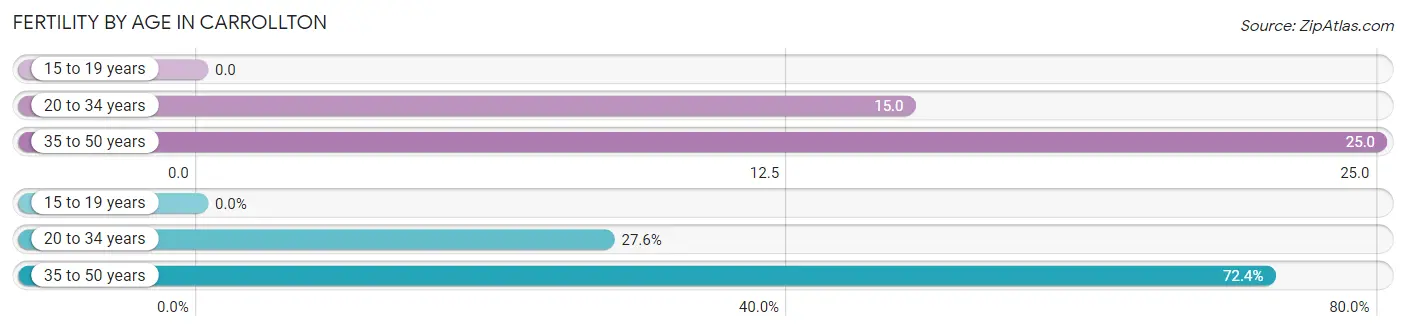
| Age Bracket | Women with Births | Births / 1,000 Women |
| 15 to 19 years | 0 (0.0%) | 0.0 |
| 20 to 34 years | 8 (27.6%) | 15.0 |
| 35 to 50 years | 21 (72.4%) | 25.0 |
| Total | 29 (100.0%) | 19.0 |
Fertility by Age by Marriage Status in Carrollton
79.3% of women with births (29) in Carrollton are married. The highest percentage of unmarried women with births falls into 35 to 50 years age bracket with 28.6% of them unmarried at the time of birth, while the lowest percentage of unmarried women with births belong to 20 to 34 years age bracket with 0.0% of them unmarried.
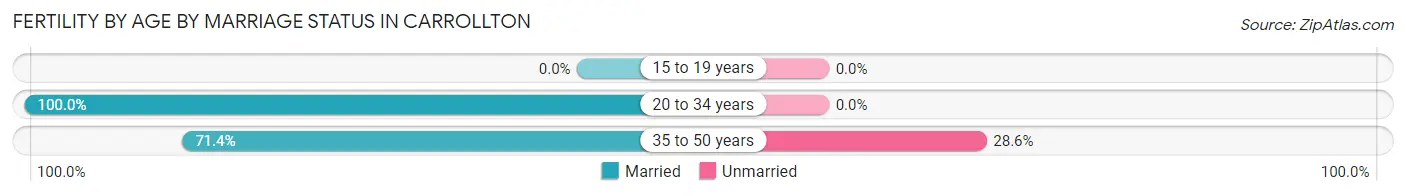
| Age Bracket | Married | Unmarried |
| 15 to 19 years | 0 (0.0%) | 0 (0.0%) |
| 20 to 34 years | 8 (100.0%) | 0 (0.0%) |
| 35 to 50 years | 15 (71.4%) | 6 (28.6%) |
| Total | 23 (79.3%) | 6 (20.7%) |
Fertility by Education in Carrollton
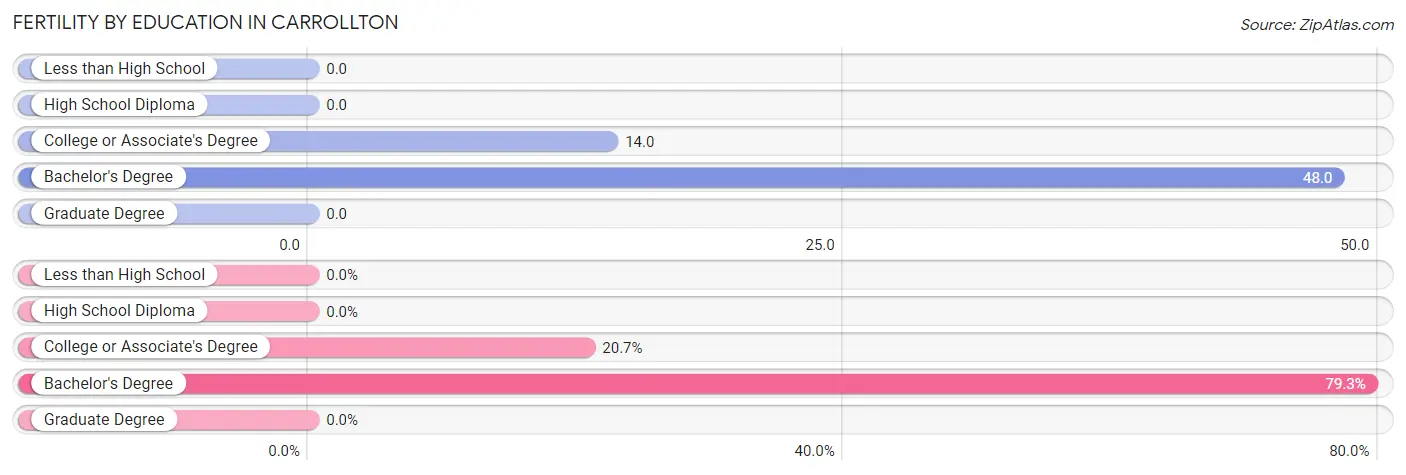
| Educational Attainment | Women with Births | Births / 1,000 Women |
| Less than High School | 0 (0.0%) | 0.0 |
| High School Diploma | 0 (0.0%) | 0.0 |
| College or Associate's Degree | 6 (20.7%) | 14.0 |
| Bachelor's Degree | 23 (79.3%) | 48.0 |
| Graduate Degree | 0 (0.0%) | 0.0 |
| Total | 29 (100.0%) | 19.0 |
Fertility by Education by Marriage Status in Carrollton
20.7% of women with births in Carrollton are unmarried. Women with the educational attainment of bachelor's degree are most likely to be married with 100.0% of them married at childbirth, while women with the educational attainment of college or associate's degree are least likely to be married with 100.0% of them unmarried at childbirth.
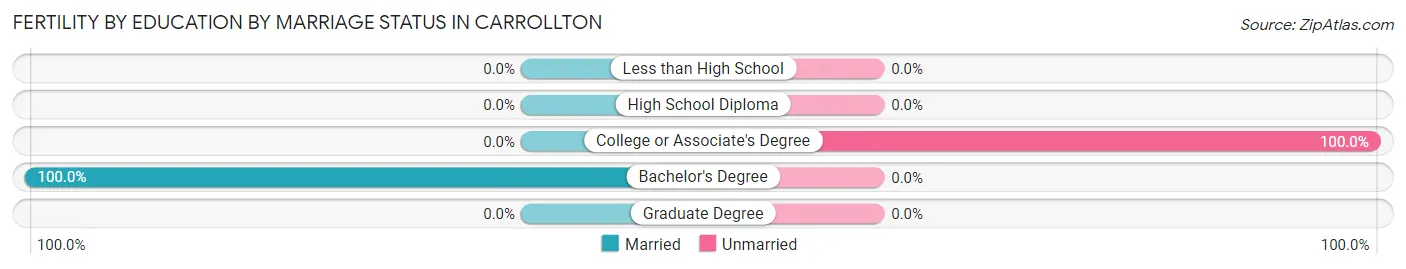
| Educational Attainment | Married | Unmarried |
| Less than High School | 0 (0.0%) | 0 (0.0%) |
| High School Diploma | 0 (0.0%) | 0 (0.0%) |
| College or Associate's Degree | 0 (0.0%) | 6 (100.0%) |
| Bachelor's Degree | 23 (100.0%) | 0 (0.0%) |
| Graduate Degree | 0 (0.0%) | 0 (0.0%) |
| Total | 23 (79.3%) | 6 (20.7%) |
Employment Characteristics in Carrollton
Employment by Class of Employer in Carrollton
Among the 3,651 employed individuals in Carrollton, private company employees (2,058 | 56.4%), federal government employees (501 | 13.7%), and not-for-profit organizations (428 | 11.7%) make up the most common classes of employment.
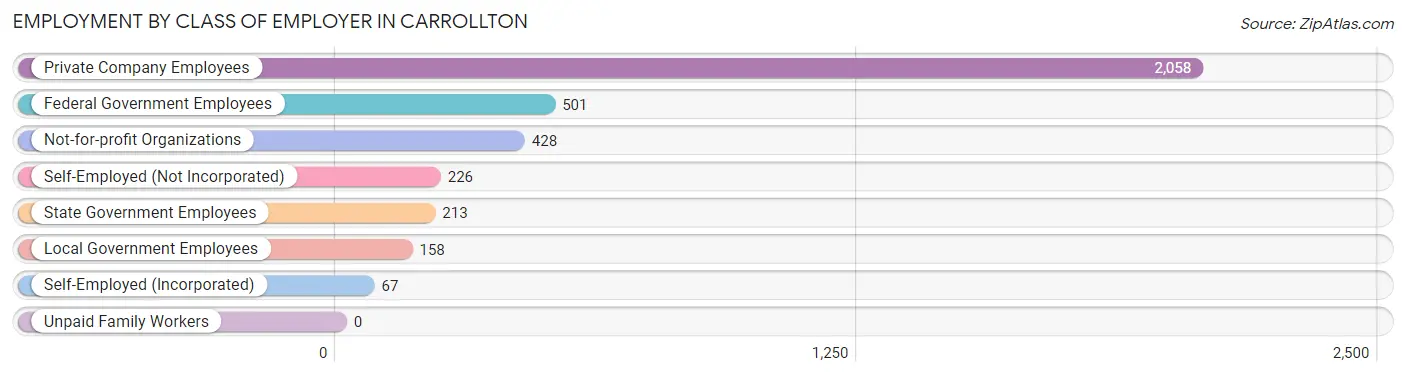
| Employer Class | # Employees | % Employees |
| Private Company Employees | 2,058 | 56.4% |
| Self-Employed (Incorporated) | 67 | 1.8% |
| Self-Employed (Not Incorporated) | 226 | 6.2% |
| Not-for-profit Organizations | 428 | 11.7% |
| Local Government Employees | 158 | 4.3% |
| State Government Employees | 213 | 5.8% |
| Federal Government Employees | 501 | 13.7% |
| Unpaid Family Workers | 0 | 0.0% |
| Total | 3,651 | 100.0% |
Employment Status by Age in Carrollton
According to the labor force statistics for Carrollton, out of the total population over 16 years of age (5,708), 72.7% or 4,150 individuals are in the labor force, with 11.8% or 490 of them unemployed. The age group with the highest labor force participation rate is 25 to 29 years, with 100.0% or 281 individuals in the labor force. Within the labor force, the 16 to 19 years age range has the highest percentage of unemployed individuals, with 66.9% or 111 of them being unemployed.
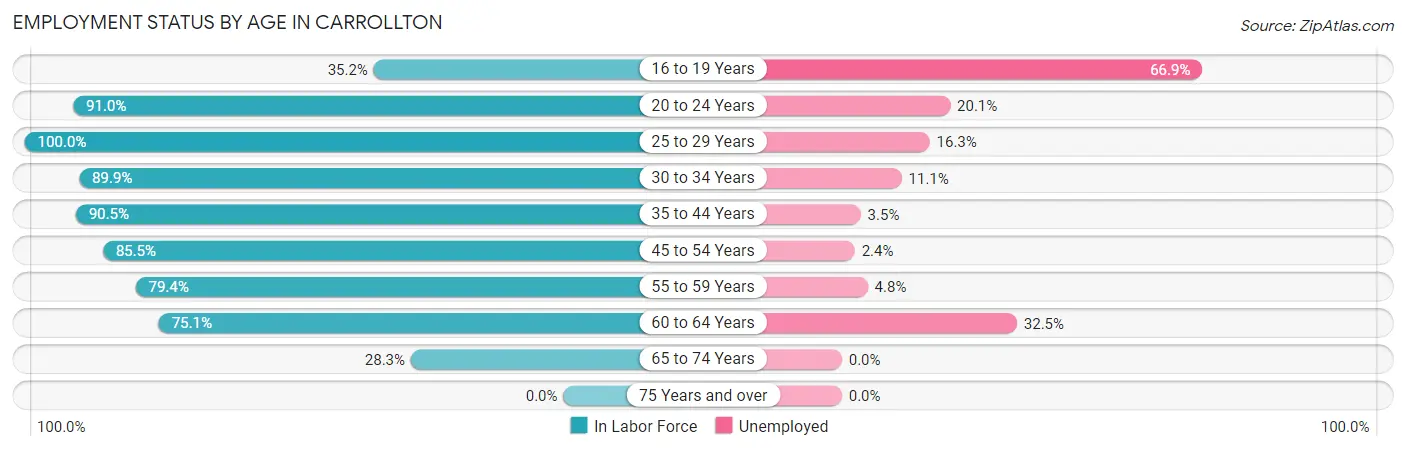
| Age Bracket | In Labor Force | Unemployed |
| 16 to 19 Years | 166 (35.2%) | 111 (66.9%) |
| 20 to 24 Years | 475 (91.0%) | 95 (20.1%) |
| 25 to 29 Years | 281 (100.0%) | 46 (16.3%) |
| 30 to 34 Years | 487 (89.9%) | 54 (11.1%) |
| 35 to 44 Years | 1,053 (90.5%) | 37 (3.5%) |
| 45 to 54 Years | 714 (85.5%) | 17 (2.4%) |
| 55 to 59 Years | 475 (79.4%) | 23 (4.8%) |
| 60 to 64 Years | 329 (75.1%) | 107 (32.5%) |
| 65 to 74 Years | 168 (28.3%) | 0 (0.0%) |
| 75 Years and over | 0 (0.0%) | 0 (0.0%) |
| Total | 4,150 (72.7%) | 490 (11.8%) |
Employment Status by Educational Attainment in Carrollton
According to labor force statistics for Carrollton, 86.6% of individuals (3,341) out of the total population between 25 and 64 years of age (3,858) are in the labor force, with 8.4% or 281 of them being unemployed. The group with the highest labor force participation rate are those with the educational attainment of bachelor's degree or higher, with 91.4% or 1,639 individuals in the labor force. Within the labor force, individuals with college / associate degree education have the highest percentage of unemployment, with 15.2% or 161 of them being unemployed.
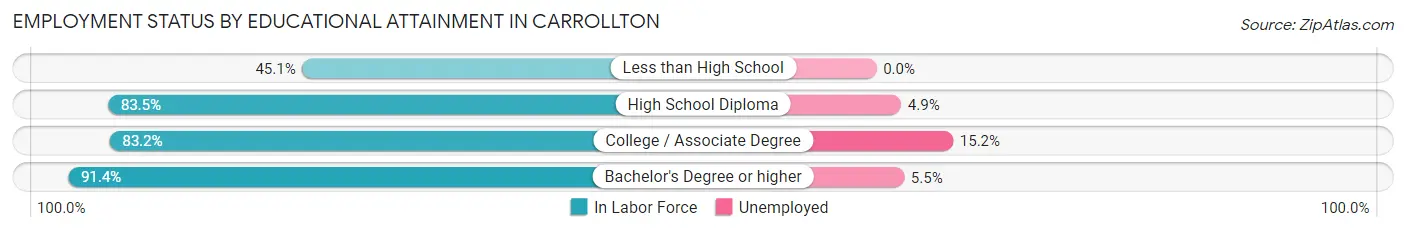
| Educational Attainment | In Labor Force | Unemployed |
| Less than High School | 23 (45.1%) | 0 (0.0%) |
| High School Diploma | 617 (83.5%) | 36 (4.9%) |
| College / Associate Degree | 1,061 (83.2%) | 194 (15.2%) |
| Bachelor's Degree or higher | 1,639 (91.4%) | 99 (5.5%) |
| Total | 3,341 (86.6%) | 324 (8.4%) |
Employment Occupations by Sex in Carrollton
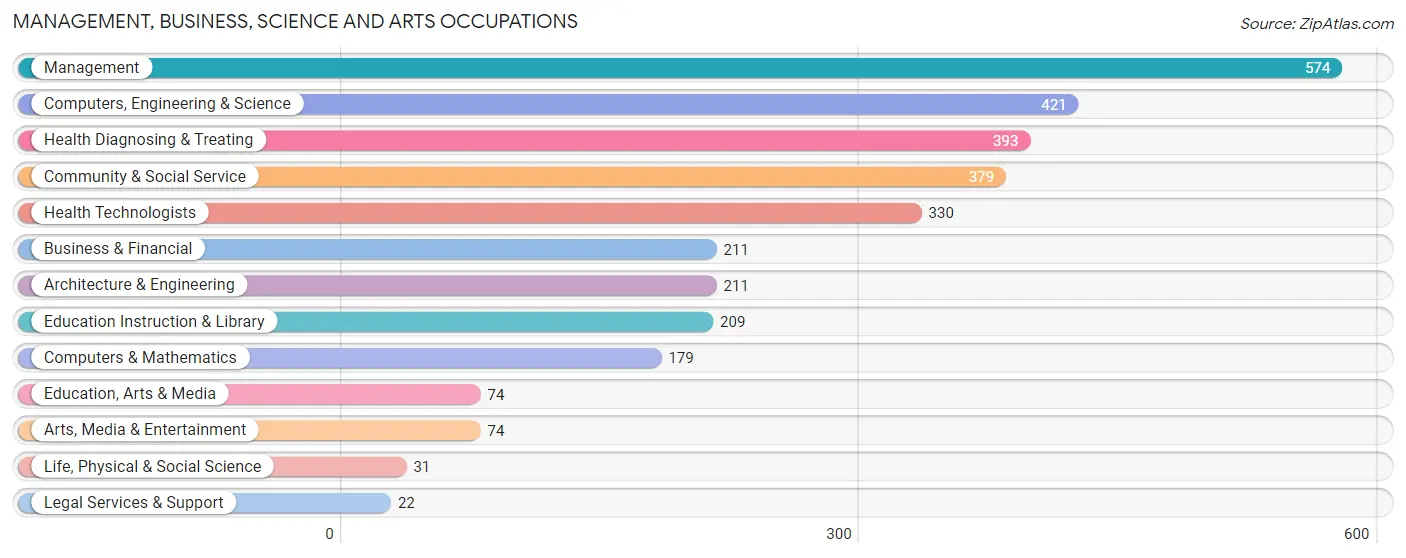
Management, Business, Science and Arts Occupations
The most common Management, Business, Science and Arts occupations in Carrollton are Management (574 | 16.3%), Computers, Engineering & Science (421 | 11.9%), Health Diagnosing & Treating (393 | 11.2%), Community & Social Service (379 | 10.8%), and Health Technologists (330 | 9.4%).
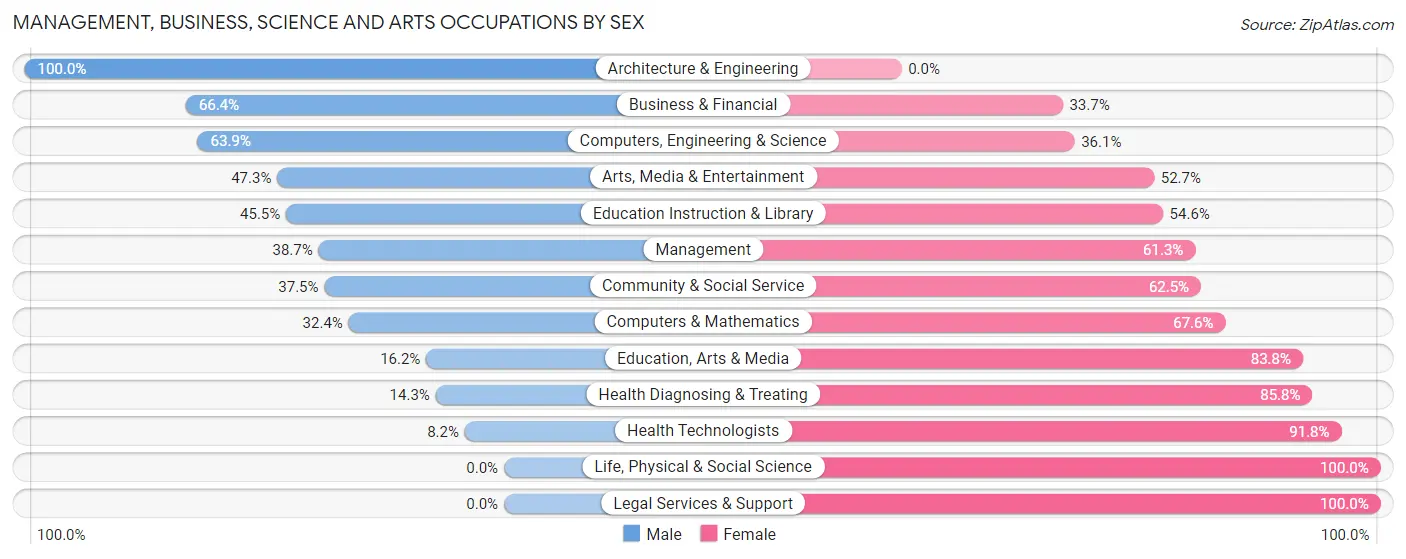
Management, Business, Science and Arts Occupations by Sex
Within the Management, Business, Science and Arts occupations in Carrollton, the most male-oriented occupations are Architecture & Engineering (100.0%), Business & Financial (66.3%), and Computers, Engineering & Science (63.9%), while the most female-oriented occupations are Life, Physical & Social Science (100.0%), Legal Services & Support (100.0%), and Health Technologists (91.8%).
| Occupation | Male | Female |
| Management | 222 (38.7%) | 352 (61.3%) |
| Business & Financial | 140 (66.3%) | 71 (33.7%) |
| Computers, Engineering & Science | 269 (63.9%) | 152 (36.1%) |
| Computers & Mathematics | 58 (32.4%) | 121 (67.6%) |
| Architecture & Engineering | 211 (100.0%) | 0 (0.0%) |
| Life, Physical & Social Science | 0 (0.0%) | 31 (100.0%) |
| Community & Social Service | 142 (37.5%) | 237 (62.5%) |
| Education, Arts & Media | 12 (16.2%) | 62 (83.8%) |
| Legal Services & Support | 0 (0.0%) | 22 (100.0%) |
| Education Instruction & Library | 95 (45.5%) | 114 (54.5%) |
| Arts, Media & Entertainment | 35 (47.3%) | 39 (52.7%) |
| Health Diagnosing & Treating | 56 (14.2%) | 337 (85.8%) |
| Health Technologists | 27 (8.2%) | 303 (91.8%) |
| Total (Category) | 829 (41.9%) | 1,149 (58.1%) |
| Total (Overall) | 1,933 (54.9%) | 1,589 (45.1%) |
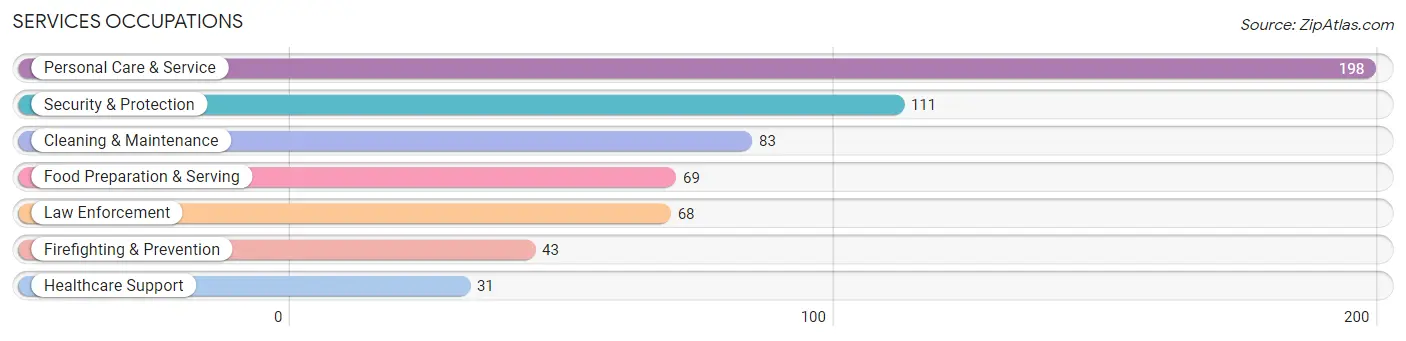
Services Occupations
The most common Services occupations in Carrollton are Personal Care & Service (198 | 5.6%), Security & Protection (111 | 3.2%), Cleaning & Maintenance (83 | 2.4%), Food Preparation & Serving (69 | 2.0%), and Law Enforcement (68 | 1.9%).
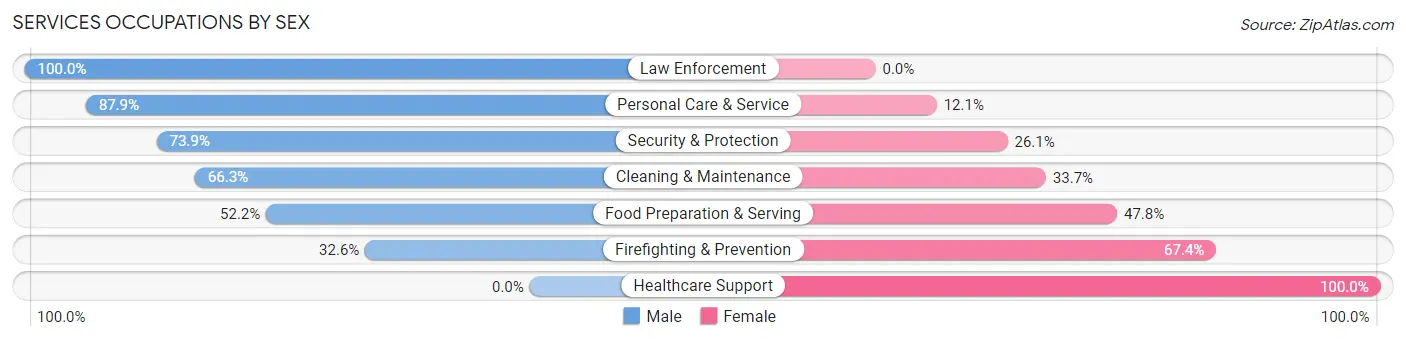
Services Occupations by Sex
Within the Services occupations in Carrollton, the most male-oriented occupations are Law Enforcement (100.0%), Personal Care & Service (87.9%), and Security & Protection (73.9%), while the most female-oriented occupations are Healthcare Support (100.0%), Firefighting & Prevention (67.4%), and Food Preparation & Serving (47.8%).
| Occupation | Male | Female |
| Healthcare Support | 0 (0.0%) | 31 (100.0%) |
| Security & Protection | 82 (73.9%) | 29 (26.1%) |
| Firefighting & Prevention | 14 (32.6%) | 29 (67.4%) |
| Law Enforcement | 68 (100.0%) | 0 (0.0%) |
| Food Preparation & Serving | 36 (52.2%) | 33 (47.8%) |
| Cleaning & Maintenance | 55 (66.3%) | 28 (33.7%) |
| Personal Care & Service | 174 (87.9%) | 24 (12.1%) |
| Total (Category) | 347 (70.5%) | 145 (29.5%) |
| Total (Overall) | 1,933 (54.9%) | 1,589 (45.1%) |
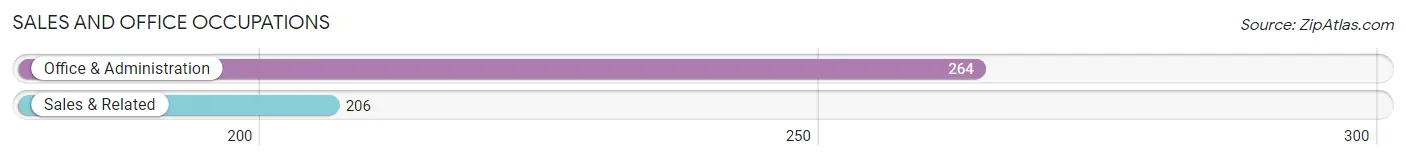
Sales and Office Occupations
The most common Sales and Office occupations in Carrollton are Office & Administration (264 | 7.5%), and Sales & Related (206 | 5.9%).
Sales and Office Occupations by Sex
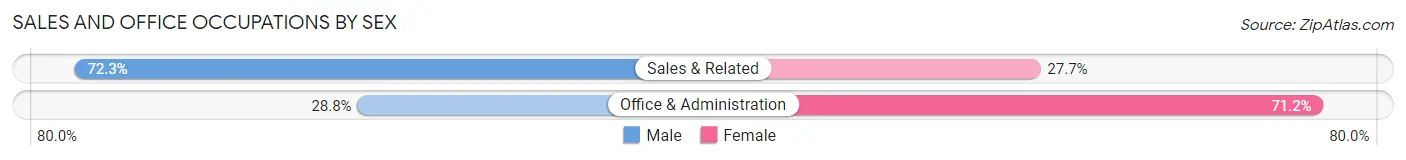
| Occupation | Male | Female |
| Sales & Related | 149 (72.3%) | 57 (27.7%) |
| Office & Administration | 76 (28.8%) | 188 (71.2%) |
| Total (Category) | 225 (47.9%) | 245 (52.1%) |
| Total (Overall) | 1,933 (54.9%) | 1,589 (45.1%) |
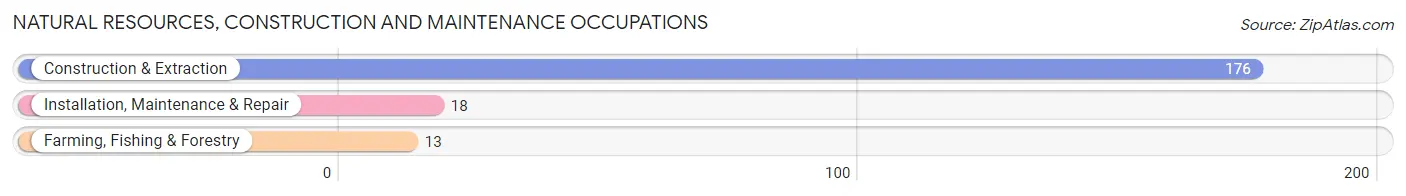
Natural Resources, Construction and Maintenance Occupations
The most common Natural Resources, Construction and Maintenance occupations in Carrollton are Construction & Extraction (176 | 5.0%), Installation, Maintenance & Repair (18 | 0.5%), and Farming, Fishing & Forestry (13 | 0.4%).
Natural Resources, Construction and Maintenance Occupations by Sex
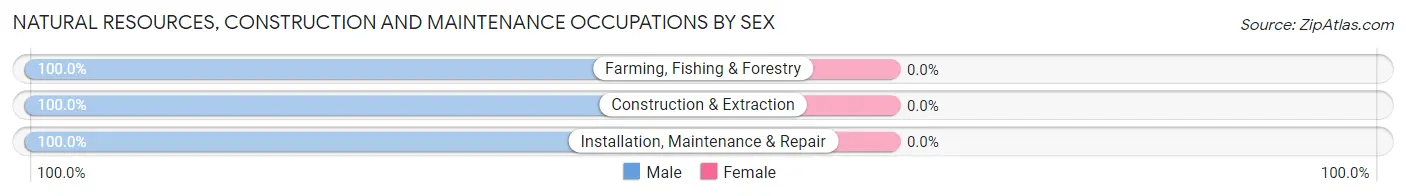
| Occupation | Male | Female |
| Farming, Fishing & Forestry | 13 (100.0%) | 0 (0.0%) |
| Construction & Extraction | 176 (100.0%) | 0 (0.0%) |
| Installation, Maintenance & Repair | 18 (100.0%) | 0 (0.0%) |
| Total (Category) | 207 (100.0%) | 0 (0.0%) |
| Total (Overall) | 1,933 (54.9%) | 1,589 (45.1%) |
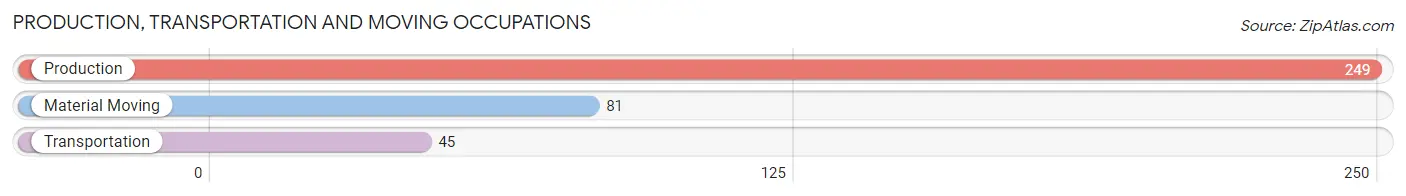
Production, Transportation and Moving Occupations
The most common Production, Transportation and Moving occupations in Carrollton are Production (249 | 7.1%), Material Moving (81 | 2.3%), and Transportation (45 | 1.3%).
Production, Transportation and Moving Occupations by Sex
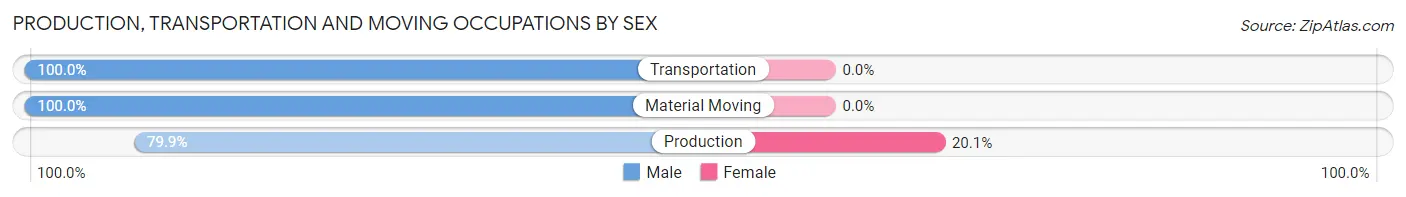
| Occupation | Male | Female |
| Production | 199 (79.9%) | 50 (20.1%) |
| Transportation | 45 (100.0%) | 0 (0.0%) |
| Material Moving | 81 (100.0%) | 0 (0.0%) |
| Total (Category) | 325 (86.7%) | 50 (13.3%) |
| Total (Overall) | 1,933 (54.9%) | 1,589 (45.1%) |
Employment Industries by Sex in Carrollton
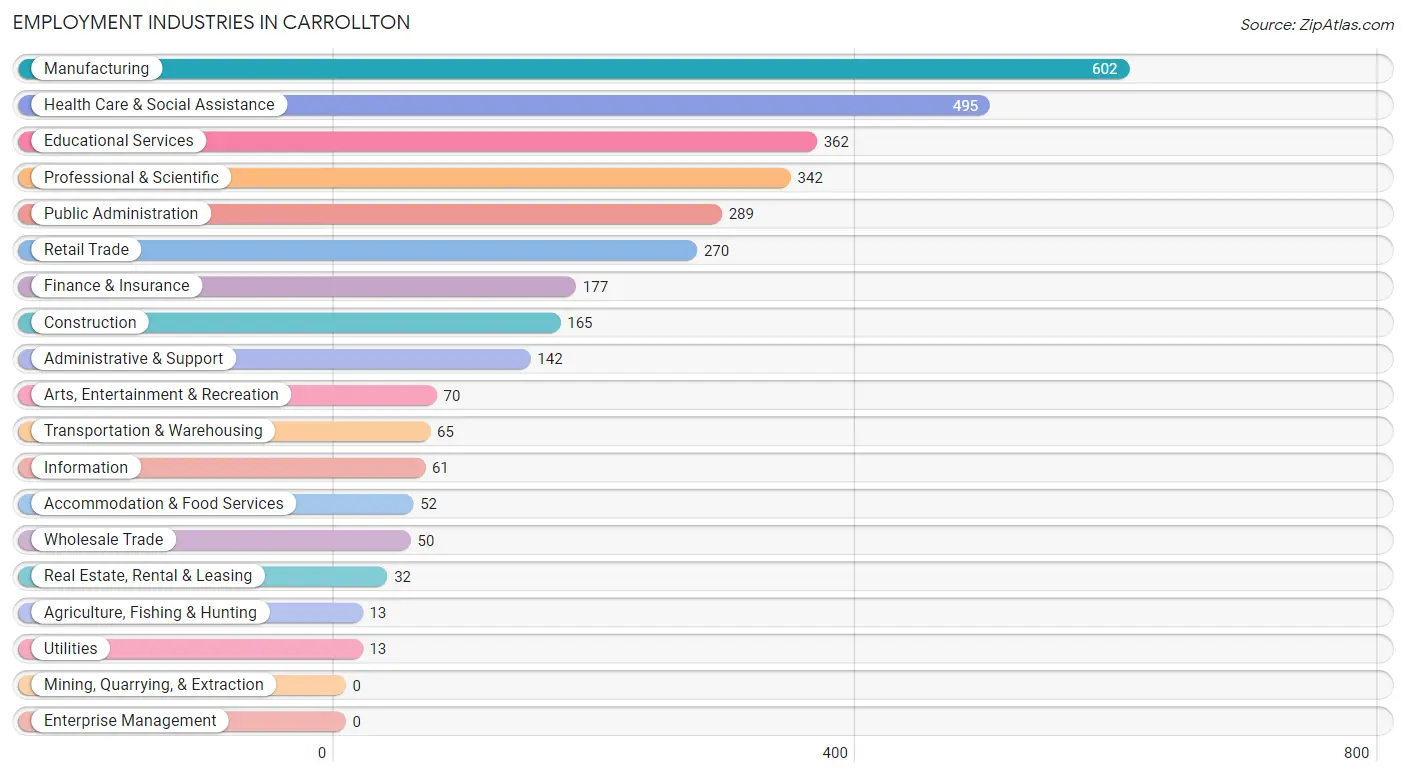
Employment Industries in Carrollton
The major employment industries in Carrollton include Manufacturing (602 | 17.1%), Health Care & Social Assistance (495 | 14.1%), Educational Services (362 | 10.3%), Professional & Scientific (342 | 9.7%), and Public Administration (289 | 8.2%).
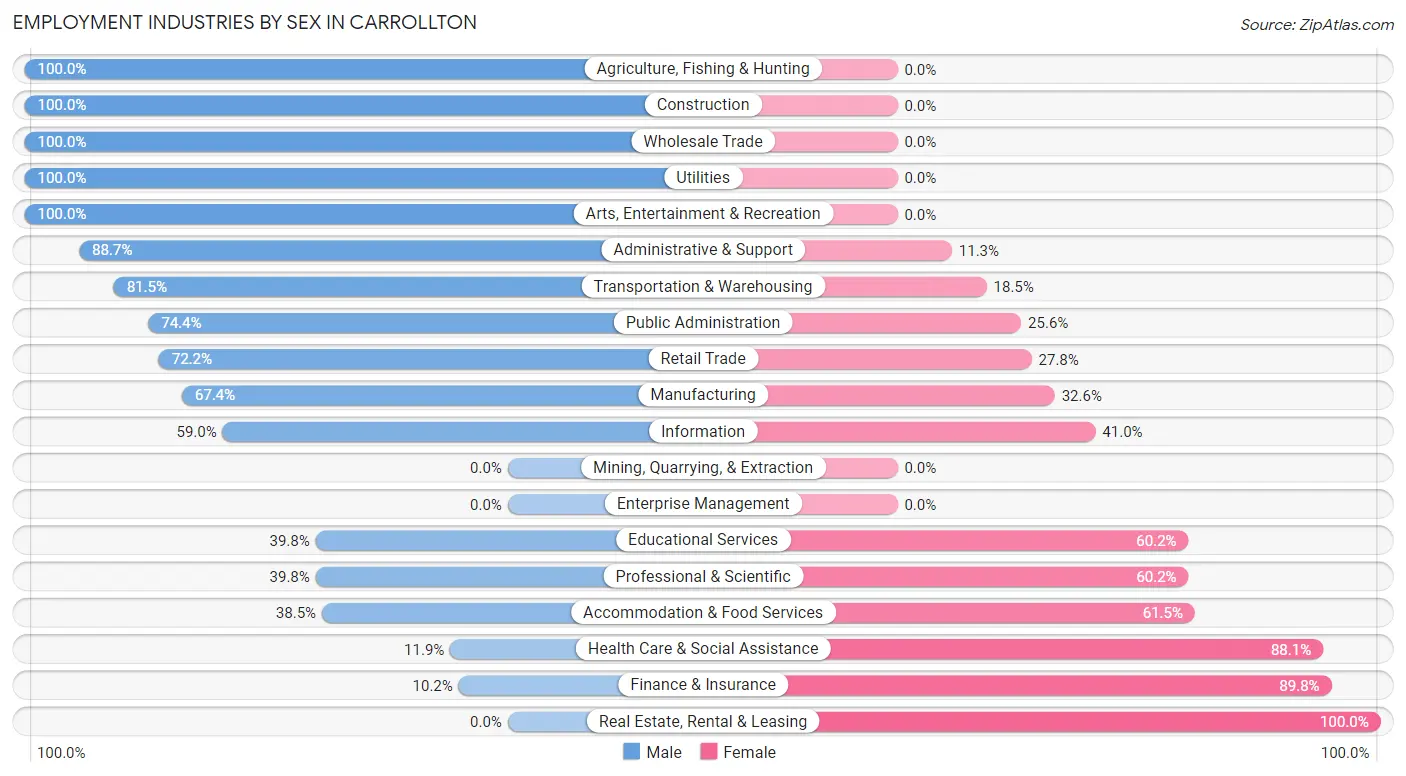
Employment Industries by Sex in Carrollton
The Carrollton industries that see more men than women are Agriculture, Fishing & Hunting (100.0%), Construction (100.0%), and Wholesale Trade (100.0%), whereas the industries that tend to have a higher number of women are Real Estate, Rental & Leasing (100.0%), Finance & Insurance (89.8%), and Health Care & Social Assistance (88.1%).
| Industry | Male | Female |
| Agriculture, Fishing & Hunting | 13 (100.0%) | 0 (0.0%) |
| Mining, Quarrying, & Extraction | 0 (0.0%) | 0 (0.0%) |
| Construction | 165 (100.0%) | 0 (0.0%) |
| Manufacturing | 406 (67.4%) | 196 (32.6%) |
| Wholesale Trade | 50 (100.0%) | 0 (0.0%) |
| Retail Trade | 195 (72.2%) | 75 (27.8%) |
| Transportation & Warehousing | 53 (81.5%) | 12 (18.5%) |
| Utilities | 13 (100.0%) | 0 (0.0%) |
| Information | 36 (59.0%) | 25 (41.0%) |
| Finance & Insurance | 18 (10.2%) | 159 (89.8%) |
| Real Estate, Rental & Leasing | 0 (0.0%) | 32 (100.0%) |
| Professional & Scientific | 136 (39.8%) | 206 (60.2%) |
| Enterprise Management | 0 (0.0%) | 0 (0.0%) |
| Administrative & Support | 126 (88.7%) | 16 (11.3%) |
| Educational Services | 144 (39.8%) | 218 (60.2%) |
| Health Care & Social Assistance | 59 (11.9%) | 436 (88.1%) |
| Arts, Entertainment & Recreation | 70 (100.0%) | 0 (0.0%) |
| Accommodation & Food Services | 20 (38.5%) | 32 (61.5%) |
| Public Administration | 215 (74.4%) | 74 (25.6%) |
| Total | 1,933 (54.9%) | 1,589 (45.1%) |
Education in Carrollton
School Enrollment in Carrollton
The most common levels of schooling among the 2,030 students in Carrollton are elementary school (527 | 26.0%), high school (446 | 22.0%), and college / undergraduate (436 | 21.5%).
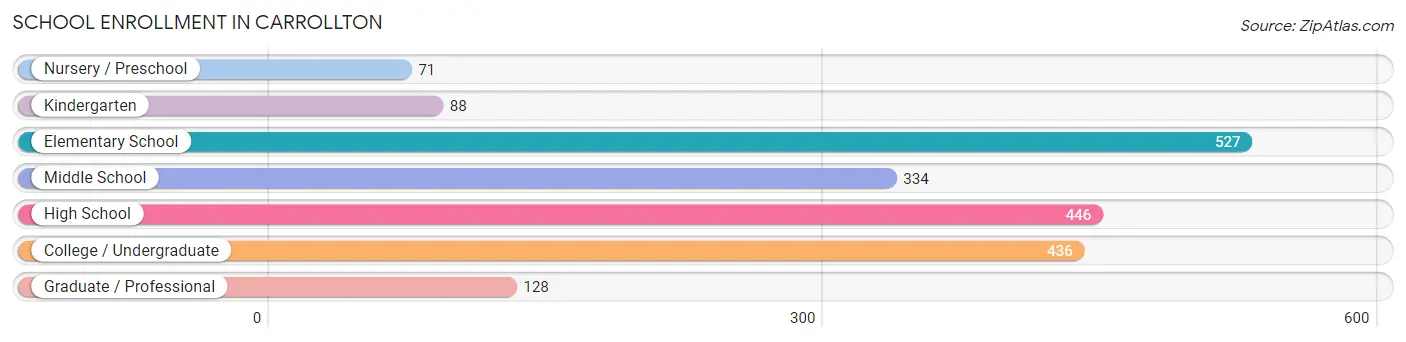
| School Level | # Students | % Students |
| Nursery / Preschool | 71 | 3.5% |
| Kindergarten | 88 | 4.3% |
| Elementary School | 527 | 26.0% |
| Middle School | 334 | 16.5% |
| High School | 446 | 22.0% |
| College / Undergraduate | 436 | 21.5% |
| Graduate / Professional | 128 | 6.3% |
| Total | 2,030 | 100.0% |
School Enrollment by Age by Funding Source in Carrollton
Out of a total of 2,030 students who are enrolled in schools in Carrollton, 546 (26.9%) attend a private institution, while the remaining 1,484 (73.1%) are enrolled in public schools. The age group of 3 to 4 year olds has the highest likelihood of being enrolled in private schools, with 71 (100.0% in the age bracket) enrolled. Conversely, the age group of 18 to 19 year olds has the lowest likelihood of being enrolled in a private school, with 188 (100.0% in the age bracket) attending a public institution.
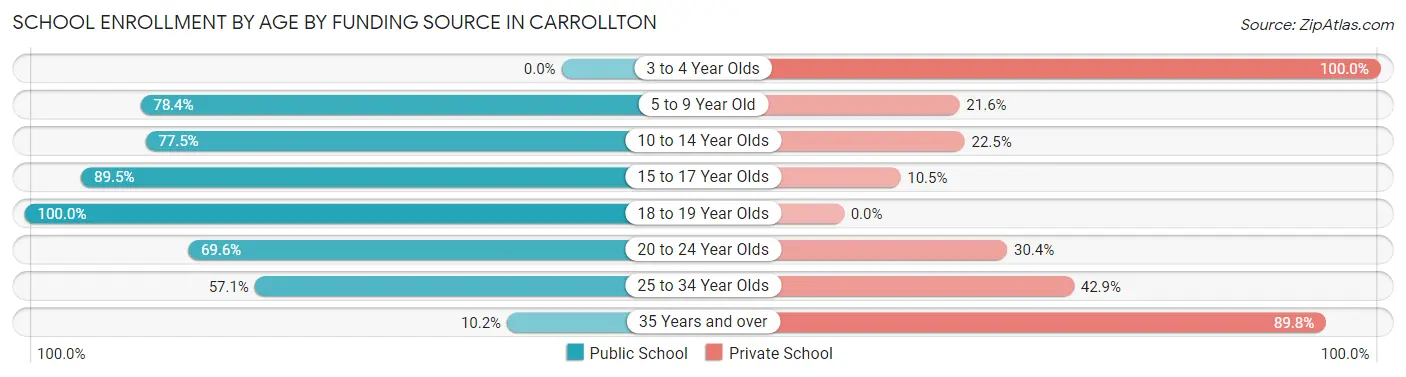
| Age Bracket | Public School | Private School |
| 3 to 4 Year Olds | 0 (0.0%) | 71 (100.0%) |
| 5 to 9 Year Old | 473 (78.4%) | 130 (21.6%) |
| 10 to 14 Year Olds | 358 (77.5%) | 104 (22.5%) |
| 15 to 17 Year Olds | 263 (89.5%) | 31 (10.5%) |
| 18 to 19 Year Olds | 188 (100.0%) | 0 (0.0%) |
| 20 to 24 Year Olds | 144 (69.6%) | 63 (30.4%) |
| 25 to 34 Year Olds | 44 (57.1%) | 33 (42.9%) |
| 35 Years and over | 13 (10.2%) | 115 (89.8%) |
| Total | 1,484 (73.1%) | 546 (26.9%) |
Educational Attainment by Field of Study in Carrollton
Business (416 | 20.2%), science & technology (327 | 15.8%), physical & health sciences (260 | 12.6%), education (154 | 7.5%), and social sciences (149 | 7.2%) are the most common fields of study among 2,065 individuals in Carrollton who have obtained a bachelor's degree or higher.
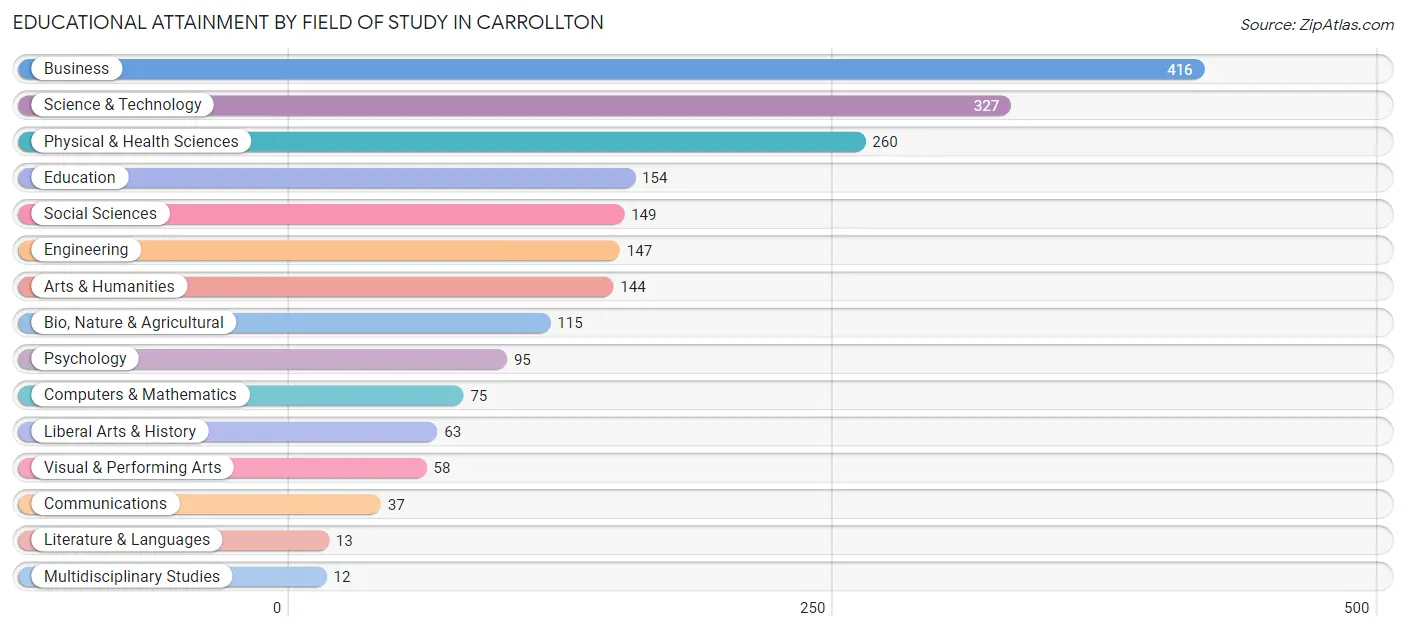
| Field of Study | # Graduates | % Graduates |
| Computers & Mathematics | 75 | 3.6% |
| Bio, Nature & Agricultural | 115 | 5.6% |
| Physical & Health Sciences | 260 | 12.6% |
| Psychology | 95 | 4.6% |
| Social Sciences | 149 | 7.2% |
| Engineering | 147 | 7.1% |
| Multidisciplinary Studies | 12 | 0.6% |
| Science & Technology | 327 | 15.8% |
| Business | 416 | 20.2% |
| Education | 154 | 7.5% |
| Literature & Languages | 13 | 0.6% |
| Liberal Arts & History | 63 | 3.0% |
| Visual & Performing Arts | 58 | 2.8% |
| Communications | 37 | 1.8% |
| Arts & Humanities | 144 | 7.0% |
| Total | 2,065 | 100.0% |
Transportation & Commute in Carrollton
Vehicle Availability by Sex in Carrollton
The most prevalent vehicle ownership categories in Carrollton are males with 2 vehicles (794, accounting for 39.4%) and females with 2 vehicles (806, making up 48.5%).
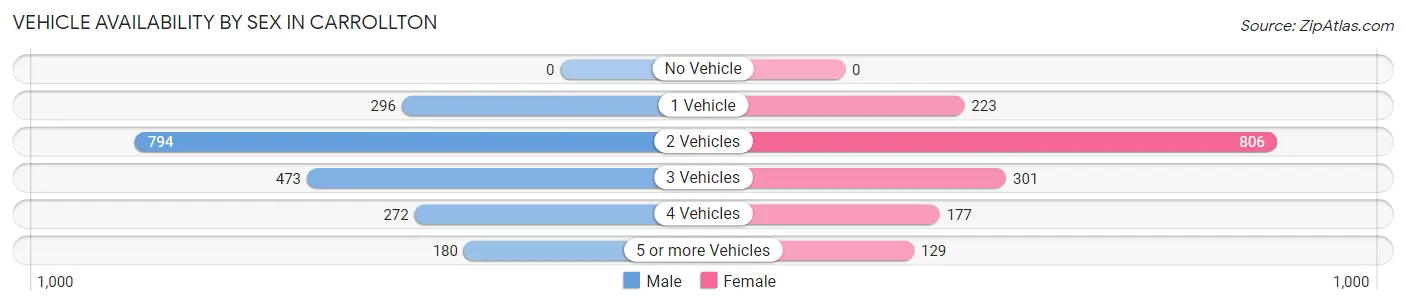
| Vehicles Available | Male | Female |
| No Vehicle | 0 (0.0%) | 0 (0.0%) |
| 1 Vehicle | 296 (14.7%) | 223 (13.6%) |
| 2 Vehicles | 794 (39.4%) | 806 (49.3%) |
| 3 Vehicles | 473 (23.5%) | 301 (18.4%) |
| 4 Vehicles | 272 (13.5%) | 177 (10.8%) |
| 5 or more Vehicles | 180 (8.9%) | 129 (7.9%) |
| Total | 2,015 (100.0%) | 1,636 (100.0%) |
Commute Time in Carrollton
The most frequently occuring commute durations in Carrollton are 30 to 34 minutes (646 commuters, 19.5%), 15 to 19 minutes (639 commuters, 19.3%), and 20 to 24 minutes (539 commuters, 16.3%).
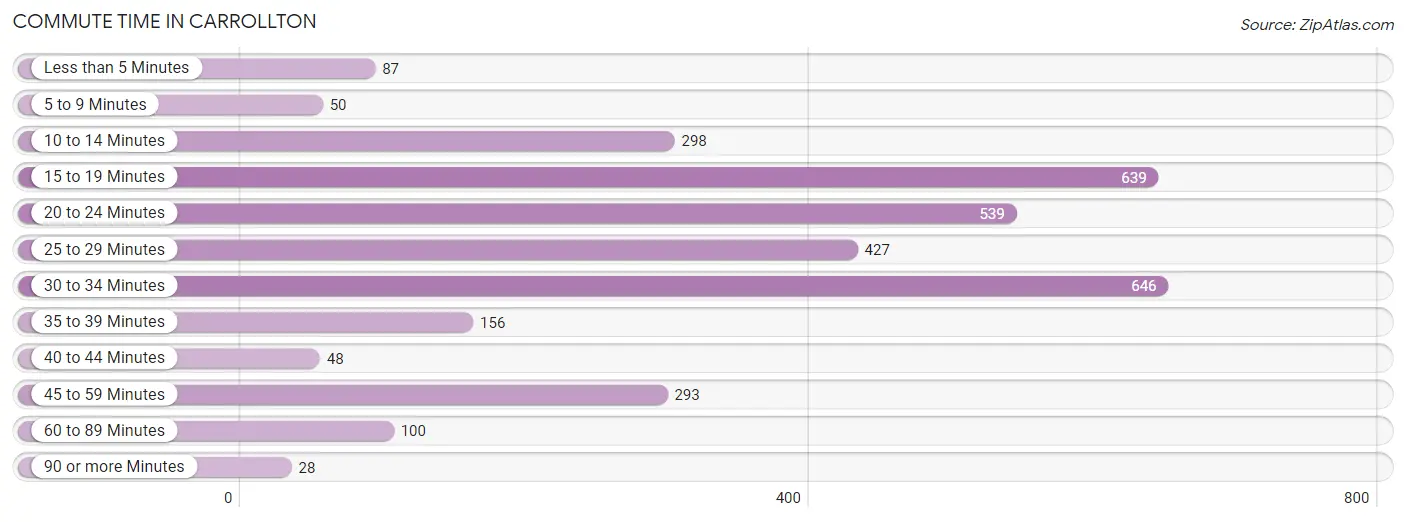
| Commute Time | # Commuters | % Commuters |
| Less than 5 Minutes | 87 | 2.6% |
| 5 to 9 Minutes | 50 | 1.5% |
| 10 to 14 Minutes | 298 | 9.0% |
| 15 to 19 Minutes | 639 | 19.3% |
| 20 to 24 Minutes | 539 | 16.3% |
| 25 to 29 Minutes | 427 | 12.9% |
| 30 to 34 Minutes | 646 | 19.5% |
| 35 to 39 Minutes | 156 | 4.7% |
| 40 to 44 Minutes | 48 | 1.5% |
| 45 to 59 Minutes | 293 | 8.8% |
| 60 to 89 Minutes | 100 | 3.0% |
| 90 or more Minutes | 28 | 0.9% |
Commute Time by Sex in Carrollton
The most common commute times in Carrollton are 15 to 19 minutes (498 commuters, 26.3%) for males and 25 to 29 minutes (290 commuters, 20.5%) for females.
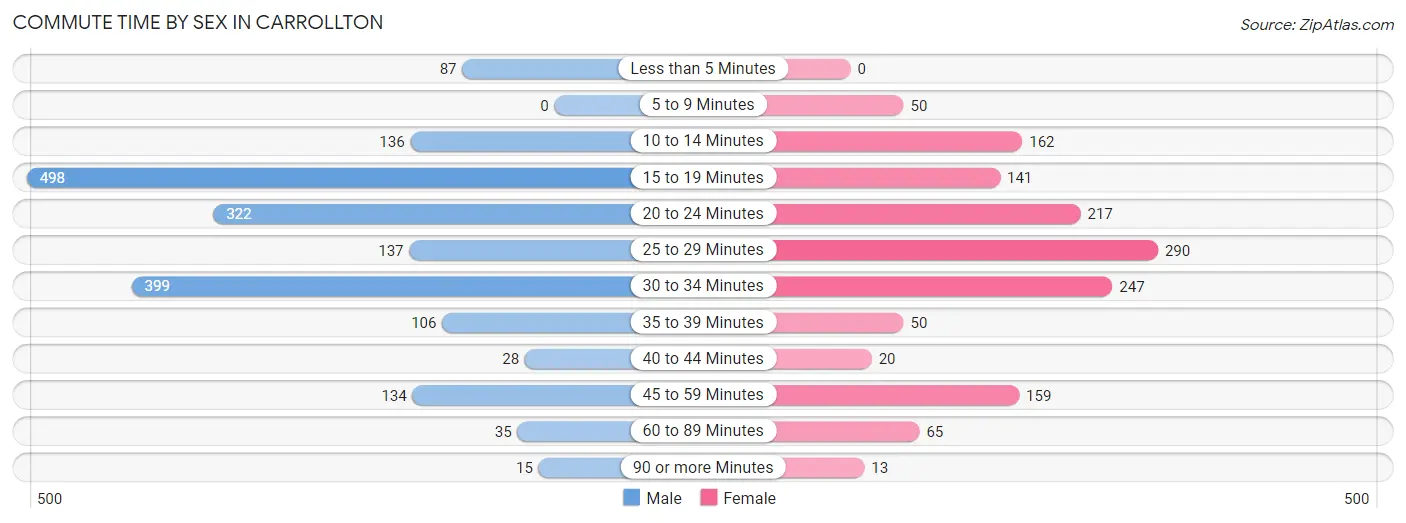
| Commute Time | Male | Female |
| Less than 5 Minutes | 87 (4.6%) | 0 (0.0%) |
| 5 to 9 Minutes | 0 (0.0%) | 50 (3.5%) |
| 10 to 14 Minutes | 136 (7.2%) | 162 (11.5%) |
| 15 to 19 Minutes | 498 (26.3%) | 141 (10.0%) |
| 20 to 24 Minutes | 322 (17.0%) | 217 (15.3%) |
| 25 to 29 Minutes | 137 (7.2%) | 290 (20.5%) |
| 30 to 34 Minutes | 399 (21.0%) | 247 (17.5%) |
| 35 to 39 Minutes | 106 (5.6%) | 50 (3.5%) |
| 40 to 44 Minutes | 28 (1.5%) | 20 (1.4%) |
| 45 to 59 Minutes | 134 (7.1%) | 159 (11.2%) |
| 60 to 89 Minutes | 35 (1.8%) | 65 (4.6%) |
| 90 or more Minutes | 15 (0.8%) | 13 (0.9%) |
Time of Departure to Work by Sex in Carrollton
The most frequent times of departure to work in Carrollton are 7:00 AM to 7:29 AM (249, 13.1%) for males and 7:30 AM to 7:59 AM (279, 19.7%) for females.
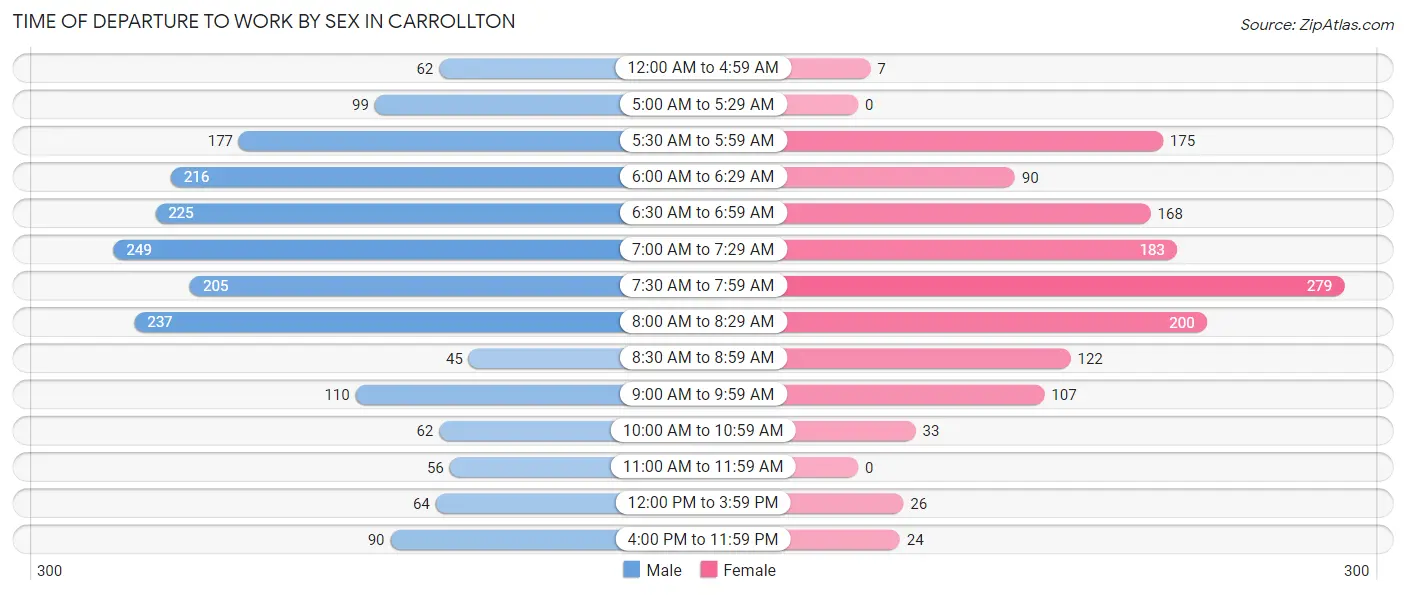
| Time of Departure | Male | Female |
| 12:00 AM to 4:59 AM | 62 (3.3%) | 7 (0.5%) |
| 5:00 AM to 5:29 AM | 99 (5.2%) | 0 (0.0%) |
| 5:30 AM to 5:59 AM | 177 (9.3%) | 175 (12.4%) |
| 6:00 AM to 6:29 AM | 216 (11.4%) | 90 (6.4%) |
| 6:30 AM to 6:59 AM | 225 (11.9%) | 168 (11.9%) |
| 7:00 AM to 7:29 AM | 249 (13.1%) | 183 (12.9%) |
| 7:30 AM to 7:59 AM | 205 (10.8%) | 279 (19.7%) |
| 8:00 AM to 8:29 AM | 237 (12.5%) | 200 (14.1%) |
| 8:30 AM to 8:59 AM | 45 (2.4%) | 122 (8.6%) |
| 9:00 AM to 9:59 AM | 110 (5.8%) | 107 (7.6%) |
| 10:00 AM to 10:59 AM | 62 (3.3%) | 33 (2.3%) |
| 11:00 AM to 11:59 AM | 56 (2.9%) | 0 (0.0%) |
| 12:00 PM to 3:59 PM | 64 (3.4%) | 26 (1.8%) |
| 4:00 PM to 11:59 PM | 90 (4.7%) | 24 (1.7%) |
| Total | 1,897 (100.0%) | 1,414 (100.0%) |
Housing Occupancy in Carrollton
Occupancy by Ownership in Carrollton
Of the total 2,732 dwellings in Carrollton, owner-occupied units account for 1,852 (67.8%), while renter-occupied units make up 880 (32.2%).
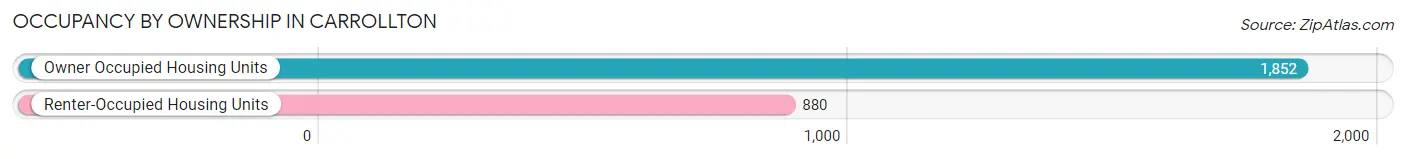
| Occupancy | # Housing Units | % Housing Units |
| Owner Occupied Housing Units | 1,852 | 67.8% |
| Renter-Occupied Housing Units | 880 | 32.2% |
| Total Occupied Housing Units | 2,732 | 100.0% |
Occupancy by Household Size in Carrollton
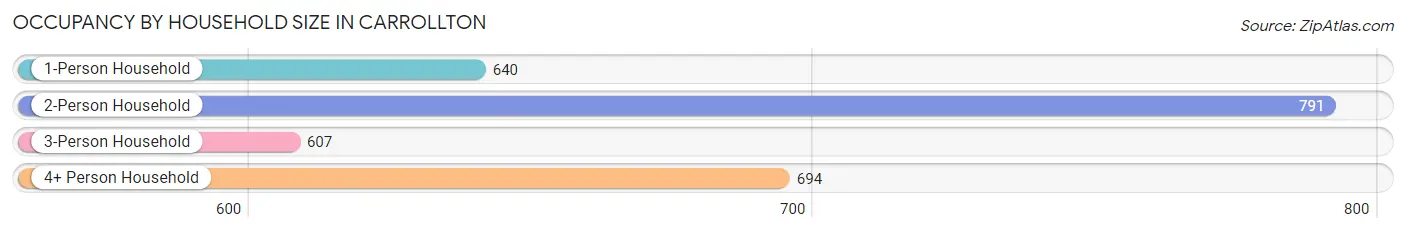
| Household Size | # Housing Units | % Housing Units |
| 1-Person Household | 640 | 23.4% |
| 2-Person Household | 791 | 28.9% |
| 3-Person Household | 607 | 22.2% |
| 4+ Person Household | 694 | 25.4% |
| Total Housing Units | 2,732 | 100.0% |
Occupancy by Ownership by Household Size in Carrollton
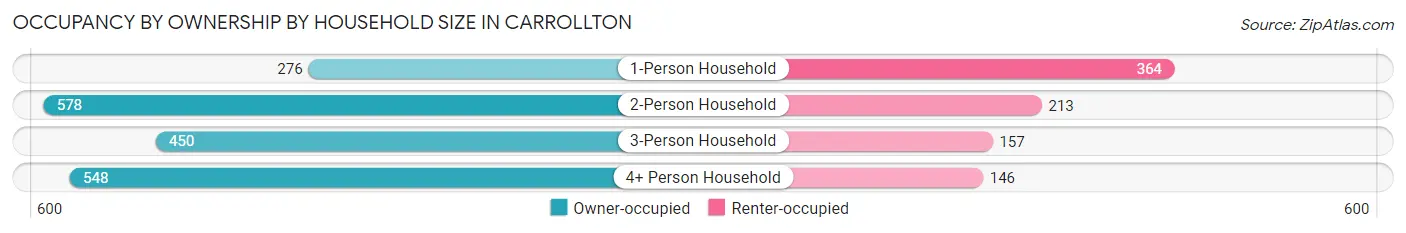
| Household Size | Owner-occupied | Renter-occupied |
| 1-Person Household | 276 (43.1%) | 364 (56.9%) |
| 2-Person Household | 578 (73.1%) | 213 (26.9%) |
| 3-Person Household | 450 (74.1%) | 157 (25.9%) |
| 4+ Person Household | 548 (79.0%) | 146 (21.0%) |
| Total Housing Units | 1,852 (67.8%) | 880 (32.2%) |
Occupancy by Educational Attainment in Carrollton
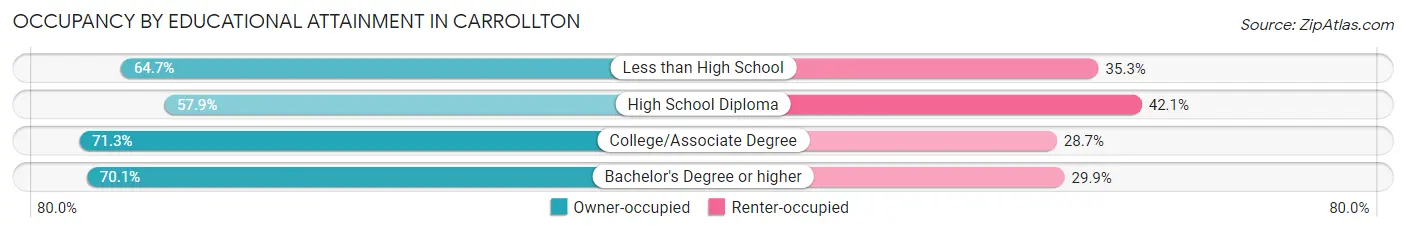
| Household Size | Owner-occupied | Renter-occupied |
| Less than High School | 33 (64.7%) | 18 (35.3%) |
| High School Diploma | 342 (57.9%) | 249 (42.1%) |
| College/Associate Degree | 677 (71.3%) | 272 (28.7%) |
| Bachelor's Degree or higher | 800 (70.1%) | 341 (29.9%) |
Occupancy by Age of Householder in Carrollton
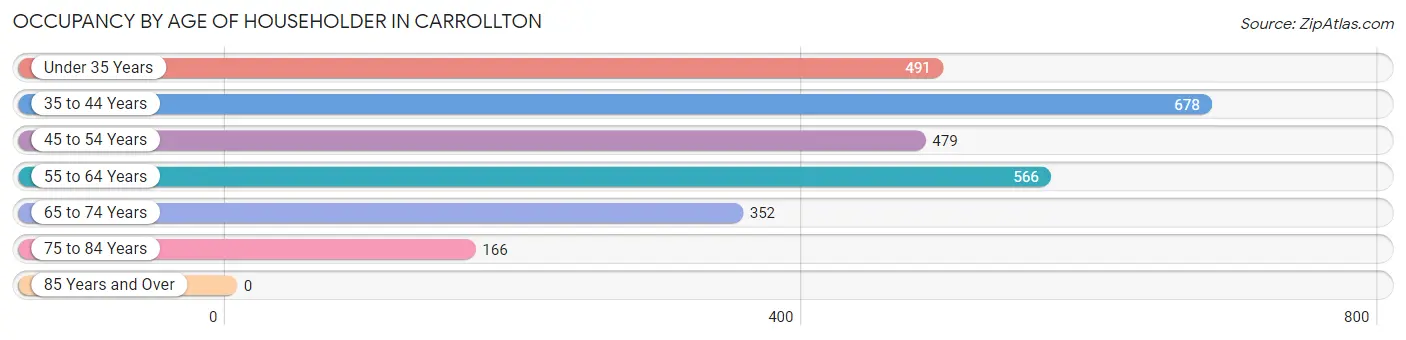
| Age Bracket | # Households | % Households |
| Under 35 Years | 491 | 18.0% |
| 35 to 44 Years | 678 | 24.8% |
| 45 to 54 Years | 479 | 17.5% |
| 55 to 64 Years | 566 | 20.7% |
| 65 to 74 Years | 352 | 12.9% |
| 75 to 84 Years | 166 | 6.1% |
| 85 Years and Over | 0 | 0.0% |
| Total | 2,732 | 100.0% |
Housing Finances in Carrollton
Median Income by Occupancy in Carrollton
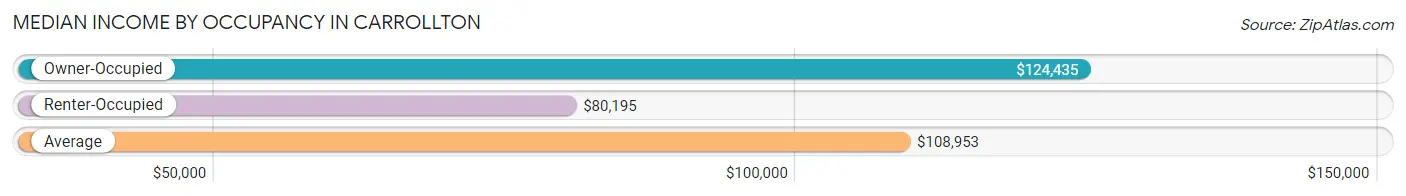
| Occupancy Type | # Households | Median Income |
| Owner-Occupied | 1,852 (67.8%) | $124,435 |
| Renter-Occupied | 880 (32.2%) | $80,195 |
| Average | 2,732 (100.0%) | $108,953 |
Occupancy by Householder Income Bracket in Carrollton
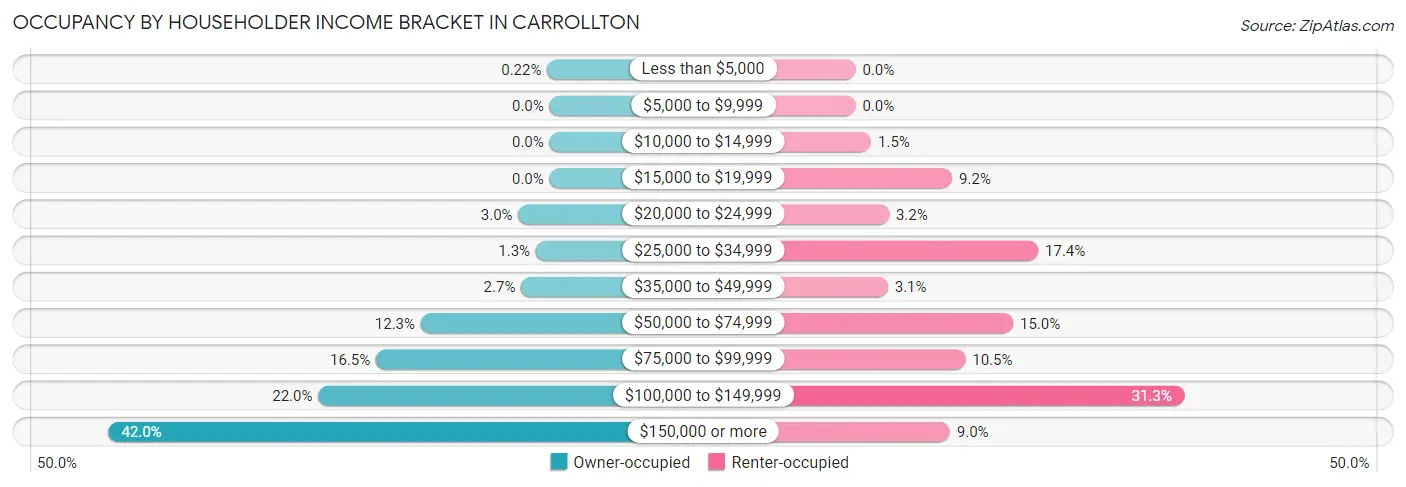
| Income Bracket | Owner-occupied | Renter-occupied |
| Less than $5,000 | 4 (0.2%) | 0 (0.0%) |
| $5,000 to $9,999 | 0 (0.0%) | 0 (0.0%) |
| $10,000 to $14,999 | 0 (0.0%) | 13 (1.5%) |
| $15,000 to $19,999 | 0 (0.0%) | 81 (9.2%) |
| $20,000 to $24,999 | 55 (3.0%) | 28 (3.2%) |
| $25,000 to $34,999 | 24 (1.3%) | 153 (17.4%) |
| $35,000 to $49,999 | 50 (2.7%) | 27 (3.1%) |
| $50,000 to $74,999 | 227 (12.3%) | 132 (15.0%) |
| $75,000 to $99,999 | 306 (16.5%) | 92 (10.4%) |
| $100,000 to $149,999 | 408 (22.0%) | 275 (31.2%) |
| $150,000 or more | 778 (42.0%) | 79 (9.0%) |
| Total | 1,852 (100.0%) | 880 (100.0%) |
Monthly Housing Cost Tiers in Carrollton
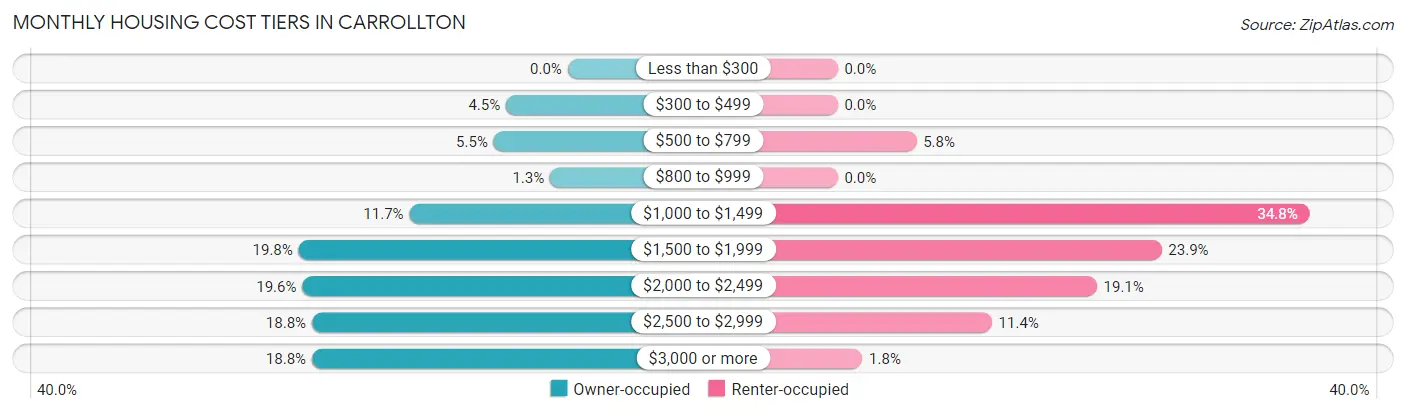
| Monthly Cost | Owner-occupied | Renter-occupied |
| Less than $300 | 0 (0.0%) | 0 (0.0%) |
| $300 to $499 | 84 (4.5%) | 0 (0.0%) |
| $500 to $799 | 101 (5.4%) | 51 (5.8%) |
| $800 to $999 | 24 (1.3%) | 0 (0.0%) |
| $1,000 to $1,499 | 216 (11.7%) | 306 (34.8%) |
| $1,500 to $1,999 | 367 (19.8%) | 210 (23.9%) |
| $2,000 to $2,499 | 362 (19.6%) | 168 (19.1%) |
| $2,500 to $2,999 | 349 (18.8%) | 100 (11.4%) |
| $3,000 or more | 349 (18.8%) | 16 (1.8%) |
| Total | 1,852 (100.0%) | 880 (100.0%) |
Physical Housing Characteristics in Carrollton
Housing Structures in Carrollton
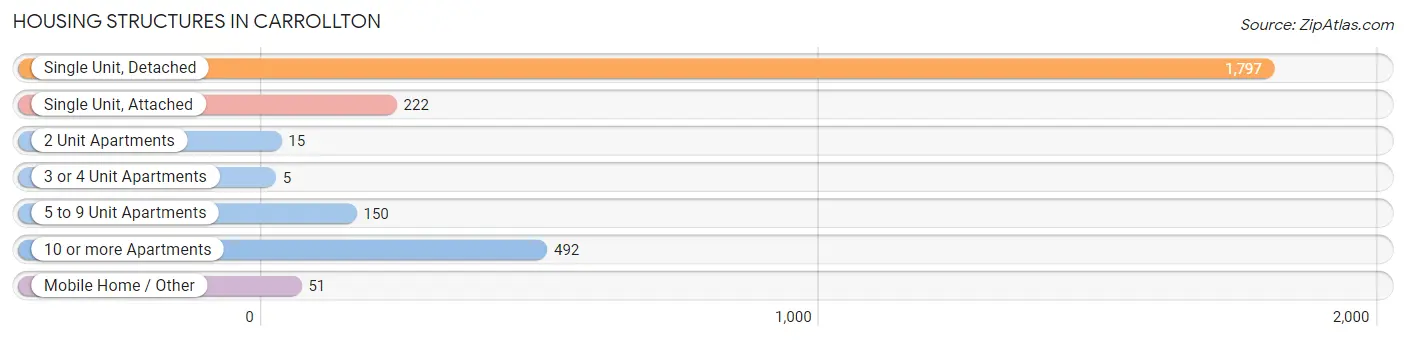
| Structure Type | # Housing Units | % Housing Units |
| Single Unit, Detached | 1,797 | 65.8% |
| Single Unit, Attached | 222 | 8.1% |
| 2 Unit Apartments | 15 | 0.5% |
| 3 or 4 Unit Apartments | 5 | 0.2% |
| 5 to 9 Unit Apartments | 150 | 5.5% |
| 10 or more Apartments | 492 | 18.0% |
| Mobile Home / Other | 51 | 1.9% |
| Total | 2,732 | 100.0% |
Housing Structures by Occupancy in Carrollton
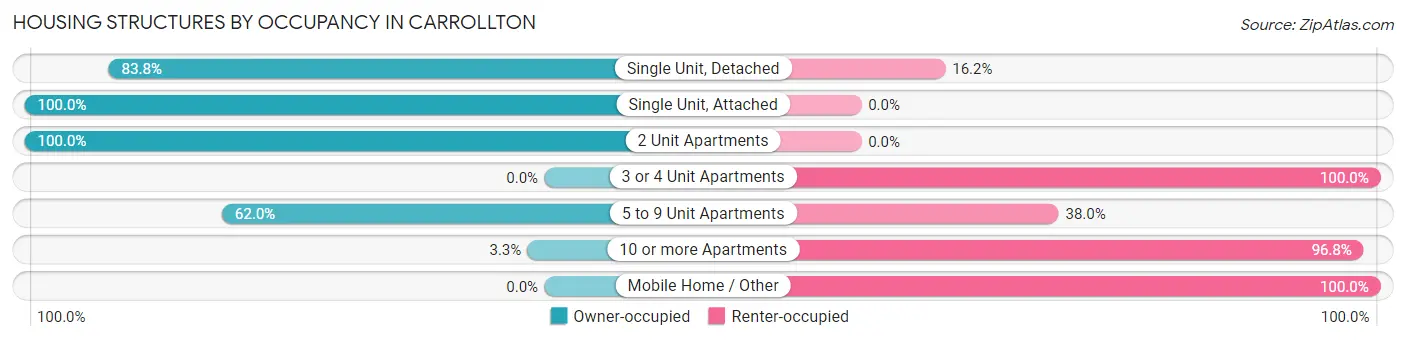
| Structure Type | Owner-occupied | Renter-occupied |
| Single Unit, Detached | 1,506 (83.8%) | 291 (16.2%) |
| Single Unit, Attached | 222 (100.0%) | 0 (0.0%) |
| 2 Unit Apartments | 15 (100.0%) | 0 (0.0%) |
| 3 or 4 Unit Apartments | 0 (0.0%) | 5 (100.0%) |
| 5 to 9 Unit Apartments | 93 (62.0%) | 57 (38.0%) |
| 10 or more Apartments | 16 (3.3%) | 476 (96.8%) |
| Mobile Home / Other | 0 (0.0%) | 51 (100.0%) |
| Total | 1,852 (67.8%) | 880 (32.2%) |
Housing Structures by Number of Rooms in Carrollton
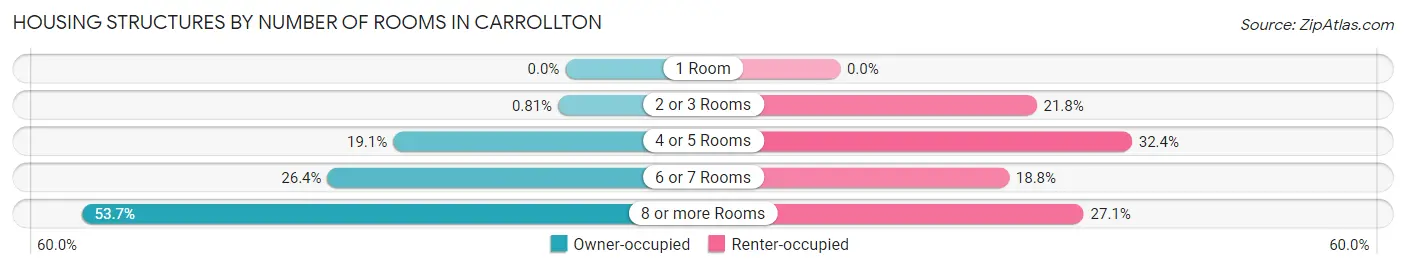
| Number of Rooms | Owner-occupied | Renter-occupied |
| 1 Room | 0 (0.0%) | 0 (0.0%) |
| 2 or 3 Rooms | 15 (0.8%) | 192 (21.8%) |
| 4 or 5 Rooms | 354 (19.1%) | 285 (32.4%) |
| 6 or 7 Rooms | 489 (26.4%) | 165 (18.8%) |
| 8 or more Rooms | 994 (53.7%) | 238 (27.1%) |
| Total | 1,852 (100.0%) | 880 (100.0%) |
Housing Structure by Heating Type in Carrollton
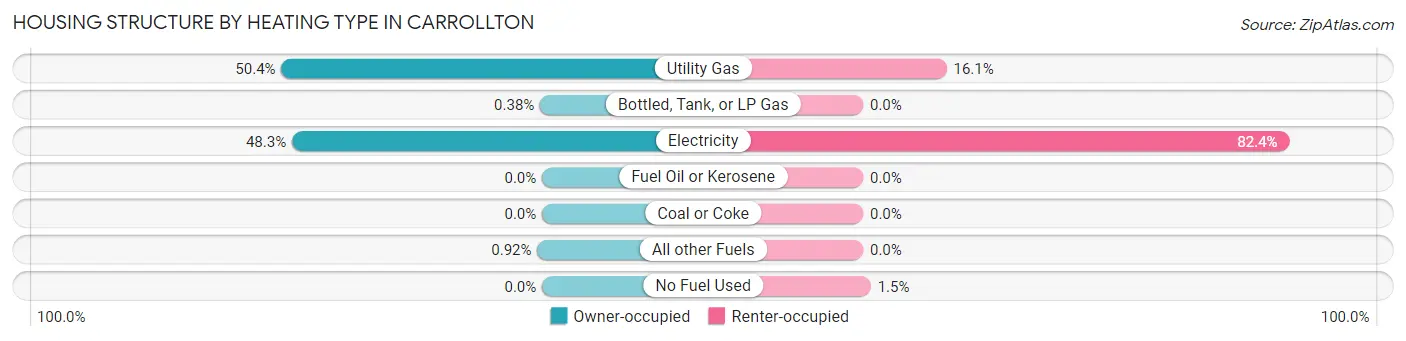
| Heating Type | Owner-occupied | Renter-occupied |
| Utility Gas | 933 (50.4%) | 142 (16.1%) |
| Bottled, Tank, or LP Gas | 7 (0.4%) | 0 (0.0%) |
| Electricity | 895 (48.3%) | 725 (82.4%) |
| Fuel Oil or Kerosene | 0 (0.0%) | 0 (0.0%) |
| Coal or Coke | 0 (0.0%) | 0 (0.0%) |
| All other Fuels | 17 (0.9%) | 0 (0.0%) |
| No Fuel Used | 0 (0.0%) | 13 (1.5%) |
| Total | 1,852 (100.0%) | 880 (100.0%) |
Household Vehicle Usage in Carrollton
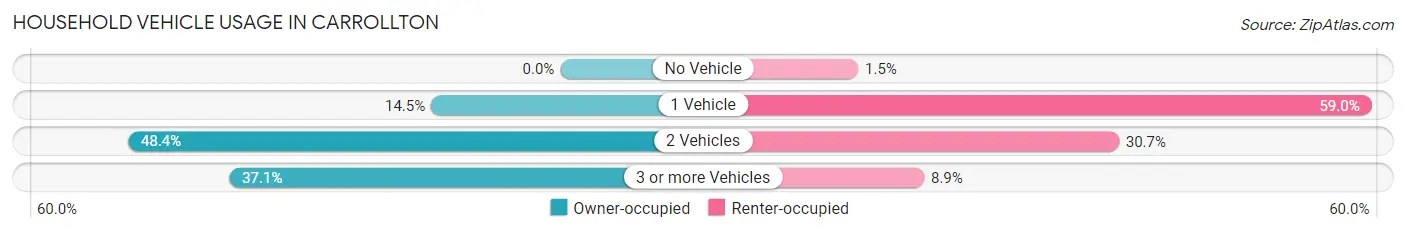
| Vehicles per Household | Owner-occupied | Renter-occupied |
| No Vehicle | 0 (0.0%) | 13 (1.5%) |
| 1 Vehicle | 268 (14.5%) | 519 (59.0%) |
| 2 Vehicles | 897 (48.4%) | 270 (30.7%) |
| 3 or more Vehicles | 687 (37.1%) | 78 (8.9%) |
| Total | 1,852 (100.0%) | 880 (100.0%) |
Real Estate & Mortgages in Carrollton
Real Estate and Mortgage Overview in Carrollton
| Characteristic | Without Mortgage | With Mortgage |
| Housing Units | 269 | 1,583 |
| Median Property Value | $292,000 | $388,300 |
| Median Household Income | $95,375 | $728 |
| Monthly Housing Costs | $597 | $349 |
| Real Estate Taxes | $2,631 | $24 |
Property Value by Mortgage Status in Carrollton
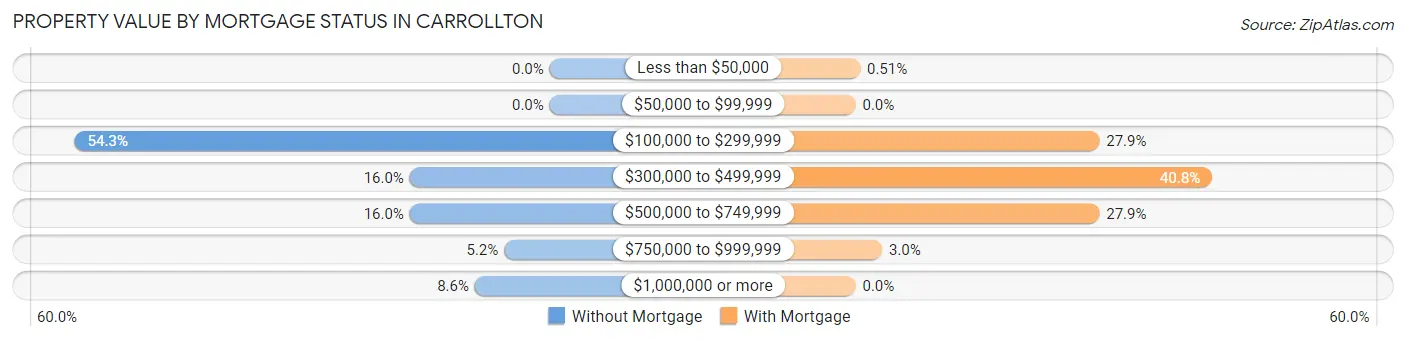
| Property Value | Without Mortgage | With Mortgage |
| Less than $50,000 | 0 (0.0%) | 8 (0.5%) |
| $50,000 to $99,999 | 0 (0.0%) | 0 (0.0%) |
| $100,000 to $299,999 | 146 (54.3%) | 441 (27.9%) |
| $300,000 to $499,999 | 43 (16.0%) | 645 (40.7%) |
| $500,000 to $749,999 | 43 (16.0%) | 441 (27.9%) |
| $750,000 to $999,999 | 14 (5.2%) | 48 (3.0%) |
| $1,000,000 or more | 23 (8.6%) | 0 (0.0%) |
| Total | 269 (100.0%) | 1,583 (100.0%) |
Household Income by Mortgage Status in Carrollton
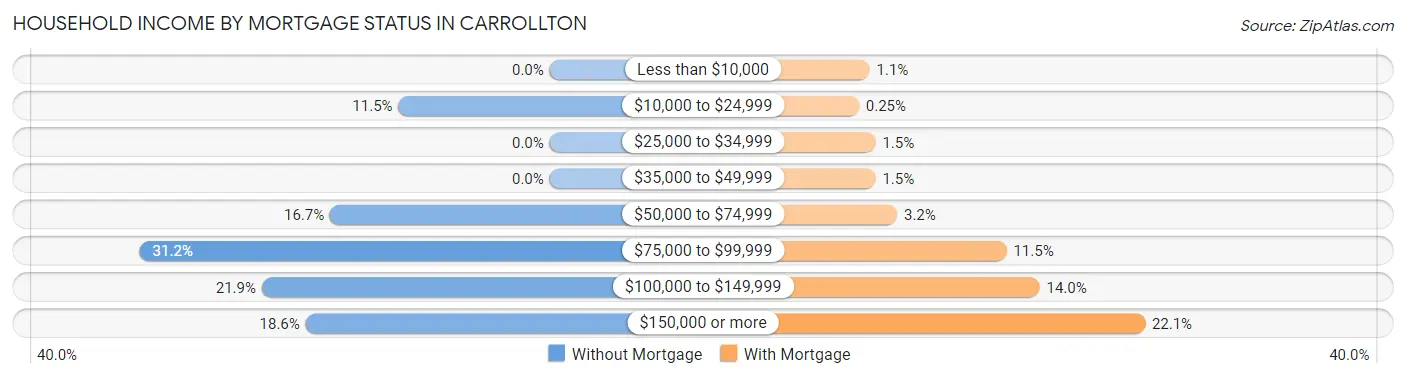
| Household Income | Without Mortgage | With Mortgage |
| Less than $10,000 | 0 (0.0%) | 17 (1.1%) |
| $10,000 to $24,999 | 31 (11.5%) | 4 (0.3%) |
| $25,000 to $34,999 | 0 (0.0%) | 24 (1.5%) |
| $35,000 to $49,999 | 0 (0.0%) | 24 (1.5%) |
| $50,000 to $74,999 | 45 (16.7%) | 50 (3.2%) |
| $75,000 to $99,999 | 84 (31.2%) | 182 (11.5%) |
| $100,000 to $149,999 | 59 (21.9%) | 222 (14.0%) |
| $150,000 or more | 50 (18.6%) | 349 (22.1%) |
| Total | 269 (100.0%) | 1,583 (100.0%) |
Property Value to Household Income Ratio in Carrollton
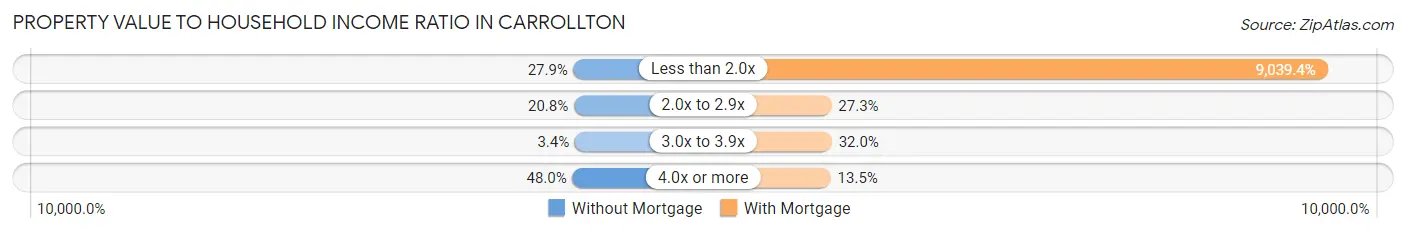
| Value-to-Income Ratio | Without Mortgage | With Mortgage |
| Less than 2.0x | 75 (27.9%) | 143,094 (9,039.4%) |
| 2.0x to 2.9x | 56 (20.8%) | 432 (27.3%) |
| 3.0x to 3.9x | 9 (3.4%) | 507 (32.0%) |
| 4.0x or more | 129 (48.0%) | 214 (13.5%) |
| Total | 269 (100.0%) | 1,583 (100.0%) |
Real Estate Taxes by Mortgage Status in Carrollton
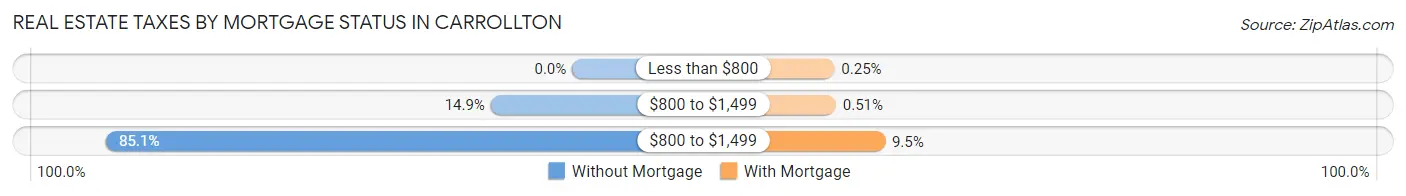
| Property Taxes | Without Mortgage | With Mortgage |
| Less than $800 | 0 (0.0%) | 4 (0.3%) |
| $800 to $1,499 | 40 (14.9%) | 8 (0.5%) |
| $800 to $1,499 | 229 (85.1%) | 150 (9.5%) |
| Total | 269 (100.0%) | 1,583 (100.0%) |
Health & Disability in Carrollton
Health Insurance Coverage by Age in Carrollton
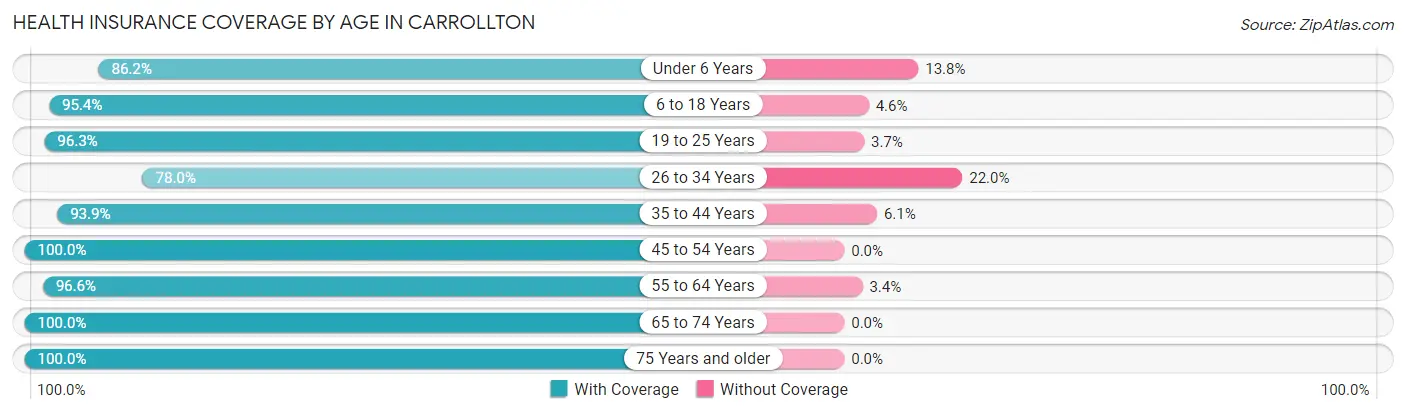
| Age Bracket | With Coverage | Without Coverage |
| Under 6 Years | 381 (86.2%) | 61 (13.8%) |
| 6 to 18 Years | 1,466 (95.4%) | 70 (4.6%) |
| 19 to 25 Years | 651 (96.3%) | 25 (3.7%) |
| 26 to 34 Years | 528 (78.0%) | 149 (22.0%) |
| 35 to 44 Years | 1,048 (93.9%) | 68 (6.1%) |
| 45 to 54 Years | 835 (100.0%) | 0 (0.0%) |
| 55 to 64 Years | 1,001 (96.6%) | 35 (3.4%) |
| 65 to 74 Years | 593 (100.0%) | 0 (0.0%) |
| 75 Years and older | 263 (100.0%) | 0 (0.0%) |
| Total | 6,766 (94.3%) | 408 (5.7%) |
Health Insurance Coverage by Citizenship Status in Carrollton
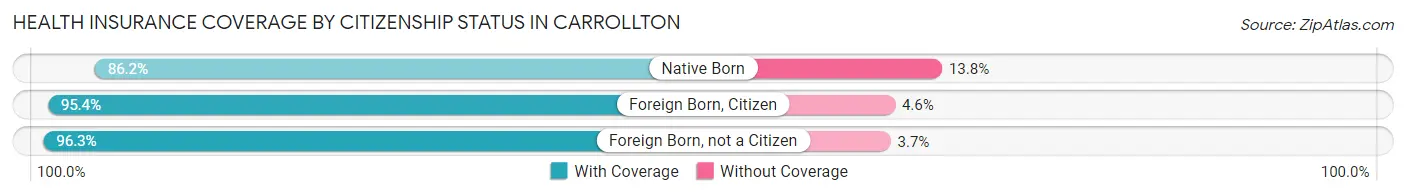
| Citizenship Status | With Coverage | Without Coverage |
| Native Born | 381 (86.2%) | 61 (13.8%) |
| Foreign Born, Citizen | 1,466 (95.4%) | 70 (4.6%) |
| Foreign Born, not a Citizen | 651 (96.3%) | 25 (3.7%) |
Health Insurance Coverage by Household Income in Carrollton
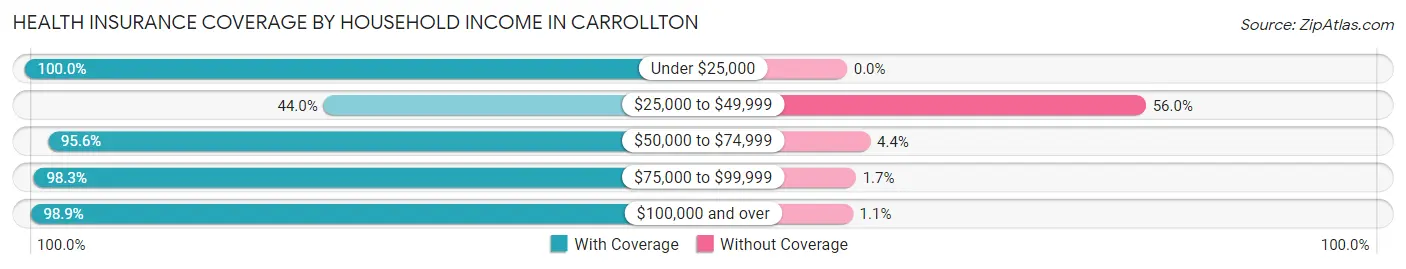
| Household Income | With Coverage | Without Coverage |
| Under $25,000 | 283 (100.0%) | 0 (0.0%) |
| $25,000 to $49,999 | 245 (44.0%) | 312 (56.0%) |
| $50,000 to $74,999 | 613 (95.6%) | 28 (4.4%) |
| $75,000 to $99,999 | 881 (98.3%) | 15 (1.7%) |
| $100,000 and over | 4,744 (98.9%) | 53 (1.1%) |
Public vs Private Health Insurance Coverage by Age in Carrollton
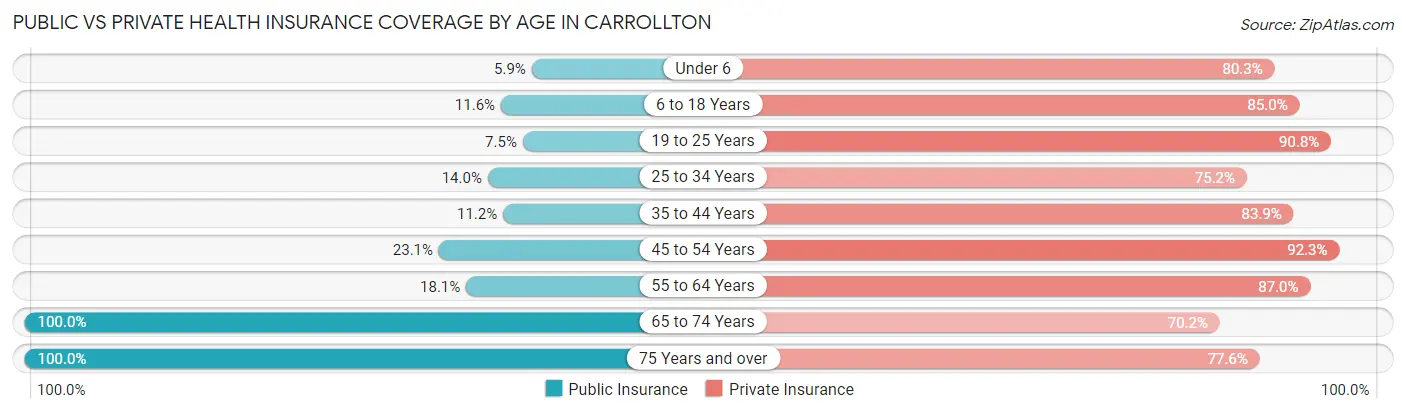
| Age Bracket | Public Insurance | Private Insurance |
| Under 6 | 26 (5.9%) | 355 (80.3%) |
| 6 to 18 Years | 178 (11.6%) | 1,305 (85.0%) |
| 19 to 25 Years | 51 (7.5%) | 614 (90.8%) |
| 25 to 34 Years | 95 (14.0%) | 509 (75.2%) |
| 35 to 44 Years | 125 (11.2%) | 936 (83.9%) |
| 45 to 54 Years | 193 (23.1%) | 771 (92.3%) |
| 55 to 64 Years | 187 (18.0%) | 901 (87.0%) |
| 65 to 74 Years | 593 (100.0%) | 416 (70.2%) |
| 75 Years and over | 263 (100.0%) | 204 (77.6%) |
| Total | 1,711 (23.8%) | 6,011 (83.8%) |
Disability Status by Sex by Age in Carrollton
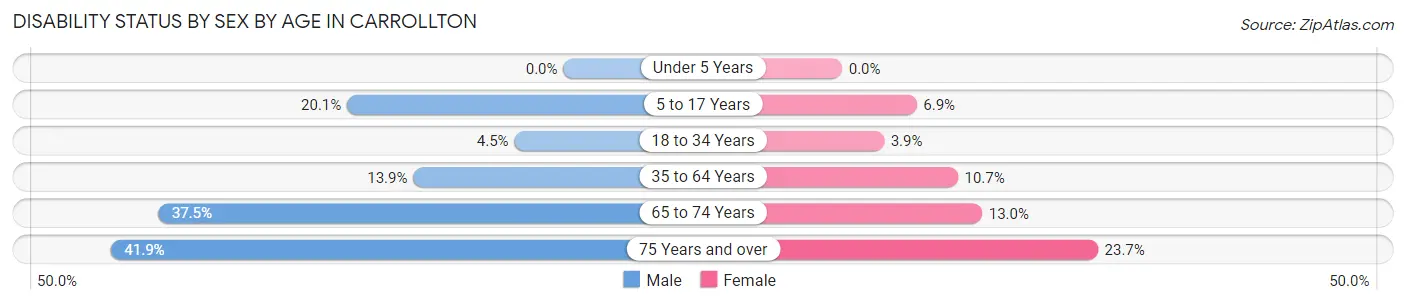
| Age Bracket | Male | Female |
| Under 5 Years | 0 (0.0%) | 0 (0.0%) |
| 5 to 17 Years | 175 (20.1%) | 38 (6.9%) |
| 18 to 34 Years | 42 (4.5%) | 22 (3.9%) |
| 35 to 64 Years | 219 (13.9%) | 152 (10.7%) |
| 65 to 74 Years | 107 (37.5%) | 40 (13.0%) |
| 75 Years and over | 52 (41.9%) | 33 (23.7%) |
Disability Class by Sex by Age in Carrollton
Disability Class: Hearing Difficulty
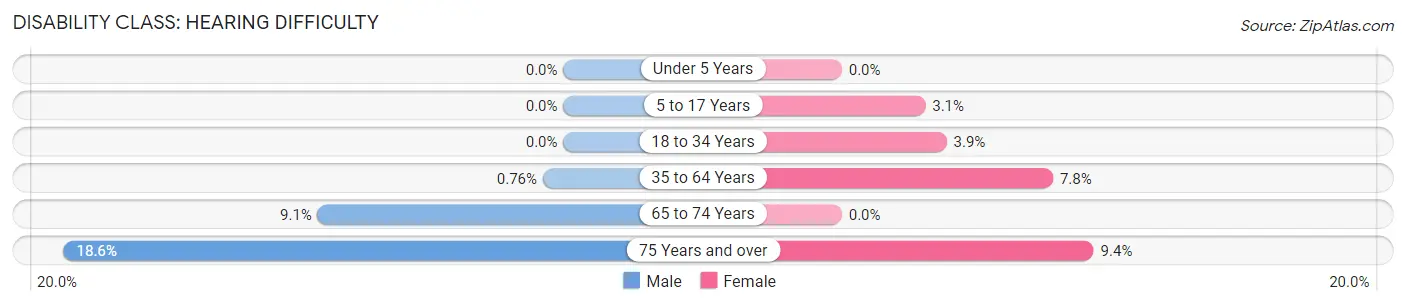
| Age Bracket | Male | Female |
| Under 5 Years | 0 (0.0%) | 0 (0.0%) |
| 5 to 17 Years | 0 (0.0%) | 17 (3.1%) |
| 18 to 34 Years | 0 (0.0%) | 22 (3.9%) |
| 35 to 64 Years | 12 (0.8%) | 111 (7.8%) |
| 65 to 74 Years | 26 (9.1%) | 0 (0.0%) |
| 75 Years and over | 23 (18.5%) | 13 (9.3%) |
Disability Class: Vision Difficulty
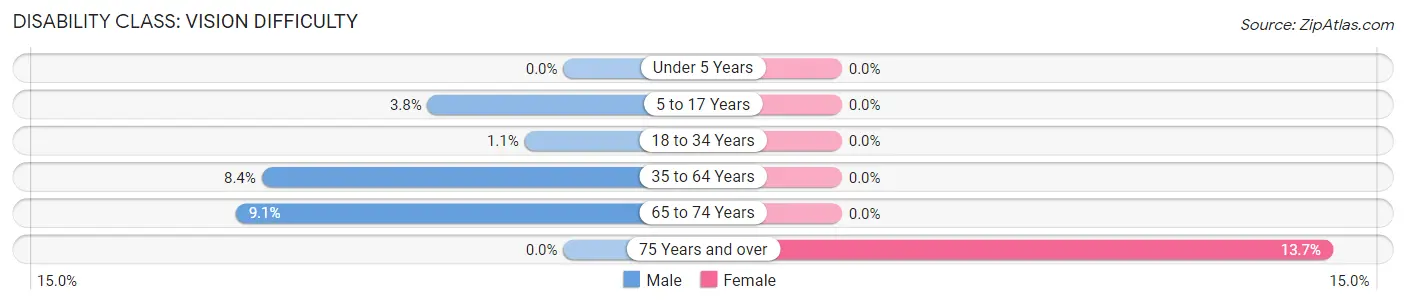
| Age Bracket | Male | Female |
| Under 5 Years | 0 (0.0%) | 0 (0.0%) |
| 5 to 17 Years | 33 (3.8%) | 0 (0.0%) |
| 18 to 34 Years | 10 (1.1%) | 0 (0.0%) |
| 35 to 64 Years | 132 (8.4%) | 0 (0.0%) |
| 65 to 74 Years | 26 (9.1%) | 0 (0.0%) |
| 75 Years and over | 0 (0.0%) | 19 (13.7%) |
Disability Class: Cognitive Difficulty
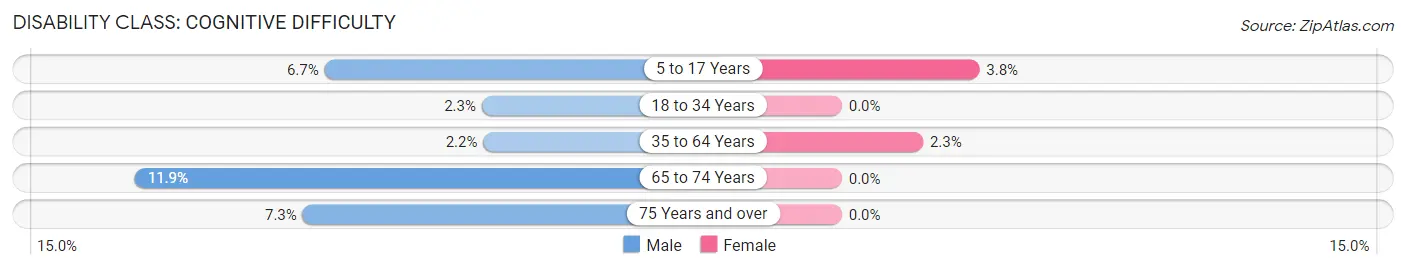
| Age Bracket | Male | Female |
| 5 to 17 Years | 58 (6.7%) | 21 (3.8%) |
| 18 to 34 Years | 21 (2.3%) | 0 (0.0%) |
| 35 to 64 Years | 35 (2.2%) | 32 (2.3%) |
| 65 to 74 Years | 34 (11.9%) | 0 (0.0%) |
| 75 Years and over | 9 (7.3%) | 0 (0.0%) |
Disability Class: Ambulatory Difficulty
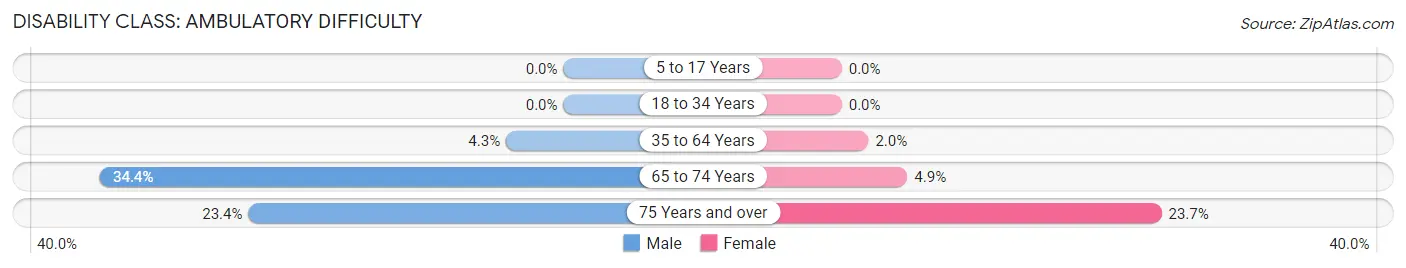
| Age Bracket | Male | Female |
| 5 to 17 Years | 0 (0.0%) | 0 (0.0%) |
| 18 to 34 Years | 0 (0.0%) | 0 (0.0%) |
| 35 to 64 Years | 67 (4.3%) | 28 (2.0%) |
| 65 to 74 Years | 98 (34.4%) | 15 (4.9%) |
| 75 Years and over | 29 (23.4%) | 33 (23.7%) |
Disability Class: Self-Care Difficulty
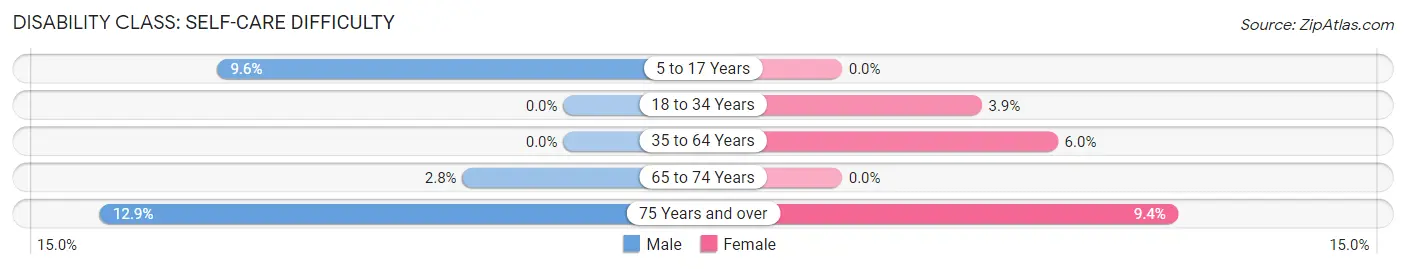
| Age Bracket | Male | Female |
| 5 to 17 Years | 84 (9.6%) | 0 (0.0%) |
| 18 to 34 Years | 0 (0.0%) | 22 (3.9%) |
| 35 to 64 Years | 0 (0.0%) | 85 (6.0%) |
| 65 to 74 Years | 8 (2.8%) | 0 (0.0%) |
| 75 Years and over | 16 (12.9%) | 13 (9.3%) |
Technology Access in Carrollton
Computing Device Access in Carrollton
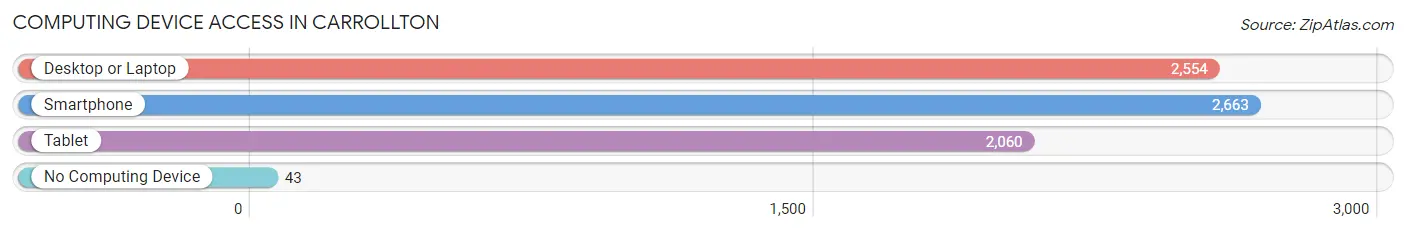
| Device Type | # Households | % Households |
| Desktop or Laptop | 2,554 | 93.5% |
| Smartphone | 2,663 | 97.5% |
| Tablet | 2,060 | 75.4% |
| No Computing Device | 43 | 1.6% |
| Total | 2,732 | 100.0% |
Internet Access in Carrollton
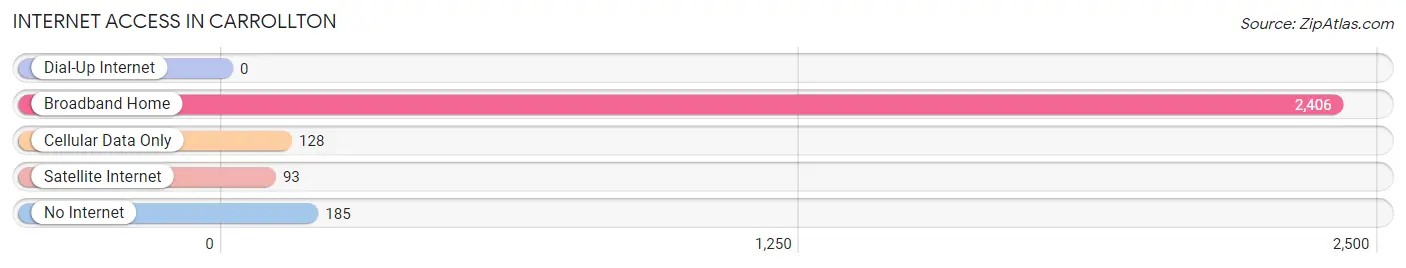
| Internet Type | # Households | % Households |
| Dial-Up Internet | 0 | 0.0% |
| Broadband Home | 2,406 | 88.1% |
| Cellular Data Only | 128 | 4.7% |
| Satellite Internet | 93 | 3.4% |
| No Internet | 185 | 6.8% |
| Total | 2,732 | 100.0% |
Carrollton Summary
Carrollton, Virginia is a small town located in Isle of Wight County, Virginia. It is situated on the south bank of the James River, approximately 25 miles south of the state capital of Richmond. The town has a population of approximately 1,000 people and is part of the Hampton Roads metropolitan area.
History
Carrollton was first settled in the early 1700s by English colonists. The town was named after Charles Carroll, a signer of the Declaration of Independence. The town was officially incorporated in 1819.
During the Civil War, Carrollton was the site of a major battle between Union and Confederate forces. The Battle of Carrollton was fought on June 26, 1862 and resulted in a Confederate victory.
In the late 19th century, Carrollton was a major center for the production of tobacco. The town was home to several tobacco warehouses and factories. The tobacco industry declined in the early 20th century, and the town’s economy shifted to other industries such as lumber and shipbuilding.
Geography
Carrollton is located in Isle of Wight County, Virginia. The town is situated on the south bank of the James River, approximately 25 miles south of the state capital of Richmond. The town is surrounded by rural farmland and is located near the cities of Suffolk and Smithfield.
The town has a total area of 1.2 square miles, all of which is land. The terrain is mostly flat, with some rolling hills. The climate is humid subtropical, with hot, humid summers and mild winters.
Economy
The economy of Carrollton is largely based on agriculture and tourism. The town is home to several farms, which produce a variety of crops including corn, soybeans, wheat, and tobacco. The town is also home to several wineries, which attract tourists from around the region.
In addition, Carrollton is home to several small businesses, including restaurants, shops, and services. The town is also home to a small industrial park, which houses several manufacturing companies.
Demographics
As of the 2010 census, Carrollton had a population of 1,000 people. The racial makeup of the town was 87.2% White, 8.2% African American, 0.7% Native American, 0.7% Asian, and 2.2% from other races. Hispanic or Latino of any race were 2.2% of the population.
The median household income in Carrollton was $45,000, and the median family income was $50,000. The per capita income was $20,000. About 10.2% of families and 12.2% of the population were below the poverty line.
Common Questions
What is Per Capita Income in Carrollton?
Per Capita income in Carrollton is $49,983.
What is the Median Family Income in Carrollton?
Median Family Income in Carrollton is $123,750.
What is the Median Household income in Carrollton?
Median Household Income in Carrollton is $108,953.
What is Income or Wage Gap in Carrollton?
Income or Wage Gap in Carrollton is 6.8%.
Women in Carrollton earn 93.2 cents for every dollar earned by a man.
What is Inequality or Gini Index in Carrollton?
Inequality or Gini Index in Carrollton is 0.39.
What is the Total Population of Carrollton?
Total Population of Carrollton is 7,330.
What is the Total Male Population of Carrollton?
Total Male Population of Carrollton is 4,117.
What is the Total Female Population of Carrollton?
Total Female Population of Carrollton is 3,213.
What is the Ratio of Males per 100 Females in Carrollton?
There are 128.14 Males per 100 Females in Carrollton.
What is the Ratio of Females per 100 Males in Carrollton?
There are 78.04 Females per 100 Males in Carrollton.
What is the Median Population Age in Carrollton?
Median Population Age in Carrollton is 37.4 Years.
What is the Average Family Size in Carrollton
Average Family Size in Carrollton is 3.2 People.
What is the Average Household Size in Carrollton
Average Household Size in Carrollton is 2.7 People.
How Large is the Labor Force in Carrollton?
There are 4,150 People in the Labor Forcein in Carrollton.
What is the Percentage of People in the Labor Force in Carrollton?
72.7% of People are in the Labor Force in Carrollton.
What is the Unemployment Rate in Carrollton?
Unemployment Rate in Carrollton is 11.8%.