Bristol, NH Map & Demographics
Bristol Map
Bristol Overview
$28,260
PER CAPITA INCOME
$78,152
AVG FAMILY INCOME
$69,306
AVG HOUSEHOLD INCOME
67.0%
WAGE / INCOME GAP [ % ]
33.0¢/ $1
WAGE / INCOME GAP [ $ ]
0.35
INEQUALITY / GINI INDEX
2,095
TOTAL POPULATION
1,010
MALE POPULATION
1,085
FEMALE POPULATION
93.09
MALES / 100 FEMALES
107.43
FEMALES / 100 MALES
39.4
MEDIAN AGE
3.2
AVG FAMILY SIZE
2.7
AVG HOUSEHOLD SIZE
1,048
LABOR FORCE [ PEOPLE ]
65.2%
PERCENT IN LABOR FORCE
2.0%
UNEMPLOYMENT RATE
Bristol Zip Codes
Bristol Area Codes
Income in Bristol
Income Overview in Bristol
Per Capita Income in Bristol is $28,260, while median incomes of families and households are $78,152 and $69,306 respectively.
| Characteristic | Number | Measure |
| Per Capita Income | 2,095 | $28,260 |
| Median Family Income | 540 | $78,152 |
| Mean Family Income | 540 | $76,157 |
| Median Household Income | 775 | $69,306 |
| Mean Household Income | 775 | $66,977 |
| Income Deficit | 540 | $0 |
| Wage / Income Gap (%) | 2,095 | 67.00% |
| Wage / Income Gap ($) | 2,095 | 33.00¢ per $1 |
| Gini / Inequality Index | 2,095 | 0.35 |
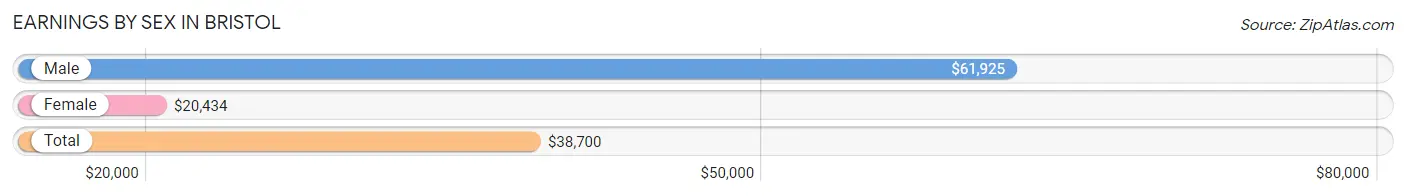
Earnings by Sex in Bristol
Average Earnings in Bristol are $38,700, $61,925 for men and $20,434 for women, a difference of 67.0%.
| Sex | Number | Average Earnings |
| Male | 549 (52.4%) | $61,925 |
| Female | 499 (47.6%) | $20,434 |
| Total | 1,048 (100.0%) | $38,700 |
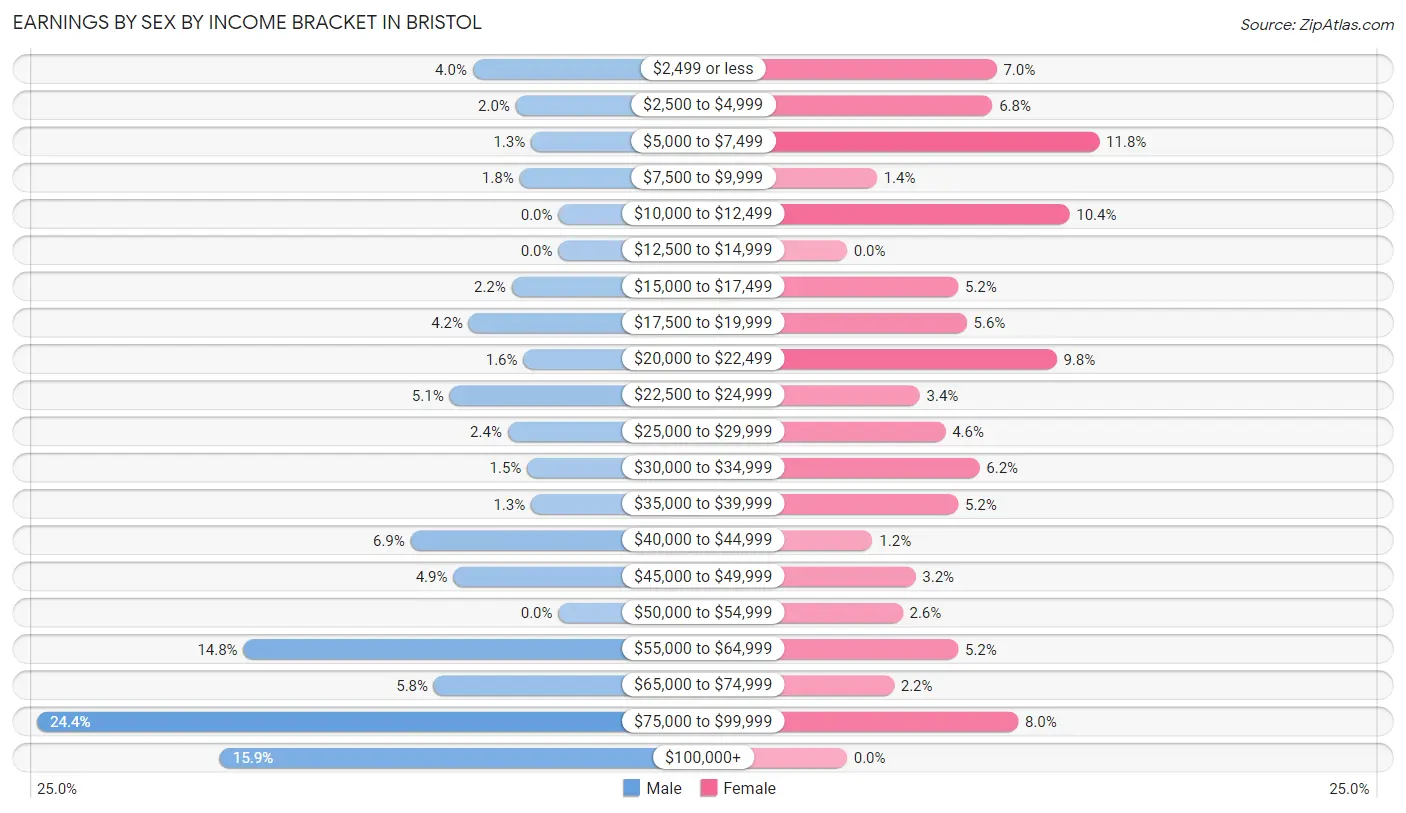
Earnings by Sex by Income Bracket in Bristol
The most common earnings brackets in Bristol are $75,000 to $99,999 for men (134 | 24.4%) and $5,000 to $7,499 for women (59 | 11.8%).
| Income | Male | Female |
| $2,499 or less | 22 (4.0%) | 35 (7.0%) |
| $2,500 to $4,999 | 11 (2.0%) | 34 (6.8%) |
| $5,000 to $7,499 | 7 (1.3%) | 59 (11.8%) |
| $7,500 to $9,999 | 10 (1.8%) | 7 (1.4%) |
| $10,000 to $12,499 | 0 (0.0%) | 52 (10.4%) |
| $12,500 to $14,999 | 0 (0.0%) | 0 (0.0%) |
| $15,000 to $17,499 | 12 (2.2%) | 26 (5.2%) |
| $17,500 to $19,999 | 23 (4.2%) | 28 (5.6%) |
| $20,000 to $22,499 | 9 (1.6%) | 49 (9.8%) |
| $22,500 to $24,999 | 28 (5.1%) | 17 (3.4%) |
| $25,000 to $29,999 | 13 (2.4%) | 23 (4.6%) |
| $30,000 to $34,999 | 8 (1.5%) | 31 (6.2%) |
| $35,000 to $39,999 | 7 (1.3%) | 26 (5.2%) |
| $40,000 to $44,999 | 38 (6.9%) | 6 (1.2%) |
| $45,000 to $49,999 | 27 (4.9%) | 16 (3.2%) |
| $50,000 to $54,999 | 0 (0.0%) | 13 (2.6%) |
| $55,000 to $64,999 | 81 (14.7%) | 26 (5.2%) |
| $65,000 to $74,999 | 32 (5.8%) | 11 (2.2%) |
| $75,000 to $99,999 | 134 (24.4%) | 40 (8.0%) |
| $100,000+ | 87 (15.9%) | 0 (0.0%) |
| Total | 549 (100.0%) | 499 (100.0%) |
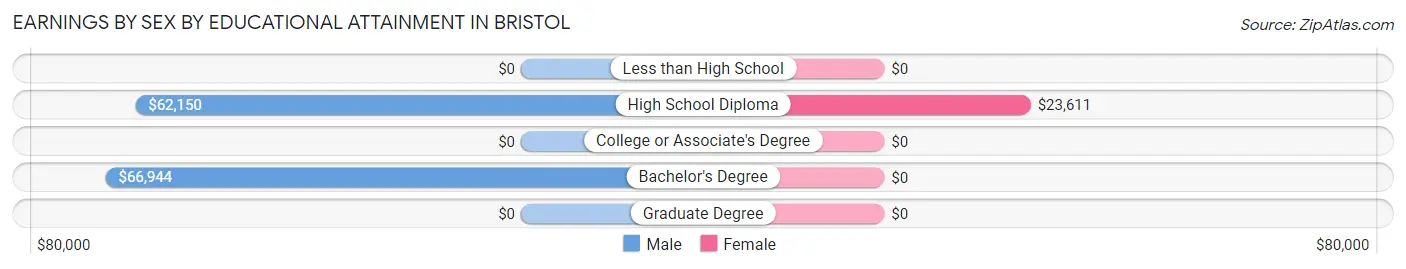
Earnings by Sex by Educational Attainment in Bristol
Average earnings in Bristol are $64,750 for men and $22,941 for women, a difference of 64.6%. Men with an educational attainment of bachelor's degree enjoy the highest average annual earnings of $66,944, while those with high school diploma education earn the least with $62,150. Women with an educational attainment of high school diploma earn the most with the average annual earnings of $23,611, while those with high school diploma education have the smallest earnings of $23,611.
| Educational Attainment | Male Income | Female Income |
| Less than High School | - | - |
| High School Diploma | $62,150 | $23,611 |
| College or Associate's Degree | - | - |
| Bachelor's Degree | $66,944 | $0 |
| Graduate Degree | - | - |
| Total | $64,750 | $22,941 |
Family Income in Bristol
Family Income Brackets in Bristol
According to the Bristol family income data, there are 144 families falling into the $75,000 to $99,999 income range, which is the most common income bracket and makes up 26.7% of all families.
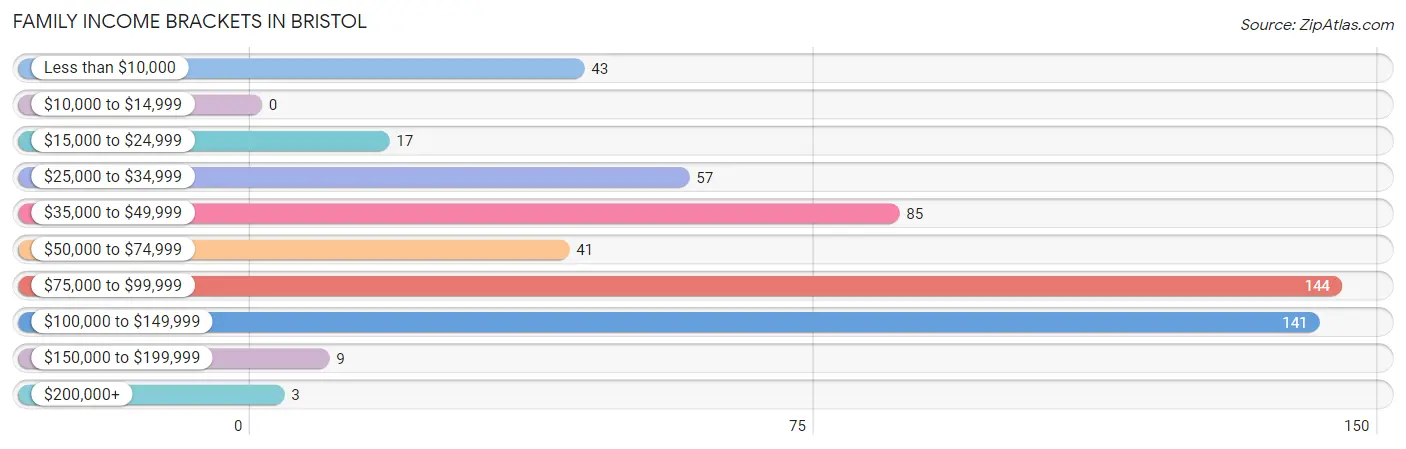
| Income Bracket | # Families | % Families |
| Less than $10,000 | 43 | 8.0% |
| $10,000 to $14,999 | 0 | 0.0% |
| $15,000 to $24,999 | 17 | 3.1% |
| $25,000 to $34,999 | 57 | 10.6% |
| $35,000 to $49,999 | 85 | 15.7% |
| $50,000 to $74,999 | 41 | 7.6% |
| $75,000 to $99,999 | 144 | 26.7% |
| $100,000 to $149,999 | 141 | 26.1% |
| $150,000 to $199,999 | 9 | 1.7% |
| $200,000+ | 3 | 0.6% |
Family Income by Famaliy Size in Bristol
4-person families (123 | 22.8%) account for the highest median family income in Bristol with $120,069 per family, while 2-person families (238 | 44.1%) have the highest median income of $37,143 per family member.
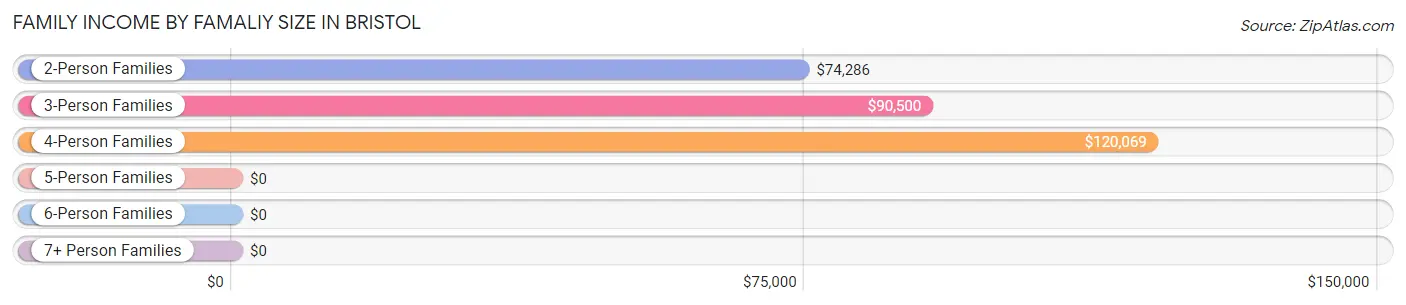
| Income Bracket | # Families | Median Income |
| 2-Person Families | 238 (44.1%) | $74,286 |
| 3-Person Families | 136 (25.2%) | $90,500 |
| 4-Person Families | 123 (22.8%) | $120,069 |
| 5-Person Families | 34 (6.3%) | $0 |
| 6-Person Families | 9 (1.7%) | $0 |
| 7+ Person Families | 0 (0.0%) | $0 |
| Total | 540 (100.0%) | $78,152 |
Family Income by Number of Earners in Bristol
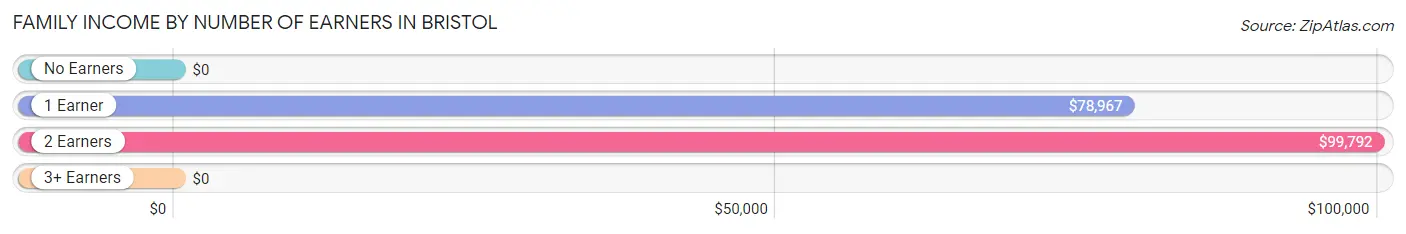
| Number of Earners | # Families | Median Income |
| No Earners | 53 (9.8%) | $0 |
| 1 Earner | 221 (40.9%) | $78,967 |
| 2 Earners | 254 (47.0%) | $99,792 |
| 3+ Earners | 12 (2.2%) | $0 |
| Total | 540 (100.0%) | $78,152 |
Household Income in Bristol
Household Income Brackets in Bristol
With 216 households falling in the category, the $75,000 to $99,999 income range is the most frequent in Bristol, accounting for 27.9% of all households. In contrast, only 3 households (0.4%) fall into the $200,000+ income bracket, making it the least populous group.
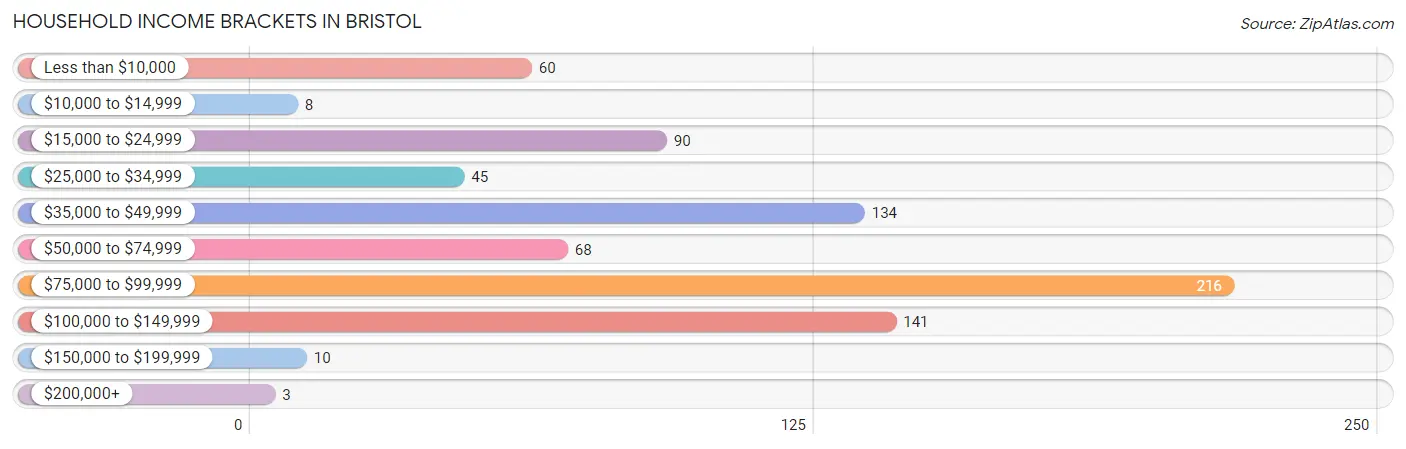
| Income Bracket | # Households | % Households |
| Less than $10,000 | 60 | 7.7% |
| $10,000 to $14,999 | 8 | 1.0% |
| $15,000 to $24,999 | 90 | 11.6% |
| $25,000 to $34,999 | 45 | 5.8% |
| $35,000 to $49,999 | 134 | 17.3% |
| $50,000 to $74,999 | 68 | 8.8% |
| $75,000 to $99,999 | 216 | 27.9% |
| $100,000 to $149,999 | 141 | 18.2% |
| $150,000 to $199,999 | 10 | 1.3% |
| $200,000+ | 3 | 0.4% |
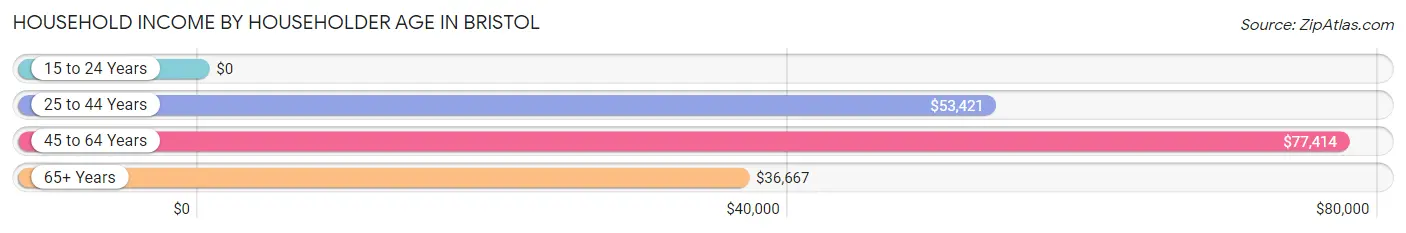
Household Income by Householder Age in Bristol
The median household income in Bristol is $69,306, with the highest median household income of $77,414 found in the 45 to 64 years age bracket for the primary householder. A total of 336 households (43.3%) fall into this category. Meanwhile, the 15 to 24 years age bracket for the primary householder has the lowest median household income of $0, with 9 households (1.2%) in this group.
| Income Bracket | # Households | Median Income |
| 15 to 24 Years | 9 (1.2%) | $0 |
| 25 to 44 Years | 272 (35.1%) | $53,421 |
| 45 to 64 Years | 336 (43.3%) | $77,414 |
| 65+ Years | 158 (20.4%) | $36,667 |
| Total | 775 (100.0%) | $69,306 |
Poverty in Bristol
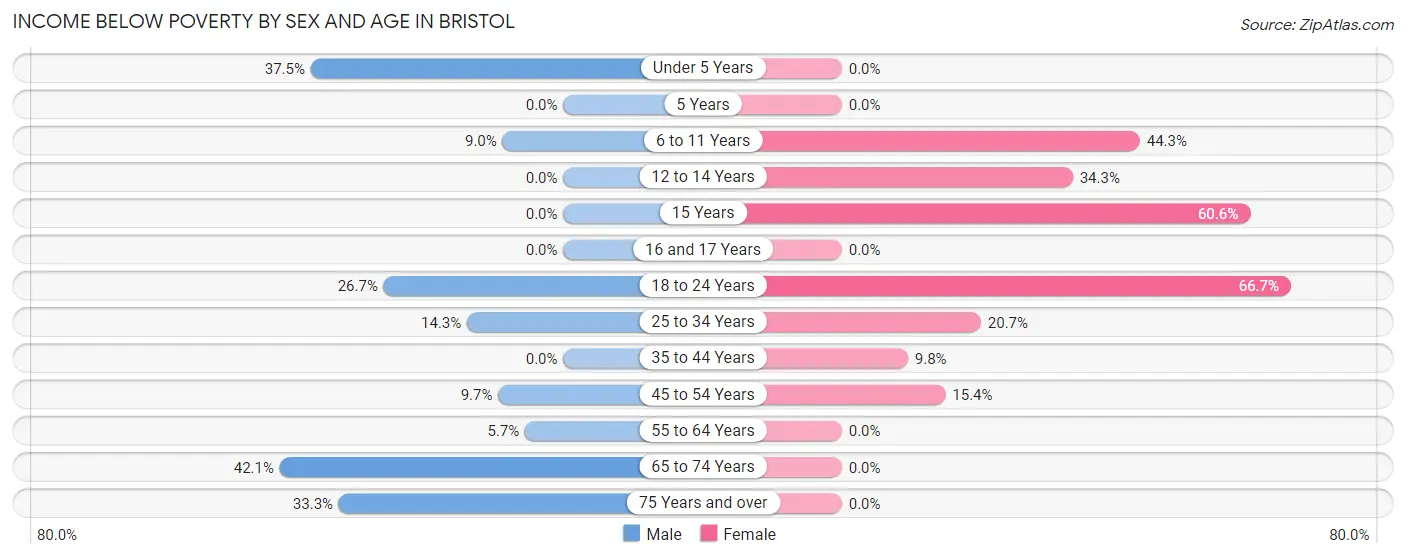
Income Below Poverty by Sex and Age in Bristol
With 10.3% poverty level for males and 18.2% for females among the residents of Bristol, 65 to 74 year old males and 18 to 24 year old females are the most vulnerable to poverty, with 8 males (42.1%) and 58 females (66.7%) in their respective age groups living below the poverty level.
| Age Bracket | Male | Female |
| Under 5 Years | 24 (37.5%) | 0 (0.0%) |
| 5 Years | 0 (0.0%) | 0 (0.0%) |
| 6 to 11 Years | 11 (9.0%) | 50 (44.3%) |
| 12 to 14 Years | 0 (0.0%) | 12 (34.3%) |
| 15 Years | 0 (0.0%) | 20 (60.6%) |
| 16 and 17 Years | 0 (0.0%) | 0 (0.0%) |
| 18 to 24 Years | 12 (26.7%) | 58 (66.7%) |
| 25 to 34 Years | 11 (14.3%) | 19 (20.6%) |
| 35 to 44 Years | 0 (0.0%) | 21 (9.8%) |
| 45 to 54 Years | 20 (9.7%) | 18 (15.4%) |
| 55 to 64 Years | 10 (5.7%) | 0 (0.0%) |
| 65 to 74 Years | 8 (42.1%) | 0 (0.0%) |
| 75 Years and over | 8 (33.3%) | 0 (0.0%) |
| Total | 104 (10.3%) | 198 (18.2%) |
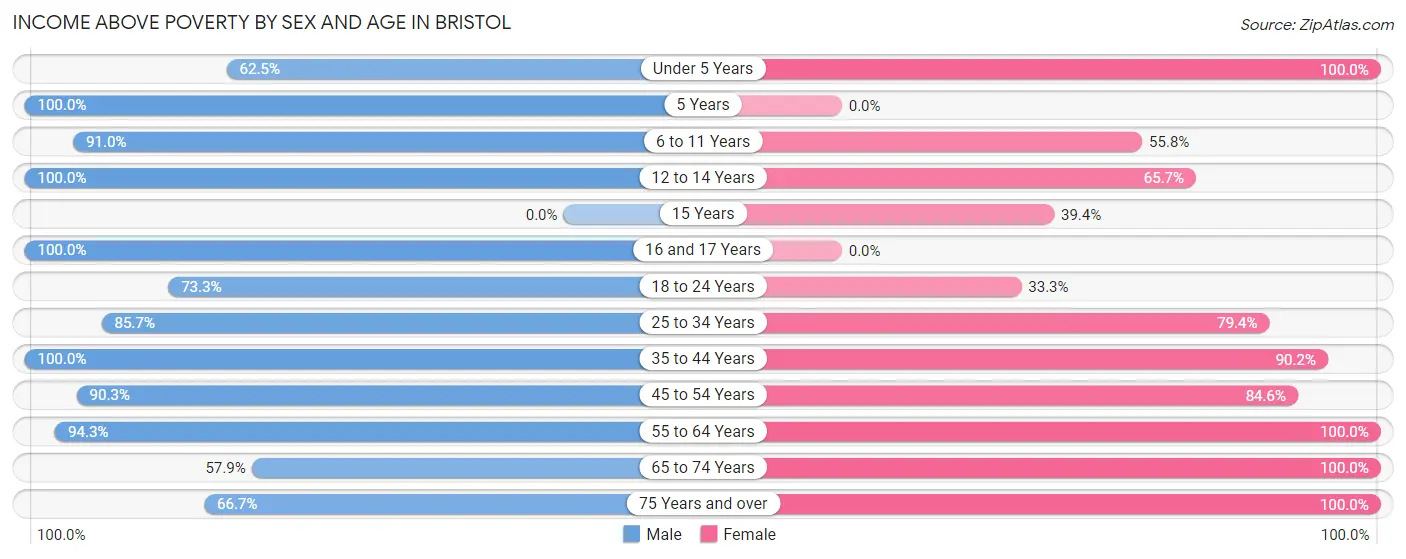
Income Above Poverty by Sex and Age in Bristol
According to the poverty statistics in Bristol, males aged 5 years and females aged under 5 years are the age groups that are most secure financially, with 100.0% of males and 100.0% of females in these age groups living above the poverty line.
| Age Bracket | Male | Female |
| Under 5 Years | 40 (62.5%) | 73 (100.0%) |
| 5 Years | 39 (100.0%) | 0 (0.0%) |
| 6 to 11 Years | 111 (91.0%) | 63 (55.7%) |
| 12 to 14 Years | 9 (100.0%) | 23 (65.7%) |
| 15 Years | 0 (0.0%) | 13 (39.4%) |
| 16 and 17 Years | 79 (100.0%) | 0 (0.0%) |
| 18 to 24 Years | 33 (73.3%) | 29 (33.3%) |
| 25 to 34 Years | 66 (85.7%) | 73 (79.3%) |
| 35 to 44 Years | 147 (100.0%) | 193 (90.2%) |
| 45 to 54 Years | 187 (90.3%) | 99 (84.6%) |
| 55 to 64 Years | 166 (94.3%) | 93 (100.0%) |
| 65 to 74 Years | 11 (57.9%) | 77 (100.0%) |
| 75 Years and over | 16 (66.7%) | 151 (100.0%) |
| Total | 904 (89.7%) | 887 (81.8%) |
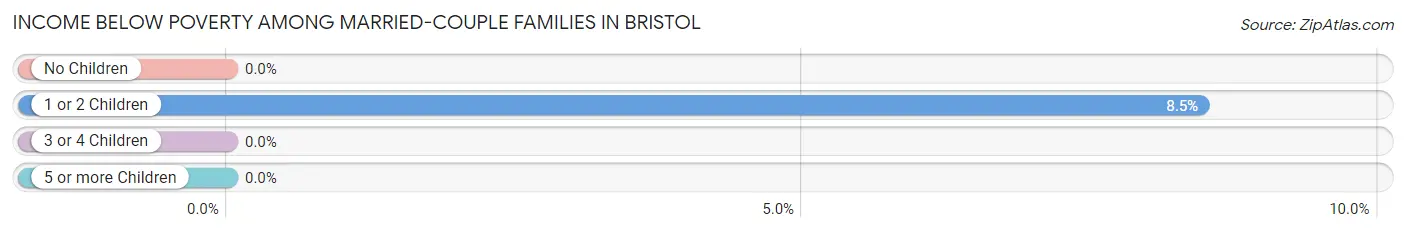
Income Below Poverty Among Married-Couple Families in Bristol
The poverty statistics for married-couple families in Bristol show that 3.3% or 11 of the total 331 families live below the poverty line. Families with 1 or 2 children have the highest poverty rate of 8.5%, comprising of 11 families. On the other hand, families with no children have the lowest poverty rate of 0.0%, which includes 0 families.
| Children | Above Poverty | Below Poverty |
| No Children | 158 (100.0%) | 0 (0.0%) |
| 1 or 2 Children | 119 (91.5%) | 11 (8.5%) |
| 3 or 4 Children | 43 (100.0%) | 0 (0.0%) |
| 5 or more Children | 0 (0.0%) | 0 (0.0%) |
| Total | 320 (96.7%) | 11 (3.3%) |
Income Below Poverty Among Single-Parent Households in Bristol
According to the poverty data in Bristol, 25.6% or 11 single-father households and 24.1% or 40 single-mother households are living below the poverty line. Among single-father households, those with 1 or 2 children have the highest poverty rate, with 11 households (55.0%) experiencing poverty. Likewise, among single-mother households, those with 1 or 2 children have the highest poverty rate, with 40 households (41.7%) falling below the poverty line.
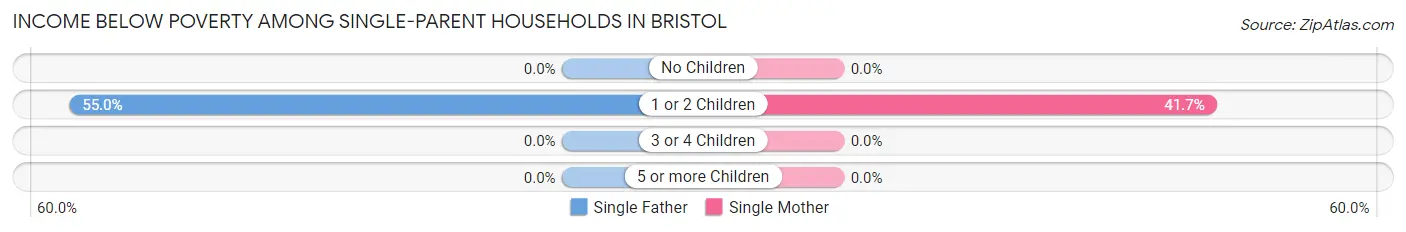
| Children | Single Father | Single Mother |
| No Children | 0 (0.0%) | 0 (0.0%) |
| 1 or 2 Children | 11 (55.0%) | 40 (41.7%) |
| 3 or 4 Children | 0 (0.0%) | 0 (0.0%) |
| 5 or more Children | 0 (0.0%) | 0 (0.0%) |
| Total | 11 (25.6%) | 40 (24.1%) |
Income Below Poverty Among Married-Couple vs Single-Parent Households in Bristol
The poverty data for Bristol shows that 11 of the married-couple family households (3.3%) and 51 of the single-parent households (24.4%) are living below the poverty level. Within the married-couple family households, those with 1 or 2 children have the highest poverty rate, with 11 households (8.5%) falling below the poverty line. Among the single-parent households, those with 1 or 2 children have the highest poverty rate, with 51 household (44.0%) living below poverty.
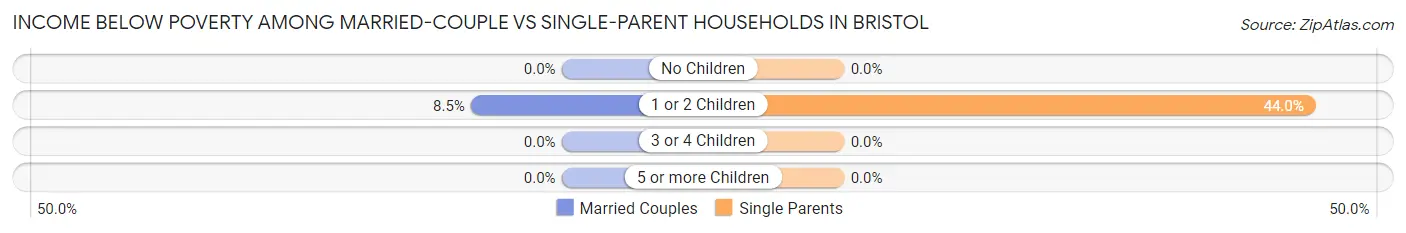
| Children | Married-Couple Families | Single-Parent Households |
| No Children | 0 (0.0%) | 0 (0.0%) |
| 1 or 2 Children | 11 (8.5%) | 51 (44.0%) |
| 3 or 4 Children | 0 (0.0%) | 0 (0.0%) |
| 5 or more Children | 0 (0.0%) | 0 (0.0%) |
| Total | 11 (3.3%) | 51 (24.4%) |
Race in Bristol
The most populous races in Bristol are White / Caucasian (1,811 | 86.4%), Two or more Races (167 | 8.0%), and Asian (93 | 4.4%).
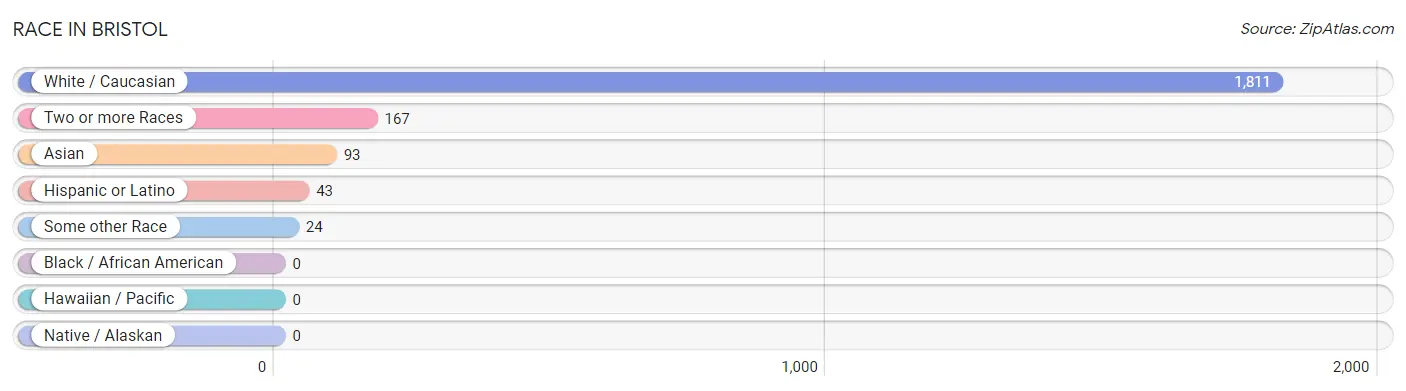
| Race | # Population | % Population |
| Asian | 93 | 4.4% |
| Black / African American | 0 | 0.0% |
| Hawaiian / Pacific | 0 | 0.0% |
| Hispanic or Latino | 43 | 2.1% |
| Native / Alaskan | 0 | 0.0% |
| White / Caucasian | 1,811 | 86.4% |
| Two or more Races | 167 | 8.0% |
| Some other Race | 24 | 1.1% |
| Total | 2,095 | 100.0% |
Ancestry in Bristol
The most populous ancestries reported in Bristol are Irish (520 | 24.8%), English (453 | 21.6%), French (306 | 14.6%), French Canadian (133 | 6.4%), and Italian (127 | 6.1%), together accounting for 73.5% of all Bristol residents.
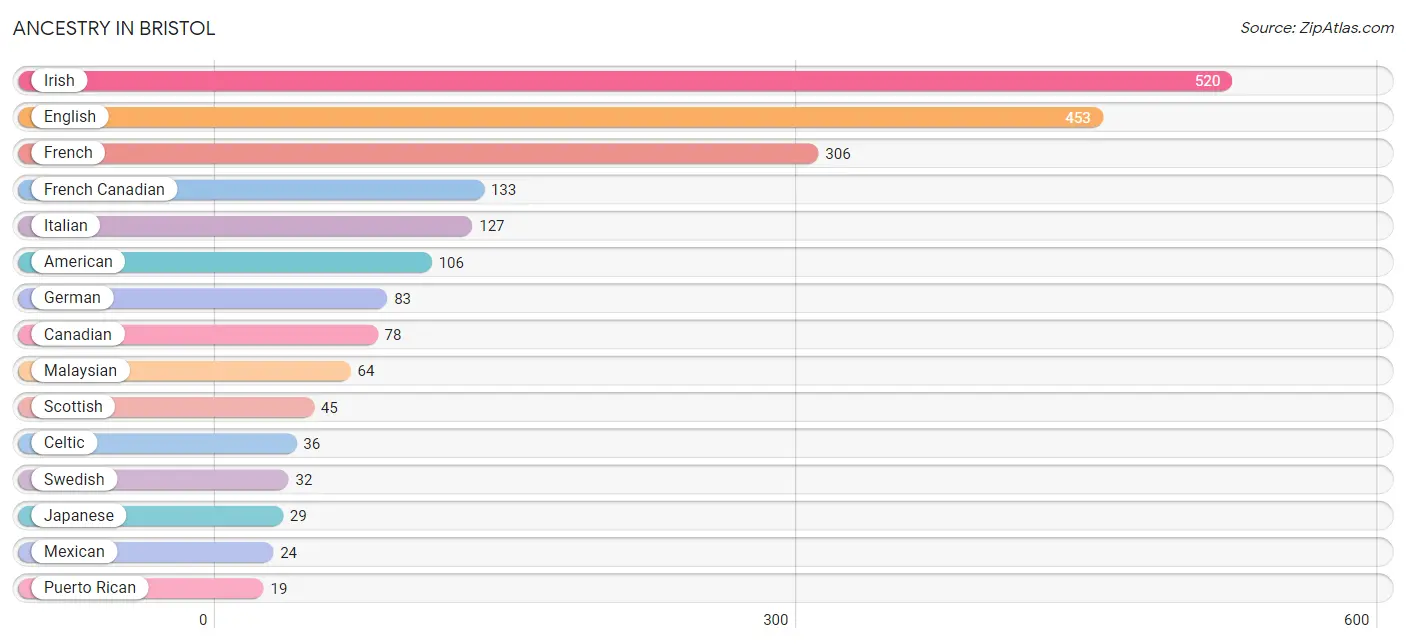
| Ancestry | # Population | % Population |
| American | 106 | 5.1% |
| Canadian | 78 | 3.7% |
| Celtic | 36 | 1.7% |
| English | 453 | 21.6% |
| French | 306 | 14.6% |
| French Canadian | 133 | 6.4% |
| German | 83 | 4.0% |
| Irish | 520 | 24.8% |
| Italian | 127 | 6.1% |
| Japanese | 29 | 1.4% |
| Lithuanian | 10 | 0.5% |
| Malaysian | 64 | 3.0% |
| Mexican | 24 | 1.1% |
| Norwegian | 9 | 0.4% |
| Polish | 14 | 0.7% |
| Portuguese | 16 | 0.8% |
| Puerto Rican | 19 | 0.9% |
| Scotch-Irish | 9 | 0.4% |
| Scottish | 45 | 2.1% |
| Swedish | 32 | 1.5% |
| Swiss | 7 | 0.3% |
| Welsh | 18 | 0.9% | View All 22 Rows |
Immigrants in Bristol
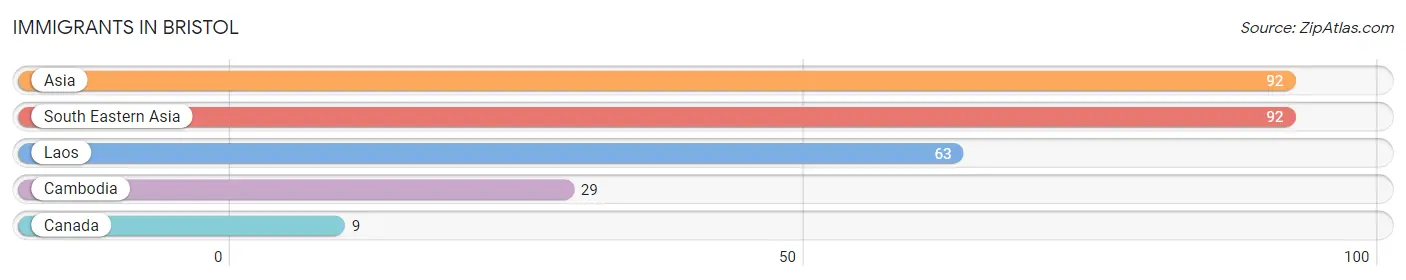
The most numerous immigrant groups reported in Bristol came from Asia (92 | 4.4%), South Eastern Asia (92 | 4.4%), Laos (63 | 3.0%), Cambodia (29 | 1.4%), and Canada (9 | 0.4%), together accounting for 13.6% of all Bristol residents.
| Immigration Origin | # Population | % Population |
| Asia | 92 | 4.4% |
| Cambodia | 29 | 1.4% |
| Canada | 9 | 0.4% |
| Laos | 63 | 3.0% |
| South Eastern Asia | 92 | 4.4% | View All 5 Rows |
Sex and Age in Bristol
Sex and Age in Bristol
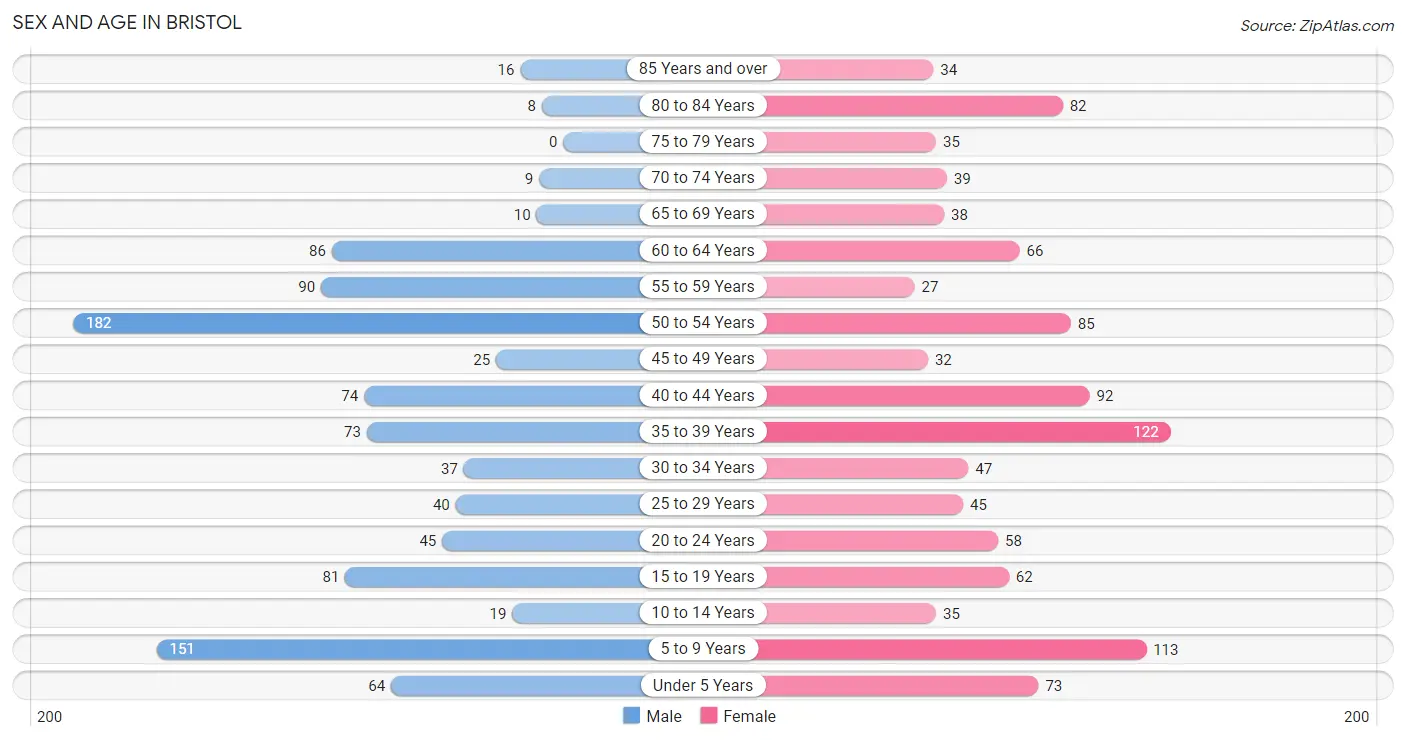
The most populous age groups in Bristol are 50 to 54 Years (182 | 18.0%) for men and 35 to 39 Years (122 | 11.2%) for women.
| Age Bracket | Male | Female |
| Under 5 Years | 64 (6.3%) | 73 (6.7%) |
| 5 to 9 Years | 151 (14.9%) | 113 (10.4%) |
| 10 to 14 Years | 19 (1.9%) | 35 (3.2%) |
| 15 to 19 Years | 81 (8.0%) | 62 (5.7%) |
| 20 to 24 Years | 45 (4.5%) | 58 (5.3%) |
| 25 to 29 Years | 40 (4.0%) | 45 (4.2%) |
| 30 to 34 Years | 37 (3.7%) | 47 (4.3%) |
| 35 to 39 Years | 73 (7.2%) | 122 (11.2%) |
| 40 to 44 Years | 74 (7.3%) | 92 (8.5%) |
| 45 to 49 Years | 25 (2.5%) | 32 (2.9%) |
| 50 to 54 Years | 182 (18.0%) | 85 (7.8%) |
| 55 to 59 Years | 90 (8.9%) | 27 (2.5%) |
| 60 to 64 Years | 86 (8.5%) | 66 (6.1%) |
| 65 to 69 Years | 10 (1.0%) | 38 (3.5%) |
| 70 to 74 Years | 9 (0.9%) | 39 (3.6%) |
| 75 to 79 Years | 0 (0.0%) | 35 (3.2%) |
| 80 to 84 Years | 8 (0.8%) | 82 (7.6%) |
| 85 Years and over | 16 (1.6%) | 34 (3.1%) |
| Total | 1,010 (100.0%) | 1,085 (100.0%) |
Families and Households in Bristol
Median Family Size in Bristol
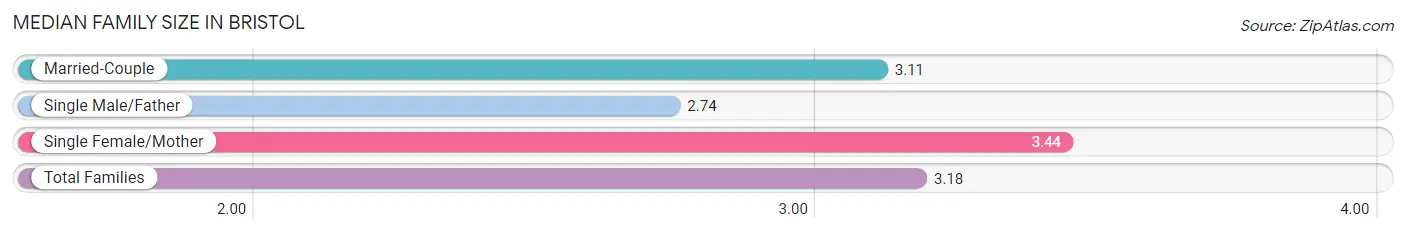
The median family size in Bristol is 3.18 persons per family, with single female/mother families (166 | 30.7%) accounting for the largest median family size of 3.44 persons per family. On the other hand, single male/father families (43 | 8.0%) represent the smallest median family size with 2.74 persons per family.
| Family Type | # Families | Family Size |
| Married-Couple | 331 (61.3%) | 3.11 |
| Single Male/Father | 43 (8.0%) | 2.74 |
| Single Female/Mother | 166 (30.7%) | 3.44 |
| Total Families | 540 (100.0%) | 3.18 |
Median Household Size in Bristol
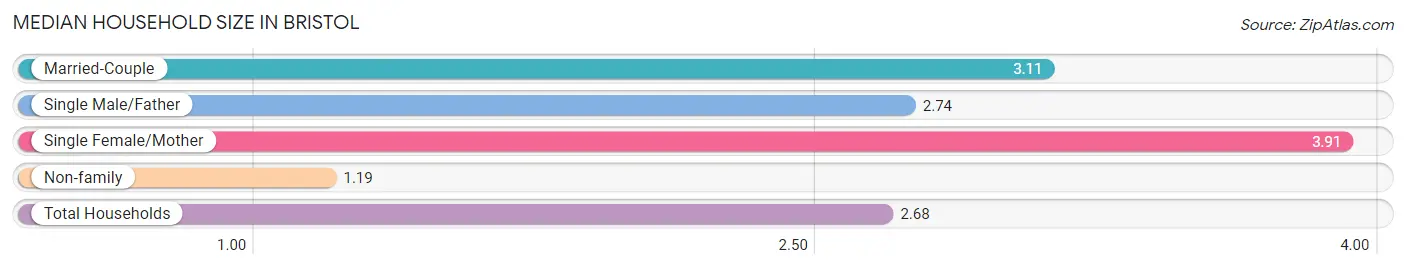
The median household size in Bristol is 2.68 persons per household, with single female/mother households (166 | 21.4%) accounting for the largest median household size of 3.91 persons per household. non-family households (235 | 30.3%) represent the smallest median household size with 1.19 persons per household.
| Household Type | # Households | Household Size |
| Married-Couple | 331 (42.7%) | 3.11 |
| Single Male/Father | 43 (5.6%) | 2.74 |
| Single Female/Mother | 166 (21.4%) | 3.91 |
| Non-family | 235 (30.3%) | 1.19 |
| Total Households | 775 (100.0%) | 2.68 |
Household Size by Marriage Status in Bristol
Out of a total of 775 households in Bristol, 540 (69.7%) are family households, while 235 (30.3%) are nonfamily households. The most numerous type of family households are 2-person households, comprising 238, and the most common type of nonfamily households are 1-person households, comprising 197.
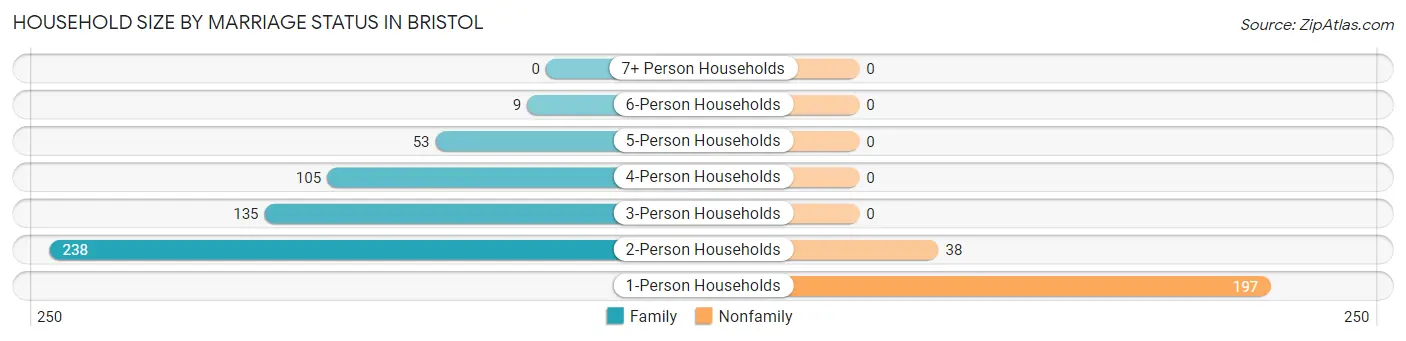
| Household Size | Family Households | Nonfamily Households |
| 1-Person Households | - | 197 (25.4%) |
| 2-Person Households | 238 (30.7%) | 38 (4.9%) |
| 3-Person Households | 135 (17.4%) | 0 (0.0%) |
| 4-Person Households | 105 (13.6%) | 0 (0.0%) |
| 5-Person Households | 53 (6.8%) | 0 (0.0%) |
| 6-Person Households | 9 (1.2%) | 0 (0.0%) |
| 7+ Person Households | 0 (0.0%) | 0 (0.0%) |
| Total | 540 (69.7%) | 235 (30.3%) |
Female Fertility in Bristol
Fertility by Age in Bristol
| Age Bracket | Women with Births | Births / 1,000 Women |
| 15 to 19 years | 0 (0.0%) | 0.0 |
| 20 to 34 years | 0 (0.0%) | 0.0 |
| 35 to 50 years | 0 (0.0%) | 0.0 |
| Total | 0 (0.0%) | 0.0 |
Fertility by Age by Marriage Status in Bristol
| Age Bracket | Married | Unmarried |
| 15 to 19 years | 0 (0.0%) | 0 (0.0%) |
| 20 to 34 years | 0 (0.0%) | 0 (0.0%) |
| 35 to 50 years | 0 (0.0%) | 0 (0.0%) |
| Total | 0 (0.0%) | 0 (0.0%) |
Fertility by Education in Bristol
| Educational Attainment | Women with Births | Births / 1,000 Women |
| Less than High School | 0 (0.0%) | 0.0 |
| High School Diploma | 0 (0.0%) | 0.0 |
| College or Associate's Degree | 0 (0.0%) | 0.0 |
| Bachelor's Degree | 0 (0.0%) | 0.0 |
| Graduate Degree | 0 (0.0%) | 0.0 |
| Total | 0 (0.0%) | 0.0 |
Fertility by Education by Marriage Status in Bristol
| Educational Attainment | Married | Unmarried |
| Less than High School | 0 (0.0%) | 0 (0.0%) |
| High School Diploma | 0 (0.0%) | 0 (0.0%) |
| College or Associate's Degree | 0 (0.0%) | 0 (0.0%) |
| Bachelor's Degree | 0 (0.0%) | 0 (0.0%) |
| Graduate Degree | 0 (0.0%) | 0 (0.0%) |
| Total | 0 (0.0%) | 0 (0.0%) |
Employment Characteristics in Bristol
Employment by Class of Employer in Bristol
Among the 1,026 employed individuals in Bristol, private company employees (588 | 57.3%), self-employed (not incorporated) (124 | 12.1%), and local government employees (116 | 11.3%) make up the most common classes of employment.
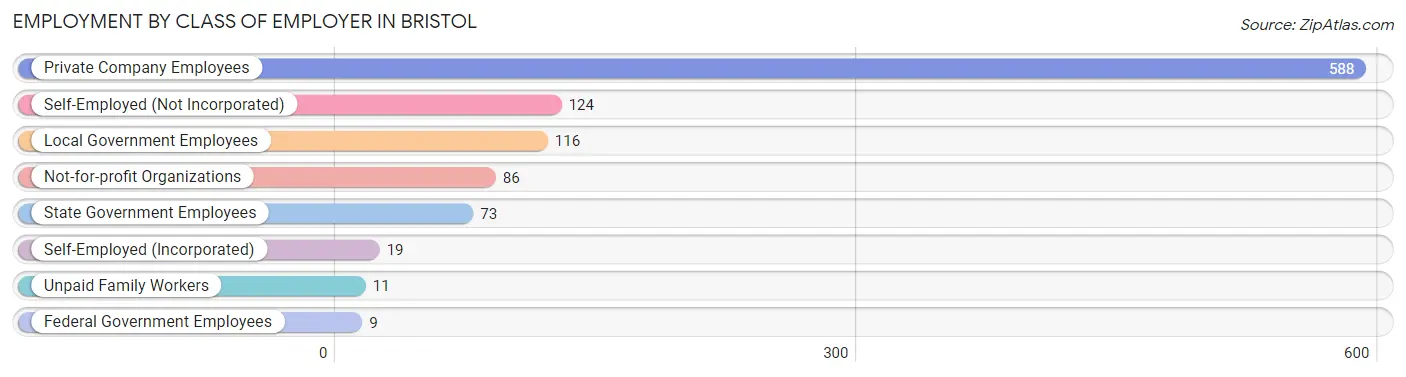
| Employer Class | # Employees | % Employees |
| Private Company Employees | 588 | 57.3% |
| Self-Employed (Incorporated) | 19 | 1.8% |
| Self-Employed (Not Incorporated) | 124 | 12.1% |
| Not-for-profit Organizations | 86 | 8.4% |
| Local Government Employees | 116 | 11.3% |
| State Government Employees | 73 | 7.1% |
| Federal Government Employees | 9 | 0.9% |
| Unpaid Family Workers | 11 | 1.1% |
| Total | 1,026 | 100.0% |
Employment Status by Age in Bristol
According to the labor force statistics for Bristol, out of the total population over 16 years of age (1,607), 65.2% or 1,048 individuals are in the labor force, with 2.0% or 21 of them unemployed. The age group with the highest labor force participation rate is 25 to 29 years, with 100.0% or 85 individuals in the labor force. Within the labor force, the 16 to 19 years age range has the highest percentage of unemployed individuals, with 23.1% or 12 of them being unemployed.
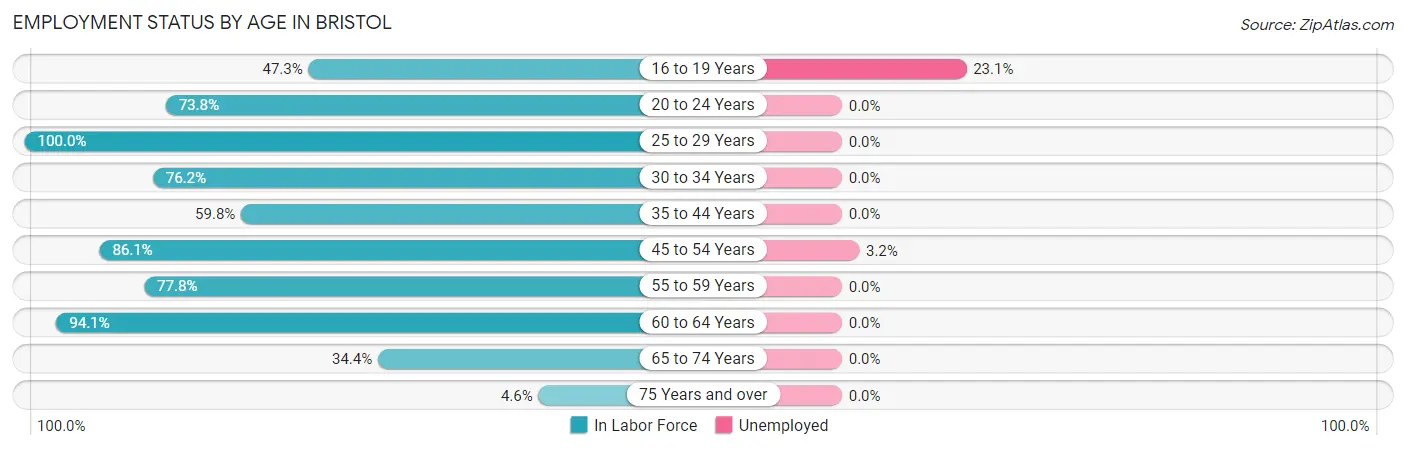
| Age Bracket | In Labor Force | Unemployed |
| 16 to 19 Years | 52 (47.3%) | 12 (23.1%) |
| 20 to 24 Years | 76 (73.8%) | 0 (0.0%) |
| 25 to 29 Years | 85 (100.0%) | 0 (0.0%) |
| 30 to 34 Years | 64 (76.2%) | 0 (0.0%) |
| 35 to 44 Years | 216 (59.8%) | 0 (0.0%) |
| 45 to 54 Years | 279 (86.1%) | 9 (3.2%) |
| 55 to 59 Years | 91 (77.8%) | 0 (0.0%) |
| 60 to 64 Years | 143 (94.1%) | 0 (0.0%) |
| 65 to 74 Years | 33 (34.4%) | 0 (0.0%) |
| 75 Years and over | 8 (4.6%) | 0 (0.0%) |
| Total | 1,048 (65.2%) | 21 (2.0%) |
Employment Status by Educational Attainment in Bristol
According to labor force statistics for Bristol, 78.2% of individuals (878) out of the total population between 25 and 64 years of age (1,123) are in the labor force, with 1.0% or 9 of them being unemployed. The group with the highest labor force participation rate are those with the educational attainment of bachelor's degree or higher, with 100.0% or 190 individuals in the labor force. Within the labor force, individuals with bachelor's degree or higher education have the highest percentage of unemployment, with 4.7% or 9 of them being unemployed.
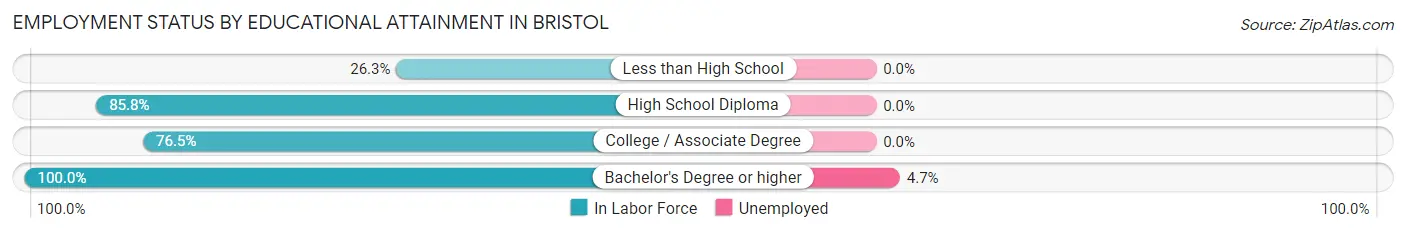
| Educational Attainment | In Labor Force | Unemployed |
| Less than High School | 35 (26.3%) | 0 (0.0%) |
| High School Diploma | 376 (85.8%) | 0 (0.0%) |
| College / Associate Degree | 277 (76.5%) | 0 (0.0%) |
| Bachelor's Degree or higher | 190 (100.0%) | 9 (4.7%) |
| Total | 878 (78.2%) | 11 (1.0%) |
Employment Occupations by Sex in Bristol
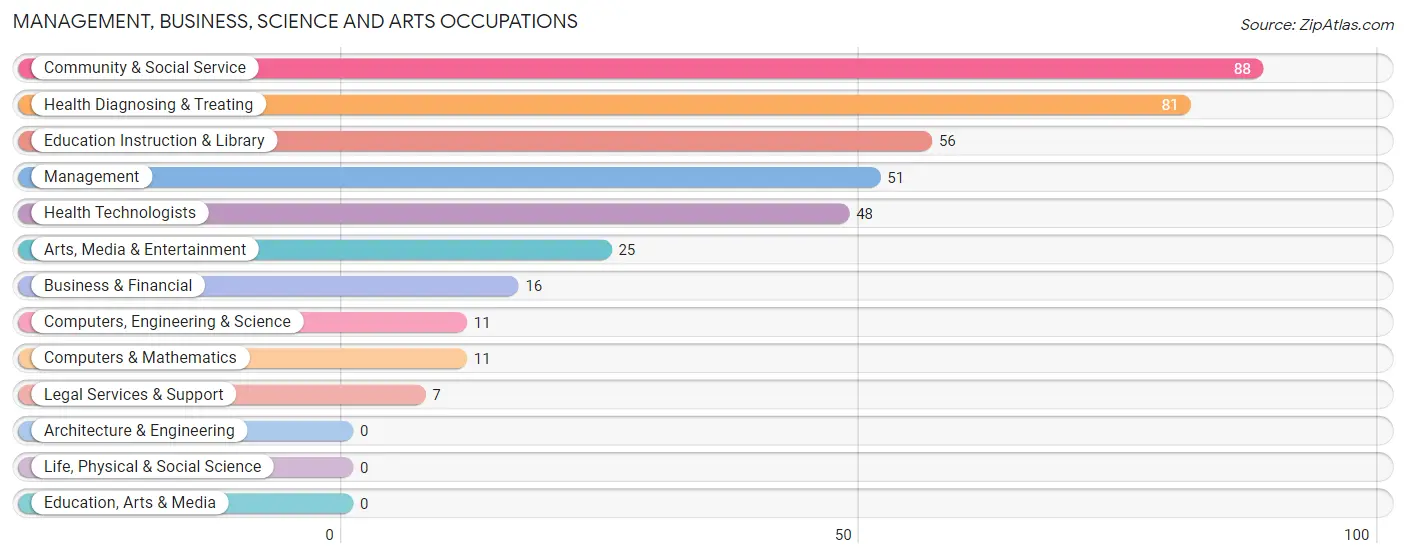
Management, Business, Science and Arts Occupations
The most common Management, Business, Science and Arts occupations in Bristol are Community & Social Service (88 | 8.6%), Health Diagnosing & Treating (81 | 7.9%), Education Instruction & Library (56 | 5.5%), Management (51 | 5.0%), and Health Technologists (48 | 4.7%).
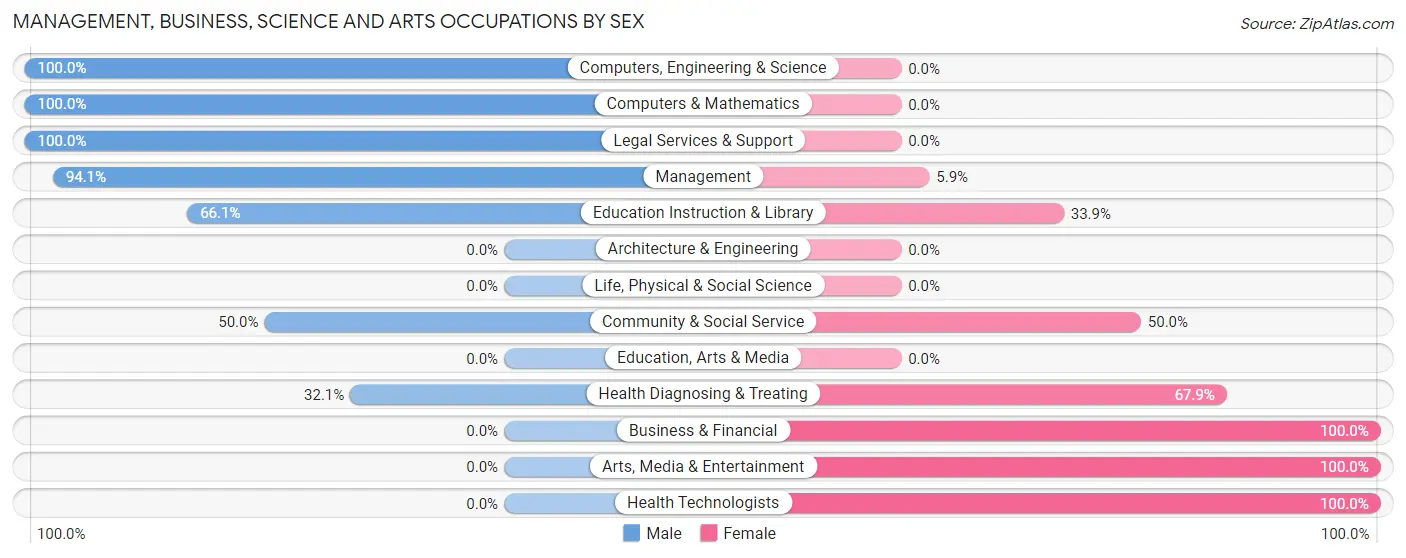
Management, Business, Science and Arts Occupations by Sex
Within the Management, Business, Science and Arts occupations in Bristol, the most male-oriented occupations are Computers, Engineering & Science (100.0%), Computers & Mathematics (100.0%), and Legal Services & Support (100.0%), while the most female-oriented occupations are Business & Financial (100.0%), Arts, Media & Entertainment (100.0%), and Health Technologists (100.0%).
| Occupation | Male | Female |
| Management | 48 (94.1%) | 3 (5.9%) |
| Business & Financial | 0 (0.0%) | 16 (100.0%) |
| Computers, Engineering & Science | 11 (100.0%) | 0 (0.0%) |
| Computers & Mathematics | 11 (100.0%) | 0 (0.0%) |
| Architecture & Engineering | 0 (0.0%) | 0 (0.0%) |
| Life, Physical & Social Science | 0 (0.0%) | 0 (0.0%) |
| Community & Social Service | 44 (50.0%) | 44 (50.0%) |
| Education, Arts & Media | 0 (0.0%) | 0 (0.0%) |
| Legal Services & Support | 7 (100.0%) | 0 (0.0%) |
| Education Instruction & Library | 37 (66.1%) | 19 (33.9%) |
| Arts, Media & Entertainment | 0 (0.0%) | 25 (100.0%) |
| Health Diagnosing & Treating | 26 (32.1%) | 55 (67.9%) |
| Health Technologists | 0 (0.0%) | 48 (100.0%) |
| Total (Category) | 129 (52.2%) | 118 (47.8%) |
| Total (Overall) | 537 (52.3%) | 489 (47.7%) |
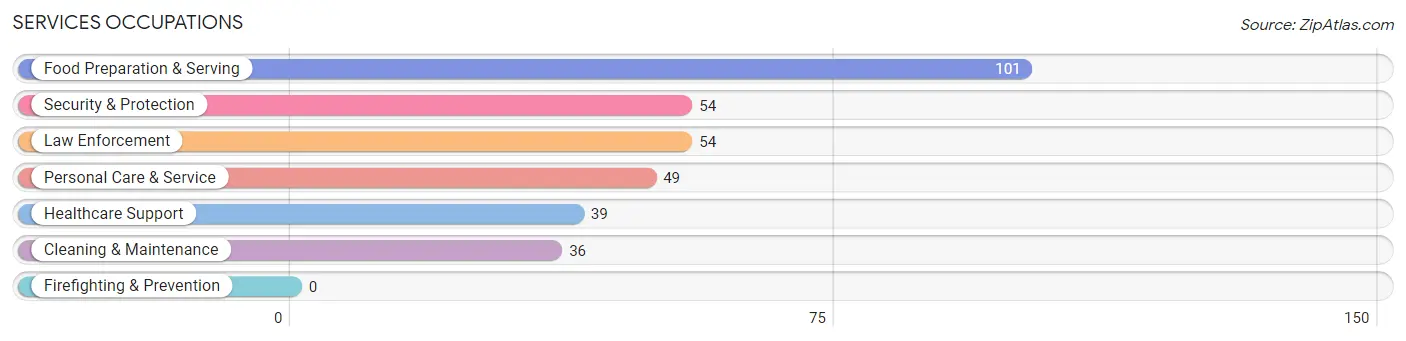
Services Occupations
The most common Services occupations in Bristol are Food Preparation & Serving (101 | 9.8%), Security & Protection (54 | 5.3%), Law Enforcement (54 | 5.3%), Personal Care & Service (49 | 4.8%), and Healthcare Support (39 | 3.8%).
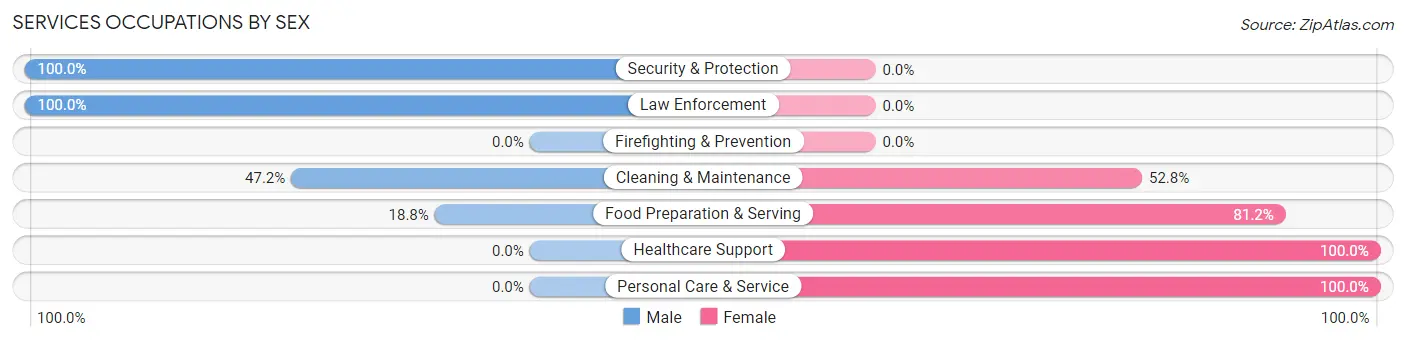
Services Occupations by Sex
Within the Services occupations in Bristol, the most male-oriented occupations are Security & Protection (100.0%), Law Enforcement (100.0%), and Cleaning & Maintenance (47.2%), while the most female-oriented occupations are Healthcare Support (100.0%), Personal Care & Service (100.0%), and Food Preparation & Serving (81.2%).
| Occupation | Male | Female |
| Healthcare Support | 0 (0.0%) | 39 (100.0%) |
| Security & Protection | 54 (100.0%) | 0 (0.0%) |
| Firefighting & Prevention | 0 (0.0%) | 0 (0.0%) |
| Law Enforcement | 54 (100.0%) | 0 (0.0%) |
| Food Preparation & Serving | 19 (18.8%) | 82 (81.2%) |
| Cleaning & Maintenance | 17 (47.2%) | 19 (52.8%) |
| Personal Care & Service | 0 (0.0%) | 49 (100.0%) |
| Total (Category) | 90 (32.3%) | 189 (67.7%) |
| Total (Overall) | 537 (52.3%) | 489 (47.7%) |
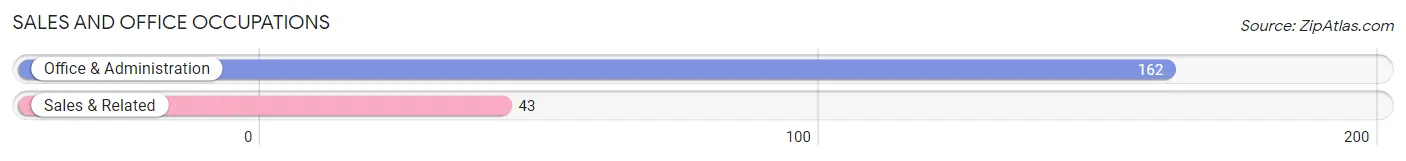
Sales and Office Occupations
The most common Sales and Office occupations in Bristol are Office & Administration (162 | 15.8%), and Sales & Related (43 | 4.2%).
Sales and Office Occupations by Sex
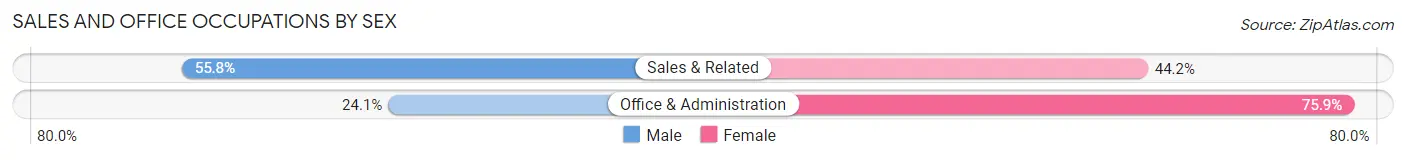
| Occupation | Male | Female |
| Sales & Related | 24 (55.8%) | 19 (44.2%) |
| Office & Administration | 39 (24.1%) | 123 (75.9%) |
| Total (Category) | 63 (30.7%) | 142 (69.3%) |
| Total (Overall) | 537 (52.3%) | 489 (47.7%) |
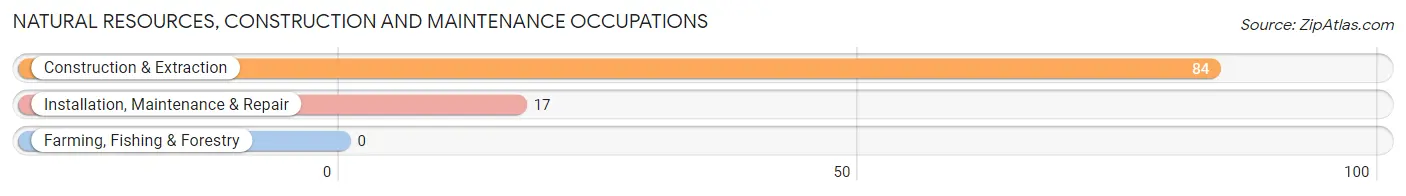
Natural Resources, Construction and Maintenance Occupations
The most common Natural Resources, Construction and Maintenance occupations in Bristol are Construction & Extraction (84 | 8.2%), and Installation, Maintenance & Repair (17 | 1.7%).
Natural Resources, Construction and Maintenance Occupations by Sex
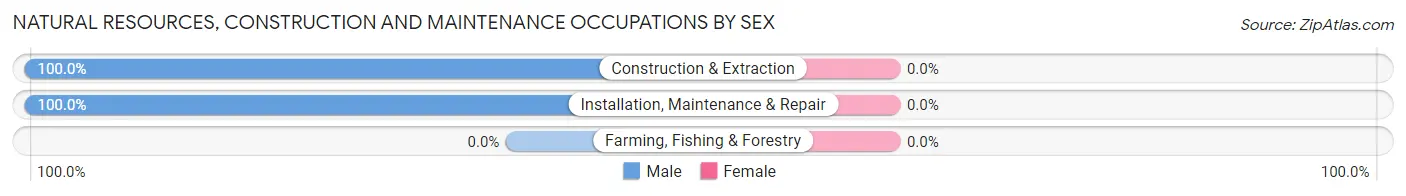
| Occupation | Male | Female |
| Farming, Fishing & Forestry | 0 (0.0%) | 0 (0.0%) |
| Construction & Extraction | 84 (100.0%) | 0 (0.0%) |
| Installation, Maintenance & Repair | 17 (100.0%) | 0 (0.0%) |
| Total (Category) | 101 (100.0%) | 0 (0.0%) |
| Total (Overall) | 537 (52.3%) | 489 (47.7%) |
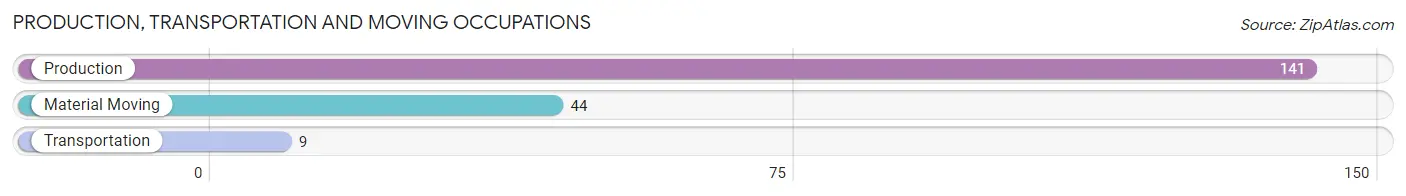
Production, Transportation and Moving Occupations
The most common Production, Transportation and Moving occupations in Bristol are Production (141 | 13.7%), Material Moving (44 | 4.3%), and Transportation (9 | 0.9%).
Production, Transportation and Moving Occupations by Sex
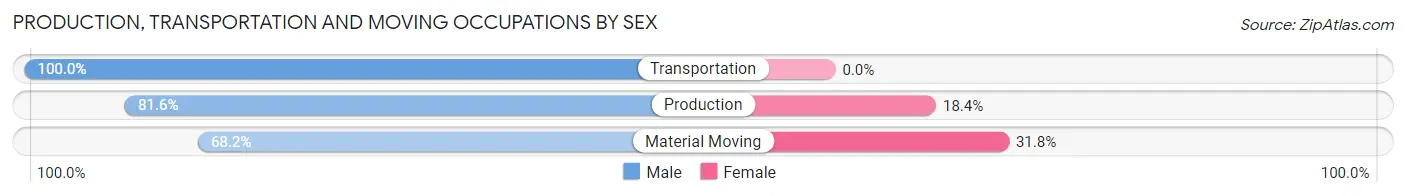
| Occupation | Male | Female |
| Production | 115 (81.6%) | 26 (18.4%) |
| Transportation | 9 (100.0%) | 0 (0.0%) |
| Material Moving | 30 (68.2%) | 14 (31.8%) |
| Total (Category) | 154 (79.4%) | 40 (20.6%) |
| Total (Overall) | 537 (52.3%) | 489 (47.7%) |
Employment Industries by Sex in Bristol
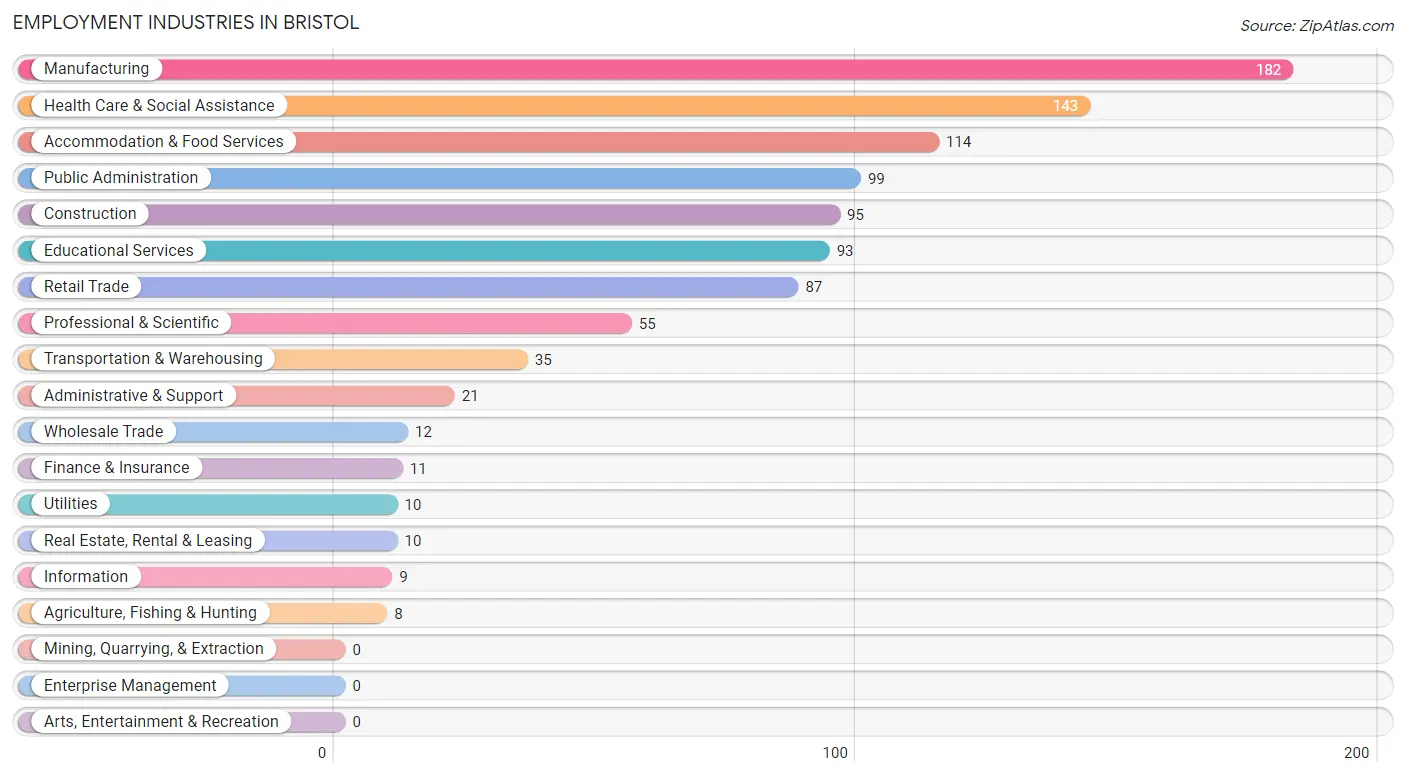
Employment Industries in Bristol
The major employment industries in Bristol include Manufacturing (182 | 17.7%), Health Care & Social Assistance (143 | 13.9%), Accommodation & Food Services (114 | 11.1%), Public Administration (99 | 9.7%), and Construction (95 | 9.3%).
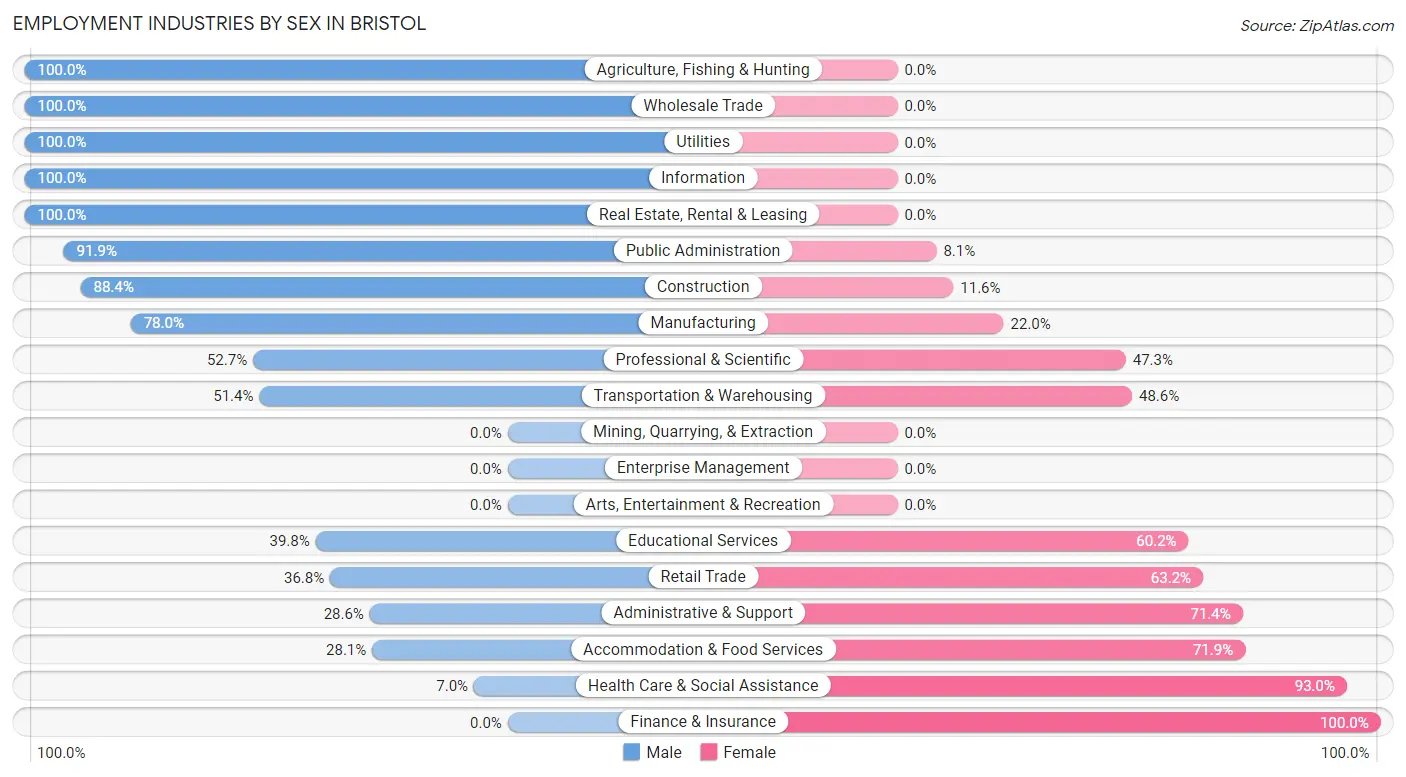
Employment Industries by Sex in Bristol
The Bristol industries that see more men than women are Agriculture, Fishing & Hunting (100.0%), Wholesale Trade (100.0%), and Utilities (100.0%), whereas the industries that tend to have a higher number of women are Finance & Insurance (100.0%), Health Care & Social Assistance (93.0%), and Accommodation & Food Services (71.9%).
| Industry | Male | Female |
| Agriculture, Fishing & Hunting | 8 (100.0%) | 0 (0.0%) |
| Mining, Quarrying, & Extraction | 0 (0.0%) | 0 (0.0%) |
| Construction | 84 (88.4%) | 11 (11.6%) |
| Manufacturing | 142 (78.0%) | 40 (22.0%) |
| Wholesale Trade | 12 (100.0%) | 0 (0.0%) |
| Retail Trade | 32 (36.8%) | 55 (63.2%) |
| Transportation & Warehousing | 18 (51.4%) | 17 (48.6%) |
| Utilities | 10 (100.0%) | 0 (0.0%) |
| Information | 9 (100.0%) | 0 (0.0%) |
| Finance & Insurance | 0 (0.0%) | 11 (100.0%) |
| Real Estate, Rental & Leasing | 10 (100.0%) | 0 (0.0%) |
| Professional & Scientific | 29 (52.7%) | 26 (47.3%) |
| Enterprise Management | 0 (0.0%) | 0 (0.0%) |
| Administrative & Support | 6 (28.6%) | 15 (71.4%) |
| Educational Services | 37 (39.8%) | 56 (60.2%) |
| Health Care & Social Assistance | 10 (7.0%) | 133 (93.0%) |
| Arts, Entertainment & Recreation | 0 (0.0%) | 0 (0.0%) |
| Accommodation & Food Services | 32 (28.1%) | 82 (71.9%) |
| Public Administration | 91 (91.9%) | 8 (8.1%) |
| Total | 537 (52.3%) | 489 (47.7%) |
Education in Bristol
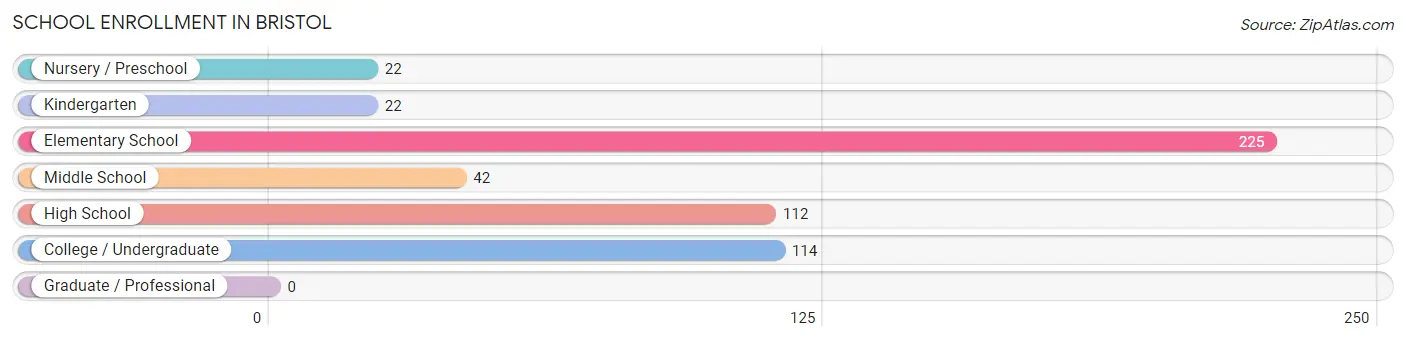
School Enrollment in Bristol
The most common levels of schooling among the 537 students in Bristol are elementary school (225 | 41.9%), college / undergraduate (114 | 21.2%), and high school (112 | 20.9%).
| School Level | # Students | % Students |
| Nursery / Preschool | 22 | 4.1% |
| Kindergarten | 22 | 4.1% |
| Elementary School | 225 | 41.9% |
| Middle School | 42 | 7.8% |
| High School | 112 | 20.9% |
| College / Undergraduate | 114 | 21.2% |
| Graduate / Professional | 0 | 0.0% |
| Total | 537 | 100.0% |
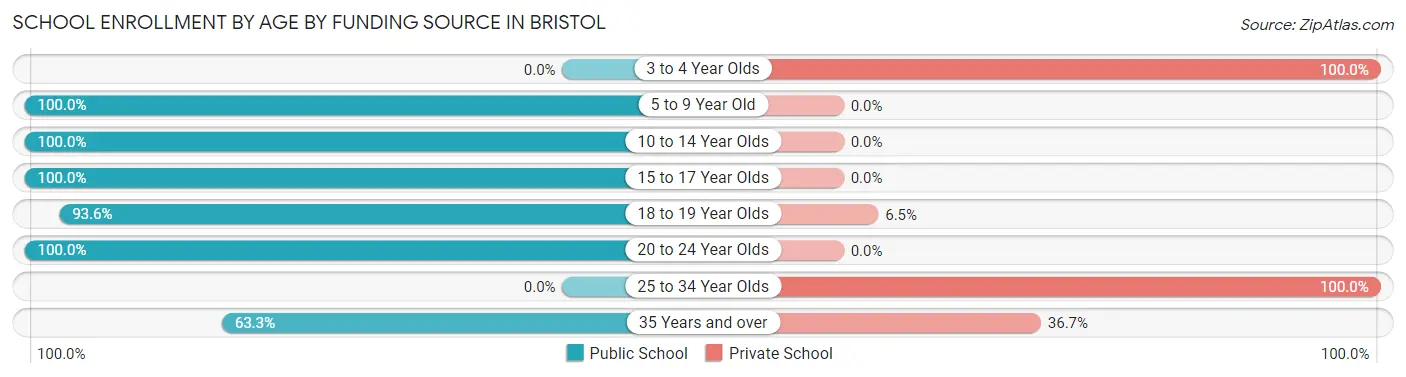
School Enrollment by Age by Funding Source in Bristol
Out of a total of 537 students who are enrolled in schools in Bristol, 40 (7.4%) attend a private institution, while the remaining 497 (92.6%) are enrolled in public schools. The age group of 3 to 4 year olds has the highest likelihood of being enrolled in private schools, with 12 (100.0% in the age bracket) enrolled. Conversely, the age group of 5 to 9 year old has the lowest likelihood of being enrolled in a private school, with 257 (100.0% in the age bracket) attending a public institution.
| Age Bracket | Public School | Private School |
| 3 to 4 Year Olds | 0 (0.0%) | 12 (100.0%) |
| 5 to 9 Year Old | 257 (100.0%) | 0 (0.0%) |
| 10 to 14 Year Olds | 42 (100.0%) | 0 (0.0%) |
| 15 to 17 Year Olds | 112 (100.0%) | 0 (0.0%) |
| 18 to 19 Year Olds | 29 (93.5%) | 2 (6.5%) |
| 20 to 24 Year Olds | 26 (100.0%) | 0 (0.0%) |
| 25 to 34 Year Olds | 0 (0.0%) | 8 (100.0%) |
| 35 Years and over | 31 (63.3%) | 18 (36.7%) |
| Total | 497 (92.6%) | 40 (7.4%) |
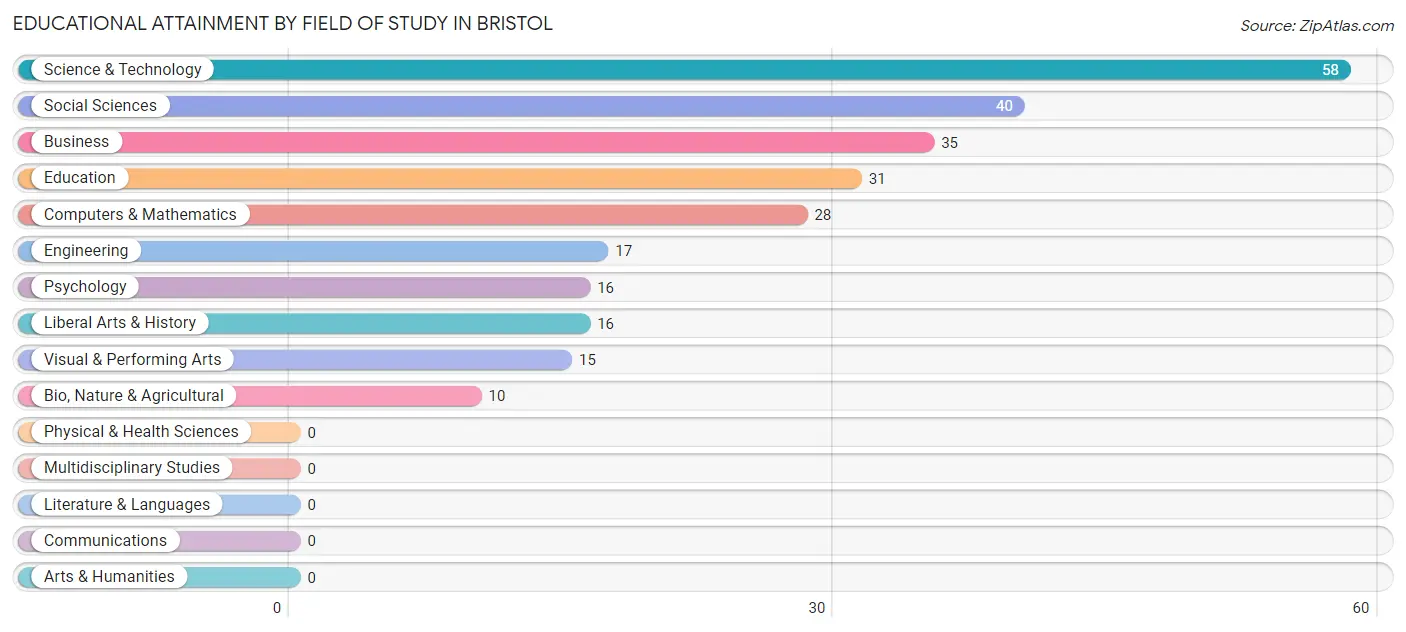
Educational Attainment by Field of Study in Bristol
Science & technology (58 | 21.8%), social sciences (40 | 15.0%), business (35 | 13.2%), education (31 | 11.7%), and computers & mathematics (28 | 10.5%) are the most common fields of study among 266 individuals in Bristol who have obtained a bachelor's degree or higher.
| Field of Study | # Graduates | % Graduates |
| Computers & Mathematics | 28 | 10.5% |
| Bio, Nature & Agricultural | 10 | 3.8% |
| Physical & Health Sciences | 0 | 0.0% |
| Psychology | 16 | 6.0% |
| Social Sciences | 40 | 15.0% |
| Engineering | 17 | 6.4% |
| Multidisciplinary Studies | 0 | 0.0% |
| Science & Technology | 58 | 21.8% |
| Business | 35 | 13.2% |
| Education | 31 | 11.7% |
| Literature & Languages | 0 | 0.0% |
| Liberal Arts & History | 16 | 6.0% |
| Visual & Performing Arts | 15 | 5.6% |
| Communications | 0 | 0.0% |
| Arts & Humanities | 0 | 0.0% |
| Total | 266 | 100.0% |
Transportation & Commute in Bristol
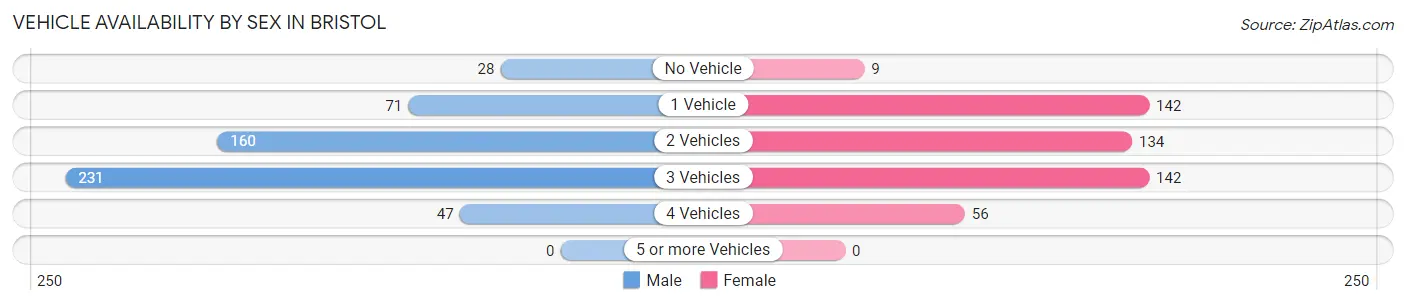
Vehicle Availability by Sex in Bristol
The most prevalent vehicle ownership categories in Bristol are males with 3 vehicles (231, accounting for 43.0%) and females with 3 vehicles (142, making up 47.8%).
| Vehicles Available | Male | Female |
| No Vehicle | 28 (5.2%) | 9 (1.9%) |
| 1 Vehicle | 71 (13.2%) | 142 (29.4%) |
| 2 Vehicles | 160 (29.8%) | 134 (27.7%) |
| 3 Vehicles | 231 (43.0%) | 142 (29.4%) |
| 4 Vehicles | 47 (8.7%) | 56 (11.6%) |
| 5 or more Vehicles | 0 (0.0%) | 0 (0.0%) |
| Total | 537 (100.0%) | 483 (100.0%) |
Commute Time in Bristol
The most frequently occuring commute durations in Bristol are 30 to 34 minutes (192 commuters, 20.3%), less than 5 minutes (138 commuters, 14.6%), and 45 to 59 minutes (138 commuters, 14.6%).
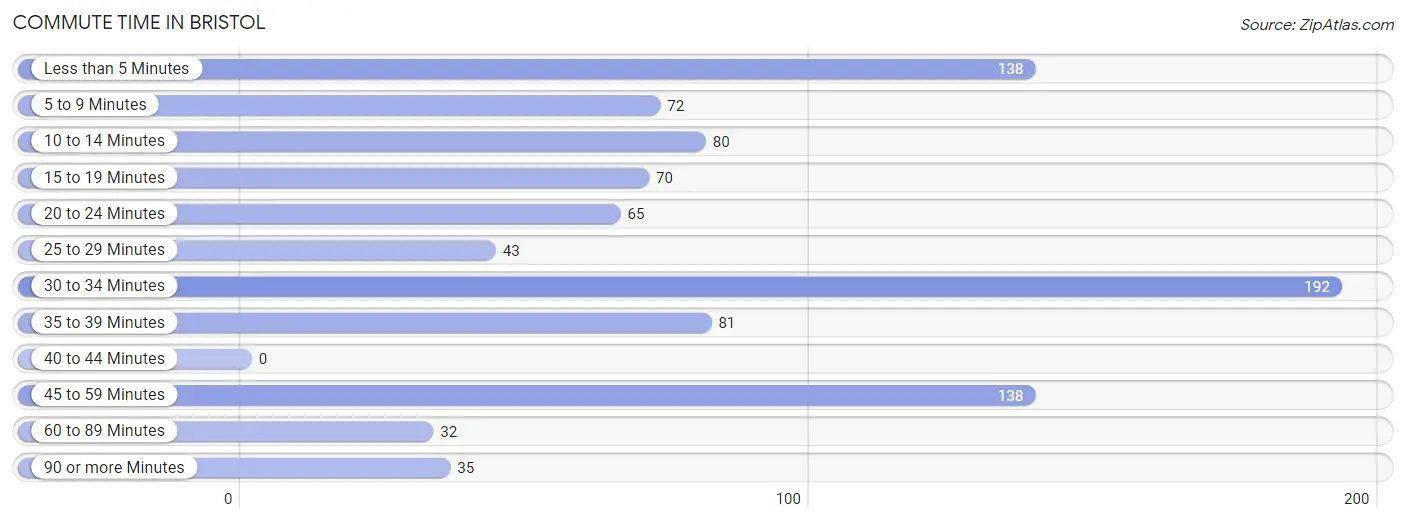
| Commute Time | # Commuters | % Commuters |
| Less than 5 Minutes | 138 | 14.6% |
| 5 to 9 Minutes | 72 | 7.6% |
| 10 to 14 Minutes | 80 | 8.5% |
| 15 to 19 Minutes | 70 | 7.4% |
| 20 to 24 Minutes | 65 | 6.9% |
| 25 to 29 Minutes | 43 | 4.5% |
| 30 to 34 Minutes | 192 | 20.3% |
| 35 to 39 Minutes | 81 | 8.6% |
| 40 to 44 Minutes | 0 | 0.0% |
| 45 to 59 Minutes | 138 | 14.6% |
| 60 to 89 Minutes | 32 | 3.4% |
| 90 or more Minutes | 35 | 3.7% |
Commute Time by Sex in Bristol
The most common commute times in Bristol are less than 5 minutes (105 commuters, 21.0%) for males and 30 to 34 minutes (99 commuters, 22.2%) for females.
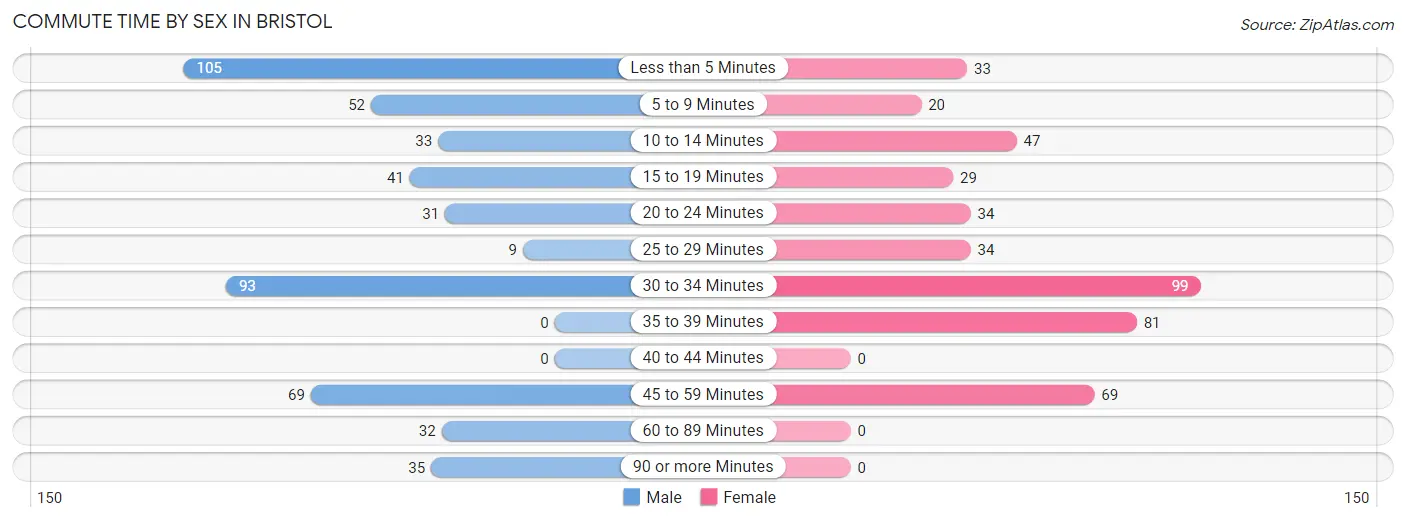
| Commute Time | Male | Female |
| Less than 5 Minutes | 105 (21.0%) | 33 (7.4%) |
| 5 to 9 Minutes | 52 (10.4%) | 20 (4.5%) |
| 10 to 14 Minutes | 33 (6.6%) | 47 (10.5%) |
| 15 to 19 Minutes | 41 (8.2%) | 29 (6.5%) |
| 20 to 24 Minutes | 31 (6.2%) | 34 (7.6%) |
| 25 to 29 Minutes | 9 (1.8%) | 34 (7.6%) |
| 30 to 34 Minutes | 93 (18.6%) | 99 (22.2%) |
| 35 to 39 Minutes | 0 (0.0%) | 81 (18.2%) |
| 40 to 44 Minutes | 0 (0.0%) | 0 (0.0%) |
| 45 to 59 Minutes | 69 (13.8%) | 69 (15.5%) |
| 60 to 89 Minutes | 32 (6.4%) | 0 (0.0%) |
| 90 or more Minutes | 35 (7.0%) | 0 (0.0%) |
Time of Departure to Work by Sex in Bristol
The most frequent times of departure to work in Bristol are 7:00 AM to 7:29 AM (105, 21.0%) for males and 7:00 AM to 7:29 AM (91, 20.4%) for females.
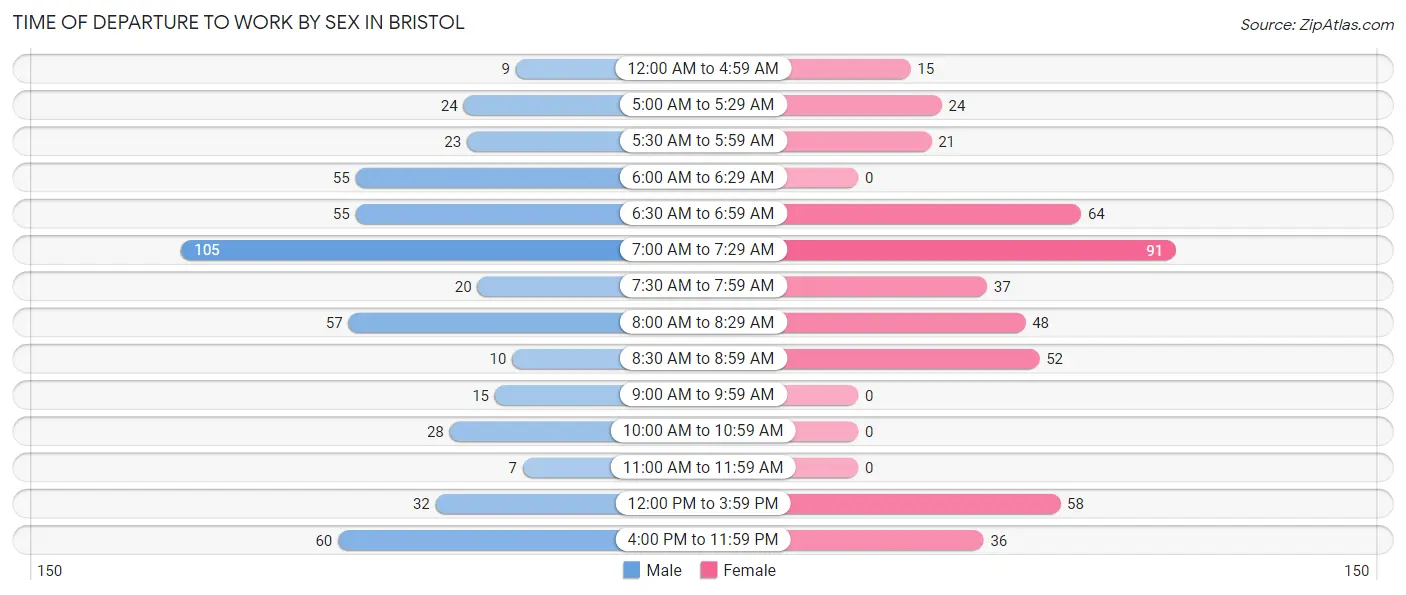
| Time of Departure | Male | Female |
| 12:00 AM to 4:59 AM | 9 (1.8%) | 15 (3.4%) |
| 5:00 AM to 5:29 AM | 24 (4.8%) | 24 (5.4%) |
| 5:30 AM to 5:59 AM | 23 (4.6%) | 21 (4.7%) |
| 6:00 AM to 6:29 AM | 55 (11.0%) | 0 (0.0%) |
| 6:30 AM to 6:59 AM | 55 (11.0%) | 64 (14.3%) |
| 7:00 AM to 7:29 AM | 105 (21.0%) | 91 (20.4%) |
| 7:30 AM to 7:59 AM | 20 (4.0%) | 37 (8.3%) |
| 8:00 AM to 8:29 AM | 57 (11.4%) | 48 (10.8%) |
| 8:30 AM to 8:59 AM | 10 (2.0%) | 52 (11.7%) |
| 9:00 AM to 9:59 AM | 15 (3.0%) | 0 (0.0%) |
| 10:00 AM to 10:59 AM | 28 (5.6%) | 0 (0.0%) |
| 11:00 AM to 11:59 AM | 7 (1.4%) | 0 (0.0%) |
| 12:00 PM to 3:59 PM | 32 (6.4%) | 58 (13.0%) |
| 4:00 PM to 11:59 PM | 60 (12.0%) | 36 (8.1%) |
| Total | 500 (100.0%) | 446 (100.0%) |
Housing Occupancy in Bristol
Occupancy by Ownership in Bristol
Of the total 775 dwellings in Bristol, owner-occupied units account for 478 (61.7%), while renter-occupied units make up 297 (38.3%).
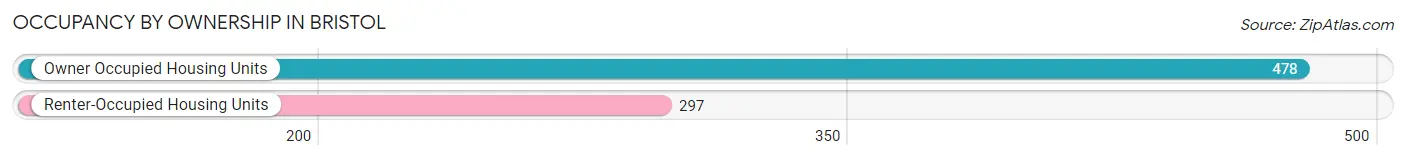
| Occupancy | # Housing Units | % Housing Units |
| Owner Occupied Housing Units | 478 | 61.7% |
| Renter-Occupied Housing Units | 297 | 38.3% |
| Total Occupied Housing Units | 775 | 100.0% |
Occupancy by Household Size in Bristol
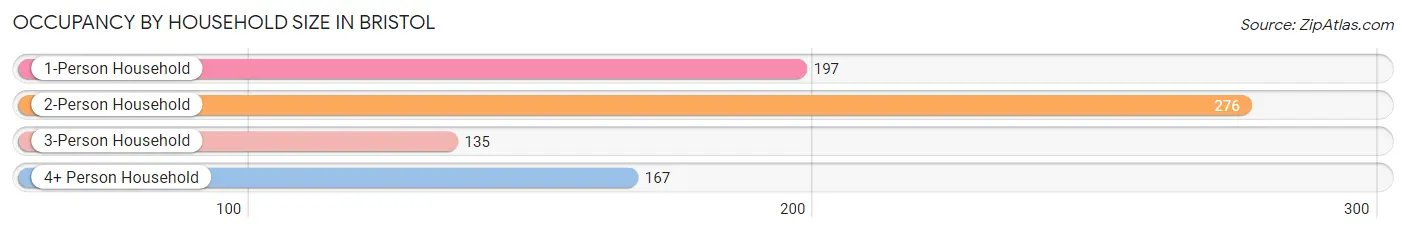
| Household Size | # Housing Units | % Housing Units |
| 1-Person Household | 197 | 25.4% |
| 2-Person Household | 276 | 35.6% |
| 3-Person Household | 135 | 17.4% |
| 4+ Person Household | 167 | 21.5% |
| Total Housing Units | 775 | 100.0% |
Occupancy by Ownership by Household Size in Bristol
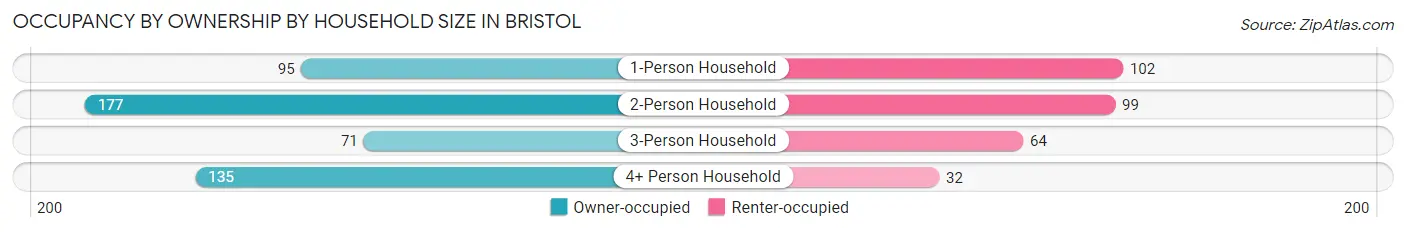
| Household Size | Owner-occupied | Renter-occupied |
| 1-Person Household | 95 (48.2%) | 102 (51.8%) |
| 2-Person Household | 177 (64.1%) | 99 (35.9%) |
| 3-Person Household | 71 (52.6%) | 64 (47.4%) |
| 4+ Person Household | 135 (80.8%) | 32 (19.2%) |
| Total Housing Units | 478 (61.7%) | 297 (38.3%) |
Occupancy by Educational Attainment in Bristol
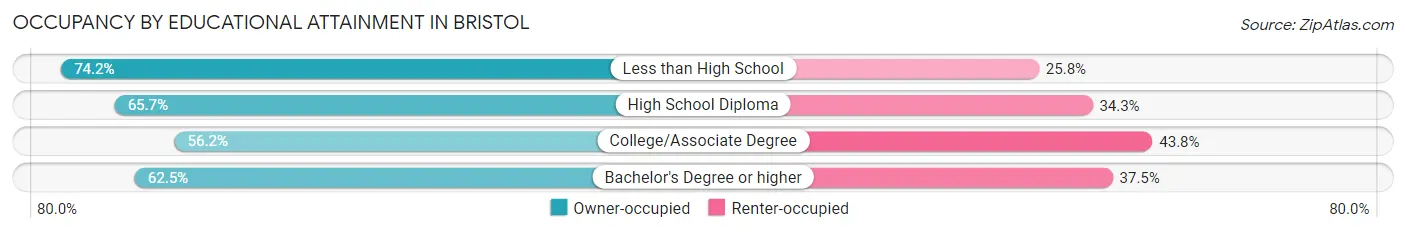
| Household Size | Owner-occupied | Renter-occupied |
| Less than High School | 23 (74.2%) | 8 (25.8%) |
| High School Diploma | 182 (65.7%) | 95 (34.3%) |
| College/Associate Degree | 168 (56.2%) | 131 (43.8%) |
| Bachelor's Degree or higher | 105 (62.5%) | 63 (37.5%) |
Occupancy by Age of Householder in Bristol
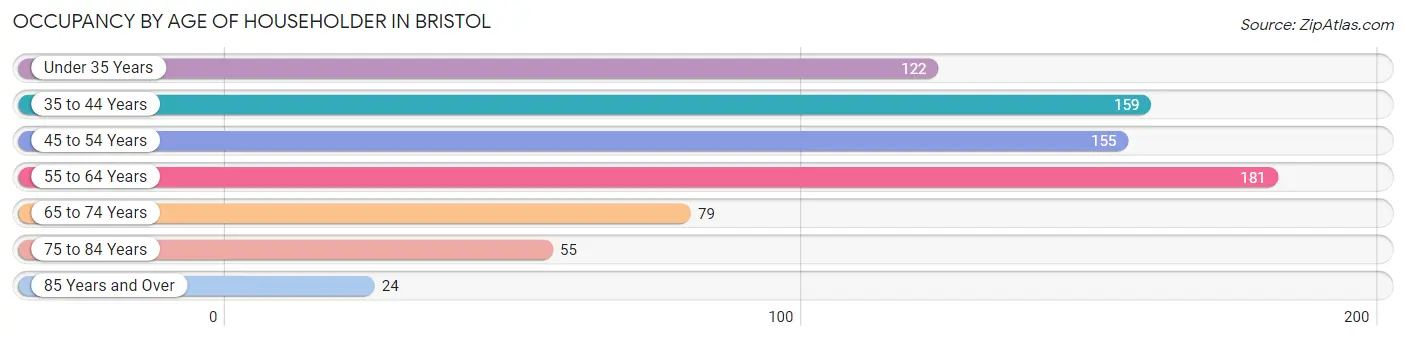
| Age Bracket | # Households | % Households |
| Under 35 Years | 122 | 15.7% |
| 35 to 44 Years | 159 | 20.5% |
| 45 to 54 Years | 155 | 20.0% |
| 55 to 64 Years | 181 | 23.4% |
| 65 to 74 Years | 79 | 10.2% |
| 75 to 84 Years | 55 | 7.1% |
| 85 Years and Over | 24 | 3.1% |
| Total | 775 | 100.0% |
Housing Finances in Bristol
Median Income by Occupancy in Bristol
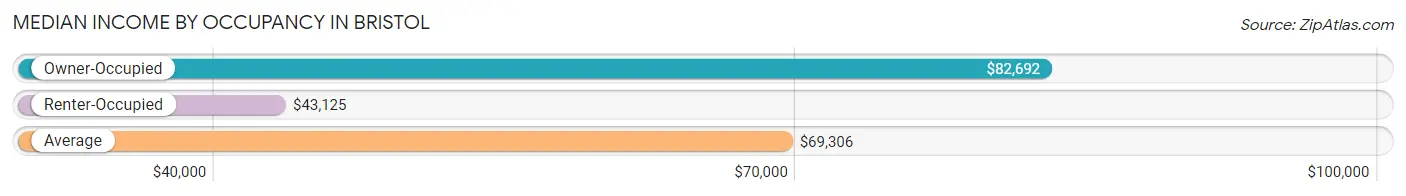
| Occupancy Type | # Households | Median Income |
| Owner-Occupied | 478 (61.7%) | $82,692 |
| Renter-Occupied | 297 (38.3%) | $43,125 |
| Average | 775 (100.0%) | $69,306 |
Occupancy by Householder Income Bracket in Bristol
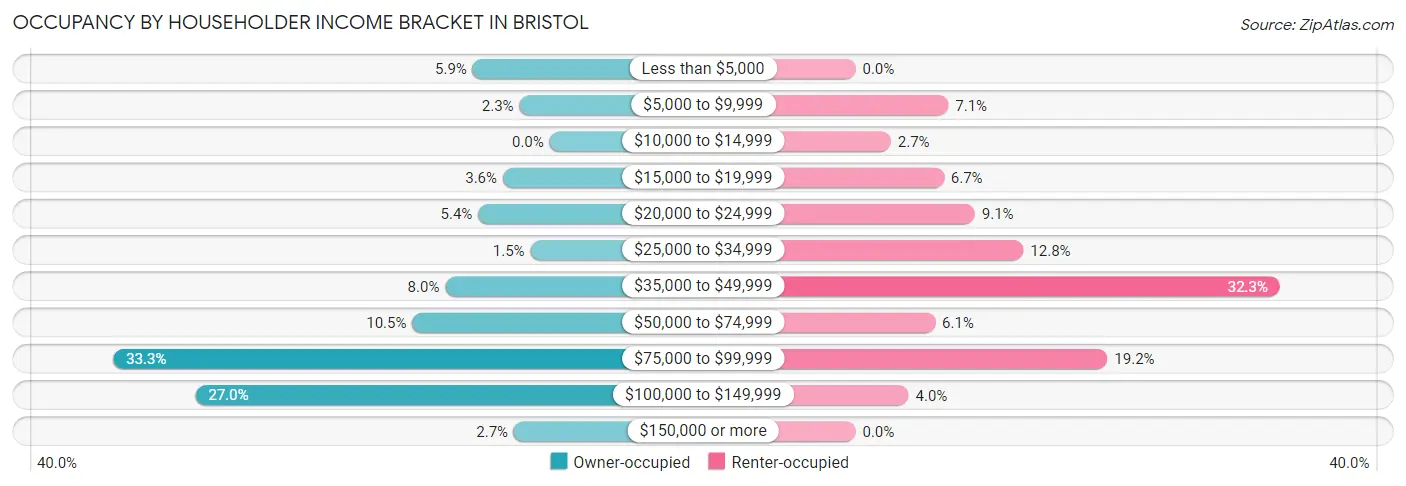
| Income Bracket | Owner-occupied | Renter-occupied |
| Less than $5,000 | 28 (5.9%) | 0 (0.0%) |
| $5,000 to $9,999 | 11 (2.3%) | 21 (7.1%) |
| $10,000 to $14,999 | 0 (0.0%) | 8 (2.7%) |
| $15,000 to $19,999 | 17 (3.6%) | 20 (6.7%) |
| $20,000 to $24,999 | 26 (5.4%) | 27 (9.1%) |
| $25,000 to $34,999 | 7 (1.5%) | 38 (12.8%) |
| $35,000 to $49,999 | 38 (8.0%) | 96 (32.3%) |
| $50,000 to $74,999 | 50 (10.5%) | 18 (6.1%) |
| $75,000 to $99,999 | 159 (33.3%) | 57 (19.2%) |
| $100,000 to $149,999 | 129 (27.0%) | 12 (4.0%) |
| $150,000 or more | 13 (2.7%) | 0 (0.0%) |
| Total | 478 (100.0%) | 297 (100.0%) |
Monthly Housing Cost Tiers in Bristol
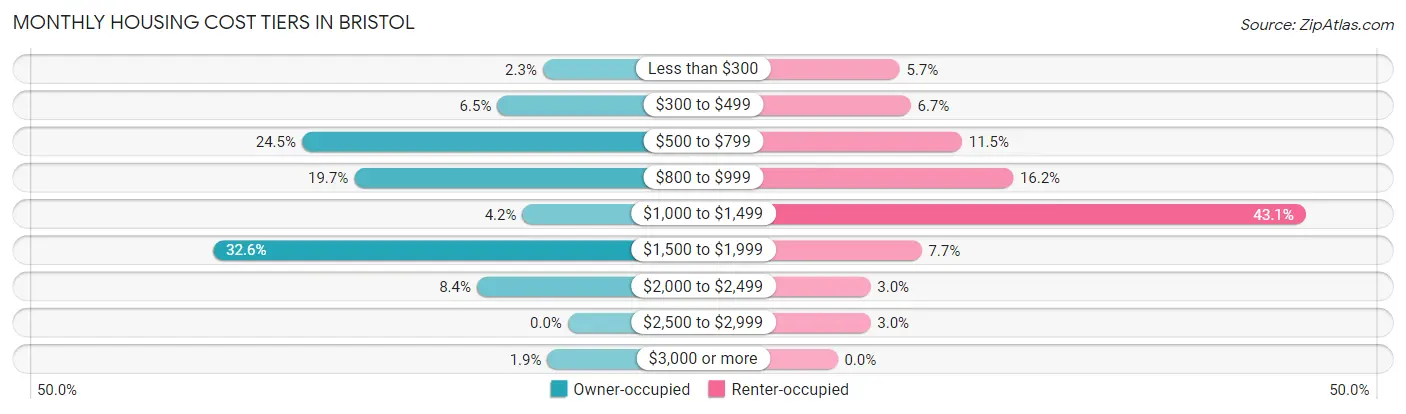
| Monthly Cost | Owner-occupied | Renter-occupied |
| Less than $300 | 11 (2.3%) | 17 (5.7%) |
| $300 to $499 | 31 (6.5%) | 20 (6.7%) |
| $500 to $799 | 117 (24.5%) | 34 (11.5%) |
| $800 to $999 | 94 (19.7%) | 48 (16.2%) |
| $1,000 to $1,499 | 20 (4.2%) | 128 (43.1%) |
| $1,500 to $1,999 | 156 (32.6%) | 23 (7.7%) |
| $2,000 to $2,499 | 40 (8.4%) | 9 (3.0%) |
| $2,500 to $2,999 | 0 (0.0%) | 9 (3.0%) |
| $3,000 or more | 9 (1.9%) | 0 (0.0%) |
| Total | 478 (100.0%) | 297 (100.0%) |
Physical Housing Characteristics in Bristol
Housing Structures in Bristol
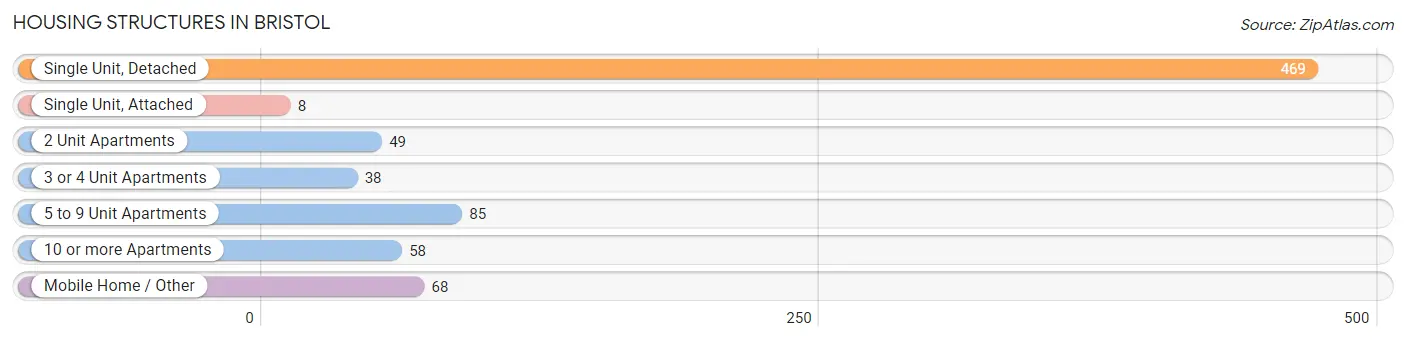
| Structure Type | # Housing Units | % Housing Units |
| Single Unit, Detached | 469 | 60.5% |
| Single Unit, Attached | 8 | 1.0% |
| 2 Unit Apartments | 49 | 6.3% |
| 3 or 4 Unit Apartments | 38 | 4.9% |
| 5 to 9 Unit Apartments | 85 | 11.0% |
| 10 or more Apartments | 58 | 7.5% |
| Mobile Home / Other | 68 | 8.8% |
| Total | 775 | 100.0% |
Housing Structures by Occupancy in Bristol
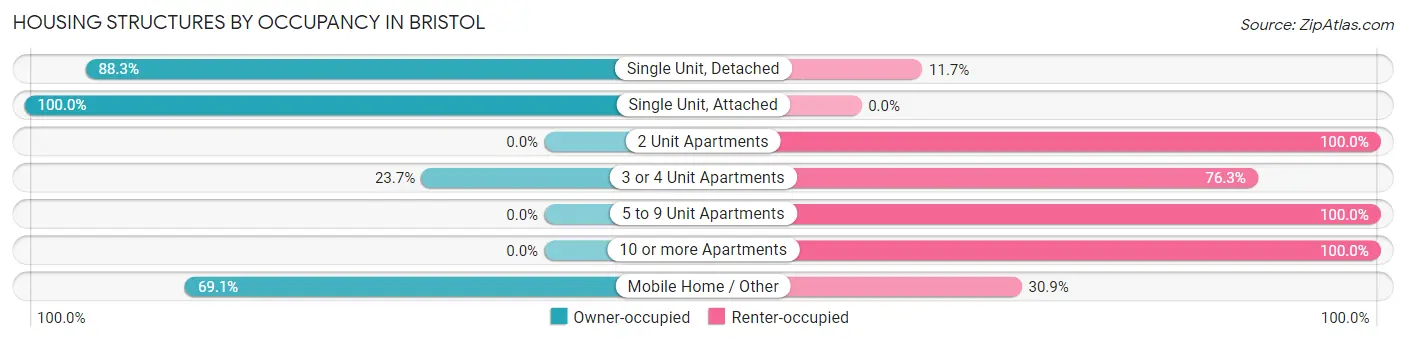
| Structure Type | Owner-occupied | Renter-occupied |
| Single Unit, Detached | 414 (88.3%) | 55 (11.7%) |
| Single Unit, Attached | 8 (100.0%) | 0 (0.0%) |
| 2 Unit Apartments | 0 (0.0%) | 49 (100.0%) |
| 3 or 4 Unit Apartments | 9 (23.7%) | 29 (76.3%) |
| 5 to 9 Unit Apartments | 0 (0.0%) | 85 (100.0%) |
| 10 or more Apartments | 0 (0.0%) | 58 (100.0%) |
| Mobile Home / Other | 47 (69.1%) | 21 (30.9%) |
| Total | 478 (61.7%) | 297 (38.3%) |
Housing Structures by Number of Rooms in Bristol
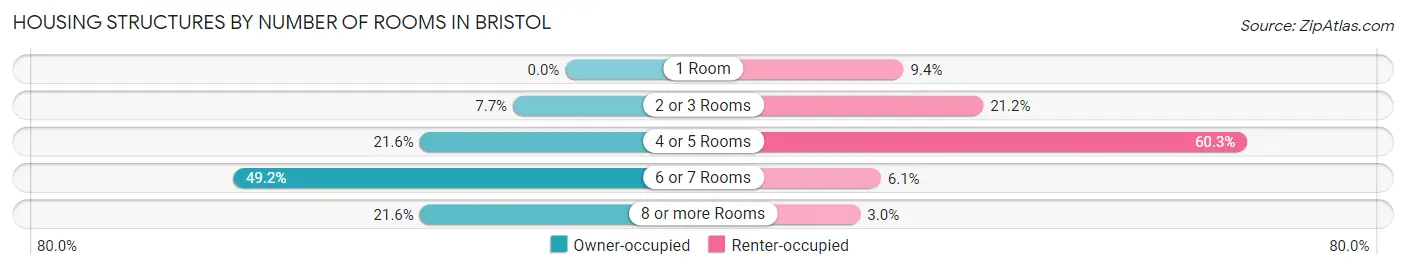
| Number of Rooms | Owner-occupied | Renter-occupied |
| 1 Room | 0 (0.0%) | 28 (9.4%) |
| 2 or 3 Rooms | 37 (7.7%) | 63 (21.2%) |
| 4 or 5 Rooms | 103 (21.5%) | 179 (60.3%) |
| 6 or 7 Rooms | 235 (49.2%) | 18 (6.1%) |
| 8 or more Rooms | 103 (21.5%) | 9 (3.0%) |
| Total | 478 (100.0%) | 297 (100.0%) |
Housing Structure by Heating Type in Bristol
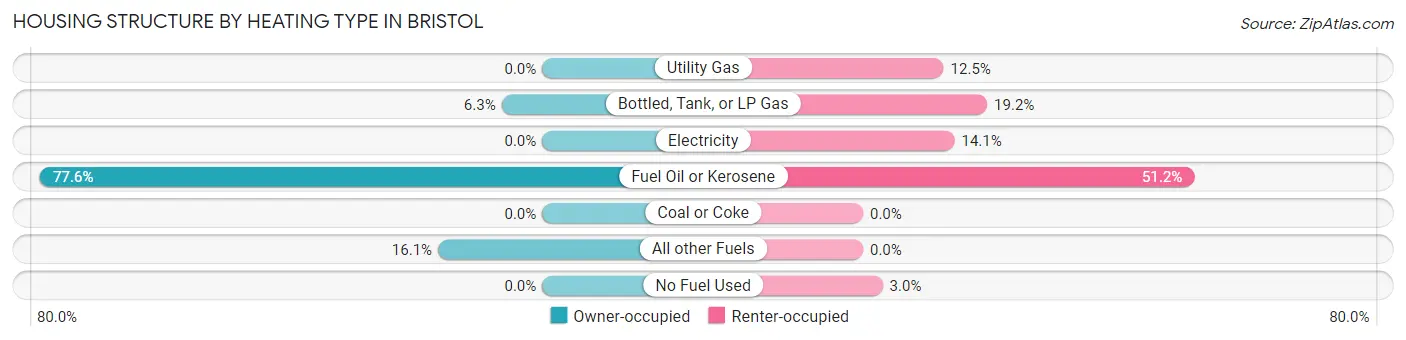
| Heating Type | Owner-occupied | Renter-occupied |
| Utility Gas | 0 (0.0%) | 37 (12.5%) |
| Bottled, Tank, or LP Gas | 30 (6.3%) | 57 (19.2%) |
| Electricity | 0 (0.0%) | 42 (14.1%) |
| Fuel Oil or Kerosene | 371 (77.6%) | 152 (51.2%) |
| Coal or Coke | 0 (0.0%) | 0 (0.0%) |
| All other Fuels | 77 (16.1%) | 0 (0.0%) |
| No Fuel Used | 0 (0.0%) | 9 (3.0%) |
| Total | 478 (100.0%) | 297 (100.0%) |
Household Vehicle Usage in Bristol
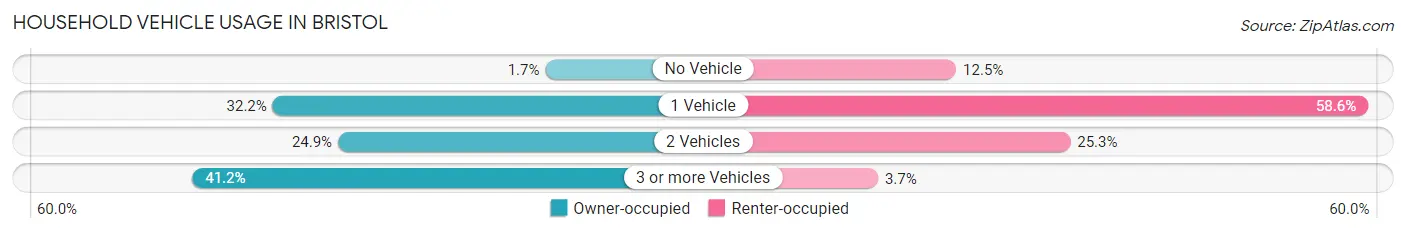
| Vehicles per Household | Owner-occupied | Renter-occupied |
| No Vehicle | 8 (1.7%) | 37 (12.5%) |
| 1 Vehicle | 154 (32.2%) | 174 (58.6%) |
| 2 Vehicles | 119 (24.9%) | 75 (25.3%) |
| 3 or more Vehicles | 197 (41.2%) | 11 (3.7%) |
| Total | 478 (100.0%) | 297 (100.0%) |
Real Estate & Mortgages in Bristol
Real Estate and Mortgage Overview in Bristol
| Characteristic | Without Mortgage | With Mortgage |
| Housing Units | 209 | 269 |
| Median Property Value | $160,700 | $192,700 |
| Median Household Income | $79,511 | $13 |
| Monthly Housing Costs | $736 | $9 |
| Real Estate Taxes | $3,508 | $19 |
Property Value by Mortgage Status in Bristol
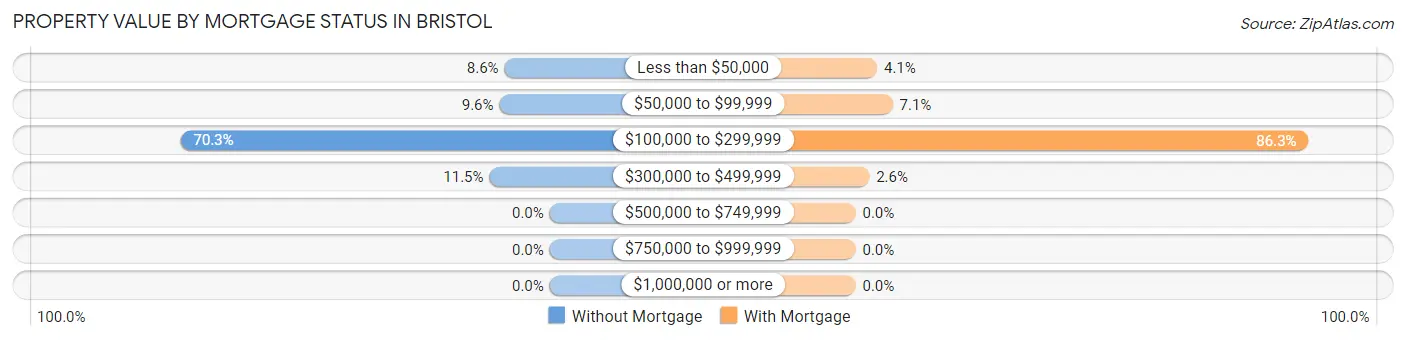
| Property Value | Without Mortgage | With Mortgage |
| Less than $50,000 | 18 (8.6%) | 11 (4.1%) |
| $50,000 to $99,999 | 20 (9.6%) | 19 (7.1%) |
| $100,000 to $299,999 | 147 (70.3%) | 232 (86.3%) |
| $300,000 to $499,999 | 24 (11.5%) | 7 (2.6%) |
| $500,000 to $749,999 | 0 (0.0%) | 0 (0.0%) |
| $750,000 to $999,999 | 0 (0.0%) | 0 (0.0%) |
| $1,000,000 or more | 0 (0.0%) | 0 (0.0%) |
| Total | 209 (100.0%) | 269 (100.0%) |
Household Income by Mortgage Status in Bristol
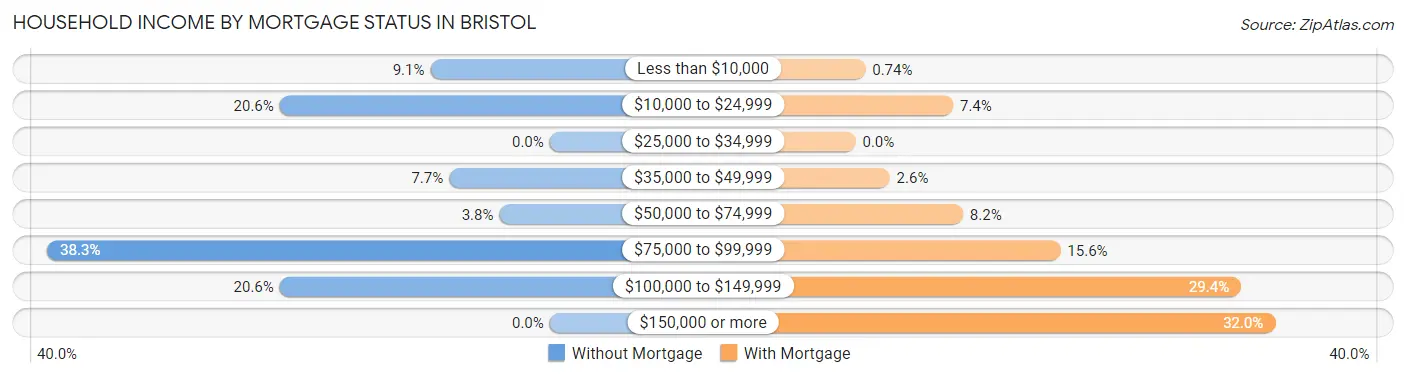
| Household Income | Without Mortgage | With Mortgage |
| Less than $10,000 | 19 (9.1%) | 2 (0.7%) |
| $10,000 to $24,999 | 43 (20.6%) | 20 (7.4%) |
| $25,000 to $34,999 | 0 (0.0%) | 0 (0.0%) |
| $35,000 to $49,999 | 16 (7.7%) | 7 (2.6%) |
| $50,000 to $74,999 | 8 (3.8%) | 22 (8.2%) |
| $75,000 to $99,999 | 80 (38.3%) | 42 (15.6%) |
| $100,000 to $149,999 | 43 (20.6%) | 79 (29.4%) |
| $150,000 or more | 0 (0.0%) | 86 (32.0%) |
| Total | 209 (100.0%) | 269 (100.0%) |
Property Value to Household Income Ratio in Bristol
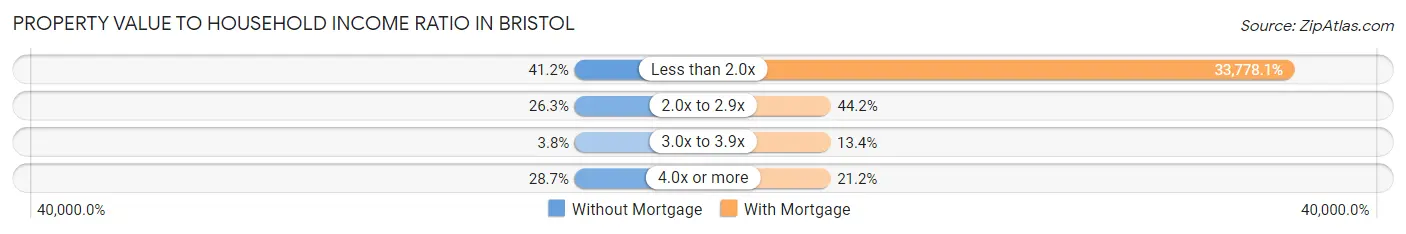
| Value-to-Income Ratio | Without Mortgage | With Mortgage |
| Less than 2.0x | 86 (41.1%) | 90,863 (33,778.1%) |
| 2.0x to 2.9x | 55 (26.3%) | 119 (44.2%) |
| 3.0x to 3.9x | 8 (3.8%) | 36 (13.4%) |
| 4.0x or more | 60 (28.7%) | 57 (21.2%) |
| Total | 209 (100.0%) | 269 (100.0%) |
Real Estate Taxes by Mortgage Status in Bristol
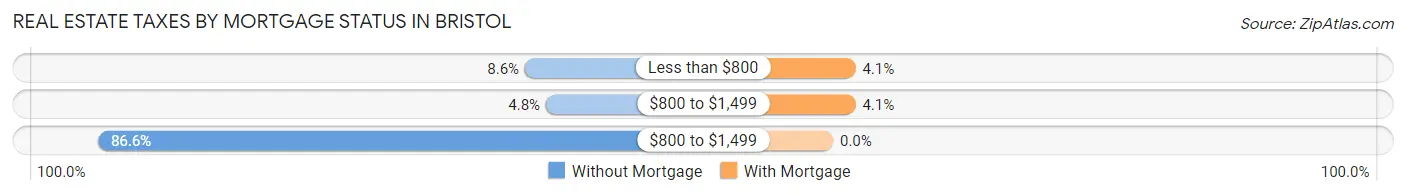
| Property Taxes | Without Mortgage | With Mortgage |
| Less than $800 | 18 (8.6%) | 11 (4.1%) |
| $800 to $1,499 | 10 (4.8%) | 11 (4.1%) |
| $800 to $1,499 | 181 (86.6%) | 0 (0.0%) |
| Total | 209 (100.0%) | 269 (100.0%) |
Health & Disability in Bristol
Health Insurance Coverage by Age in Bristol
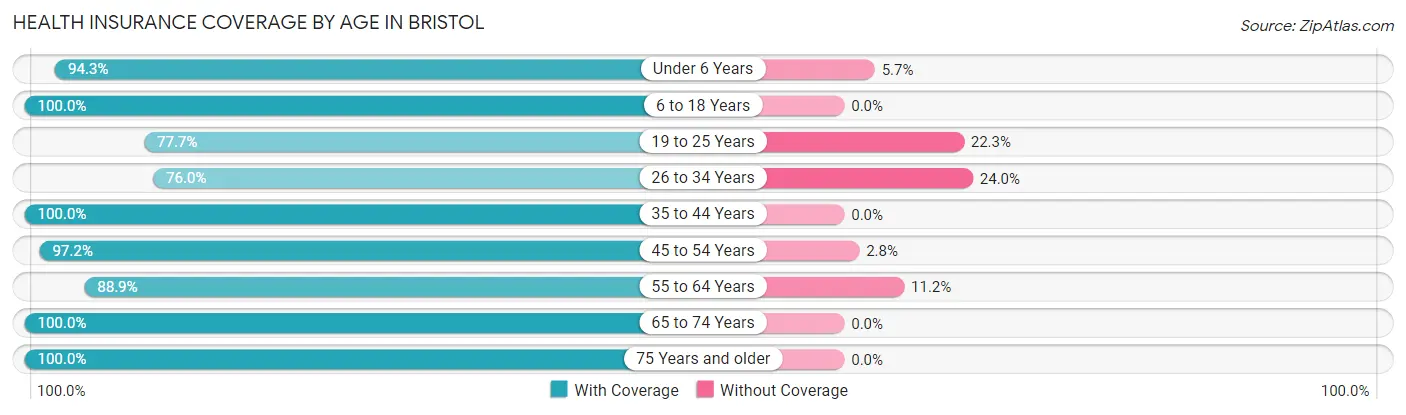
| Age Bracket | With Coverage | Without Coverage |
| Under 6 Years | 166 (94.3%) | 10 (5.7%) |
| 6 to 18 Years | 391 (100.0%) | 0 (0.0%) |
| 19 to 25 Years | 122 (77.7%) | 35 (22.3%) |
| 26 to 34 Years | 111 (76.0%) | 35 (24.0%) |
| 35 to 44 Years | 361 (100.0%) | 0 (0.0%) |
| 45 to 54 Years | 315 (97.2%) | 9 (2.8%) |
| 55 to 64 Years | 239 (88.8%) | 30 (11.2%) |
| 65 to 74 Years | 96 (100.0%) | 0 (0.0%) |
| 75 Years and older | 175 (100.0%) | 0 (0.0%) |
| Total | 1,976 (94.3%) | 119 (5.7%) |
Health Insurance Coverage by Citizenship Status in Bristol
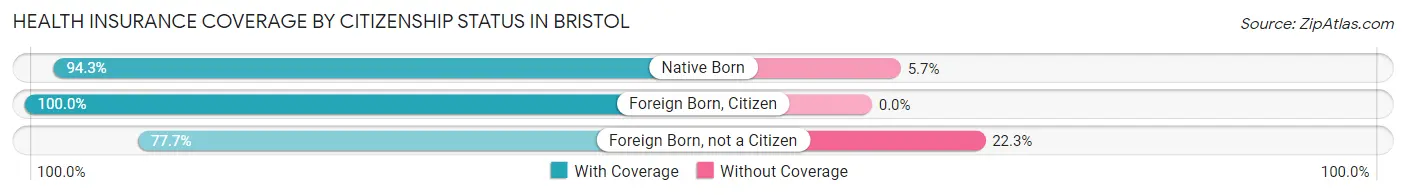
| Citizenship Status | With Coverage | Without Coverage |
| Native Born | 166 (94.3%) | 10 (5.7%) |
| Foreign Born, Citizen | 391 (100.0%) | 0 (0.0%) |
| Foreign Born, not a Citizen | 122 (77.7%) | 35 (22.3%) |
Health Insurance Coverage by Household Income in Bristol
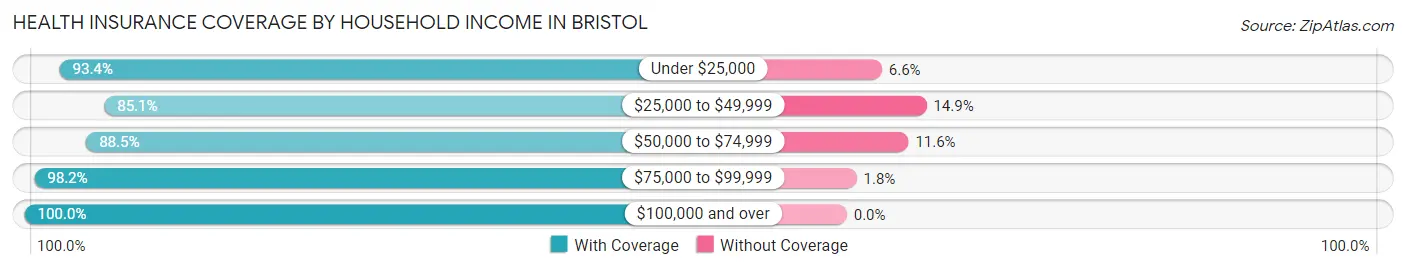
| Household Income | With Coverage | Without Coverage |
| Under $25,000 | 270 (93.4%) | 19 (6.6%) |
| $25,000 to $49,999 | 342 (85.1%) | 60 (14.9%) |
| $50,000 to $74,999 | 222 (88.4%) | 29 (11.6%) |
| $75,000 to $99,999 | 587 (98.2%) | 11 (1.8%) |
| $100,000 and over | 534 (100.0%) | 0 (0.0%) |
Public vs Private Health Insurance Coverage by Age in Bristol
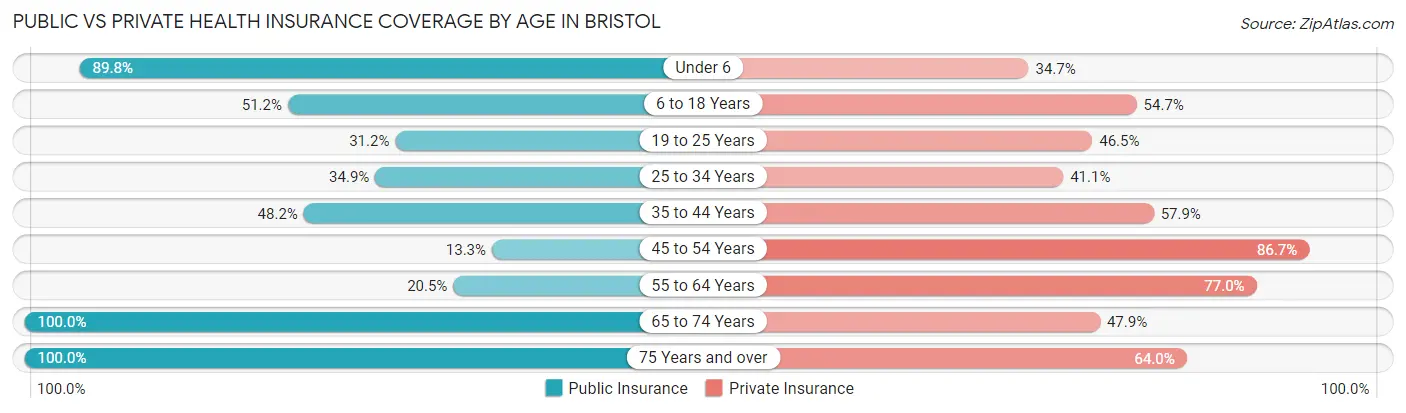
| Age Bracket | Public Insurance | Private Insurance |
| Under 6 | 158 (89.8%) | 61 (34.7%) |
| 6 to 18 Years | 200 (51.1%) | 214 (54.7%) |
| 19 to 25 Years | 49 (31.2%) | 73 (46.5%) |
| 25 to 34 Years | 51 (34.9%) | 60 (41.1%) |
| 35 to 44 Years | 174 (48.2%) | 209 (57.9%) |
| 45 to 54 Years | 43 (13.3%) | 281 (86.7%) |
| 55 to 64 Years | 55 (20.4%) | 207 (76.9%) |
| 65 to 74 Years | 96 (100.0%) | 46 (47.9%) |
| 75 Years and over | 175 (100.0%) | 112 (64.0%) |
| Total | 1,001 (47.8%) | 1,263 (60.3%) |
Disability Status by Sex by Age in Bristol
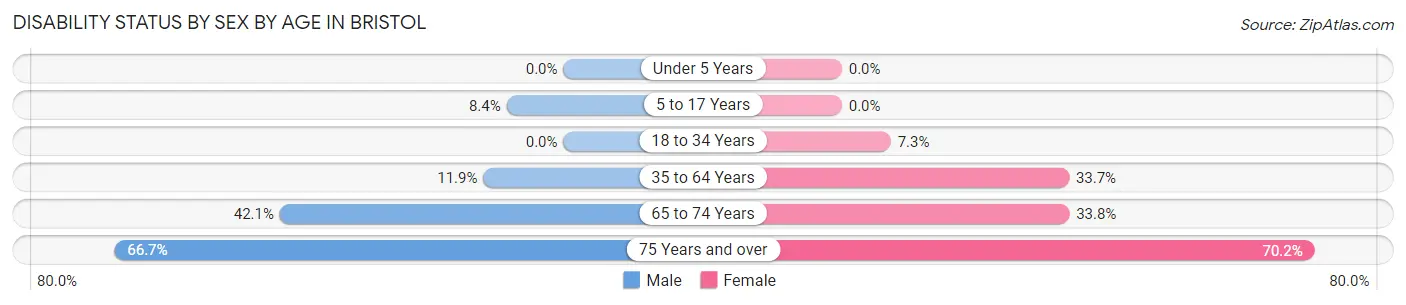
| Age Bracket | Male | Female |
| Under 5 Years | 0 (0.0%) | 0 (0.0%) |
| 5 to 17 Years | 21 (8.4%) | 0 (0.0%) |
| 18 to 34 Years | 0 (0.0%) | 13 (7.3%) |
| 35 to 64 Years | 63 (11.9%) | 143 (33.7%) |
| 65 to 74 Years | 8 (42.1%) | 26 (33.8%) |
| 75 Years and over | 16 (66.7%) | 106 (70.2%) |
Disability Class by Sex by Age in Bristol
Disability Class: Hearing Difficulty
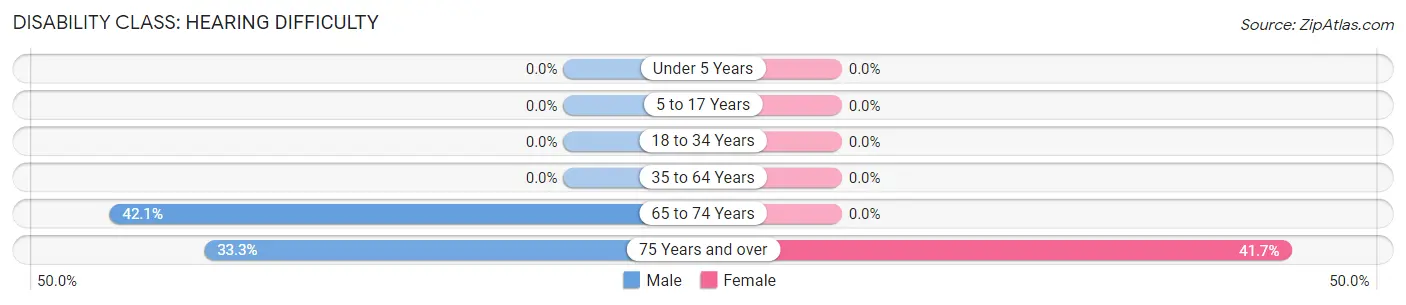
| Age Bracket | Male | Female |
| Under 5 Years | 0 (0.0%) | 0 (0.0%) |
| 5 to 17 Years | 0 (0.0%) | 0 (0.0%) |
| 18 to 34 Years | 0 (0.0%) | 0 (0.0%) |
| 35 to 64 Years | 0 (0.0%) | 0 (0.0%) |
| 65 to 74 Years | 8 (42.1%) | 0 (0.0%) |
| 75 Years and over | 8 (33.3%) | 63 (41.7%) |
Disability Class: Vision Difficulty
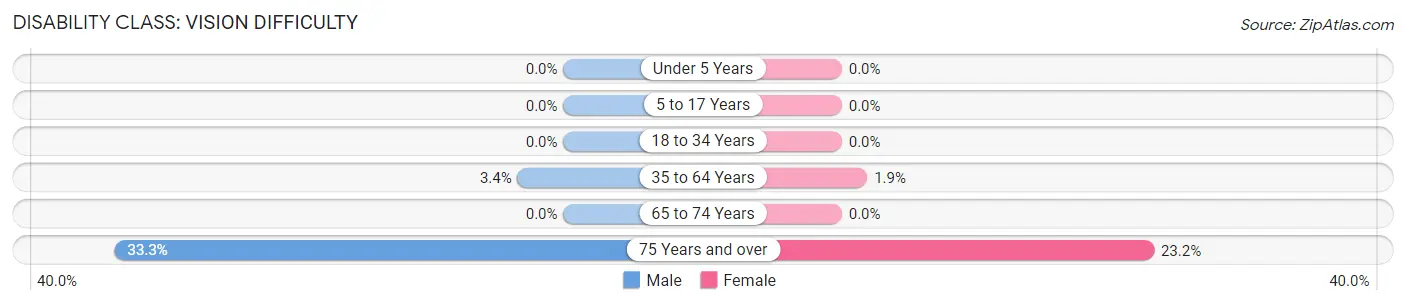
| Age Bracket | Male | Female |
| Under 5 Years | 0 (0.0%) | 0 (0.0%) |
| 5 to 17 Years | 0 (0.0%) | 0 (0.0%) |
| 18 to 34 Years | 0 (0.0%) | 0 (0.0%) |
| 35 to 64 Years | 18 (3.4%) | 8 (1.9%) |
| 65 to 74 Years | 0 (0.0%) | 0 (0.0%) |
| 75 Years and over | 8 (33.3%) | 35 (23.2%) |
Disability Class: Cognitive Difficulty
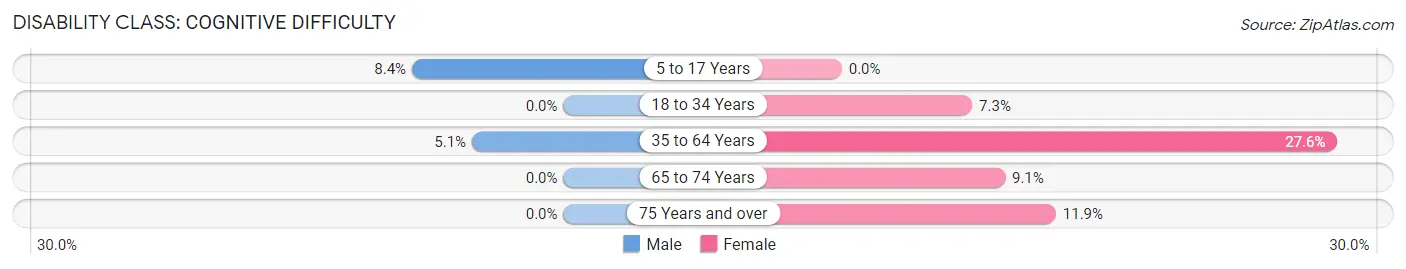
| Age Bracket | Male | Female |
| 5 to 17 Years | 21 (8.4%) | 0 (0.0%) |
| 18 to 34 Years | 0 (0.0%) | 13 (7.3%) |
| 35 to 64 Years | 27 (5.1%) | 117 (27.6%) |
| 65 to 74 Years | 0 (0.0%) | 7 (9.1%) |
| 75 Years and over | 0 (0.0%) | 18 (11.9%) |
Disability Class: Ambulatory Difficulty
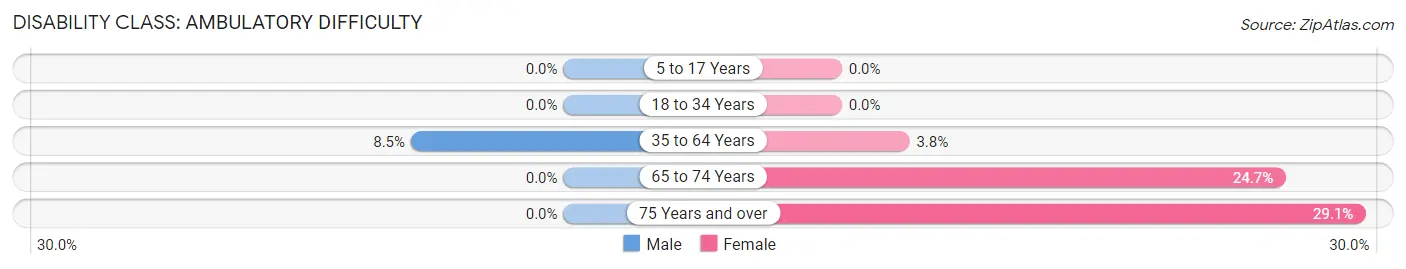
| Age Bracket | Male | Female |
| 5 to 17 Years | 0 (0.0%) | 0 (0.0%) |
| 18 to 34 Years | 0 (0.0%) | 0 (0.0%) |
| 35 to 64 Years | 45 (8.5%) | 16 (3.8%) |
| 65 to 74 Years | 0 (0.0%) | 19 (24.7%) |
| 75 Years and over | 0 (0.0%) | 44 (29.1%) |
Disability Class: Self-Care Difficulty
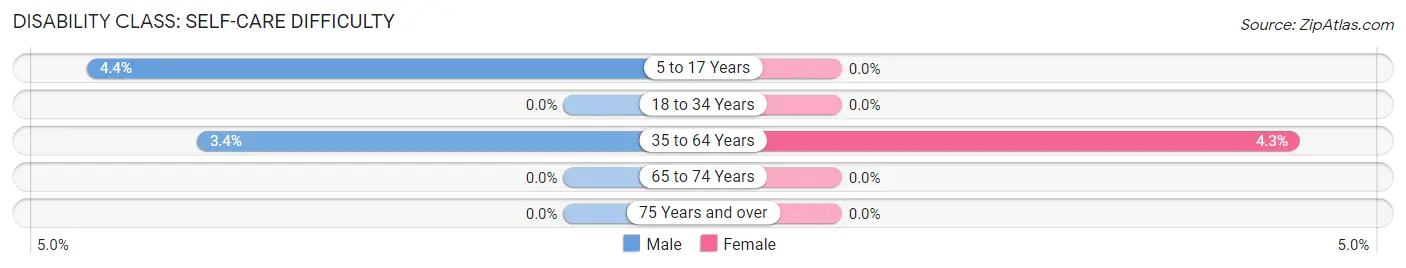
| Age Bracket | Male | Female |
| 5 to 17 Years | 11 (4.4%) | 0 (0.0%) |
| 18 to 34 Years | 0 (0.0%) | 0 (0.0%) |
| 35 to 64 Years | 18 (3.4%) | 18 (4.3%) |
| 65 to 74 Years | 0 (0.0%) | 0 (0.0%) |
| 75 Years and over | 0 (0.0%) | 0 (0.0%) |
Technology Access in Bristol
Computing Device Access in Bristol
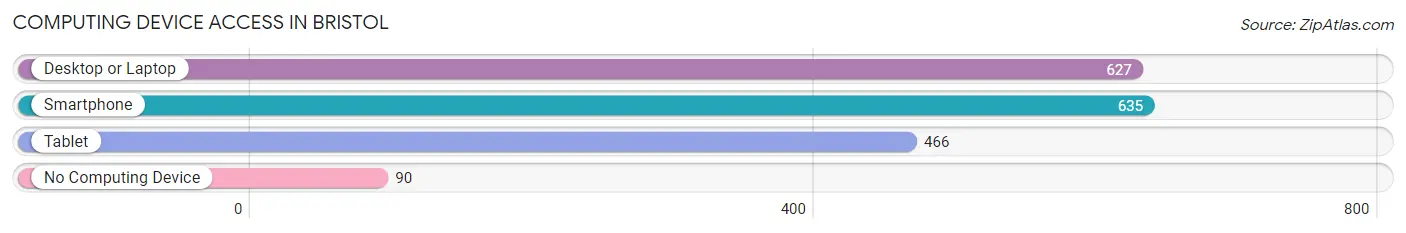
| Device Type | # Households | % Households |
| Desktop or Laptop | 627 | 80.9% |
| Smartphone | 635 | 81.9% |
| Tablet | 466 | 60.1% |
| No Computing Device | 90 | 11.6% |
| Total | 775 | 100.0% |
Internet Access in Bristol
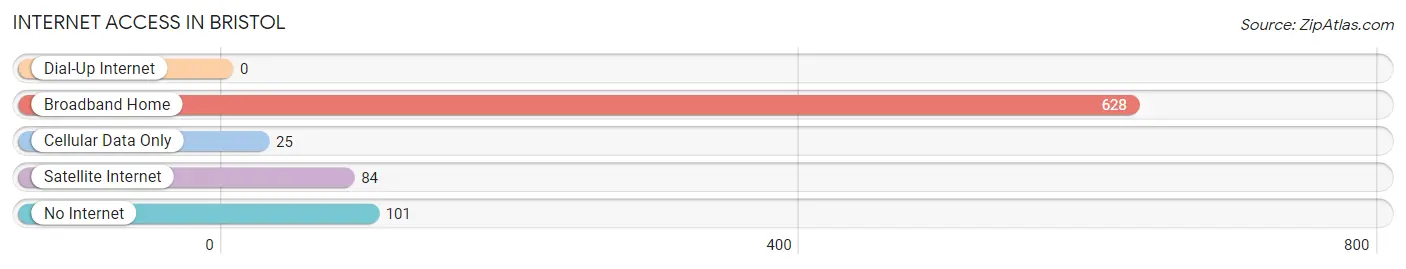
| Internet Type | # Households | % Households |
| Dial-Up Internet | 0 | 0.0% |
| Broadband Home | 628 | 81.0% |
| Cellular Data Only | 25 | 3.2% |
| Satellite Internet | 84 | 10.8% |
| No Internet | 101 | 13.0% |
| Total | 775 | 100.0% |
Bristol Summary
Bristol is a town located in Grafton County, New Hampshire, United States. The population was 3,054 at the 2010 census. It is the home of the Newfound Lake Region Association.
Geography
Bristol is located in the western part of Grafton County, bordered by the towns of Alexandria to the north, Bridgewater to the east, Hebron to the south, and Danbury to the west. The town is situated in the foothills of the White Mountains, with the highest point in town being the summit of Mount Cardigan, at 3,155 feet (962 m) above sea level. The town is drained by the Newfound River, a tributary of the Pemigewasset River.
The town center, where 1,717 people resided at the 2010 census, is defined as the Bristol census-designated place (CDP), and is located at the junction of New Hampshire routes 3A and 104.
History
The area that is now Bristol was first settled in 1764 by a group of settlers from Massachusetts. The town was incorporated in 1790, and was named after Bristol, Rhode Island.
In the 19th century, the town was a center of the granite industry, with several quarries in operation. The town was also home to several mills, including a gristmill, a sawmill, and a woolen mill.
Economy
The economy of Bristol is largely based on tourism. The town is home to several resorts, including the Newfound Lake Region Association, which offers a variety of recreational activities, including swimming, boating, fishing, and hiking. The town is also home to several restaurants, shops, and other businesses catering to tourists.
The town is also home to several manufacturing companies, including a paper mill, a plastics manufacturer, and a machine shop.
Demographics
As of the census of 2010, there were 3,054 people, 1,269 households, and 845 families residing in the town. The population density was 57.3 people per square mile (22.1/km2). There were 1,541 housing units at an average density of 28.6 per square mile (11.1/km2). The racial makeup of the town was 97.3% White, 0.3% African American, 0.3% Native American, 0.3% Asian, 0.2% from other races, and 1.5% from two or more races. Hispanic or Latino of any race were 0.7% of the population.
There were 1,269 households, out of which 28.2% had children under the age of 18 living with them, 51.2% were married couples living together, 9.7% had a female householder with no husband present, and 34.2% were non-families. 28.2% of all households were made up of individuals, and 11.7% had someone living alone who was 65 years of age or older. The average household size was 2.38 and the average family size was 2.90.
In the town, the population was spread out, with 23.2% under the age of 18, 6.2% from 18 to 24, 25.7% from 25 to 44, 28.2% from 45 to 64, and 16.7% who were 65 years of age or older. The median age was 42 years. For every 100 females, there were 97.2 males. For every 100 females age 18 and over, there were 94.2 males.
The median income for a household in the town was $41,944, and the median income for a family was $50,000. Males had a median income of $35,000 versus $25,000 for females. The per capita income for the town was $20,945. About 5.2% of families and 8.2% of the population were below the poverty line, including 10.2% of those under age 18 and 8.2% of those age 65 or over.
Common Questions
What is Per Capita Income in Bristol?
Per Capita income in Bristol is $28,260.
What is the Median Family Income in Bristol?
Median Family Income in Bristol is $78,152.
What is the Median Household income in Bristol?
Median Household Income in Bristol is $69,306.
What is Income or Wage Gap in Bristol?
Income or Wage Gap in Bristol is 67.0%.
Women in Bristol earn 33.0 cents for every dollar earned by a man.
What is Inequality or Gini Index in Bristol?
Inequality or Gini Index in Bristol is 0.35.
What is the Total Population of Bristol?
Total Population of Bristol is 2,095.
What is the Total Male Population of Bristol?
Total Male Population of Bristol is 1,010.
What is the Total Female Population of Bristol?
Total Female Population of Bristol is 1,085.
What is the Ratio of Males per 100 Females in Bristol?
There are 93.09 Males per 100 Females in Bristol.
What is the Ratio of Females per 100 Males in Bristol?
There are 107.43 Females per 100 Males in Bristol.
What is the Median Population Age in Bristol?
Median Population Age in Bristol is 39.4 Years.
What is the Average Family Size in Bristol
Average Family Size in Bristol is 3.2 People.
What is the Average Household Size in Bristol
Average Household Size in Bristol is 2.7 People.
How Large is the Labor Force in Bristol?
There are 1,048 People in the Labor Forcein in Bristol.
What is the Percentage of People in the Labor Force in Bristol?
65.2% of People are in the Labor Force in Bristol.
What is the Unemployment Rate in Bristol?
Unemployment Rate in Bristol is 2.0%.