Hubbell, MI Map & Demographics
Hubbell Map
Hubbell Overview
$29,803
PER CAPITA INCOME
$81,875
AVG FAMILY INCOME
$48,750
AVG HOUSEHOLD INCOME
3.0%
WAGE / INCOME GAP [ % ]
97.0¢/ $1
WAGE / INCOME GAP [ $ ]
0.39
INEQUALITY / GINI INDEX
769
TOTAL POPULATION
434
MALE POPULATION
335
FEMALE POPULATION
129.55
MALES / 100 FEMALES
77.19
FEMALES / 100 MALES
45.1
MEDIAN AGE
2.8
AVG FAMILY SIZE
2.0
AVG HOUSEHOLD SIZE
421
LABOR FORCE [ PEOPLE ]
65.3%
PERCENT IN LABOR FORCE
Hubbell Zip Codes
Hubbell Area Codes
Income in Hubbell
Income Overview in Hubbell
Per Capita Income in Hubbell is $29,803, while median incomes of families and households are $81,875 and $48,750 respectively.
| Characteristic | Number | Measure |
| Per Capita Income | 769 | $29,803 |
| Median Family Income | 178 | $81,875 |
| Mean Family Income | 178 | $89,365 |
| Median Household Income | 351 | $48,750 |
| Mean Household Income | 351 | $62,754 |
| Income Deficit | 178 | $0 |
| Wage / Income Gap (%) | 769 | 2.98% |
| Wage / Income Gap ($) | 769 | 97.02¢ per $1 |
| Gini / Inequality Index | 769 | 0.39 |
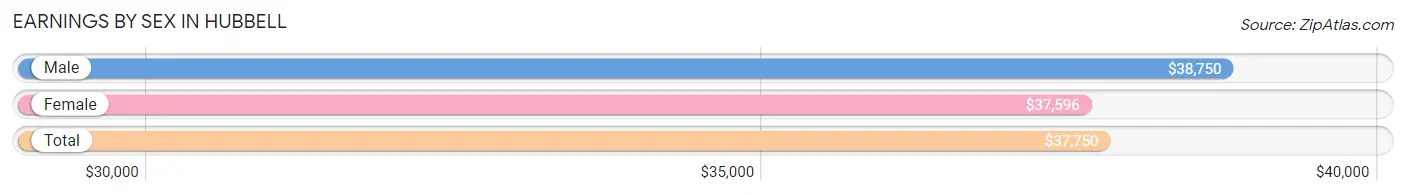
Earnings by Sex in Hubbell
Average Earnings in Hubbell are $37,750, $38,750 for men and $37,596 for women, a difference of 3.0%.
| Sex | Number | Average Earnings |
| Male | 236 (53.8%) | $38,750 |
| Female | 203 (46.2%) | $37,596 |
| Total | 439 (100.0%) | $37,750 |
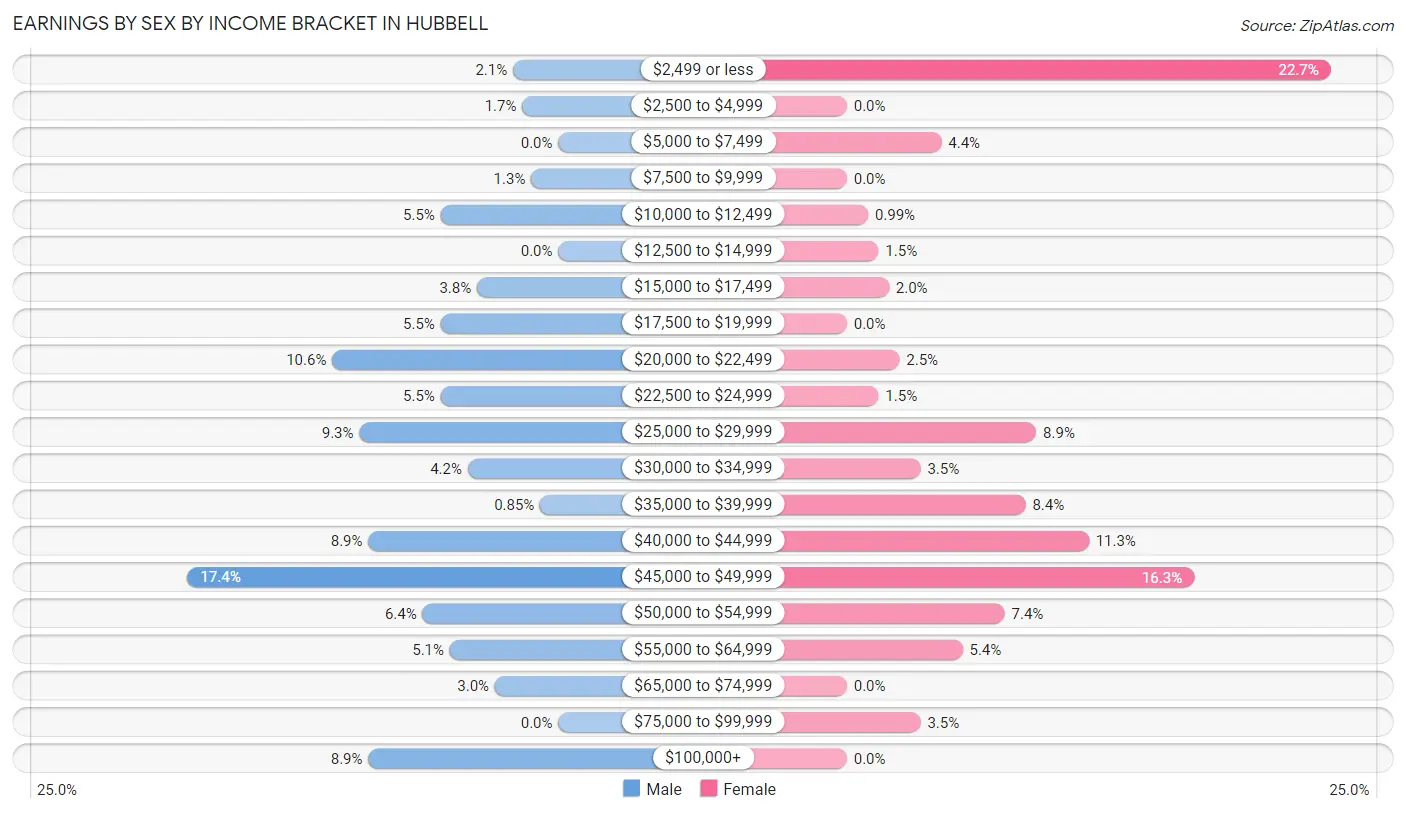
Earnings by Sex by Income Bracket in Hubbell
The most common earnings brackets in Hubbell are $45,000 to $49,999 for men (41 | 17.4%) and $2,499 or less for women (46 | 22.7%).
| Income | Male | Female |
| $2,499 or less | 5 (2.1%) | 46 (22.7%) |
| $2,500 to $4,999 | 4 (1.7%) | 0 (0.0%) |
| $5,000 to $7,499 | 0 (0.0%) | 9 (4.4%) |
| $7,500 to $9,999 | 3 (1.3%) | 0 (0.0%) |
| $10,000 to $12,499 | 13 (5.5%) | 2 (1.0%) |
| $12,500 to $14,999 | 0 (0.0%) | 3 (1.5%) |
| $15,000 to $17,499 | 9 (3.8%) | 4 (2.0%) |
| $17,500 to $19,999 | 13 (5.5%) | 0 (0.0%) |
| $20,000 to $22,499 | 25 (10.6%) | 5 (2.5%) |
| $22,500 to $24,999 | 13 (5.5%) | 3 (1.5%) |
| $25,000 to $29,999 | 22 (9.3%) | 18 (8.9%) |
| $30,000 to $34,999 | 10 (4.2%) | 7 (3.5%) |
| $35,000 to $39,999 | 2 (0.9%) | 17 (8.4%) |
| $40,000 to $44,999 | 21 (8.9%) | 23 (11.3%) |
| $45,000 to $49,999 | 41 (17.4%) | 33 (16.3%) |
| $50,000 to $54,999 | 15 (6.4%) | 15 (7.4%) |
| $55,000 to $64,999 | 12 (5.1%) | 11 (5.4%) |
| $65,000 to $74,999 | 7 (3.0%) | 0 (0.0%) |
| $75,000 to $99,999 | 0 (0.0%) | 7 (3.5%) |
| $100,000+ | 21 (8.9%) | 0 (0.0%) |
| Total | 236 (100.0%) | 203 (100.0%) |
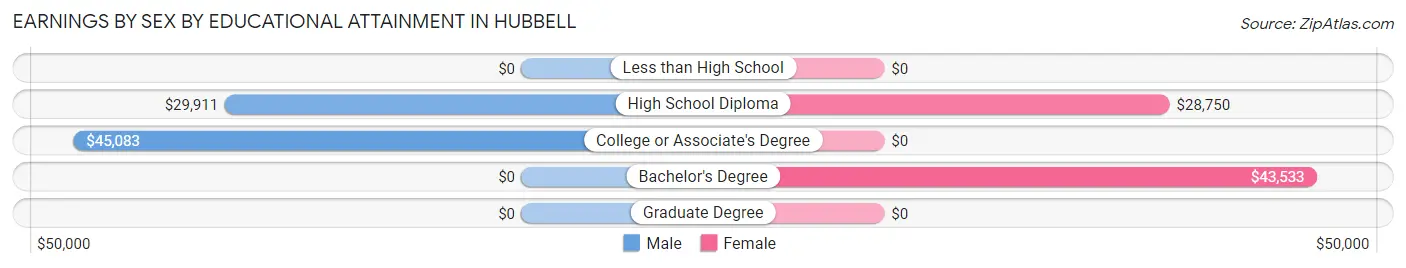
Earnings by Sex by Educational Attainment in Hubbell
Average earnings in Hubbell are $44,135 for men and $38,462 for women, a difference of 12.9%. Men with an educational attainment of college or associate's degree enjoy the highest average annual earnings of $45,083, while those with high school diploma education earn the least with $29,911. Women with an educational attainment of bachelor's degree earn the most with the average annual earnings of $43,533, while those with high school diploma education have the smallest earnings of $28,750.
| Educational Attainment | Male Income | Female Income |
| Less than High School | - | - |
| High School Diploma | $29,911 | $28,750 |
| College or Associate's Degree | $45,083 | $0 |
| Bachelor's Degree | - | - |
| Graduate Degree | - | - |
| Total | $44,135 | $38,462 |
Family Income in Hubbell
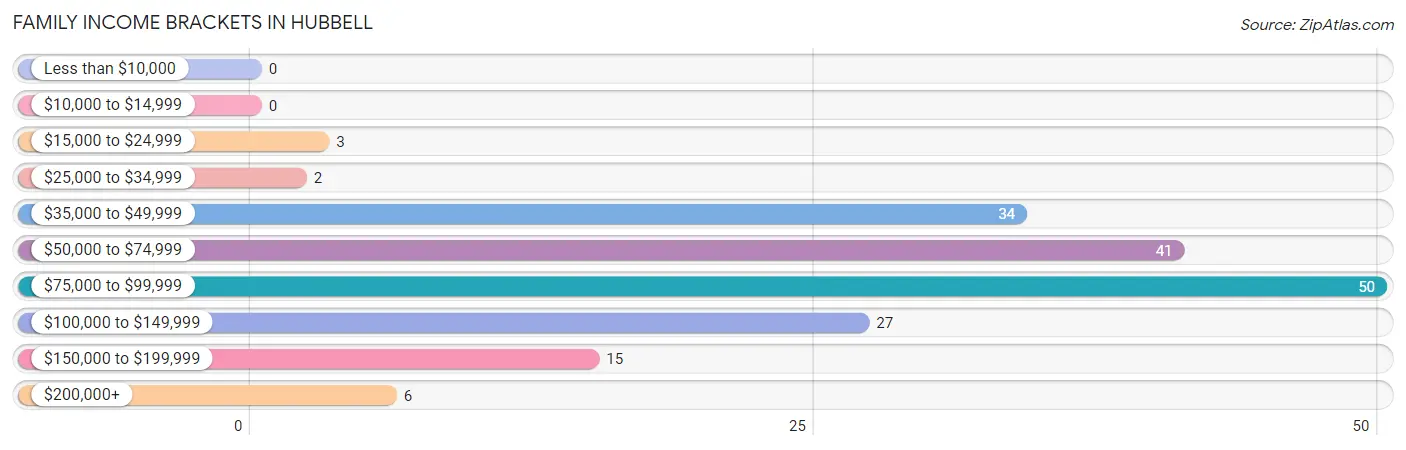
Family Income Brackets in Hubbell
According to the Hubbell family income data, there are 50 families falling into the $75,000 to $99,999 income range, which is the most common income bracket and makes up 28.1% of all families.
| Income Bracket | # Families | % Families |
| Less than $10,000 | 0 | 0.0% |
| $10,000 to $14,999 | 0 | 0.0% |
| $15,000 to $24,999 | 3 | 1.7% |
| $25,000 to $34,999 | 2 | 1.1% |
| $35,000 to $49,999 | 34 | 19.1% |
| $50,000 to $74,999 | 41 | 23.0% |
| $75,000 to $99,999 | 50 | 28.1% |
| $100,000 to $149,999 | 27 | 15.2% |
| $150,000 to $199,999 | 15 | 8.4% |
| $200,000+ | 6 | 3.4% |
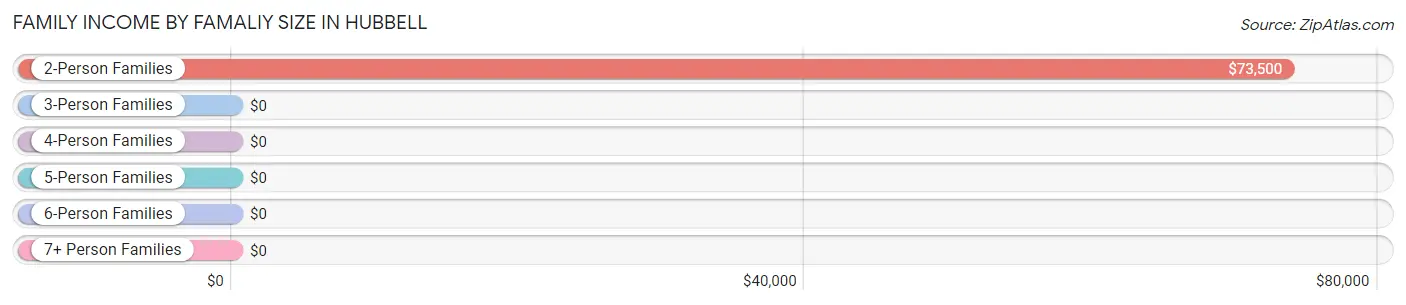
Family Income by Famaliy Size in Hubbell
2-person families (108 | 60.7%) account for the highest median family income in Hubbell with $73,500 per family, while 2-person families (108 | 60.7%) have the highest median income of $36,750 per family member.
| Income Bracket | # Families | Median Income |
| 2-Person Families | 108 (60.7%) | $73,500 |
| 3-Person Families | 19 (10.7%) | $0 |
| 4-Person Families | 28 (15.7%) | $0 |
| 5-Person Families | 10 (5.6%) | $0 |
| 6-Person Families | 13 (7.3%) | $0 |
| 7+ Person Families | 0 (0.0%) | $0 |
| Total | 178 (100.0%) | $81,875 |
Family Income by Number of Earners in Hubbell
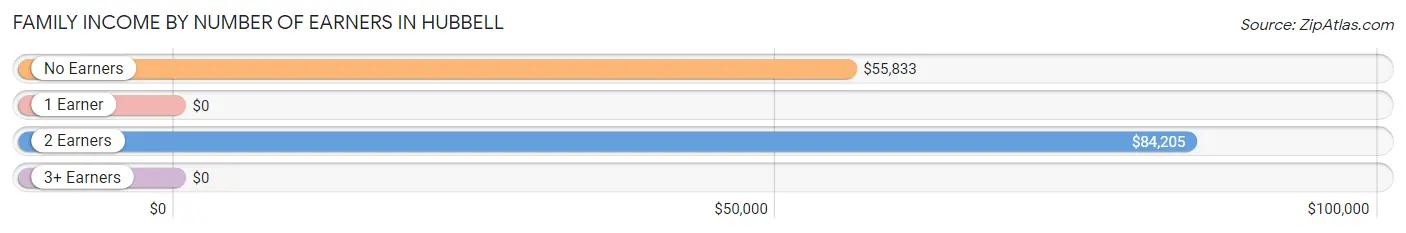
| Number of Earners | # Families | Median Income |
| No Earners | 28 (15.7%) | $55,833 |
| 1 Earner | 30 (16.9%) | $0 |
| 2 Earners | 113 (63.5%) | $84,205 |
| 3+ Earners | 7 (3.9%) | $0 |
| Total | 178 (100.0%) | $81,875 |
Household Income in Hubbell
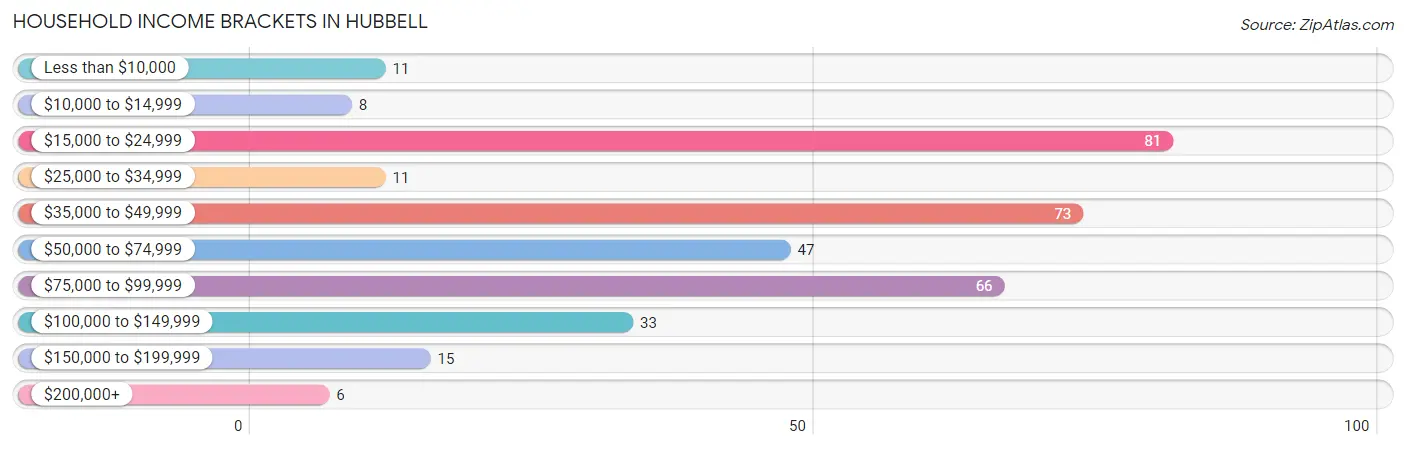
Household Income Brackets in Hubbell
With 81 households falling in the category, the $15,000 to $24,999 income range is the most frequent in Hubbell, accounting for 23.1% of all households. In contrast, only 6 households (1.7%) fall into the $200,000+ income bracket, making it the least populous group.
| Income Bracket | # Households | % Households |
| Less than $10,000 | 11 | 3.1% |
| $10,000 to $14,999 | 8 | 2.3% |
| $15,000 to $24,999 | 81 | 23.1% |
| $25,000 to $34,999 | 11 | 3.1% |
| $35,000 to $49,999 | 73 | 20.8% |
| $50,000 to $74,999 | 47 | 13.4% |
| $75,000 to $99,999 | 66 | 18.8% |
| $100,000 to $149,999 | 33 | 9.4% |
| $150,000 to $199,999 | 15 | 4.3% |
| $200,000+ | 6 | 1.7% |
Household Income by Householder Age in Hubbell
The median household income in Hubbell is $48,750, with the highest median household income of $79,659 found in the 25 to 44 years age bracket for the primary householder. A total of 101 households (28.8%) fall into this category. Meanwhile, the 15 to 24 years age bracket for the primary householder has the lowest median household income of $0, with 8 households (2.3%) in this group.
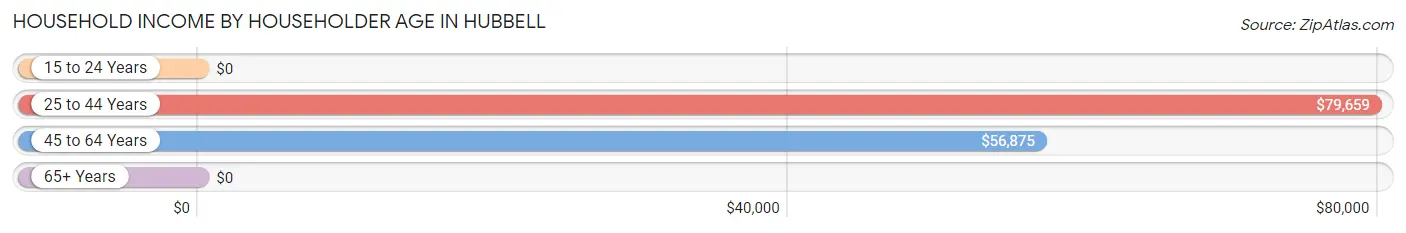
| Income Bracket | # Households | Median Income |
| 15 to 24 Years | 8 (2.3%) | $0 |
| 25 to 44 Years | 101 (28.8%) | $79,659 |
| 45 to 64 Years | 121 (34.5%) | $56,875 |
| 65+ Years | 121 (34.5%) | $0 |
| Total | 351 (100.0%) | $48,750 |
Poverty in Hubbell
Income Below Poverty by Sex and Age in Hubbell
With 4.6% poverty level for males and 7.1% for females among the residents of Hubbell, 75 year old and over males and 18 to 24 year old females are the most vulnerable to poverty, with 3 males (23.1%) and 9 females (100.0%) in their respective age groups living below the poverty level.
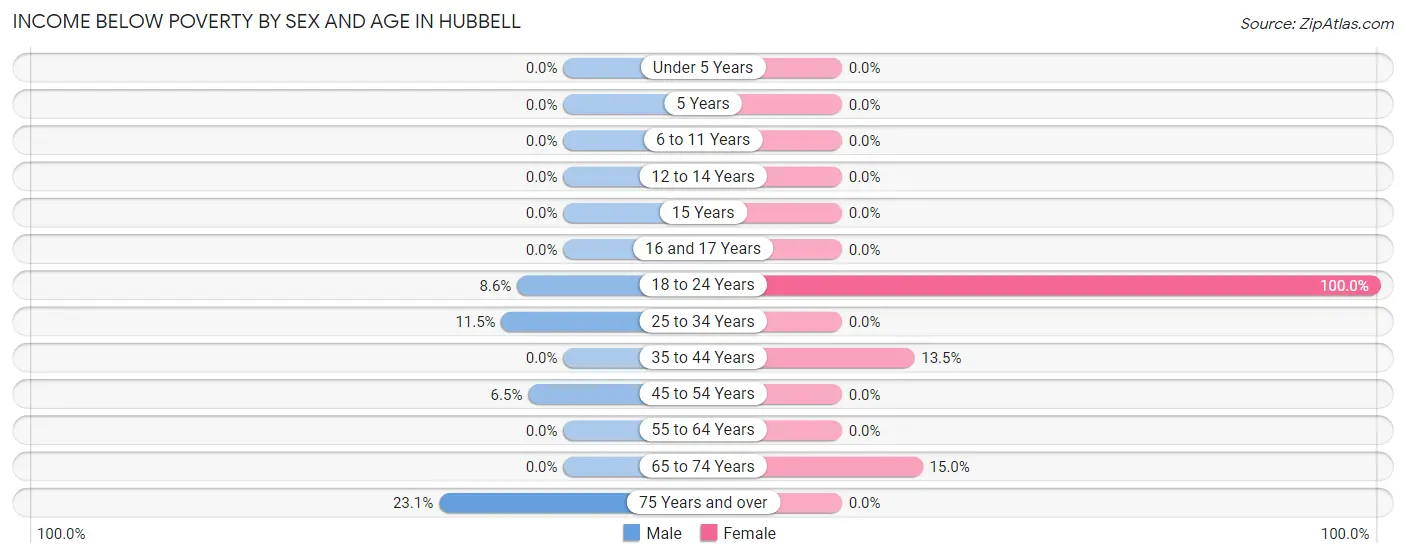
| Age Bracket | Male | Female |
| Under 5 Years | 0 (0.0%) | 0 (0.0%) |
| 5 Years | 0 (0.0%) | 0 (0.0%) |
| 6 to 11 Years | 0 (0.0%) | 0 (0.0%) |
| 12 to 14 Years | 0 (0.0%) | 0 (0.0%) |
| 15 Years | 0 (0.0%) | 0 (0.0%) |
| 16 and 17 Years | 0 (0.0%) | 0 (0.0%) |
| 18 to 24 Years | 3 (8.6%) | 9 (100.0%) |
| 25 to 34 Years | 10 (11.5%) | 0 (0.0%) |
| 35 to 44 Years | 0 (0.0%) | 7 (13.5%) |
| 45 to 54 Years | 3 (6.5%) | 0 (0.0%) |
| 55 to 64 Years | 0 (0.0%) | 0 (0.0%) |
| 65 to 74 Years | 0 (0.0%) | 6 (15.0%) |
| 75 Years and over | 3 (23.1%) | 0 (0.0%) |
| Total | 19 (4.6%) | 22 (7.1%) |
Income Above Poverty by Sex and Age in Hubbell
According to the poverty statistics in Hubbell, males aged under 5 years and females aged 6 to 11 years are the age groups that are most secure financially, with 100.0% of males and 100.0% of females in these age groups living above the poverty line.
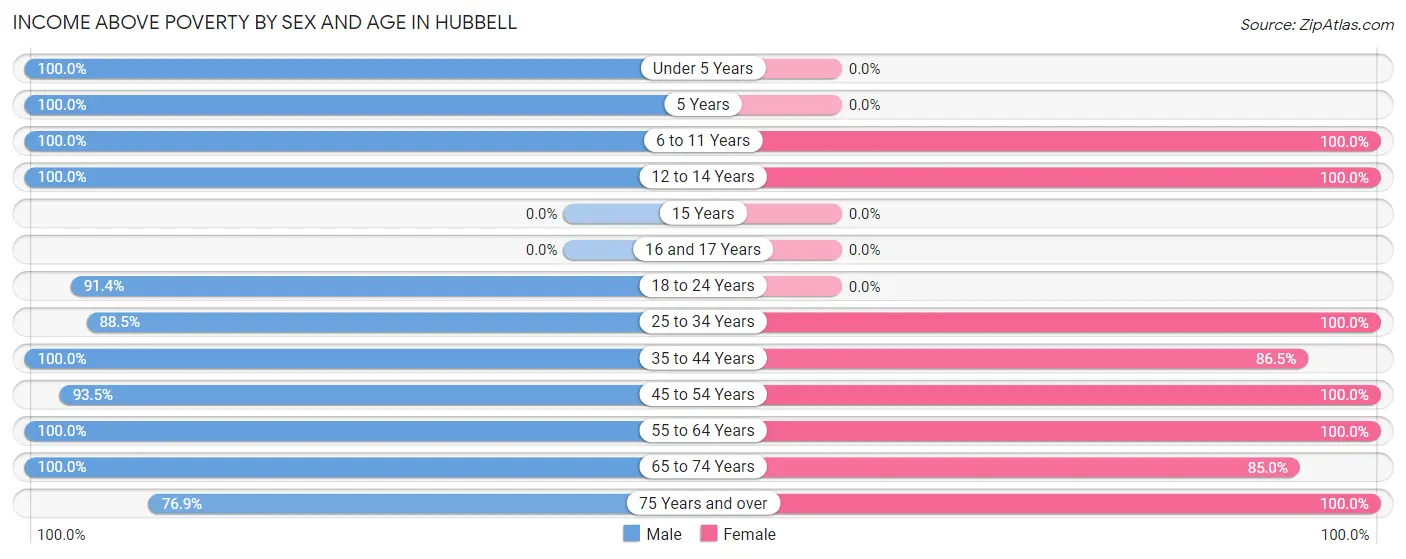
| Age Bracket | Male | Female |
| Under 5 Years | 16 (100.0%) | 0 (0.0%) |
| 5 Years | 7 (100.0%) | 0 (0.0%) |
| 6 to 11 Years | 42 (100.0%) | 18 (100.0%) |
| 12 to 14 Years | 27 (100.0%) | 14 (100.0%) |
| 15 Years | 0 (0.0%) | 0 (0.0%) |
| 16 and 17 Years | 0 (0.0%) | 0 (0.0%) |
| 18 to 24 Years | 32 (91.4%) | 0 (0.0%) |
| 25 to 34 Years | 77 (88.5%) | 38 (100.0%) |
| 35 to 44 Years | 39 (100.0%) | 45 (86.5%) |
| 45 to 54 Years | 43 (93.5%) | 33 (100.0%) |
| 55 to 64 Years | 40 (100.0%) | 58 (100.0%) |
| 65 to 74 Years | 60 (100.0%) | 34 (85.0%) |
| 75 Years and over | 10 (76.9%) | 49 (100.0%) |
| Total | 393 (95.4%) | 289 (92.9%) |
Income Below Poverty Among Married-Couple Families in Hubbell
The poverty statistics for married-couple families in Hubbell show that 1.8% or 3 of the total 165 families live below the poverty line. Families with no children have the highest poverty rate of 2.9%, comprising of 3 families. On the other hand, families with 1 or 2 children have the lowest poverty rate of 0.0%, which includes 0 families.
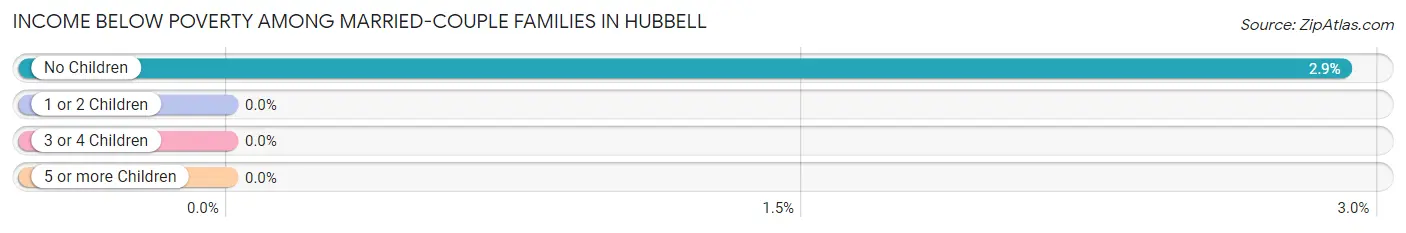
| Children | Above Poverty | Below Poverty |
| No Children | 100 (97.1%) | 3 (2.9%) |
| 1 or 2 Children | 39 (100.0%) | 0 (0.0%) |
| 3 or 4 Children | 23 (100.0%) | 0 (0.0%) |
| 5 or more Children | 0 (0.0%) | 0 (0.0%) |
| Total | 162 (98.2%) | 3 (1.8%) |
Income Below Poverty Among Single-Parent Households in Hubbell
| Children | Single Father | Single Mother |
| No Children | 0 (0.0%) | 0 (0.0%) |
| 1 or 2 Children | 0 (0.0%) | 0 (0.0%) |
| 3 or 4 Children | 0 (0.0%) | 0 (0.0%) |
| 5 or more Children | 0 (0.0%) | 0 (0.0%) |
| Total | 0 (0.0%) | 0 (0.0%) |
Income Below Poverty Among Married-Couple vs Single-Parent Households in Hubbell
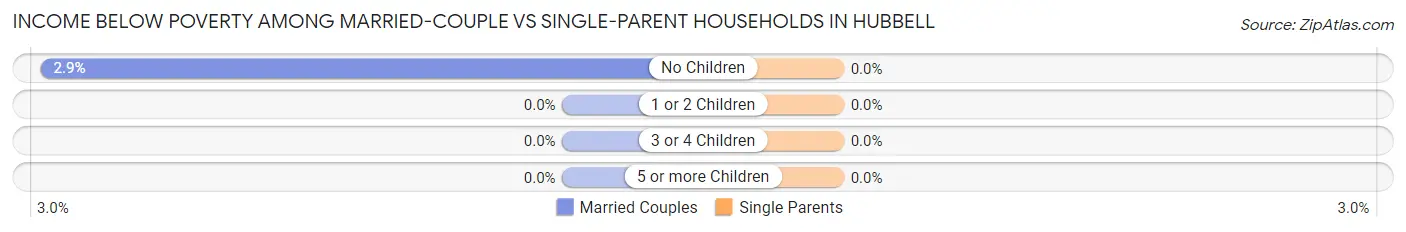
| Children | Married-Couple Families | Single-Parent Households |
| No Children | 3 (2.9%) | 0 (0.0%) |
| 1 or 2 Children | 0 (0.0%) | 0 (0.0%) |
| 3 or 4 Children | 0 (0.0%) | 0 (0.0%) |
| 5 or more Children | 0 (0.0%) | 0 (0.0%) |
| Total | 3 (1.8%) | 0 (0.0%) |
Race in Hubbell
The most populous races in Hubbell are White / Caucasian (733 | 95.3%), Two or more Races (16 | 2.1%), and Asian (10 | 1.3%).
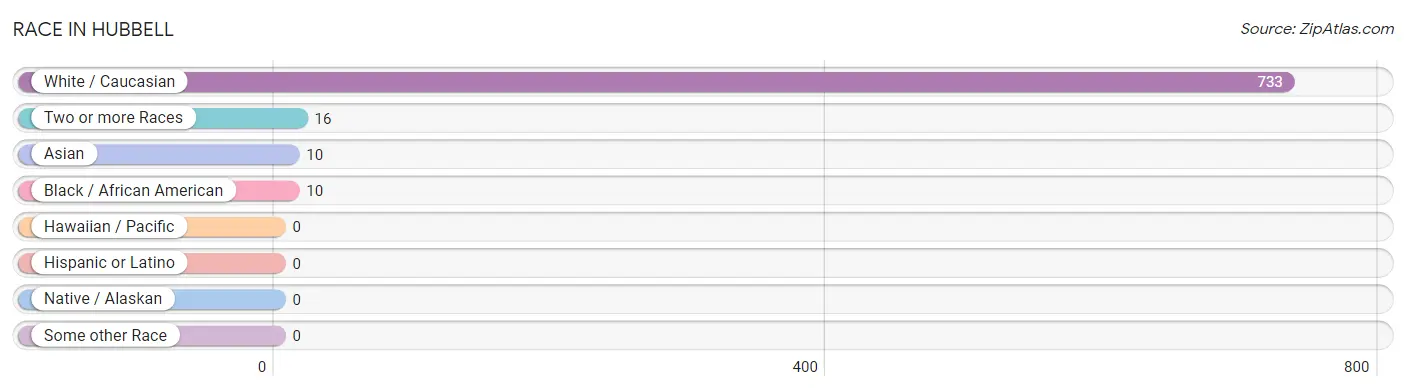
| Race | # Population | % Population |
| Asian | 10 | 1.3% |
| Black / African American | 10 | 1.3% |
| Hawaiian / Pacific | 0 | 0.0% |
| Hispanic or Latino | 0 | 0.0% |
| Native / Alaskan | 0 | 0.0% |
| White / Caucasian | 733 | 95.3% |
| Two or more Races | 16 | 2.1% |
| Some other Race | 0 | 0.0% |
| Total | 769 | 100.0% |
Ancestry in Hubbell
The most populous ancestries reported in Hubbell are Finnish (272 | 35.4%), German (148 | 19.3%), English (123 | 16.0%), French (94 | 12.2%), and French Canadian (77 | 10.0%), together accounting for 92.8% of all Hubbell residents.
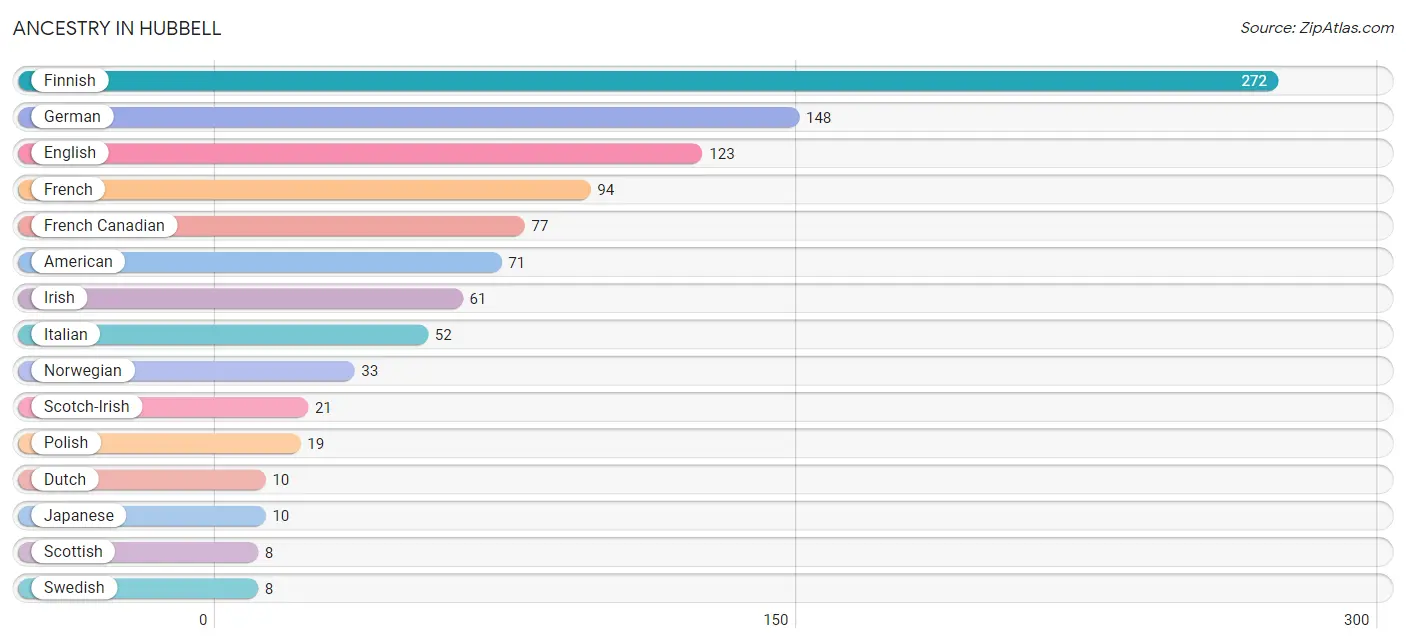
| Ancestry | # Population | % Population |
| African | 5 | 0.6% |
| American | 71 | 9.2% |
| British | 5 | 0.6% |
| Croatian | 5 | 0.6% |
| Dutch | 10 | 1.3% |
| Eastern European | 3 | 0.4% |
| English | 123 | 16.0% |
| European | 5 | 0.6% |
| Finnish | 272 | 35.4% |
| French | 94 | 12.2% |
| French Canadian | 77 | 10.0% |
| German | 148 | 19.3% |
| Irish | 61 | 7.9% |
| Italian | 52 | 6.8% |
| Japanese | 10 | 1.3% |
| Norwegian | 33 | 4.3% |
| Polish | 19 | 2.5% |
| Portuguese | 4 | 0.5% |
| Scotch-Irish | 21 | 2.7% |
| Scottish | 8 | 1.0% |
| Subsaharan African | 5 | 0.6% |
| Swedish | 8 | 1.0% |
| Swiss | 5 | 0.6% |
| Welsh | 8 | 1.0% | View All 24 Rows |
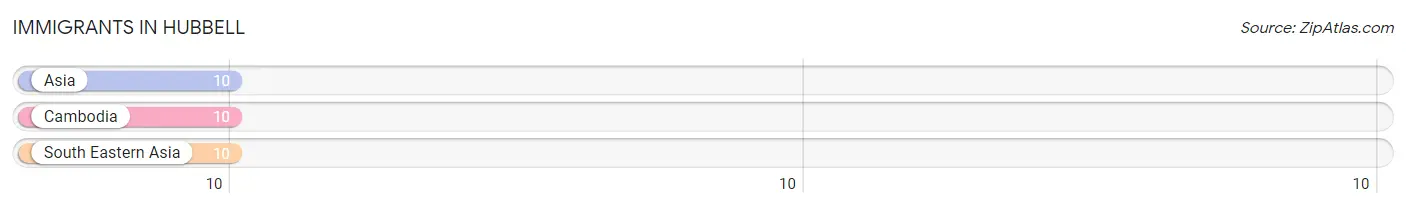
Immigrants in Hubbell
The most numerous immigrant groups reported in Hubbell came from Asia (10 | 1.3%), Cambodia (10 | 1.3%), and South Eastern Asia (10 | 1.3%), together accounting for 3.9% of all Hubbell residents.
| Immigration Origin | # Population | % Population |
| Asia | 10 | 1.3% |
| Cambodia | 10 | 1.3% |
| South Eastern Asia | 10 | 1.3% | View All 3 Rows |
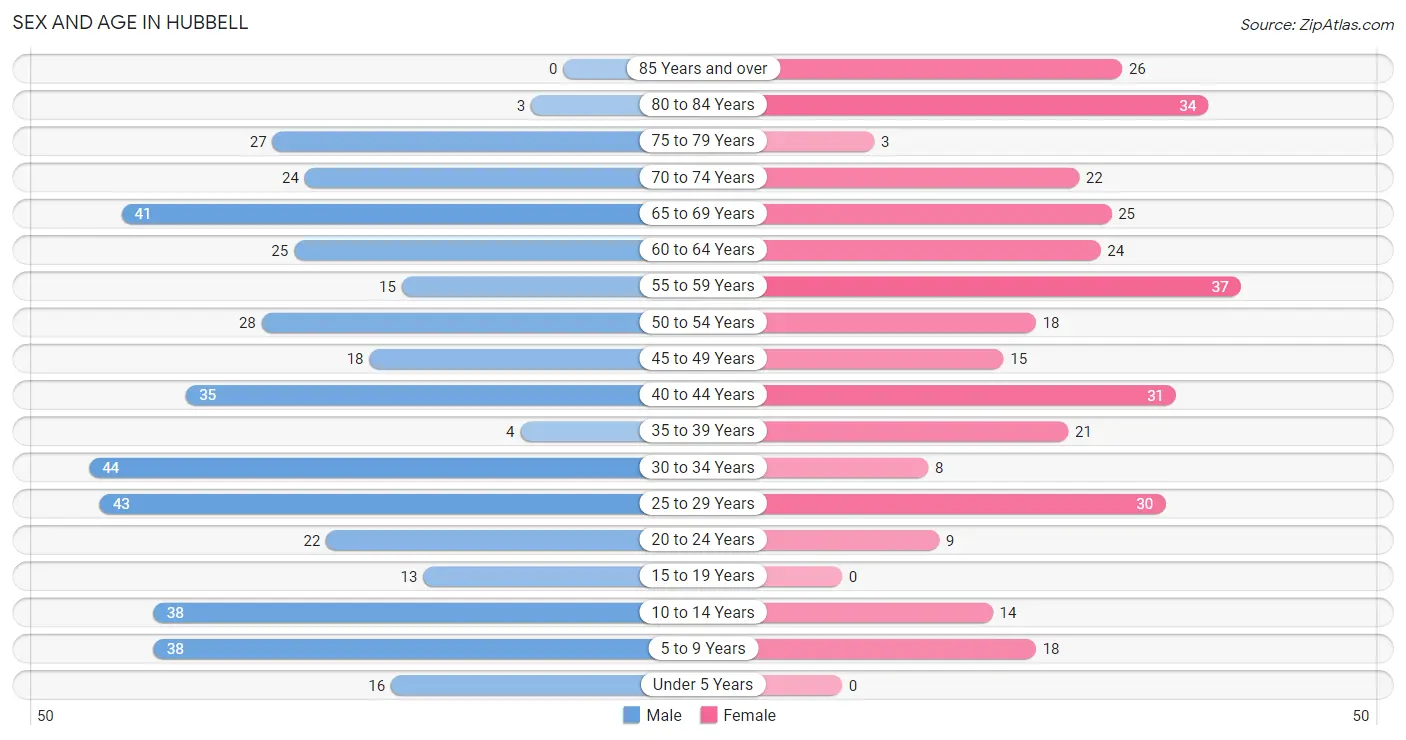
Sex and Age in Hubbell
Sex and Age in Hubbell
The most populous age groups in Hubbell are 30 to 34 Years (44 | 10.1%) for men and 55 to 59 Years (37 | 11.0%) for women.
| Age Bracket | Male | Female |
| Under 5 Years | 16 (3.7%) | 0 (0.0%) |
| 5 to 9 Years | 38 (8.8%) | 18 (5.4%) |
| 10 to 14 Years | 38 (8.8%) | 14 (4.2%) |
| 15 to 19 Years | 13 (3.0%) | 0 (0.0%) |
| 20 to 24 Years | 22 (5.1%) | 9 (2.7%) |
| 25 to 29 Years | 43 (9.9%) | 30 (9.0%) |
| 30 to 34 Years | 44 (10.1%) | 8 (2.4%) |
| 35 to 39 Years | 4 (0.9%) | 21 (6.3%) |
| 40 to 44 Years | 35 (8.1%) | 31 (9.2%) |
| 45 to 49 Years | 18 (4.2%) | 15 (4.5%) |
| 50 to 54 Years | 28 (6.5%) | 18 (5.4%) |
| 55 to 59 Years | 15 (3.5%) | 37 (11.0%) |
| 60 to 64 Years | 25 (5.8%) | 24 (7.2%) |
| 65 to 69 Years | 41 (9.5%) | 25 (7.5%) |
| 70 to 74 Years | 24 (5.5%) | 22 (6.6%) |
| 75 to 79 Years | 27 (6.2%) | 3 (0.9%) |
| 80 to 84 Years | 3 (0.7%) | 34 (10.2%) |
| 85 Years and over | 0 (0.0%) | 26 (7.8%) |
| Total | 434 (100.0%) | 335 (100.0%) |
Families and Households in Hubbell
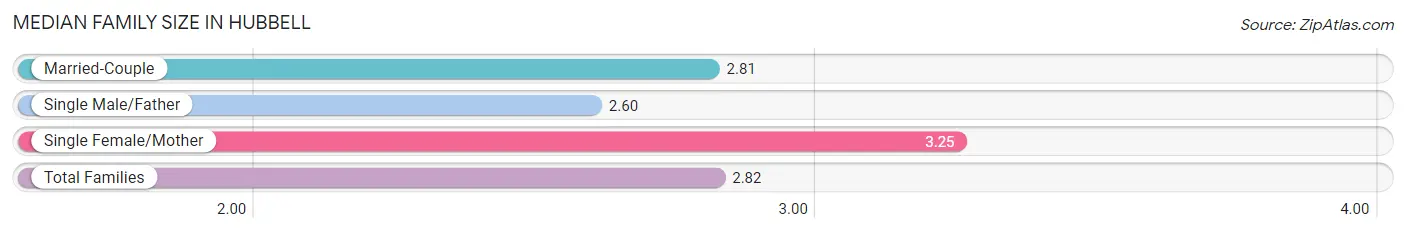
Median Family Size in Hubbell
The median family size in Hubbell is 2.82 persons per family, with single female/mother families (8 | 4.5%) accounting for the largest median family size of 3.25 persons per family. On the other hand, single male/father families (5 | 2.8%) represent the smallest median family size with 2.60 persons per family.
| Family Type | # Families | Family Size |
| Married-Couple | 165 (92.7%) | 2.81 |
| Single Male/Father | 5 (2.8%) | 2.60 |
| Single Female/Mother | 8 (4.5%) | 3.25 |
| Total Families | 178 (100.0%) | 2.82 |
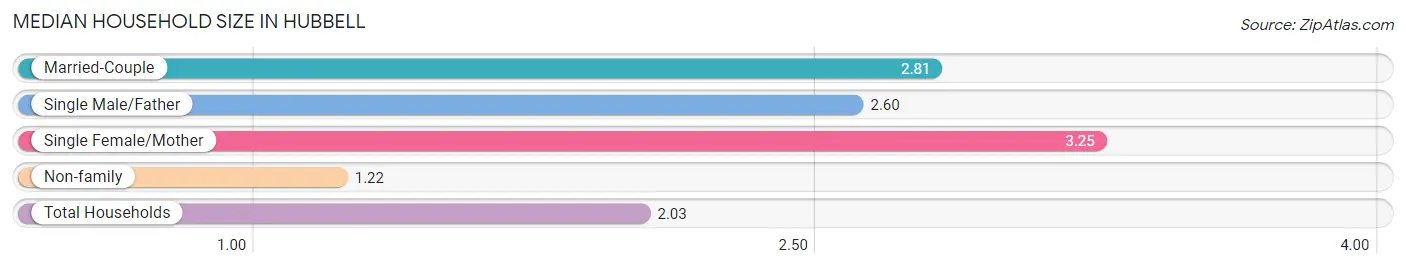
Median Household Size in Hubbell
The median household size in Hubbell is 2.03 persons per household, with single female/mother households (8 | 2.3%) accounting for the largest median household size of 3.25 persons per household. non-family households (173 | 49.3%) represent the smallest median household size with 1.22 persons per household.
| Household Type | # Households | Household Size |
| Married-Couple | 165 (47.0%) | 2.81 |
| Single Male/Father | 5 (1.4%) | 2.60 |
| Single Female/Mother | 8 (2.3%) | 3.25 |
| Non-family | 173 (49.3%) | 1.22 |
| Total Households | 351 (100.0%) | 2.03 |
Household Size by Marriage Status in Hubbell
Out of a total of 351 households in Hubbell, 178 (50.7%) are family households, while 173 (49.3%) are nonfamily households. The most numerous type of family households are 2-person households, comprising 108, and the most common type of nonfamily households are 1-person households, comprising 137.
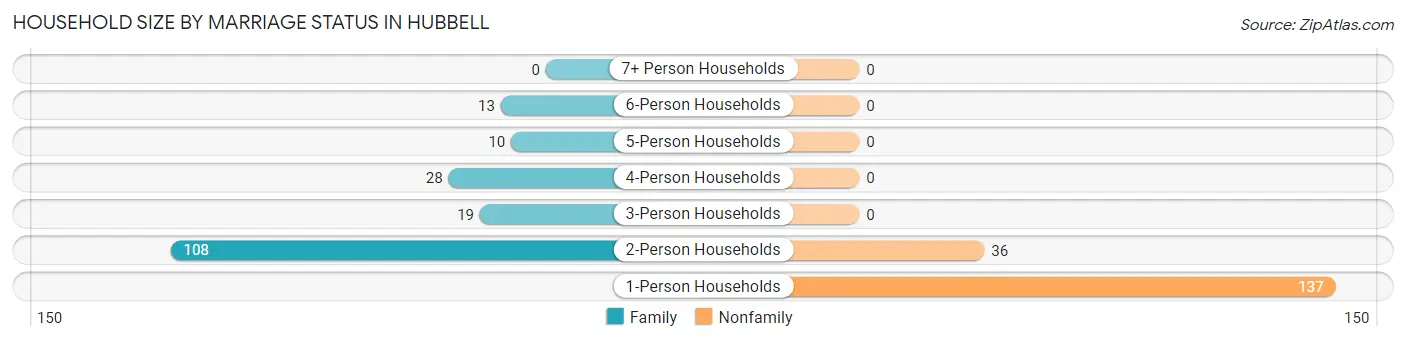
| Household Size | Family Households | Nonfamily Households |
| 1-Person Households | - | 137 (39.0%) |
| 2-Person Households | 108 (30.8%) | 36 (10.3%) |
| 3-Person Households | 19 (5.4%) | 0 (0.0%) |
| 4-Person Households | 28 (8.0%) | 0 (0.0%) |
| 5-Person Households | 10 (2.9%) | 0 (0.0%) |
| 6-Person Households | 13 (3.7%) | 0 (0.0%) |
| 7+ Person Households | 0 (0.0%) | 0 (0.0%) |
| Total | 178 (50.7%) | 173 (49.3%) |
Female Fertility in Hubbell
Fertility by Age in Hubbell
| Age Bracket | Women with Births | Births / 1,000 Women |
| 15 to 19 years | 0 (0.0%) | 0.0 |
| 20 to 34 years | 0 (0.0%) | 0.0 |
| 35 to 50 years | 0 (0.0%) | 0.0 |
| Total | 0 (0.0%) | 0.0 |
Fertility by Age by Marriage Status in Hubbell
| Age Bracket | Married | Unmarried |
| 15 to 19 years | 0 (0.0%) | 0 (0.0%) |
| 20 to 34 years | 0 (0.0%) | 0 (0.0%) |
| 35 to 50 years | 0 (0.0%) | 0 (0.0%) |
| Total | 0 (0.0%) | 0 (0.0%) |
Fertility by Education in Hubbell
| Educational Attainment | Women with Births | Births / 1,000 Women |
| Less than High School | 0 (0.0%) | 0.0 |
| High School Diploma | 0 (0.0%) | 0.0 |
| College or Associate's Degree | 0 (0.0%) | 0.0 |
| Bachelor's Degree | 0 (0.0%) | 0.0 |
| Graduate Degree | 0 (0.0%) | 0.0 |
| Total | 0 (0.0%) | 0.0 |
Fertility by Education by Marriage Status in Hubbell
| Educational Attainment | Married | Unmarried |
| Less than High School | 0 (0.0%) | 0 (0.0%) |
| High School Diploma | 0 (0.0%) | 0 (0.0%) |
| College or Associate's Degree | 0 (0.0%) | 0 (0.0%) |
| Bachelor's Degree | 0 (0.0%) | 0 (0.0%) |
| Graduate Degree | 0 (0.0%) | 0 (0.0%) |
| Total | 0 (0.0%) | 0 (0.0%) |
Employment Characteristics in Hubbell
Employment by Class of Employer in Hubbell
Among the 415 employed individuals in Hubbell, private company employees (271 | 65.3%), not-for-profit organizations (74 | 17.8%), and local government employees (34 | 8.2%) make up the most common classes of employment.
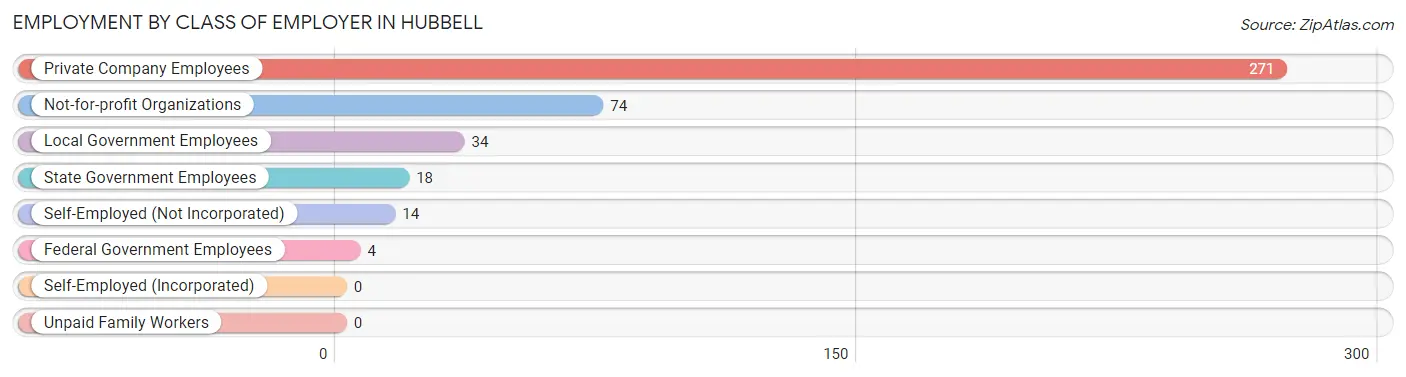
| Employer Class | # Employees | % Employees |
| Private Company Employees | 271 | 65.3% |
| Self-Employed (Incorporated) | 0 | 0.0% |
| Self-Employed (Not Incorporated) | 14 | 3.4% |
| Not-for-profit Organizations | 74 | 17.8% |
| Local Government Employees | 34 | 8.2% |
| State Government Employees | 18 | 4.3% |
| Federal Government Employees | 4 | 1.0% |
| Unpaid Family Workers | 0 | 0.0% |
| Total | 415 | 100.0% |
Employment Status by Age in Hubbell
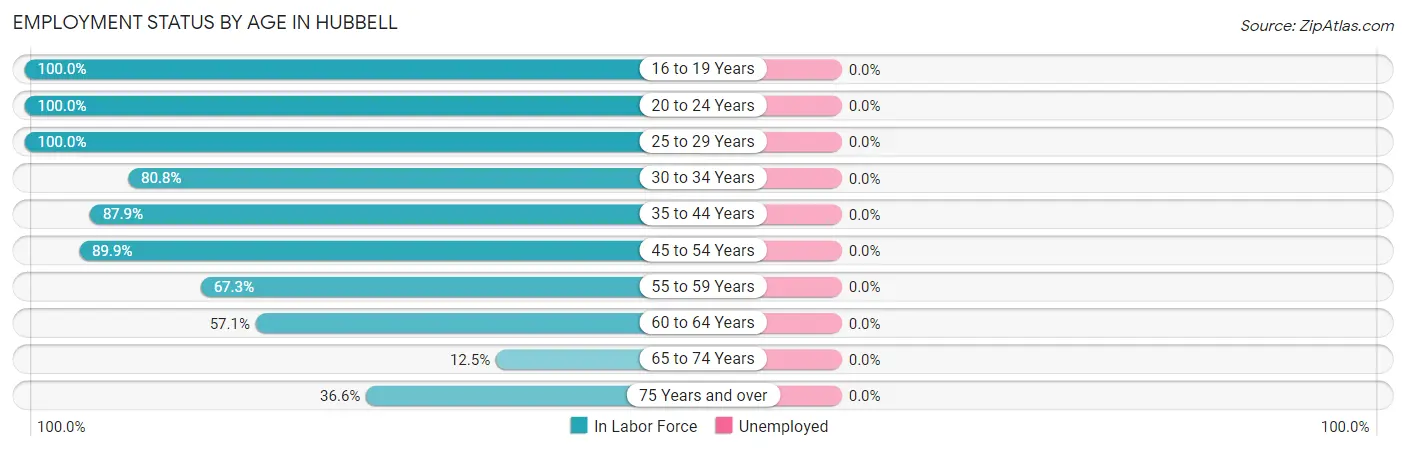
| Age Bracket | In Labor Force | Unemployed |
| 16 to 19 Years | 13 (100.0%) | 0 (0.0%) |
| 20 to 24 Years | 31 (100.0%) | 0 (0.0%) |
| 25 to 29 Years | 73 (100.0%) | 0 (0.0%) |
| 30 to 34 Years | 42 (80.8%) | 0 (0.0%) |
| 35 to 44 Years | 80 (87.9%) | 0 (0.0%) |
| 45 to 54 Years | 71 (89.9%) | 0 (0.0%) |
| 55 to 59 Years | 35 (67.3%) | 0 (0.0%) |
| 60 to 64 Years | 28 (57.1%) | 0 (0.0%) |
| 65 to 74 Years | 14 (12.5%) | 0 (0.0%) |
| 75 Years and over | 34 (36.6%) | 0 (0.0%) |
| Total | 421 (65.3%) | 0 (0.0%) |
Employment Status by Educational Attainment in Hubbell
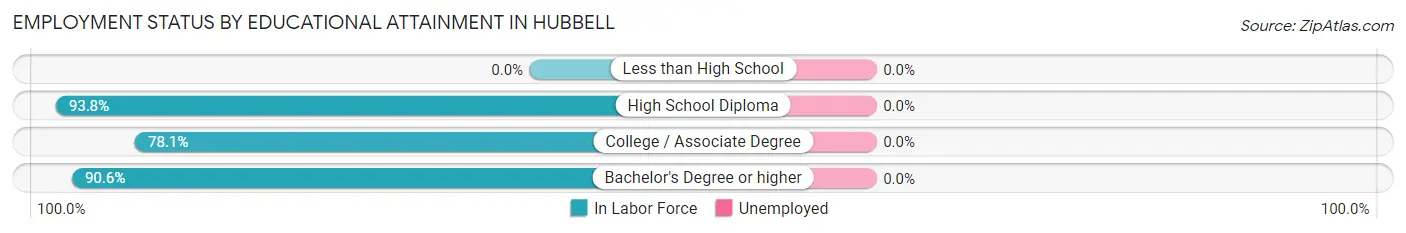
| Educational Attainment | In Labor Force | Unemployed |
| Less than High School | 0 (0.0%) | 0 (0.0%) |
| High School Diploma | 120 (93.8%) | 0 (0.0%) |
| College / Associate Degree | 132 (78.1%) | 0 (0.0%) |
| Bachelor's Degree or higher | 77 (90.6%) | 0 (0.0%) |
| Total | 329 (83.1%) | 0 (0.0%) |
Employment Occupations by Sex in Hubbell
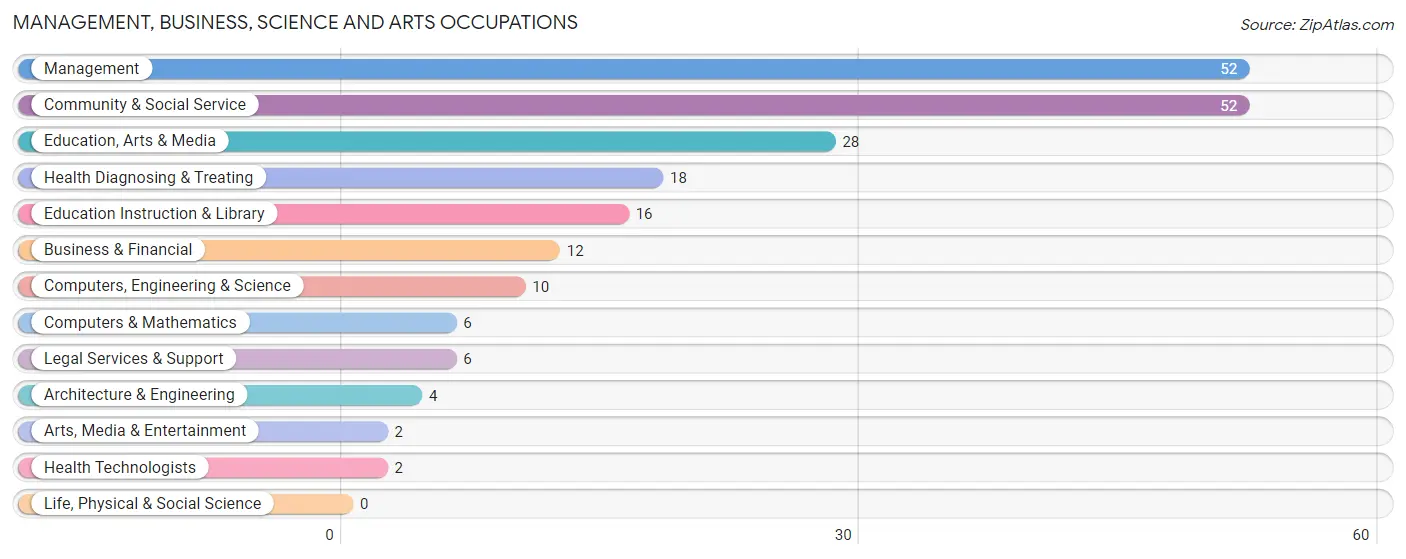
Management, Business, Science and Arts Occupations
The most common Management, Business, Science and Arts occupations in Hubbell are Management (52 | 12.3%), Community & Social Service (52 | 12.3%), Education, Arts & Media (28 | 6.7%), Health Diagnosing & Treating (18 | 4.3%), and Education Instruction & Library (16 | 3.8%).
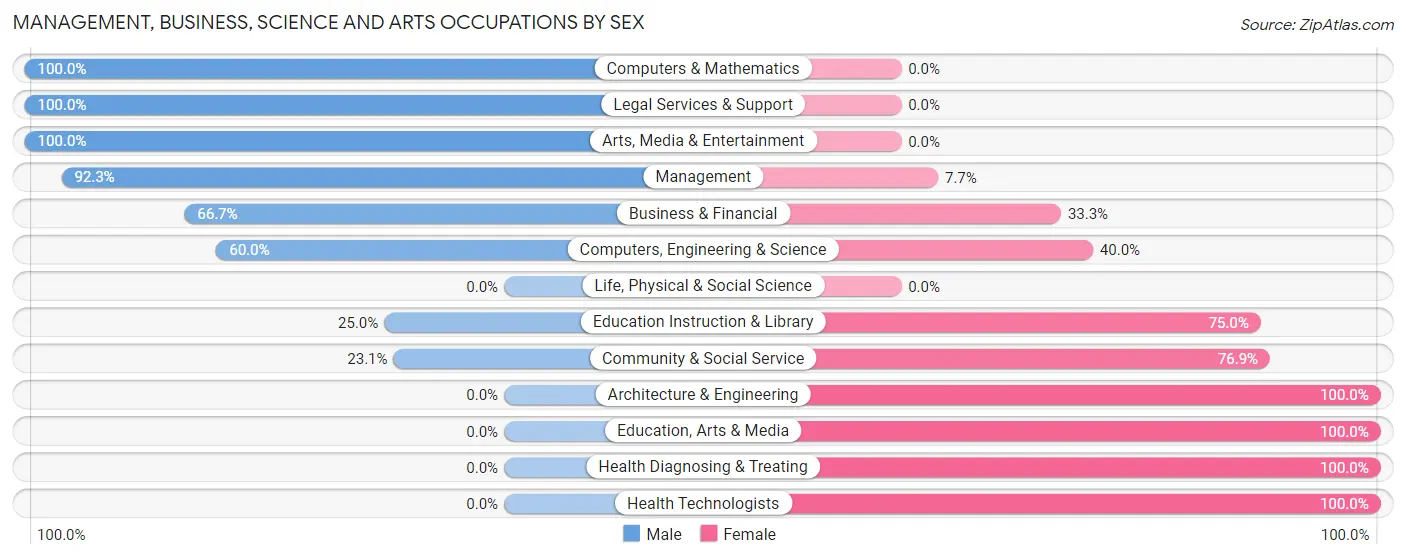
Management, Business, Science and Arts Occupations by Sex
Within the Management, Business, Science and Arts occupations in Hubbell, the most male-oriented occupations are Computers & Mathematics (100.0%), Legal Services & Support (100.0%), and Arts, Media & Entertainment (100.0%), while the most female-oriented occupations are Architecture & Engineering (100.0%), Education, Arts & Media (100.0%), and Health Diagnosing & Treating (100.0%).
| Occupation | Male | Female |
| Management | 48 (92.3%) | 4 (7.7%) |
| Business & Financial | 8 (66.7%) | 4 (33.3%) |
| Computers, Engineering & Science | 6 (60.0%) | 4 (40.0%) |
| Computers & Mathematics | 6 (100.0%) | 0 (0.0%) |
| Architecture & Engineering | 0 (0.0%) | 4 (100.0%) |
| Life, Physical & Social Science | 0 (0.0%) | 0 (0.0%) |
| Community & Social Service | 12 (23.1%) | 40 (76.9%) |
| Education, Arts & Media | 0 (0.0%) | 28 (100.0%) |
| Legal Services & Support | 6 (100.0%) | 0 (0.0%) |
| Education Instruction & Library | 4 (25.0%) | 12 (75.0%) |
| Arts, Media & Entertainment | 2 (100.0%) | 0 (0.0%) |
| Health Diagnosing & Treating | 0 (0.0%) | 18 (100.0%) |
| Health Technologists | 0 (0.0%) | 2 (100.0%) |
| Total (Category) | 74 (51.4%) | 70 (48.6%) |
| Total (Overall) | 218 (51.8%) | 203 (48.2%) |
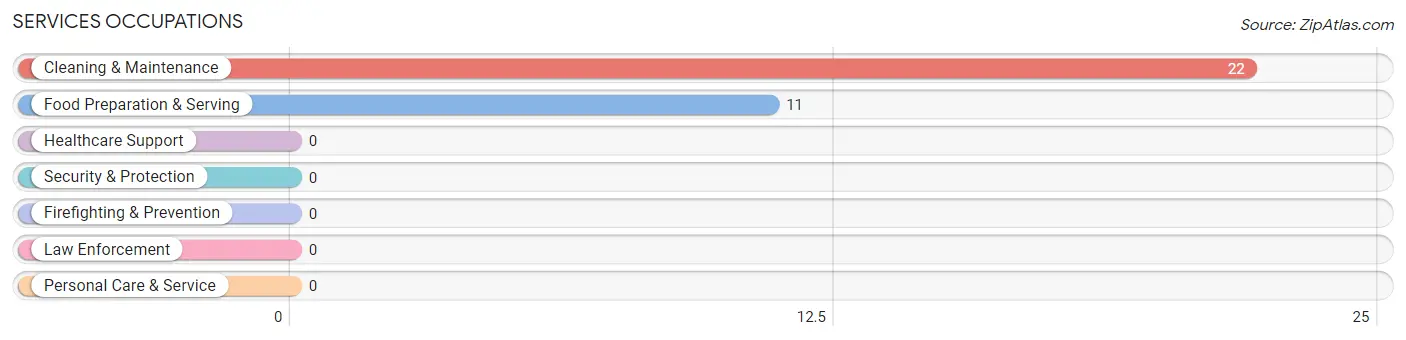
Services Occupations
The most common Services occupations in Hubbell are Cleaning & Maintenance (22 | 5.2%), and Food Preparation & Serving (11 | 2.6%).
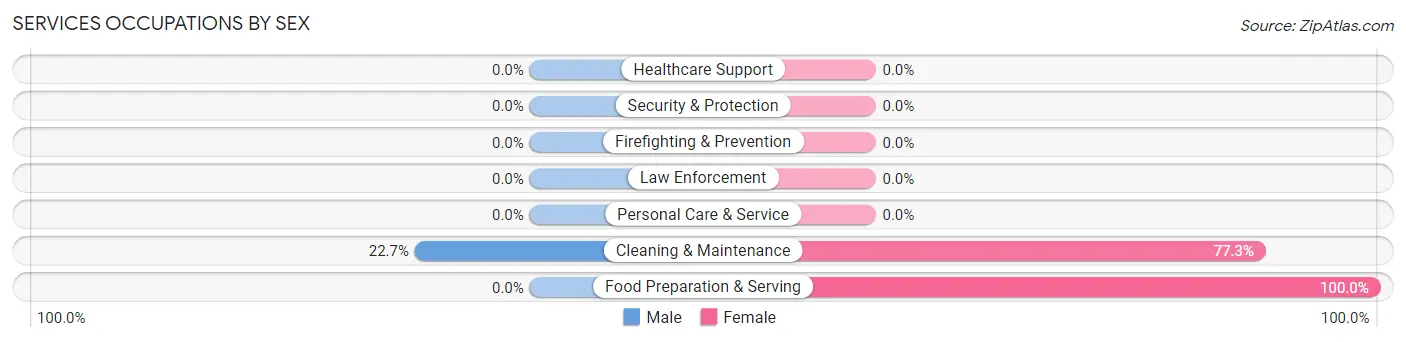
Services Occupations by Sex
| Occupation | Male | Female |
| Healthcare Support | 0 (0.0%) | 0 (0.0%) |
| Security & Protection | 0 (0.0%) | 0 (0.0%) |
| Firefighting & Prevention | 0 (0.0%) | 0 (0.0%) |
| Law Enforcement | 0 (0.0%) | 0 (0.0%) |
| Food Preparation & Serving | 0 (0.0%) | 11 (100.0%) |
| Cleaning & Maintenance | 5 (22.7%) | 17 (77.3%) |
| Personal Care & Service | 0 (0.0%) | 0 (0.0%) |
| Total (Category) | 5 (15.1%) | 28 (84.9%) |
| Total (Overall) | 218 (51.8%) | 203 (48.2%) |
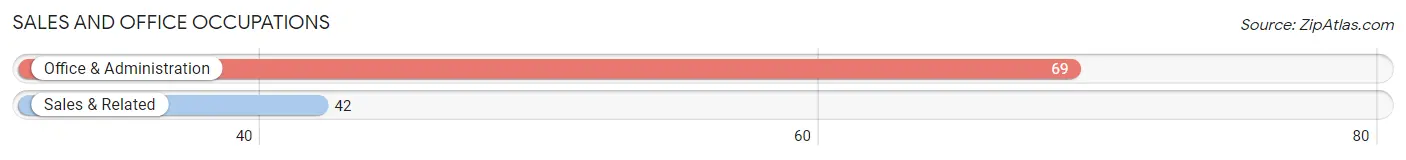
Sales and Office Occupations
The most common Sales and Office occupations in Hubbell are Office & Administration (69 | 16.4%), and Sales & Related (42 | 10.0%).
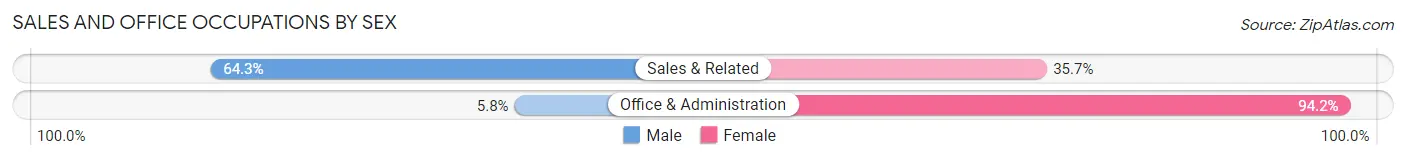
Sales and Office Occupations by Sex
| Occupation | Male | Female |
| Sales & Related | 27 (64.3%) | 15 (35.7%) |
| Office & Administration | 4 (5.8%) | 65 (94.2%) |
| Total (Category) | 31 (27.9%) | 80 (72.1%) |
| Total (Overall) | 218 (51.8%) | 203 (48.2%) |
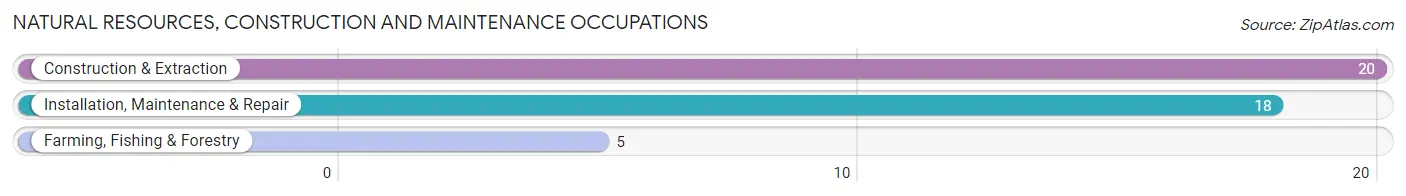
Natural Resources, Construction and Maintenance Occupations
The most common Natural Resources, Construction and Maintenance occupations in Hubbell are Construction & Extraction (20 | 4.8%), Installation, Maintenance & Repair (18 | 4.3%), and Farming, Fishing & Forestry (5 | 1.2%).
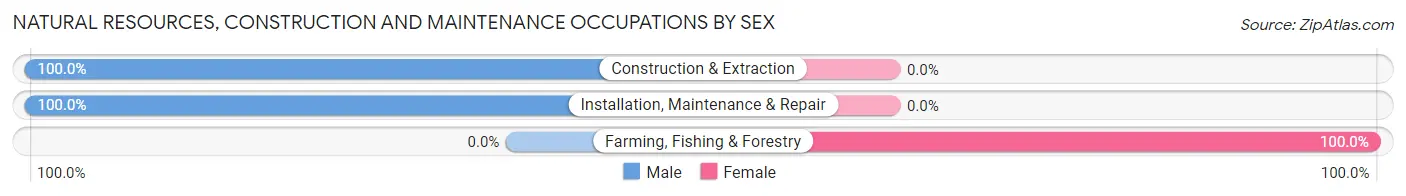
Natural Resources, Construction and Maintenance Occupations by Sex
| Occupation | Male | Female |
| Farming, Fishing & Forestry | 0 (0.0%) | 5 (100.0%) |
| Construction & Extraction | 20 (100.0%) | 0 (0.0%) |
| Installation, Maintenance & Repair | 18 (100.0%) | 0 (0.0%) |
| Total (Category) | 38 (88.4%) | 5 (11.6%) |
| Total (Overall) | 218 (51.8%) | 203 (48.2%) |
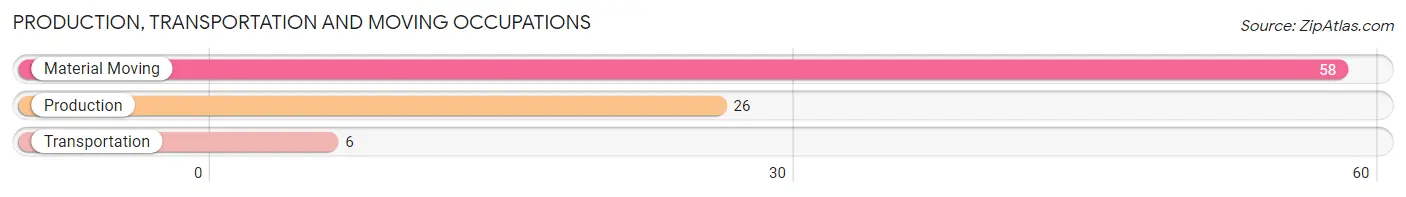
Production, Transportation and Moving Occupations
The most common Production, Transportation and Moving occupations in Hubbell are Material Moving (58 | 13.8%), Production (26 | 6.2%), and Transportation (6 | 1.4%).
Production, Transportation and Moving Occupations by Sex
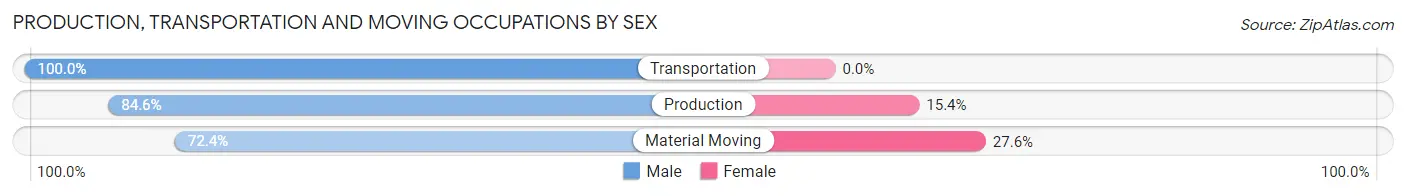
| Occupation | Male | Female |
| Production | 22 (84.6%) | 4 (15.4%) |
| Transportation | 6 (100.0%) | 0 (0.0%) |
| Material Moving | 42 (72.4%) | 16 (27.6%) |
| Total (Category) | 70 (77.8%) | 20 (22.2%) |
| Total (Overall) | 218 (51.8%) | 203 (48.2%) |
Employment Industries by Sex in Hubbell
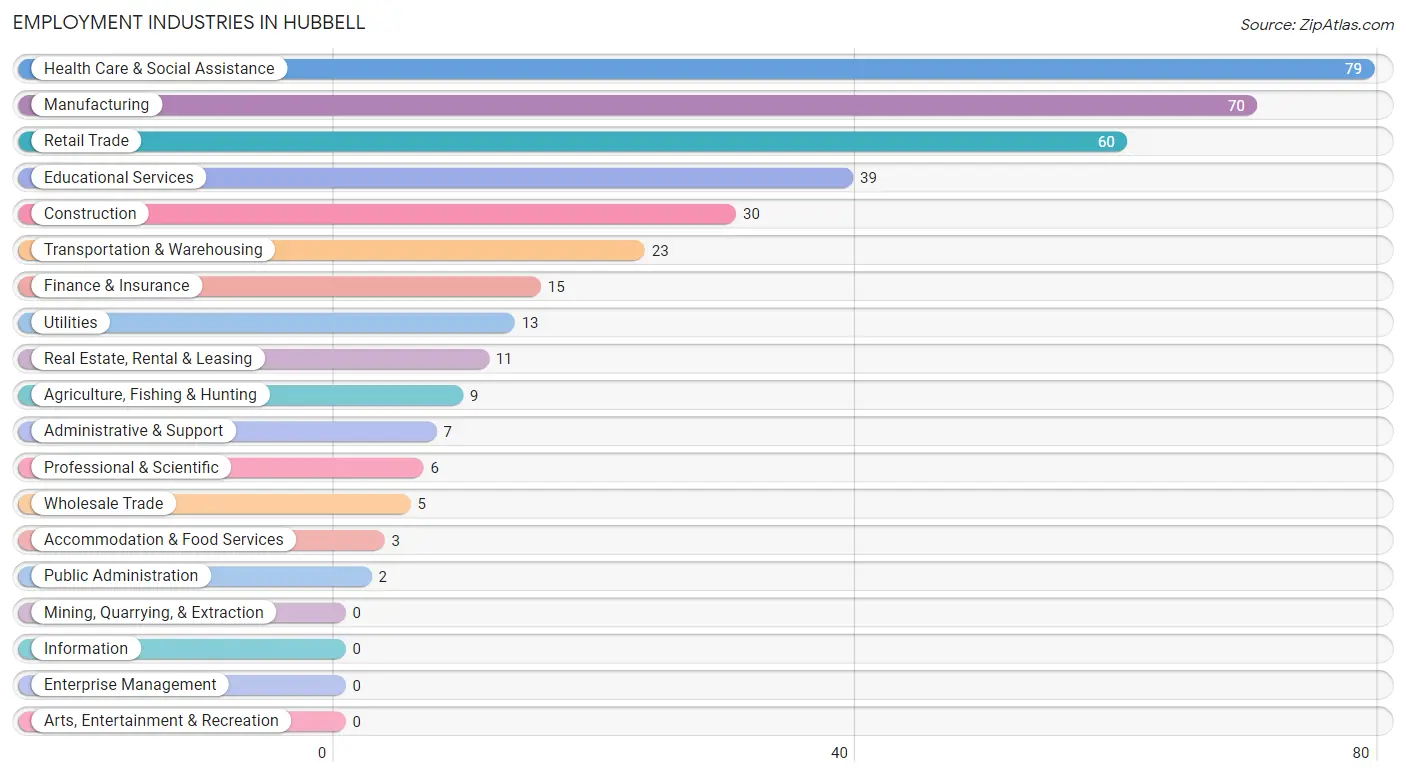
Employment Industries in Hubbell
The major employment industries in Hubbell include Health Care & Social Assistance (79 | 18.8%), Manufacturing (70 | 16.6%), Retail Trade (60 | 14.2%), Educational Services (39 | 9.3%), and Construction (30 | 7.1%).
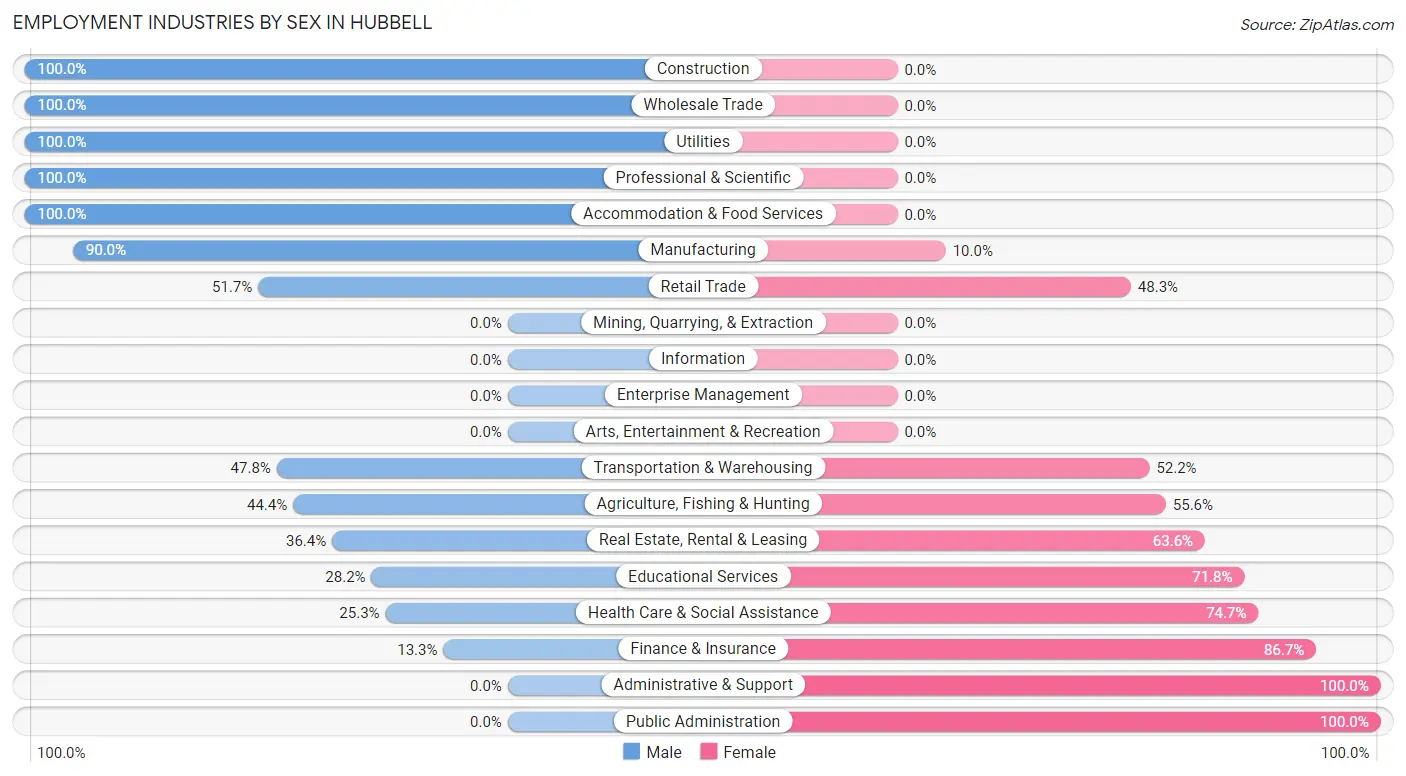
Employment Industries by Sex in Hubbell
The Hubbell industries that see more men than women are Construction (100.0%), Wholesale Trade (100.0%), and Utilities (100.0%), whereas the industries that tend to have a higher number of women are Administrative & Support (100.0%), Public Administration (100.0%), and Finance & Insurance (86.7%).
| Industry | Male | Female |
| Agriculture, Fishing & Hunting | 4 (44.4%) | 5 (55.6%) |
| Mining, Quarrying, & Extraction | 0 (0.0%) | 0 (0.0%) |
| Construction | 30 (100.0%) | 0 (0.0%) |
| Manufacturing | 63 (90.0%) | 7 (10.0%) |
| Wholesale Trade | 5 (100.0%) | 0 (0.0%) |
| Retail Trade | 31 (51.7%) | 29 (48.3%) |
| Transportation & Warehousing | 11 (47.8%) | 12 (52.2%) |
| Utilities | 13 (100.0%) | 0 (0.0%) |
| Information | 0 (0.0%) | 0 (0.0%) |
| Finance & Insurance | 2 (13.3%) | 13 (86.7%) |
| Real Estate, Rental & Leasing | 4 (36.4%) | 7 (63.6%) |
| Professional & Scientific | 6 (100.0%) | 0 (0.0%) |
| Enterprise Management | 0 (0.0%) | 0 (0.0%) |
| Administrative & Support | 0 (0.0%) | 7 (100.0%) |
| Educational Services | 11 (28.2%) | 28 (71.8%) |
| Health Care & Social Assistance | 20 (25.3%) | 59 (74.7%) |
| Arts, Entertainment & Recreation | 0 (0.0%) | 0 (0.0%) |
| Accommodation & Food Services | 3 (100.0%) | 0 (0.0%) |
| Public Administration | 0 (0.0%) | 2 (100.0%) |
| Total | 218 (51.8%) | 203 (48.2%) |
Education in Hubbell
School Enrollment in Hubbell
The most common levels of schooling among the 120 students in Hubbell are middle school (45 | 37.5%), elementary school (38 | 31.7%), and kindergarten (18 | 15.0%).
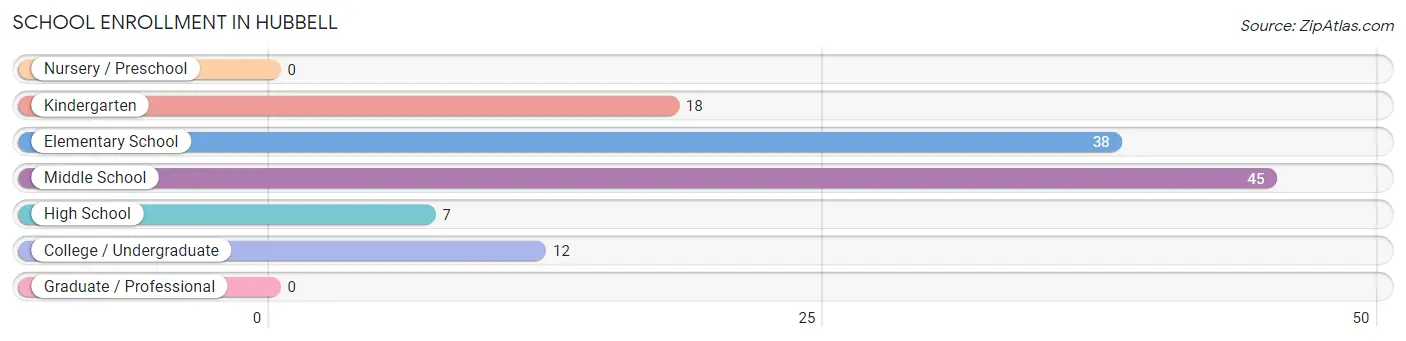
| School Level | # Students | % Students |
| Nursery / Preschool | 0 | 0.0% |
| Kindergarten | 18 | 15.0% |
| Elementary School | 38 | 31.7% |
| Middle School | 45 | 37.5% |
| High School | 7 | 5.8% |
| College / Undergraduate | 12 | 10.0% |
| Graduate / Professional | 0 | 0.0% |
| Total | 120 | 100.0% |
School Enrollment by Age by Funding Source in Hubbell
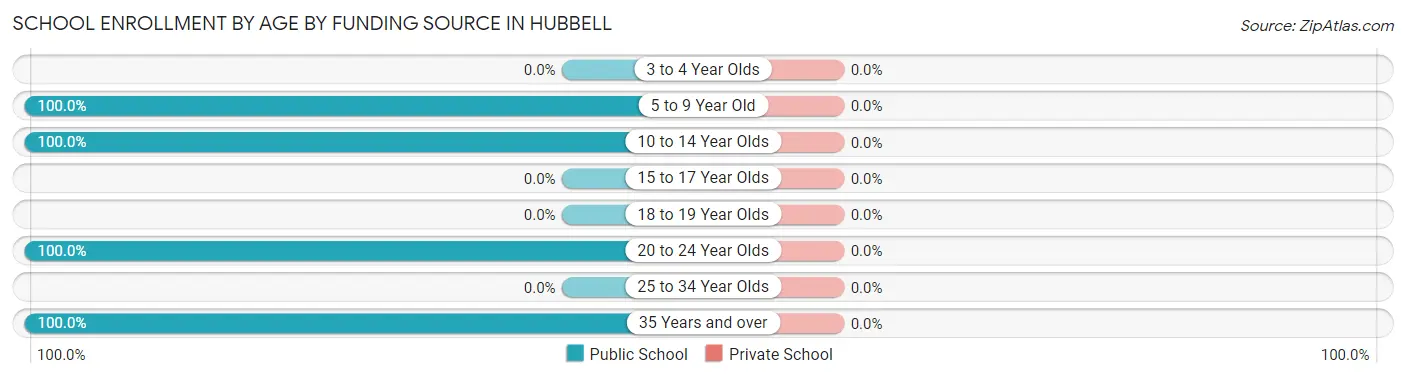
| Age Bracket | Public School | Private School |
| 3 to 4 Year Olds | 0 (0.0%) | 0 (0.0%) |
| 5 to 9 Year Old | 56 (100.0%) | 0 (0.0%) |
| 10 to 14 Year Olds | 52 (100.0%) | 0 (0.0%) |
| 15 to 17 Year Olds | 0 (0.0%) | 0 (0.0%) |
| 18 to 19 Year Olds | 0 (0.0%) | 0 (0.0%) |
| 20 to 24 Year Olds | 7 (100.0%) | 0 (0.0%) |
| 25 to 34 Year Olds | 0 (0.0%) | 0 (0.0%) |
| 35 Years and over | 5 (100.0%) | 0 (0.0%) |
| Total | 120 (100.0%) | 0 (0.0%) |
Educational Attainment by Field of Study in Hubbell
Business (31 | 30.4%), arts & humanities (19 | 18.6%), bio, nature & agricultural (9 | 8.8%), visual & performing arts (9 | 8.8%), and psychology (8 | 7.8%) are the most common fields of study among 102 individuals in Hubbell who have obtained a bachelor's degree or higher.
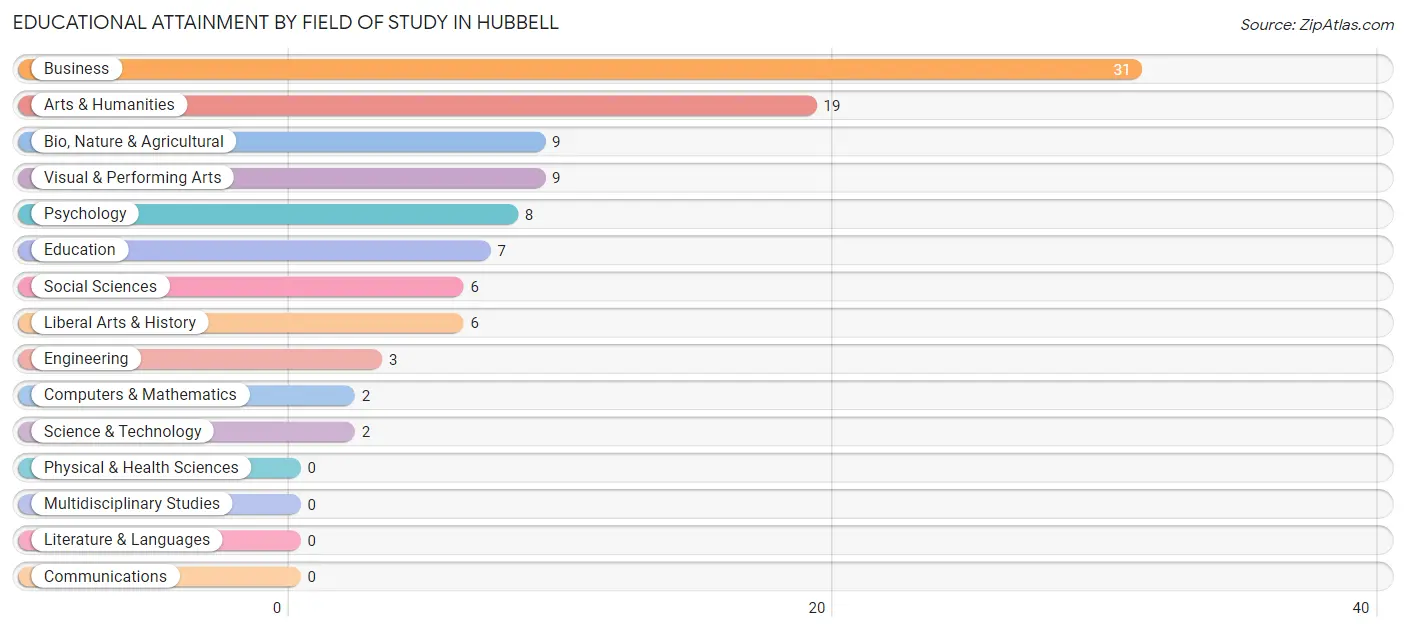
| Field of Study | # Graduates | % Graduates |
| Computers & Mathematics | 2 | 2.0% |
| Bio, Nature & Agricultural | 9 | 8.8% |
| Physical & Health Sciences | 0 | 0.0% |
| Psychology | 8 | 7.8% |
| Social Sciences | 6 | 5.9% |
| Engineering | 3 | 2.9% |
| Multidisciplinary Studies | 0 | 0.0% |
| Science & Technology | 2 | 2.0% |
| Business | 31 | 30.4% |
| Education | 7 | 6.9% |
| Literature & Languages | 0 | 0.0% |
| Liberal Arts & History | 6 | 5.9% |
| Visual & Performing Arts | 9 | 8.8% |
| Communications | 0 | 0.0% |
| Arts & Humanities | 19 | 18.6% |
| Total | 102 | 100.0% |
Transportation & Commute in Hubbell
Vehicle Availability by Sex in Hubbell
The most prevalent vehicle ownership categories in Hubbell are males with 2 vehicles (139, accounting for 65.6%) and females with 2 vehicles (107, making up 68.5%).
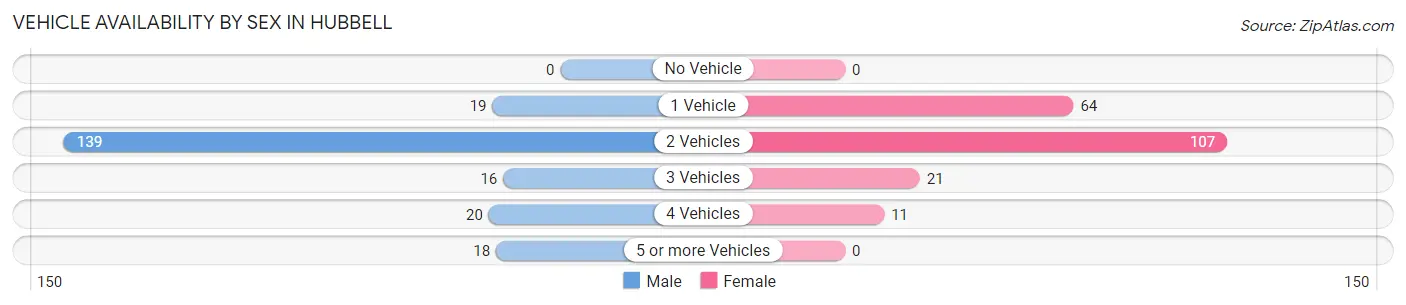
| Vehicles Available | Male | Female |
| No Vehicle | 0 (0.0%) | 0 (0.0%) |
| 1 Vehicle | 19 (9.0%) | 64 (31.5%) |
| 2 Vehicles | 139 (65.6%) | 107 (52.7%) |
| 3 Vehicles | 16 (7.5%) | 21 (10.3%) |
| 4 Vehicles | 20 (9.4%) | 11 (5.4%) |
| 5 or more Vehicles | 18 (8.5%) | 0 (0.0%) |
| Total | 212 (100.0%) | 203 (100.0%) |
Commute Time in Hubbell
The most frequently occuring commute durations in Hubbell are 15 to 19 minutes (149 commuters, 36.3%), 10 to 14 minutes (76 commuters, 18.5%), and 20 to 24 minutes (54 commuters, 13.2%).
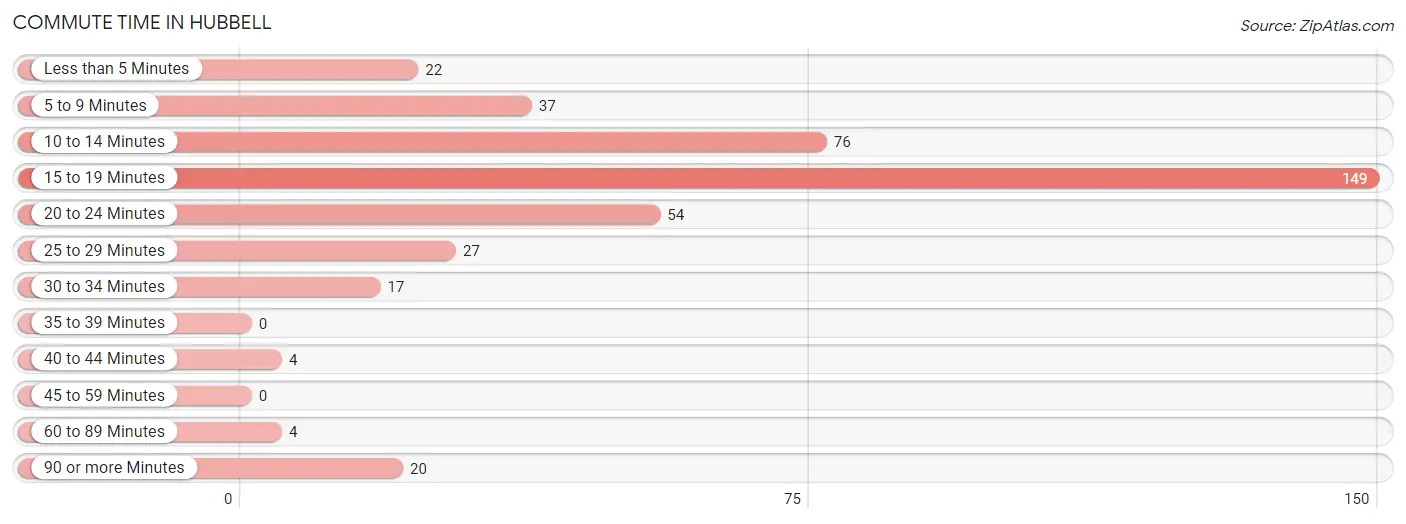
| Commute Time | # Commuters | % Commuters |
| Less than 5 Minutes | 22 | 5.4% |
| 5 to 9 Minutes | 37 | 9.0% |
| 10 to 14 Minutes | 76 | 18.5% |
| 15 to 19 Minutes | 149 | 36.3% |
| 20 to 24 Minutes | 54 | 13.2% |
| 25 to 29 Minutes | 27 | 6.6% |
| 30 to 34 Minutes | 17 | 4.2% |
| 35 to 39 Minutes | 0 | 0.0% |
| 40 to 44 Minutes | 4 | 1.0% |
| 45 to 59 Minutes | 0 | 0.0% |
| 60 to 89 Minutes | 4 | 1.0% |
| 90 or more Minutes | 20 | 4.9% |
Commute Time by Sex in Hubbell
The most common commute times in Hubbell are 15 to 19 minutes (71 commuters, 33.5%) for males and 15 to 19 minutes (78 commuters, 39.4%) for females.
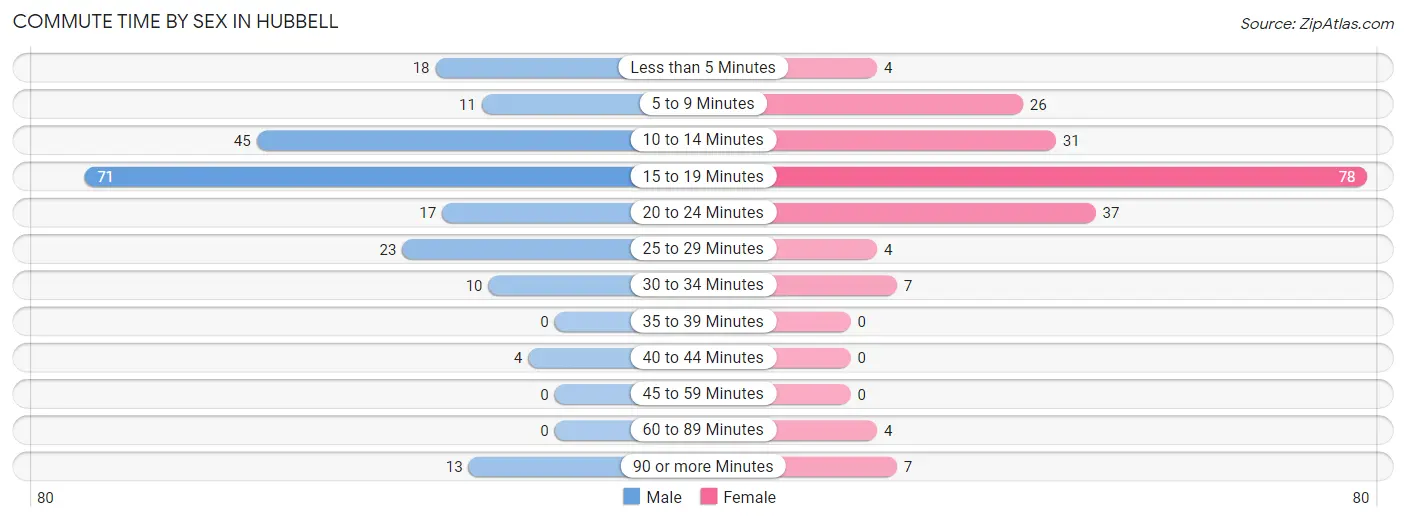
| Commute Time | Male | Female |
| Less than 5 Minutes | 18 (8.5%) | 4 (2.0%) |
| 5 to 9 Minutes | 11 (5.2%) | 26 (13.1%) |
| 10 to 14 Minutes | 45 (21.2%) | 31 (15.7%) |
| 15 to 19 Minutes | 71 (33.5%) | 78 (39.4%) |
| 20 to 24 Minutes | 17 (8.0%) | 37 (18.7%) |
| 25 to 29 Minutes | 23 (10.8%) | 4 (2.0%) |
| 30 to 34 Minutes | 10 (4.7%) | 7 (3.5%) |
| 35 to 39 Minutes | 0 (0.0%) | 0 (0.0%) |
| 40 to 44 Minutes | 4 (1.9%) | 0 (0.0%) |
| 45 to 59 Minutes | 0 (0.0%) | 0 (0.0%) |
| 60 to 89 Minutes | 0 (0.0%) | 4 (2.0%) |
| 90 or more Minutes | 13 (6.1%) | 7 (3.5%) |
Time of Departure to Work by Sex in Hubbell
The most frequent times of departure to work in Hubbell are 7:30 AM to 7:59 AM (48, 22.6%) for males and 7:00 AM to 7:29 AM (38, 19.2%) for females.
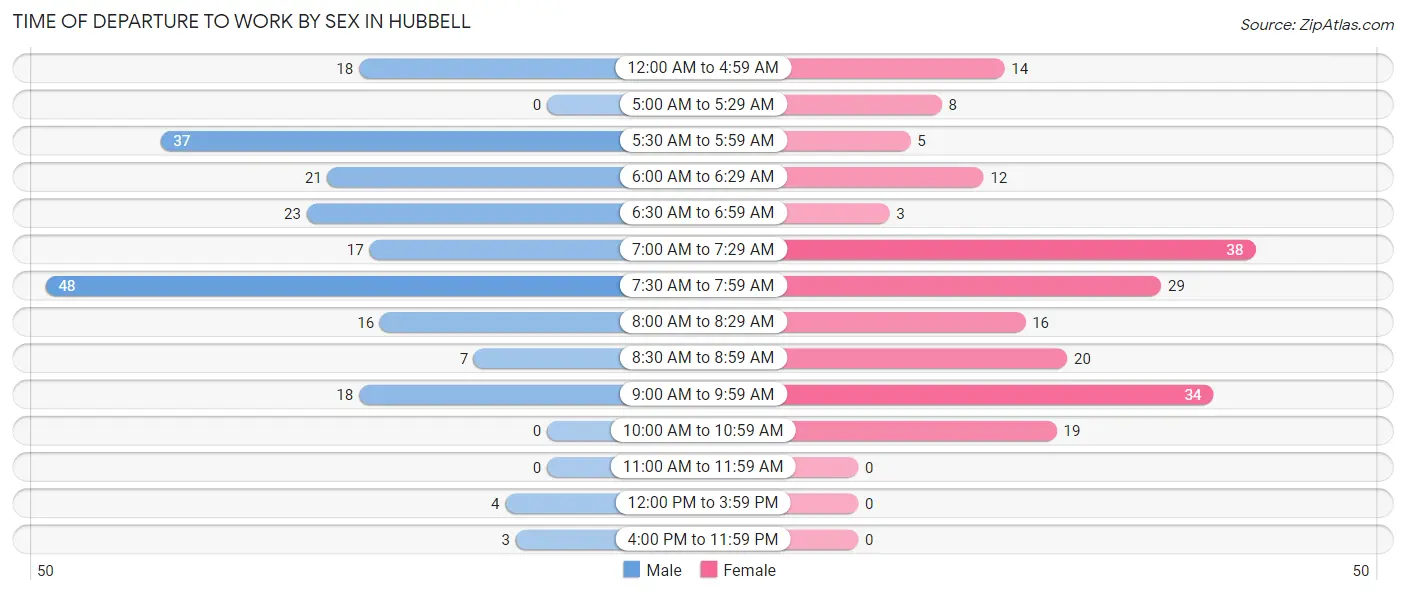
| Time of Departure | Male | Female |
| 12:00 AM to 4:59 AM | 18 (8.5%) | 14 (7.1%) |
| 5:00 AM to 5:29 AM | 0 (0.0%) | 8 (4.0%) |
| 5:30 AM to 5:59 AM | 37 (17.4%) | 5 (2.5%) |
| 6:00 AM to 6:29 AM | 21 (9.9%) | 12 (6.1%) |
| 6:30 AM to 6:59 AM | 23 (10.8%) | 3 (1.5%) |
| 7:00 AM to 7:29 AM | 17 (8.0%) | 38 (19.2%) |
| 7:30 AM to 7:59 AM | 48 (22.6%) | 29 (14.6%) |
| 8:00 AM to 8:29 AM | 16 (7.5%) | 16 (8.1%) |
| 8:30 AM to 8:59 AM | 7 (3.3%) | 20 (10.1%) |
| 9:00 AM to 9:59 AM | 18 (8.5%) | 34 (17.2%) |
| 10:00 AM to 10:59 AM | 0 (0.0%) | 19 (9.6%) |
| 11:00 AM to 11:59 AM | 0 (0.0%) | 0 (0.0%) |
| 12:00 PM to 3:59 PM | 4 (1.9%) | 0 (0.0%) |
| 4:00 PM to 11:59 PM | 3 (1.4%) | 0 (0.0%) |
| Total | 212 (100.0%) | 198 (100.0%) |
Housing Occupancy in Hubbell
Occupancy by Ownership in Hubbell
Of the total 351 dwellings in Hubbell, owner-occupied units account for 325 (92.6%), while renter-occupied units make up 26 (7.4%).
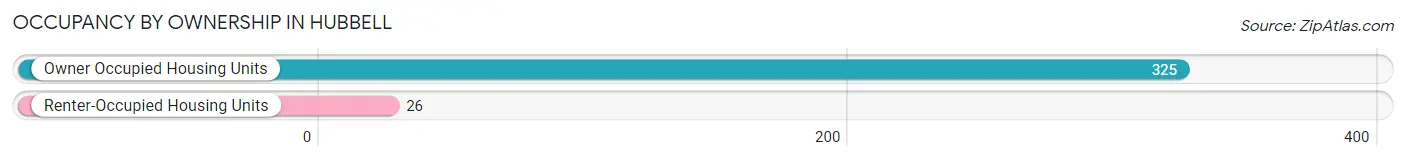
| Occupancy | # Housing Units | % Housing Units |
| Owner Occupied Housing Units | 325 | 92.6% |
| Renter-Occupied Housing Units | 26 | 7.4% |
| Total Occupied Housing Units | 351 | 100.0% |
Occupancy by Household Size in Hubbell
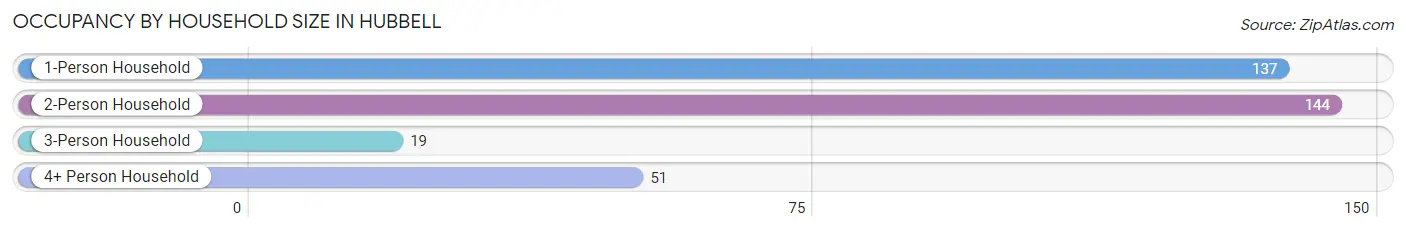
| Household Size | # Housing Units | % Housing Units |
| 1-Person Household | 137 | 39.0% |
| 2-Person Household | 144 | 41.0% |
| 3-Person Household | 19 | 5.4% |
| 4+ Person Household | 51 | 14.5% |
| Total Housing Units | 351 | 100.0% |
Occupancy by Ownership by Household Size in Hubbell
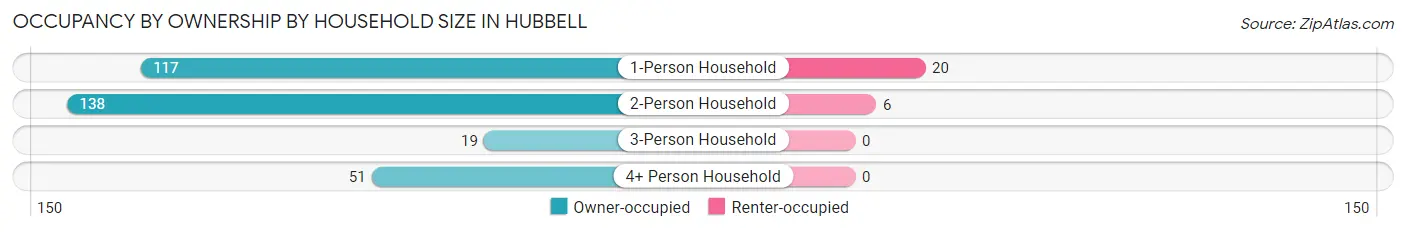
| Household Size | Owner-occupied | Renter-occupied |
| 1-Person Household | 117 (85.4%) | 20 (14.6%) |
| 2-Person Household | 138 (95.8%) | 6 (4.2%) |
| 3-Person Household | 19 (100.0%) | 0 (0.0%) |
| 4+ Person Household | 51 (100.0%) | 0 (0.0%) |
| Total Housing Units | 325 (92.6%) | 26 (7.4%) |
Occupancy by Educational Attainment in Hubbell
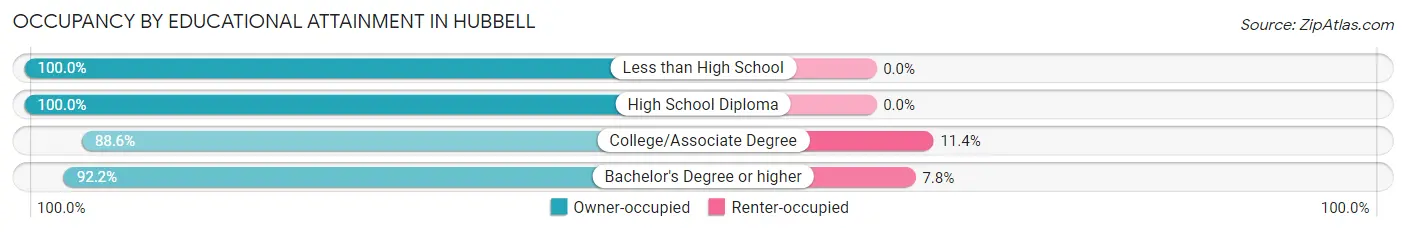
| Household Size | Owner-occupied | Renter-occupied |
| Less than High School | 9 (100.0%) | 0 (0.0%) |
| High School Diploma | 89 (100.0%) | 0 (0.0%) |
| College/Associate Degree | 156 (88.6%) | 20 (11.4%) |
| Bachelor's Degree or higher | 71 (92.2%) | 6 (7.8%) |
Occupancy by Age of Householder in Hubbell
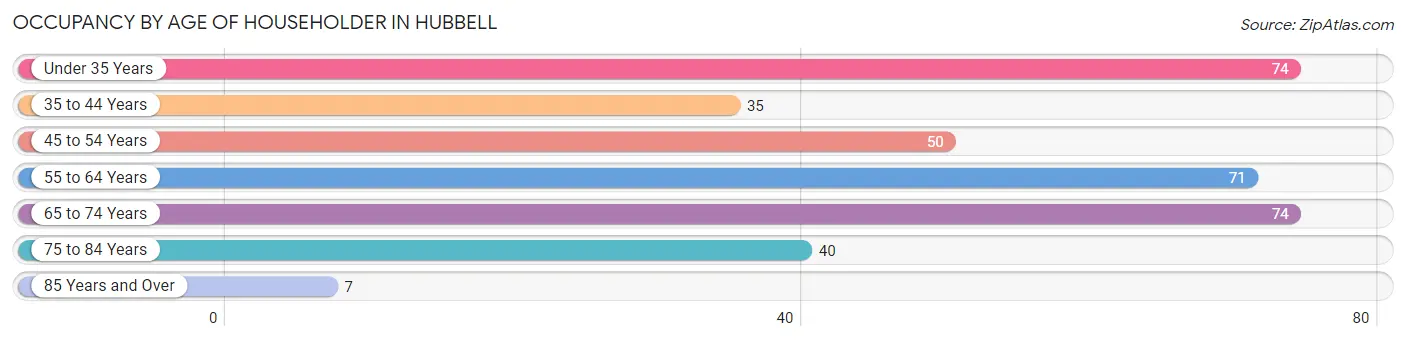
| Age Bracket | # Households | % Households |
| Under 35 Years | 74 | 21.1% |
| 35 to 44 Years | 35 | 10.0% |
| 45 to 54 Years | 50 | 14.2% |
| 55 to 64 Years | 71 | 20.2% |
| 65 to 74 Years | 74 | 21.1% |
| 75 to 84 Years | 40 | 11.4% |
| 85 Years and Over | 7 | 2.0% |
| Total | 351 | 100.0% |
Housing Finances in Hubbell
Median Income by Occupancy in Hubbell
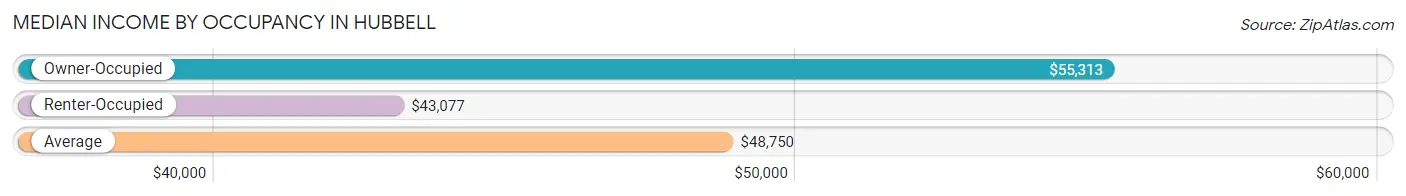
| Occupancy Type | # Households | Median Income |
| Owner-Occupied | 325 (92.6%) | $55,313 |
| Renter-Occupied | 26 (7.4%) | $43,077 |
| Average | 351 (100.0%) | $48,750 |
Occupancy by Householder Income Bracket in Hubbell
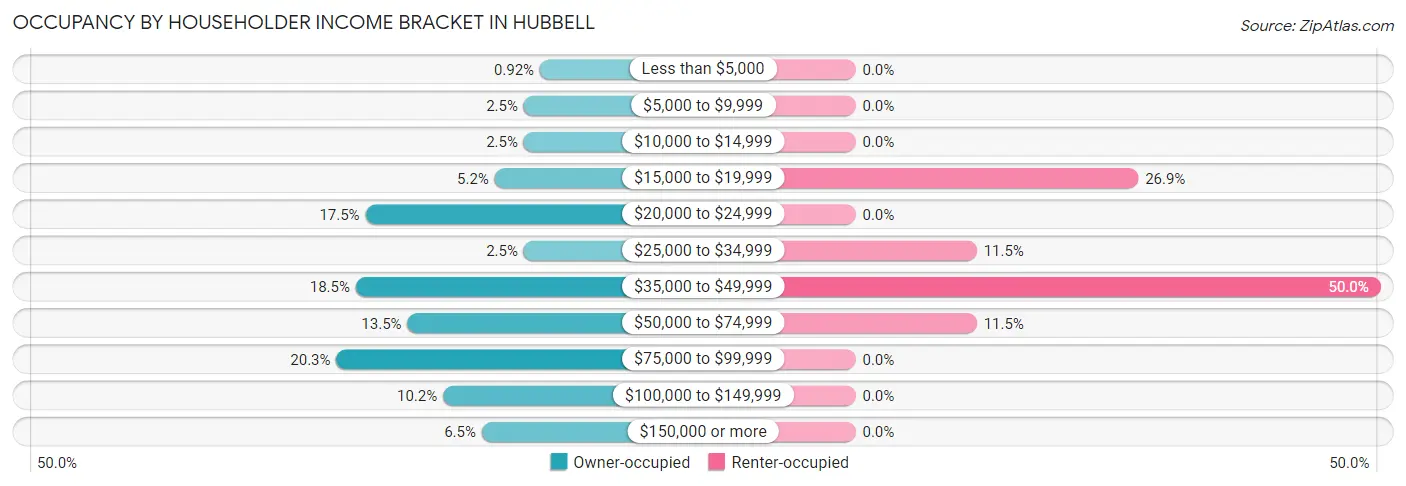
| Income Bracket | Owner-occupied | Renter-occupied |
| Less than $5,000 | 3 (0.9%) | 0 (0.0%) |
| $5,000 to $9,999 | 8 (2.5%) | 0 (0.0%) |
| $10,000 to $14,999 | 8 (2.5%) | 0 (0.0%) |
| $15,000 to $19,999 | 17 (5.2%) | 7 (26.9%) |
| $20,000 to $24,999 | 57 (17.5%) | 0 (0.0%) |
| $25,000 to $34,999 | 8 (2.5%) | 3 (11.5%) |
| $35,000 to $49,999 | 60 (18.5%) | 13 (50.0%) |
| $50,000 to $74,999 | 44 (13.5%) | 3 (11.5%) |
| $75,000 to $99,999 | 66 (20.3%) | 0 (0.0%) |
| $100,000 to $149,999 | 33 (10.2%) | 0 (0.0%) |
| $150,000 or more | 21 (6.5%) | 0 (0.0%) |
| Total | 325 (100.0%) | 26 (100.0%) |
Monthly Housing Cost Tiers in Hubbell
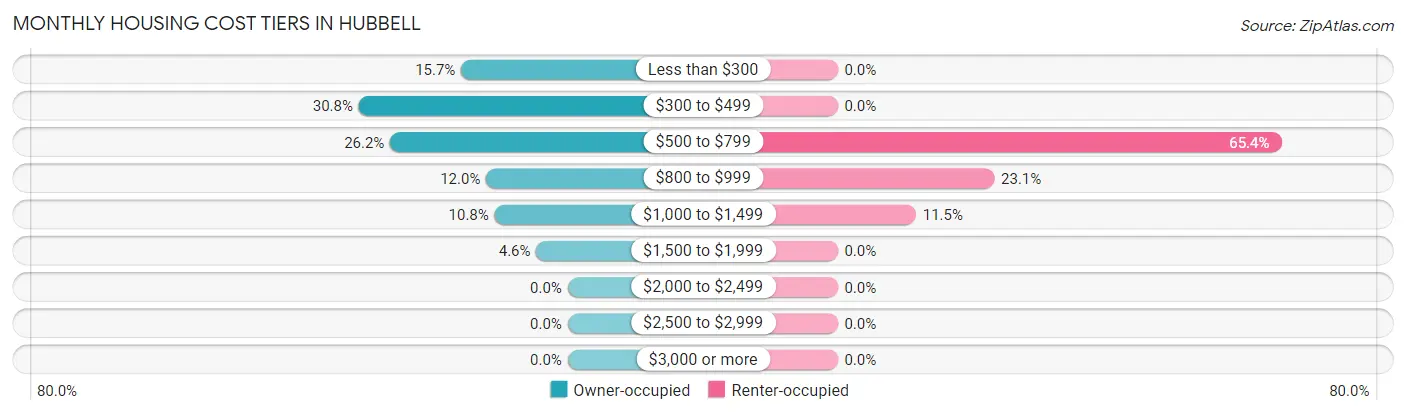
| Monthly Cost | Owner-occupied | Renter-occupied |
| Less than $300 | 51 (15.7%) | 0 (0.0%) |
| $300 to $499 | 100 (30.8%) | 0 (0.0%) |
| $500 to $799 | 85 (26.2%) | 17 (65.4%) |
| $800 to $999 | 39 (12.0%) | 6 (23.1%) |
| $1,000 to $1,499 | 35 (10.8%) | 3 (11.5%) |
| $1,500 to $1,999 | 15 (4.6%) | 0 (0.0%) |
| $2,000 to $2,499 | 0 (0.0%) | 0 (0.0%) |
| $2,500 to $2,999 | 0 (0.0%) | 0 (0.0%) |
| $3,000 or more | 0 (0.0%) | 0 (0.0%) |
| Total | 325 (100.0%) | 26 (100.0%) |
Physical Housing Characteristics in Hubbell
Housing Structures in Hubbell
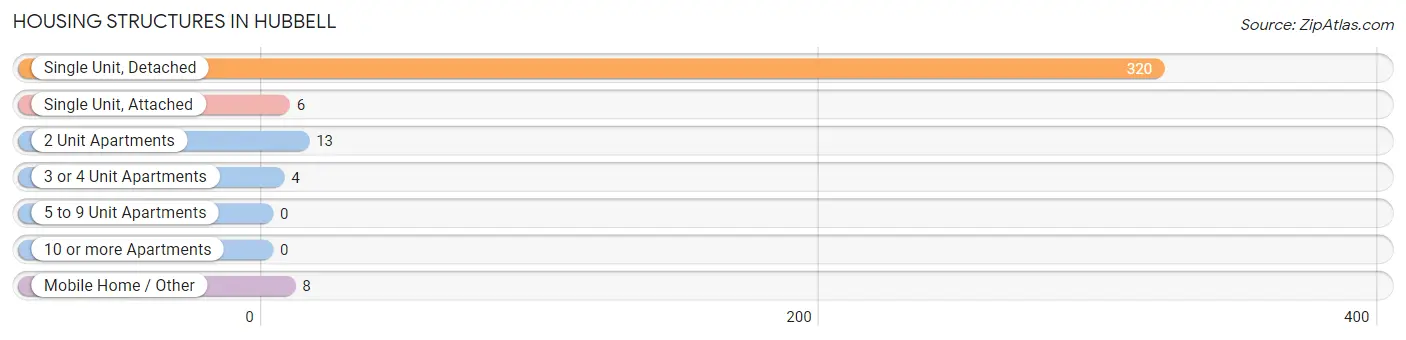
| Structure Type | # Housing Units | % Housing Units |
| Single Unit, Detached | 320 | 91.2% |
| Single Unit, Attached | 6 | 1.7% |
| 2 Unit Apartments | 13 | 3.7% |
| 3 or 4 Unit Apartments | 4 | 1.1% |
| 5 to 9 Unit Apartments | 0 | 0.0% |
| 10 or more Apartments | 0 | 0.0% |
| Mobile Home / Other | 8 | 2.3% |
| Total | 351 | 100.0% |
Housing Structures by Occupancy in Hubbell
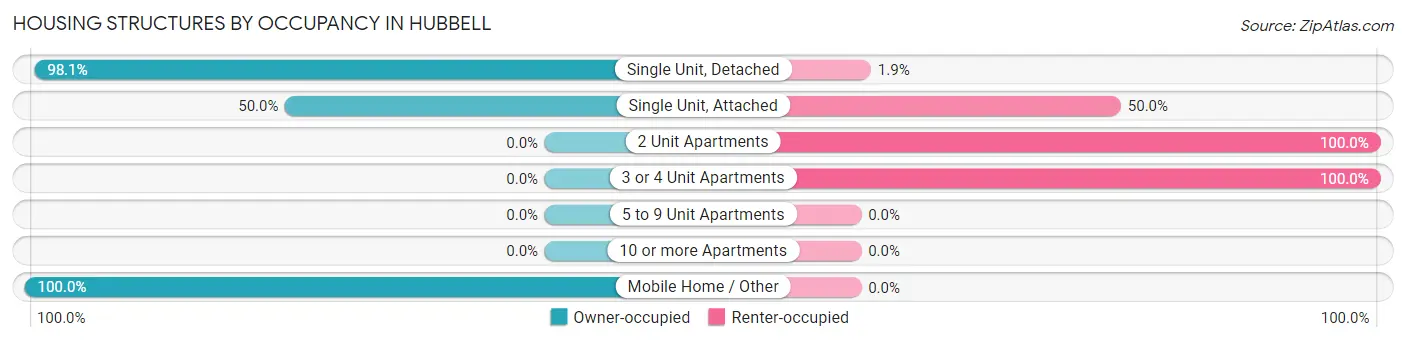
| Structure Type | Owner-occupied | Renter-occupied |
| Single Unit, Detached | 314 (98.1%) | 6 (1.9%) |
| Single Unit, Attached | 3 (50.0%) | 3 (50.0%) |
| 2 Unit Apartments | 0 (0.0%) | 13 (100.0%) |
| 3 or 4 Unit Apartments | 0 (0.0%) | 4 (100.0%) |
| 5 to 9 Unit Apartments | 0 (0.0%) | 0 (0.0%) |
| 10 or more Apartments | 0 (0.0%) | 0 (0.0%) |
| Mobile Home / Other | 8 (100.0%) | 0 (0.0%) |
| Total | 325 (92.6%) | 26 (7.4%) |
Housing Structures by Number of Rooms in Hubbell
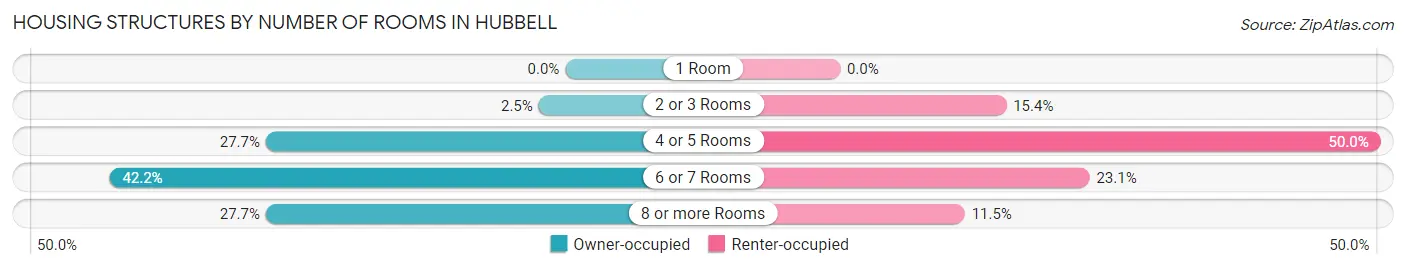
| Number of Rooms | Owner-occupied | Renter-occupied |
| 1 Room | 0 (0.0%) | 0 (0.0%) |
| 2 or 3 Rooms | 8 (2.5%) | 4 (15.4%) |
| 4 or 5 Rooms | 90 (27.7%) | 13 (50.0%) |
| 6 or 7 Rooms | 137 (42.1%) | 6 (23.1%) |
| 8 or more Rooms | 90 (27.7%) | 3 (11.5%) |
| Total | 325 (100.0%) | 26 (100.0%) |
Housing Structure by Heating Type in Hubbell
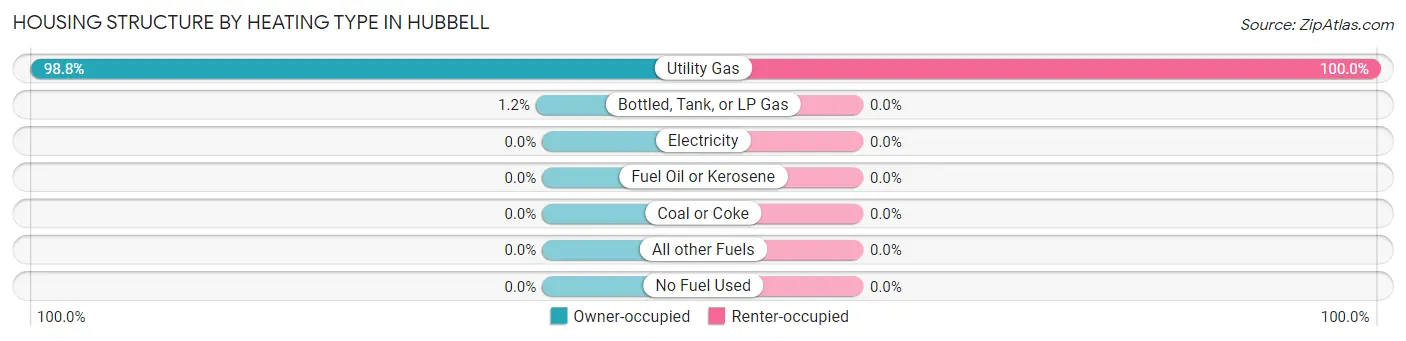
| Heating Type | Owner-occupied | Renter-occupied |
| Utility Gas | 321 (98.8%) | 26 (100.0%) |
| Bottled, Tank, or LP Gas | 4 (1.2%) | 0 (0.0%) |
| Electricity | 0 (0.0%) | 0 (0.0%) |
| Fuel Oil or Kerosene | 0 (0.0%) | 0 (0.0%) |
| Coal or Coke | 0 (0.0%) | 0 (0.0%) |
| All other Fuels | 0 (0.0%) | 0 (0.0%) |
| No Fuel Used | 0 (0.0%) | 0 (0.0%) |
| Total | 325 (100.0%) | 26 (100.0%) |
Household Vehicle Usage in Hubbell
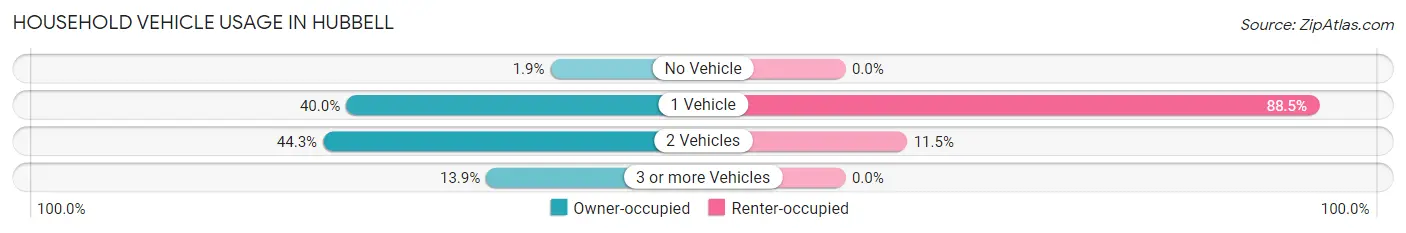
| Vehicles per Household | Owner-occupied | Renter-occupied |
| No Vehicle | 6 (1.8%) | 0 (0.0%) |
| 1 Vehicle | 130 (40.0%) | 23 (88.5%) |
| 2 Vehicles | 144 (44.3%) | 3 (11.5%) |
| 3 or more Vehicles | 45 (13.9%) | 0 (0.0%) |
| Total | 325 (100.0%) | 26 (100.0%) |
Real Estate & Mortgages in Hubbell
Real Estate and Mortgage Overview in Hubbell
| Characteristic | Without Mortgage | With Mortgage |
| Housing Units | 192 | 133 |
| Median Property Value | $54,200 | $99,400 |
| Median Household Income | $38,833 | $15 |
| Monthly Housing Costs | $377 | $0 |
| Real Estate Taxes | $1,102 | $0 |
Property Value by Mortgage Status in Hubbell
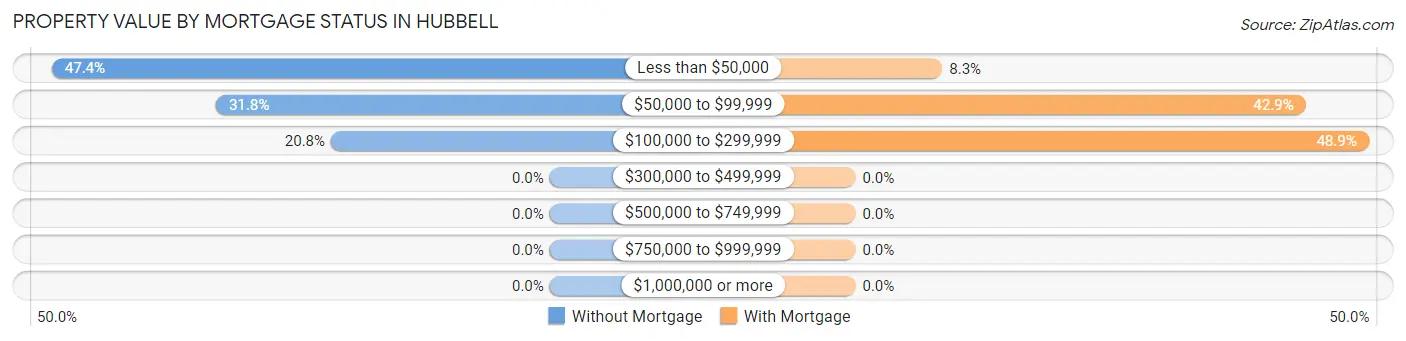
| Property Value | Without Mortgage | With Mortgage |
| Less than $50,000 | 91 (47.4%) | 11 (8.3%) |
| $50,000 to $99,999 | 61 (31.8%) | 57 (42.9%) |
| $100,000 to $299,999 | 40 (20.8%) | 65 (48.9%) |
| $300,000 to $499,999 | 0 (0.0%) | 0 (0.0%) |
| $500,000 to $749,999 | 0 (0.0%) | 0 (0.0%) |
| $750,000 to $999,999 | 0 (0.0%) | 0 (0.0%) |
| $1,000,000 or more | 0 (0.0%) | 0 (0.0%) |
| Total | 192 (100.0%) | 133 (100.0%) |
Household Income by Mortgage Status in Hubbell
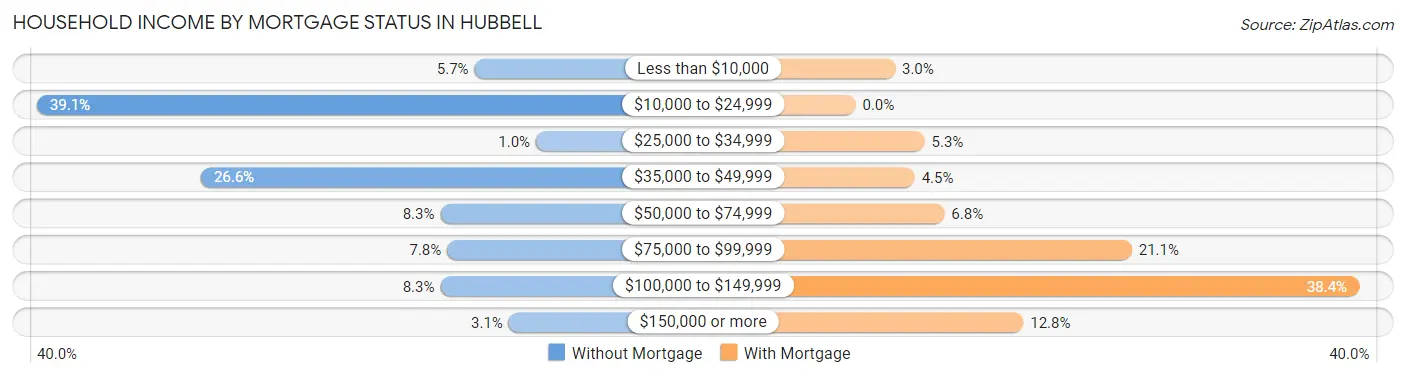
| Household Income | Without Mortgage | With Mortgage |
| Less than $10,000 | 11 (5.7%) | 4 (3.0%) |
| $10,000 to $24,999 | 75 (39.1%) | 0 (0.0%) |
| $25,000 to $34,999 | 2 (1.0%) | 7 (5.3%) |
| $35,000 to $49,999 | 51 (26.6%) | 6 (4.5%) |
| $50,000 to $74,999 | 16 (8.3%) | 9 (6.8%) |
| $75,000 to $99,999 | 15 (7.8%) | 28 (21.0%) |
| $100,000 to $149,999 | 16 (8.3%) | 51 (38.4%) |
| $150,000 or more | 6 (3.1%) | 17 (12.8%) |
| Total | 192 (100.0%) | 133 (100.0%) |
Property Value to Household Income Ratio in Hubbell
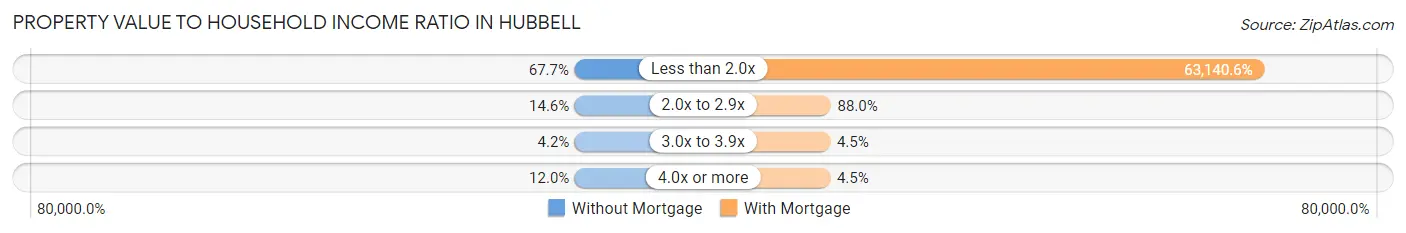
| Value-to-Income Ratio | Without Mortgage | With Mortgage |
| Less than 2.0x | 130 (67.7%) | 83,977 (63,140.6%) |
| 2.0x to 2.9x | 28 (14.6%) | 117 (88.0%) |
| 3.0x to 3.9x | 8 (4.2%) | 6 (4.5%) |
| 4.0x or more | 23 (12.0%) | 6 (4.5%) |
| Total | 192 (100.0%) | 133 (100.0%) |
Real Estate Taxes by Mortgage Status in Hubbell
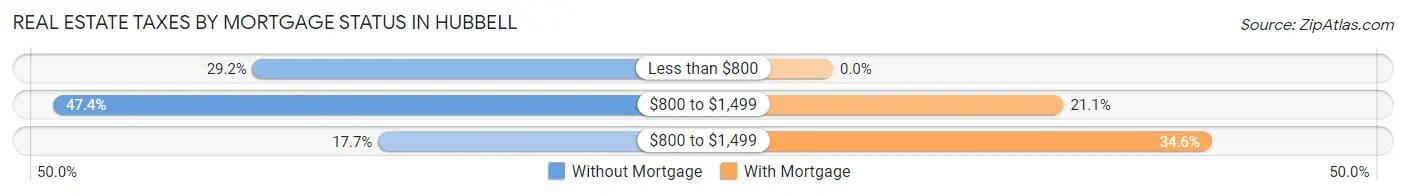
| Property Taxes | Without Mortgage | With Mortgage |
| Less than $800 | 56 (29.2%) | 0 (0.0%) |
| $800 to $1,499 | 91 (47.4%) | 28 (21.0%) |
| $800 to $1,499 | 34 (17.7%) | 46 (34.6%) |
| Total | 192 (100.0%) | 133 (100.0%) |
Health & Disability in Hubbell
Health Insurance Coverage by Age in Hubbell
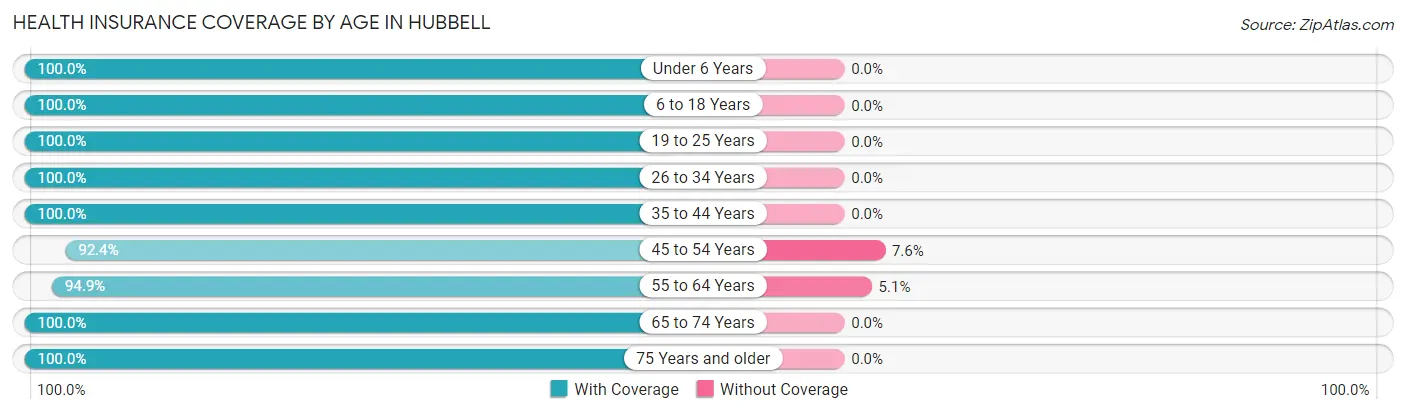
| Age Bracket | With Coverage | Without Coverage |
| Under 6 Years | 23 (100.0%) | 0 (0.0%) |
| 6 to 18 Years | 101 (100.0%) | 0 (0.0%) |
| 19 to 25 Years | 55 (100.0%) | 0 (0.0%) |
| 26 to 34 Years | 114 (100.0%) | 0 (0.0%) |
| 35 to 44 Years | 91 (100.0%) | 0 (0.0%) |
| 45 to 54 Years | 73 (92.4%) | 6 (7.6%) |
| 55 to 64 Years | 93 (94.9%) | 5 (5.1%) |
| 65 to 74 Years | 100 (100.0%) | 0 (0.0%) |
| 75 Years and older | 62 (100.0%) | 0 (0.0%) |
| Total | 712 (98.5%) | 11 (1.5%) |
Health Insurance Coverage by Citizenship Status in Hubbell
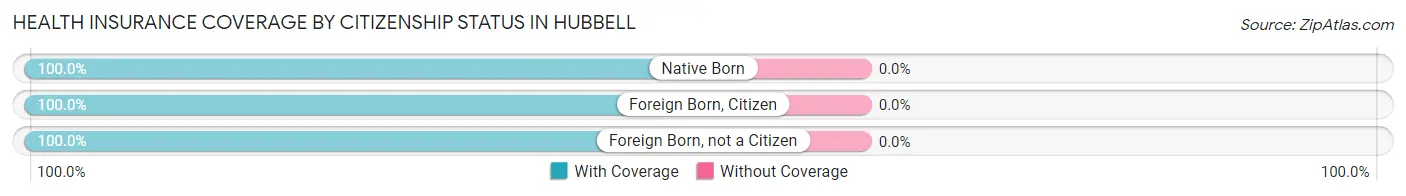
| Citizenship Status | With Coverage | Without Coverage |
| Native Born | 23 (100.0%) | 0 (0.0%) |
| Foreign Born, Citizen | 101 (100.0%) | 0 (0.0%) |
| Foreign Born, not a Citizen | 55 (100.0%) | 0 (0.0%) |
Health Insurance Coverage by Household Income in Hubbell
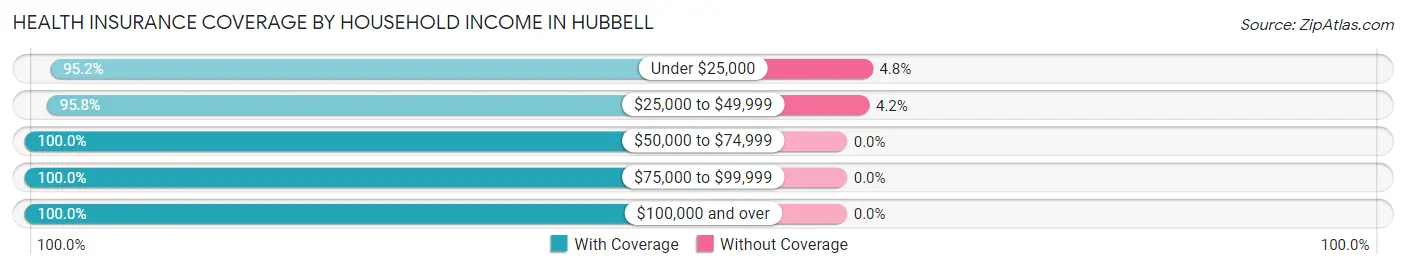
| Household Income | With Coverage | Without Coverage |
| Under $25,000 | 99 (95.2%) | 5 (4.8%) |
| $25,000 to $49,999 | 138 (95.8%) | 6 (4.2%) |
| $50,000 to $74,999 | 126 (100.0%) | 0 (0.0%) |
| $75,000 to $99,999 | 163 (100.0%) | 0 (0.0%) |
| $100,000 and over | 176 (100.0%) | 0 (0.0%) |
Public vs Private Health Insurance Coverage by Age in Hubbell
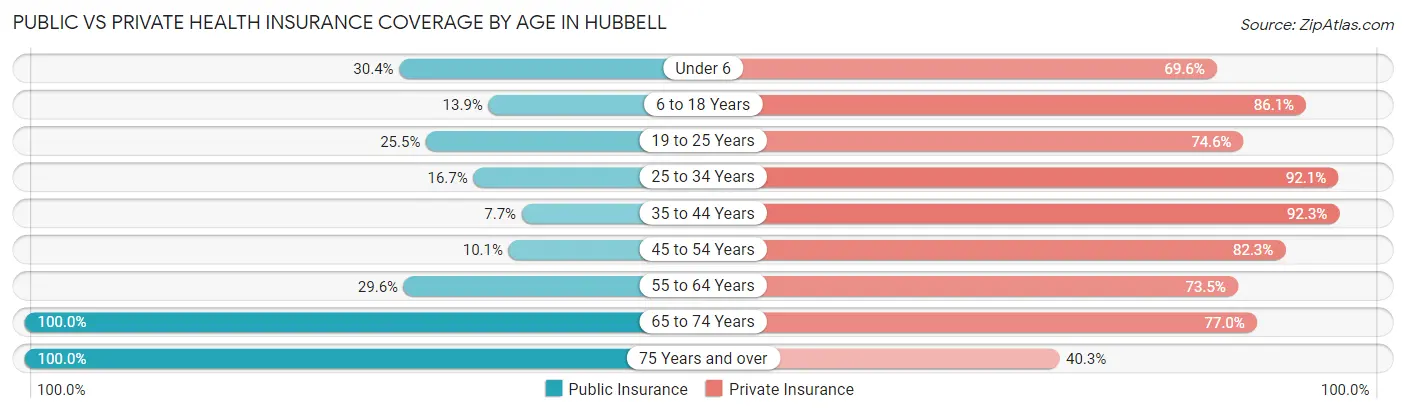
| Age Bracket | Public Insurance | Private Insurance |
| Under 6 | 7 (30.4%) | 16 (69.6%) |
| 6 to 18 Years | 14 (13.9%) | 87 (86.1%) |
| 19 to 25 Years | 14 (25.5%) | 41 (74.6%) |
| 25 to 34 Years | 19 (16.7%) | 105 (92.1%) |
| 35 to 44 Years | 7 (7.7%) | 84 (92.3%) |
| 45 to 54 Years | 8 (10.1%) | 65 (82.3%) |
| 55 to 64 Years | 29 (29.6%) | 72 (73.5%) |
| 65 to 74 Years | 100 (100.0%) | 77 (77.0%) |
| 75 Years and over | 62 (100.0%) | 25 (40.3%) |
| Total | 260 (36.0%) | 572 (79.1%) |
Disability Status by Sex by Age in Hubbell
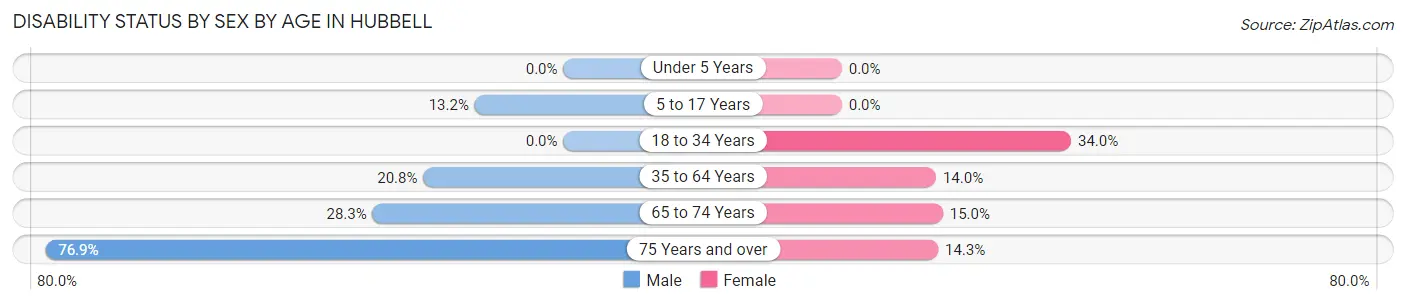
| Age Bracket | Male | Female |
| Under 5 Years | 0 (0.0%) | 0 (0.0%) |
| 5 to 17 Years | 10 (13.2%) | 0 (0.0%) |
| 18 to 34 Years | 0 (0.0%) | 16 (34.0%) |
| 35 to 64 Years | 26 (20.8%) | 20 (14.0%) |
| 65 to 74 Years | 17 (28.3%) | 6 (15.0%) |
| 75 Years and over | 10 (76.9%) | 7 (14.3%) |
Disability Class by Sex by Age in Hubbell
Disability Class: Hearing Difficulty
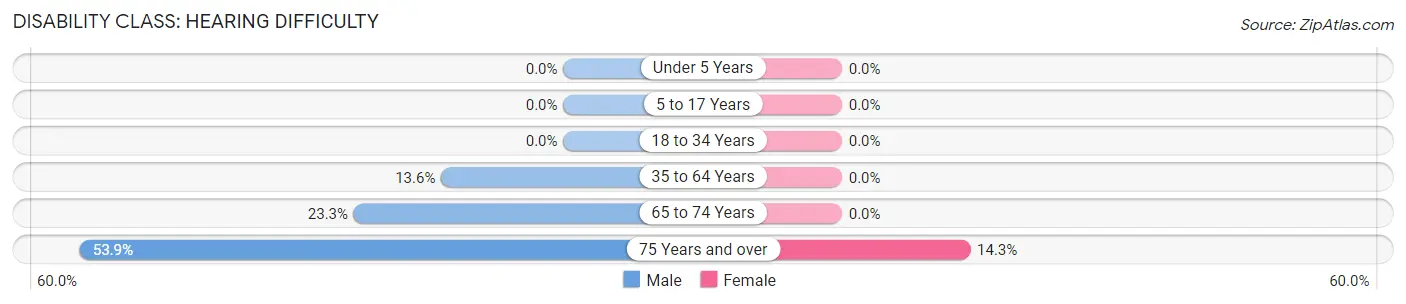
| Age Bracket | Male | Female |
| Under 5 Years | 0 (0.0%) | 0 (0.0%) |
| 5 to 17 Years | 0 (0.0%) | 0 (0.0%) |
| 18 to 34 Years | 0 (0.0%) | 0 (0.0%) |
| 35 to 64 Years | 17 (13.6%) | 0 (0.0%) |
| 65 to 74 Years | 14 (23.3%) | 0 (0.0%) |
| 75 Years and over | 7 (53.8%) | 7 (14.3%) |
Disability Class: Vision Difficulty
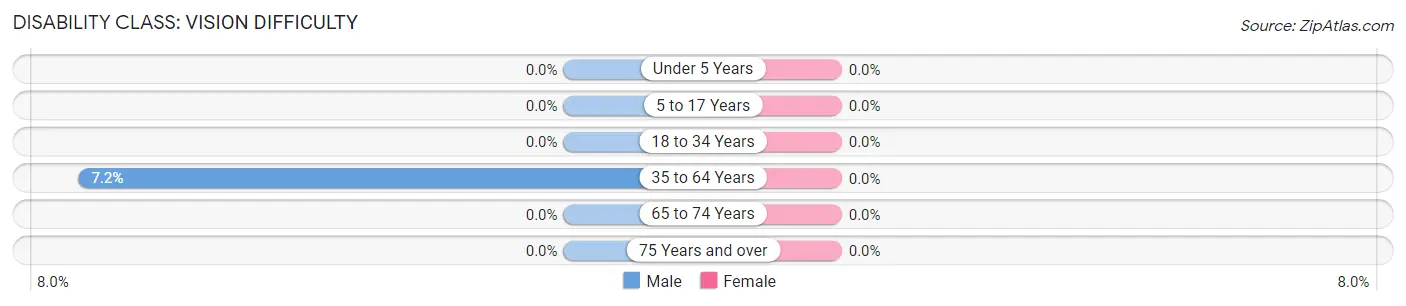
| Age Bracket | Male | Female |
| Under 5 Years | 0 (0.0%) | 0 (0.0%) |
| 5 to 17 Years | 0 (0.0%) | 0 (0.0%) |
| 18 to 34 Years | 0 (0.0%) | 0 (0.0%) |
| 35 to 64 Years | 9 (7.2%) | 0 (0.0%) |
| 65 to 74 Years | 0 (0.0%) | 0 (0.0%) |
| 75 Years and over | 0 (0.0%) | 0 (0.0%) |
Disability Class: Cognitive Difficulty
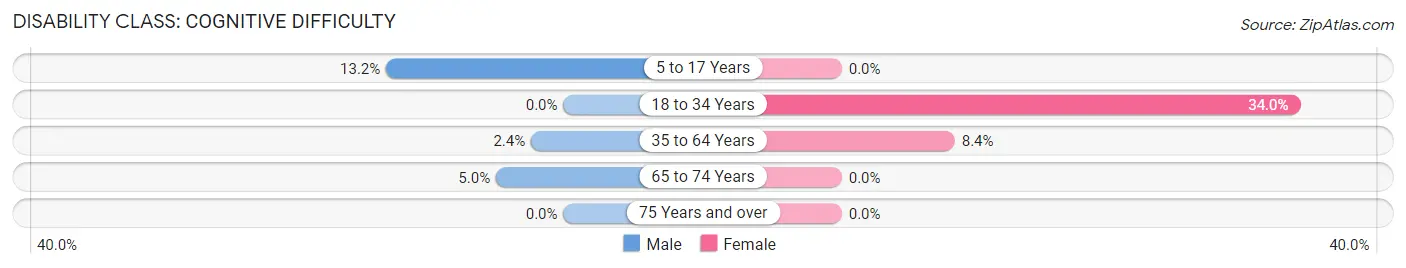
| Age Bracket | Male | Female |
| 5 to 17 Years | 10 (13.2%) | 0 (0.0%) |
| 18 to 34 Years | 0 (0.0%) | 16 (34.0%) |
| 35 to 64 Years | 3 (2.4%) | 12 (8.4%) |
| 65 to 74 Years | 3 (5.0%) | 0 (0.0%) |
| 75 Years and over | 0 (0.0%) | 0 (0.0%) |
Disability Class: Ambulatory Difficulty
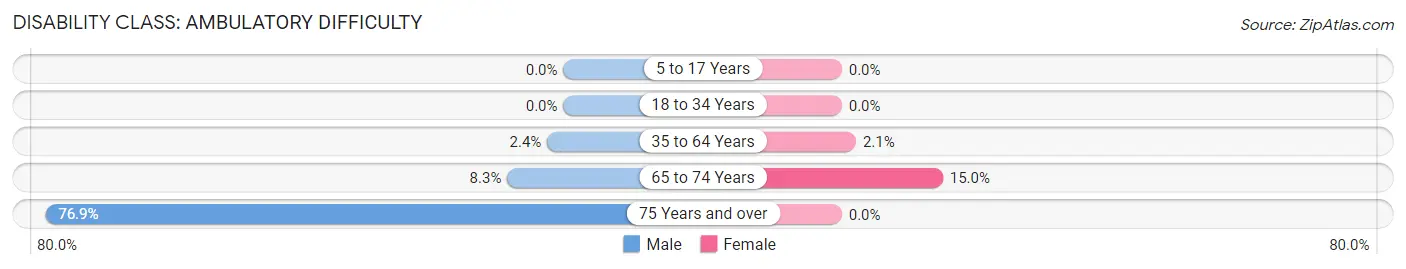
| Age Bracket | Male | Female |
| 5 to 17 Years | 0 (0.0%) | 0 (0.0%) |
| 18 to 34 Years | 0 (0.0%) | 0 (0.0%) |
| 35 to 64 Years | 3 (2.4%) | 3 (2.1%) |
| 65 to 74 Years | 5 (8.3%) | 6 (15.0%) |
| 75 Years and over | 10 (76.9%) | 0 (0.0%) |
Disability Class: Self-Care Difficulty
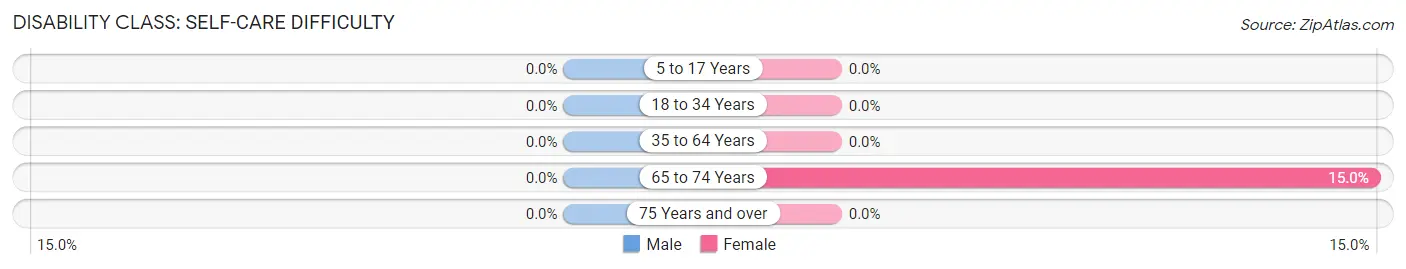
| Age Bracket | Male | Female |
| 5 to 17 Years | 0 (0.0%) | 0 (0.0%) |
| 18 to 34 Years | 0 (0.0%) | 0 (0.0%) |
| 35 to 64 Years | 0 (0.0%) | 0 (0.0%) |
| 65 to 74 Years | 0 (0.0%) | 6 (15.0%) |
| 75 Years and over | 0 (0.0%) | 0 (0.0%) |
Technology Access in Hubbell
Computing Device Access in Hubbell
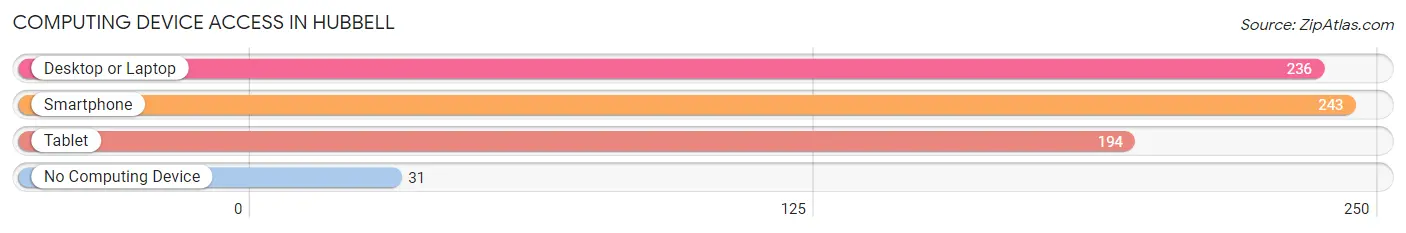
| Device Type | # Households | % Households |
| Desktop or Laptop | 236 | 67.2% |
| Smartphone | 243 | 69.2% |
| Tablet | 194 | 55.3% |
| No Computing Device | 31 | 8.8% |
| Total | 351 | 100.0% |
Internet Access in Hubbell
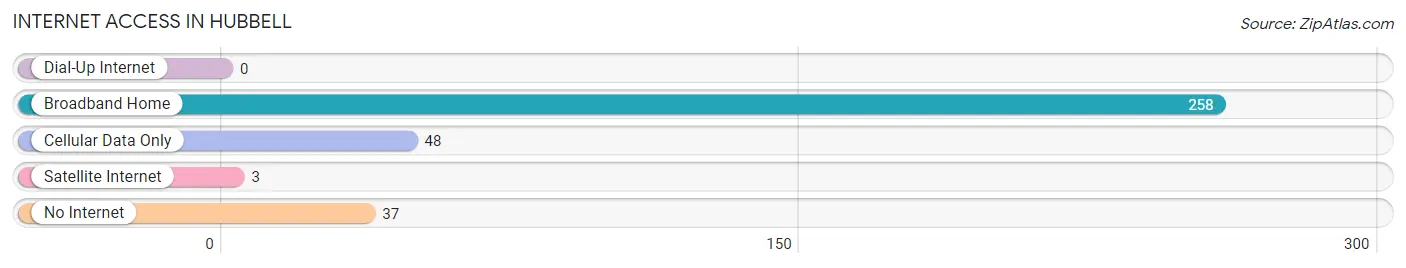
| Internet Type | # Households | % Households |
| Dial-Up Internet | 0 | 0.0% |
| Broadband Home | 258 | 73.5% |
| Cellular Data Only | 48 | 13.7% |
| Satellite Internet | 3 | 0.9% |
| No Internet | 37 | 10.5% |
| Total | 351 | 100.0% |
Hubbell Summary
Hubbell, Michigan is a small unincorporated community located in Houghton County, in the Upper Peninsula of Michigan. It is situated on the shores of Lake Superior, and is part of the Keweenaw Peninsula. The population of Hubbell was estimated to be around 500 in 2020.
History
The area that is now Hubbell was first settled in the late 1800s by Finnish immigrants. The first permanent settlers were the family of John and Mary Hubbell, who arrived in 1883. The Hubbells established a farm and a sawmill, and the area became known as Hubbell’s Corners. In 1887, the Hubbells opened a post office, and the area was officially named Hubbell.
In the early 1900s, Hubbell was a thriving community, with a variety of businesses, including a general store, a blacksmith shop, a hotel, and a lumber mill. The town also had a school, a church, and a library.
In the 1920s, the lumber industry began to decline, and many of the businesses in Hubbell closed. The population of the town began to decline as well, and by the 1950s, the population had dropped to around 200.
Geography
Hubbell is located in the Upper Peninsula of Michigan, on the shores of Lake Superior. It is part of the Keweenaw Peninsula, which is known for its rugged beauty and its abundance of natural resources. The area is home to a variety of wildlife, including deer, bear, and moose.
The climate in Hubbell is typical of the Upper Peninsula, with cold winters and warm summers. The average temperature in January is around 10°F, and the average temperature in July is around 70°F.
Economy
The economy of Hubbell is largely based on tourism. The town is a popular destination for outdoor enthusiasts, who come to enjoy the area’s natural beauty and its abundance of outdoor activities, such as fishing, hunting, and hiking.
The town also has a few small businesses, including a general store, a restaurant, and a gas station.
Demographics
The population of Hubbell was estimated to be around 500 in 2020. The town is predominantly white, with a small minority population. The median household income in Hubbell is around $35,000, and the median home value is around $100,000.
Common Questions
What is Per Capita Income in Hubbell?
Per Capita income in Hubbell is $29,803.
What is the Median Family Income in Hubbell?
Median Family Income in Hubbell is $81,875.
What is the Median Household income in Hubbell?
Median Household Income in Hubbell is $48,750.
What is Income or Wage Gap in Hubbell?
Income or Wage Gap in Hubbell is 3.0%.
Women in Hubbell earn 97.0 cents for every dollar earned by a man.
What is Inequality or Gini Index in Hubbell?
Inequality or Gini Index in Hubbell is 0.39.
What is the Total Population of Hubbell?
Total Population of Hubbell is 769.
What is the Total Male Population of Hubbell?
Total Male Population of Hubbell is 434.
What is the Total Female Population of Hubbell?
Total Female Population of Hubbell is 335.
What is the Ratio of Males per 100 Females in Hubbell?
There are 129.55 Males per 100 Females in Hubbell.
What is the Ratio of Females per 100 Males in Hubbell?
There are 77.19 Females per 100 Males in Hubbell.
What is the Median Population Age in Hubbell?
Median Population Age in Hubbell is 45.1 Years.
What is the Average Family Size in Hubbell
Average Family Size in Hubbell is 2.8 People.
What is the Average Household Size in Hubbell
Average Household Size in Hubbell is 2.0 People.
How Large is the Labor Force in Hubbell?
There are 421 People in the Labor Forcein in Hubbell.
What is the Percentage of People in the Labor Force in Hubbell?
65.3% of People are in the Labor Force in Hubbell.