Walnut Grove, CA Map & Demographics
Walnut Grove Map
Walnut Grove Overview
$40,751
PER CAPITA INCOME
$85,052
AVG FAMILY INCOME
$70,852
AVG HOUSEHOLD INCOME
0.47
INEQUALITY / GINI INDEX
814
TOTAL POPULATION
447
MALE POPULATION
367
FEMALE POPULATION
121.80
MALES / 100 FEMALES
82.10
FEMALES / 100 MALES
32.8
MEDIAN AGE
2.5
AVG FAMILY SIZE
2.4
AVG HOUSEHOLD SIZE
445
LABOR FORCE [ PEOPLE ]
61.7%
PERCENT IN LABOR FORCE
2.5%
UNEMPLOYMENT RATE
Walnut Grove Zip Codes
Income in Walnut Grove
Income Overview in Walnut Grove
Per Capita Income in Walnut Grove is $40,751, while median incomes of families and households are $85,052 and $70,852 respectively.
| Characteristic | Number | Measure |
| Per Capita Income | 814 | $40,751 |
| Median Family Income | 287 | $85,052 |
| Mean Family Income | 287 | $101,901 |
| Median Household Income | 347 | $70,852 |
| Mean Household Income | 347 | $94,762 |
| Income Deficit | 287 | $0 |
| Wage / Income Gap (%) | 814 | 0.00% |
| Wage / Income Gap ($) | 814 | 100.00¢ per $1 |
| Gini / Inequality Index | 814 | 0.47 |
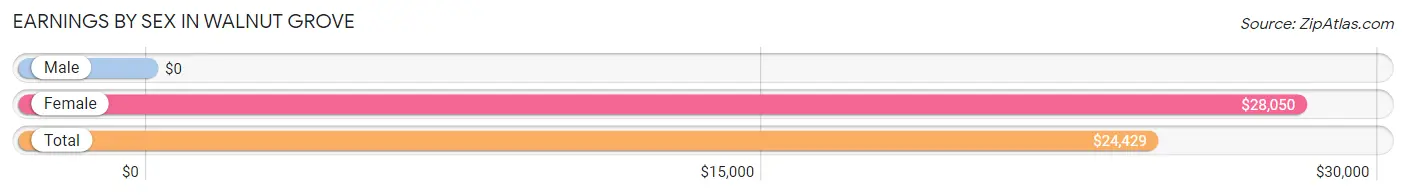
Earnings by Sex in Walnut Grove
| Sex | Number | Average Earnings |
| Male | 249 (53.4%) | $0 |
| Female | 217 (46.6%) | $28,050 |
| Total | 466 (100.0%) | $24,429 |
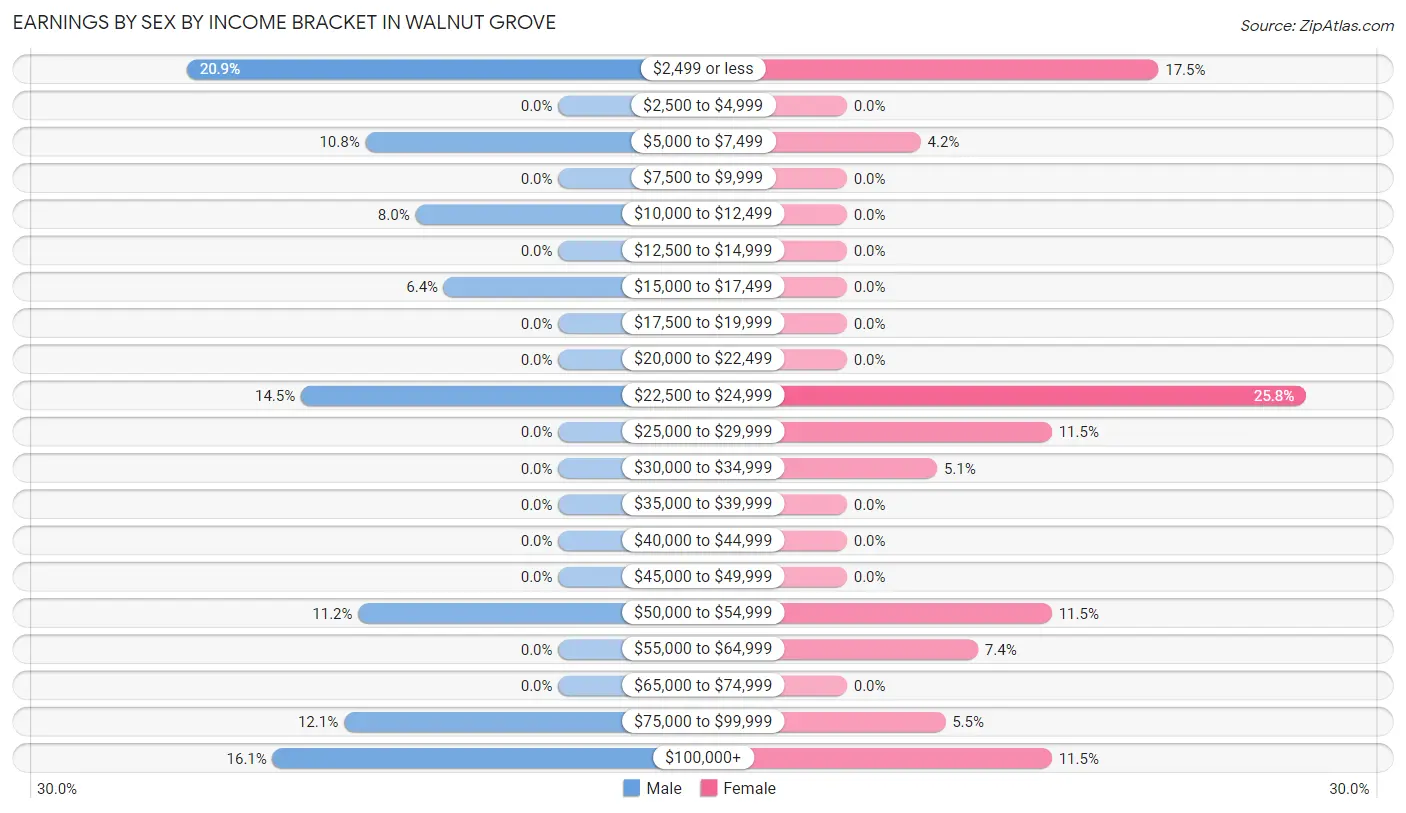
Earnings by Sex by Income Bracket in Walnut Grove
The most common earnings brackets in Walnut Grove are $2,499 or less for men (52 | 20.9%) and $22,500 to $24,999 for women (56 | 25.8%).
| Income | Male | Female |
| $2,499 or less | 52 (20.9%) | 38 (17.5%) |
| $2,500 to $4,999 | 0 (0.0%) | 0 (0.0%) |
| $5,000 to $7,499 | 27 (10.8%) | 9 (4.2%) |
| $7,500 to $9,999 | 0 (0.0%) | 0 (0.0%) |
| $10,000 to $12,499 | 20 (8.0%) | 0 (0.0%) |
| $12,500 to $14,999 | 0 (0.0%) | 0 (0.0%) |
| $15,000 to $17,499 | 16 (6.4%) | 0 (0.0%) |
| $17,500 to $19,999 | 0 (0.0%) | 0 (0.0%) |
| $20,000 to $22,499 | 0 (0.0%) | 0 (0.0%) |
| $22,500 to $24,999 | 36 (14.5%) | 56 (25.8%) |
| $25,000 to $29,999 | 0 (0.0%) | 25 (11.5%) |
| $30,000 to $34,999 | 0 (0.0%) | 11 (5.1%) |
| $35,000 to $39,999 | 0 (0.0%) | 0 (0.0%) |
| $40,000 to $44,999 | 0 (0.0%) | 0 (0.0%) |
| $45,000 to $49,999 | 0 (0.0%) | 0 (0.0%) |
| $50,000 to $54,999 | 28 (11.2%) | 25 (11.5%) |
| $55,000 to $64,999 | 0 (0.0%) | 16 (7.4%) |
| $65,000 to $74,999 | 0 (0.0%) | 0 (0.0%) |
| $75,000 to $99,999 | 30 (12.0%) | 12 (5.5%) |
| $100,000+ | 40 (16.1%) | 25 (11.5%) |
| Total | 249 (100.0%) | 217 (100.0%) |
Earnings by Sex by Educational Attainment in Walnut Grove
| Educational Attainment | Male Income | Female Income |
| Less than High School | - | - |
| High School Diploma | - | - |
| College or Associate's Degree | - | - |
| Bachelor's Degree | - | - |
| Graduate Degree | - | - |
| Total | - | - |
Family Income in Walnut Grove
Family Income Brackets in Walnut Grove
According to the Walnut Grove family income data, there are 56 families falling into the $200,000+ income range, which is the most common income bracket and makes up 19.5% of all families.
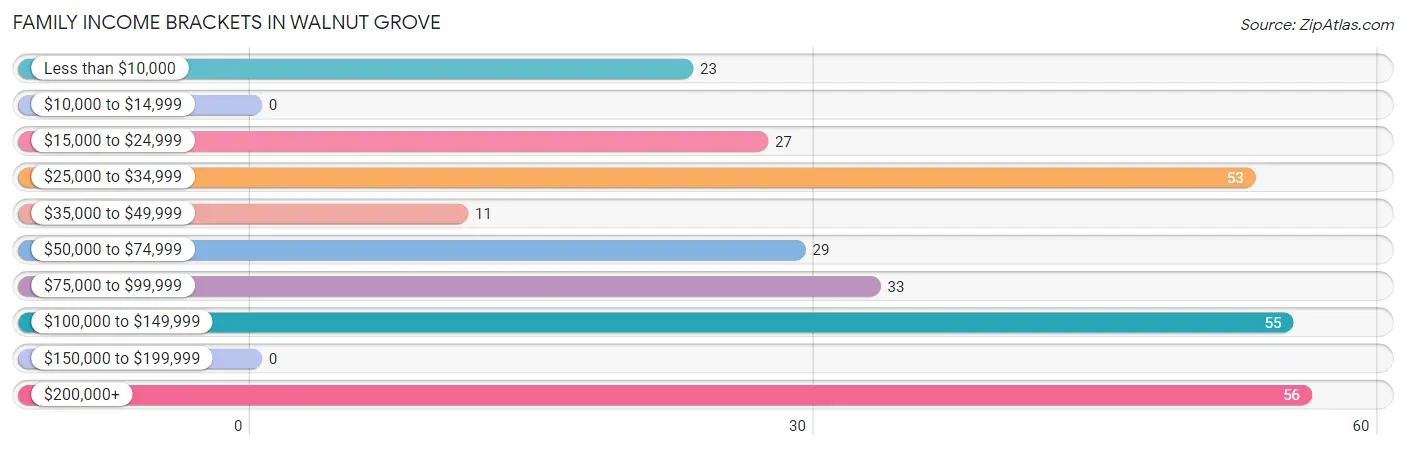
| Income Bracket | # Families | % Families |
| Less than $10,000 | 23 | 8.0% |
| $10,000 to $14,999 | 0 | 0.0% |
| $15,000 to $24,999 | 27 | 9.4% |
| $25,000 to $34,999 | 53 | 18.5% |
| $35,000 to $49,999 | 11 | 3.8% |
| $50,000 to $74,999 | 29 | 10.1% |
| $75,000 to $99,999 | 33 | 11.5% |
| $100,000 to $149,999 | 55 | 19.2% |
| $150,000 to $199,999 | 0 | 0.0% |
| $200,000+ | 56 | 19.5% |
Family Income by Famaliy Size in Walnut Grove
2-person families (140 | 48.8%) account for the highest median family income in Walnut Grove with $72,500 per family, while 2-person families (140 | 48.8%) have the highest median income of $36,250 per family member.
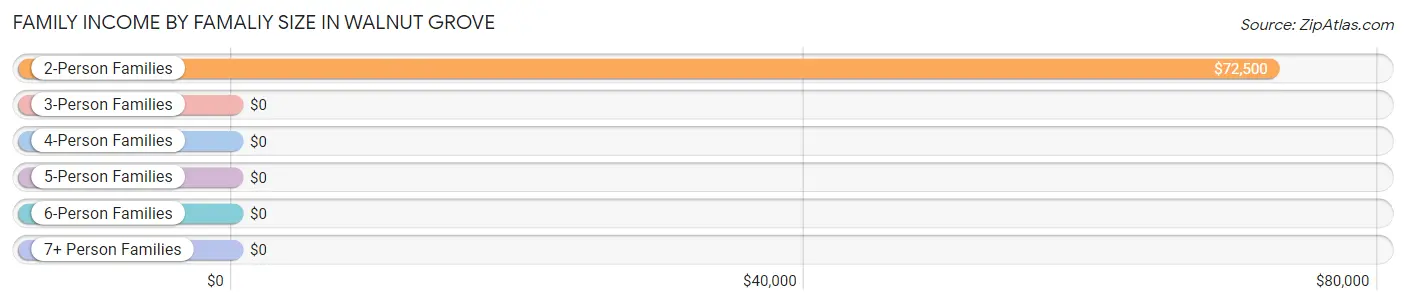
| Income Bracket | # Families | Median Income |
| 2-Person Families | 140 (48.8%) | $72,500 |
| 3-Person Families | 147 (51.2%) | $0 |
| 4-Person Families | 0 (0.0%) | $0 |
| 5-Person Families | 0 (0.0%) | $0 |
| 6-Person Families | 0 (0.0%) | $0 |
| 7+ Person Families | 0 (0.0%) | $0 |
| Total | 287 (100.0%) | $85,052 |
Family Income by Number of Earners in Walnut Grove
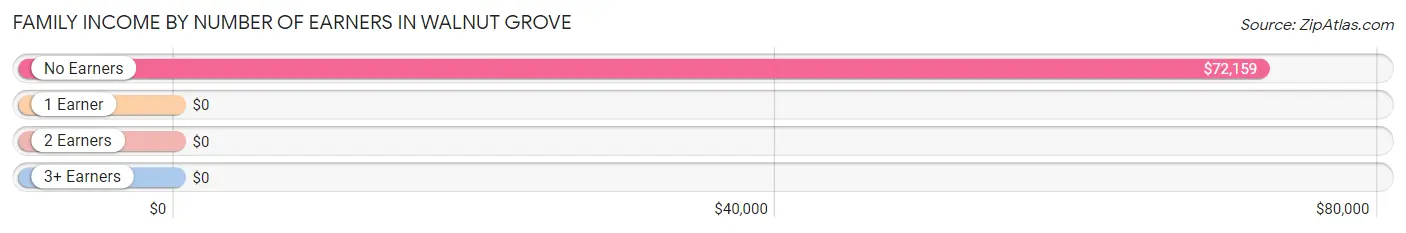
| Number of Earners | # Families | Median Income |
| No Earners | 38 (13.2%) | $72,159 |
| 1 Earner | 132 (46.0%) | $0 |
| 2 Earners | 85 (29.6%) | $0 |
| 3+ Earners | 32 (11.2%) | $0 |
| Total | 287 (100.0%) | $85,052 |
Household Income in Walnut Grove
Household Income Brackets in Walnut Grove
With 64 households falling in the category, the $25,000 to $34,999 income range is the most frequent in Walnut Grove, accounting for 18.4% of all households.
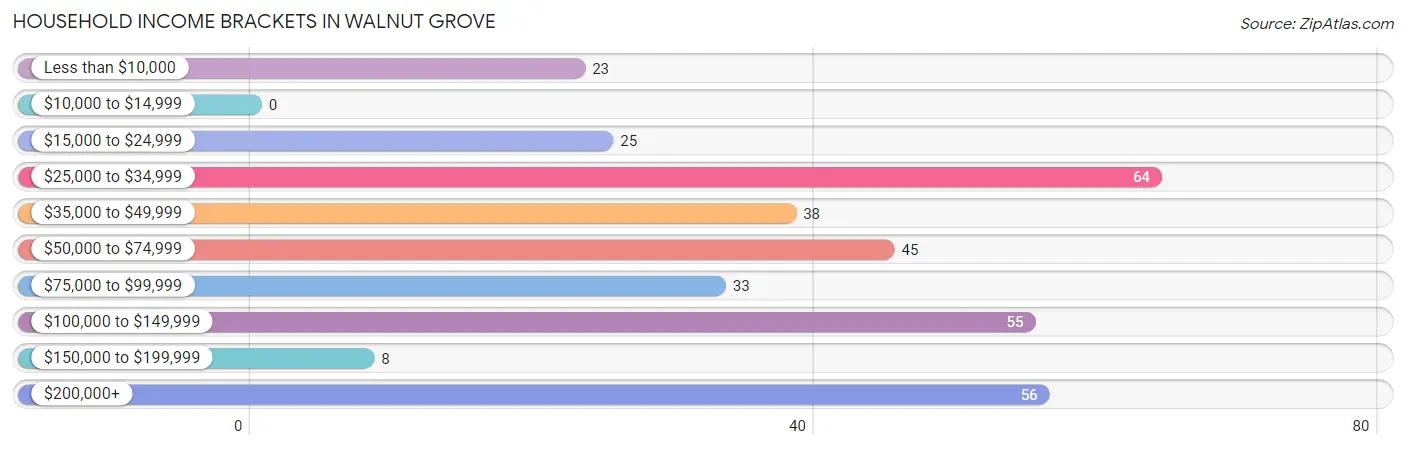
| Income Bracket | # Households | % Households |
| Less than $10,000 | 23 | 6.6% |
| $10,000 to $14,999 | 0 | 0.0% |
| $15,000 to $24,999 | 25 | 7.2% |
| $25,000 to $34,999 | 64 | 18.4% |
| $35,000 to $49,999 | 38 | 11.0% |
| $50,000 to $74,999 | 45 | 13.0% |
| $75,000 to $99,999 | 33 | 9.5% |
| $100,000 to $149,999 | 55 | 15.9% |
| $150,000 to $199,999 | 8 | 2.3% |
| $200,000+ | 56 | 16.1% |
Household Income by Householder Age in Walnut Grove
The median household income in Walnut Grove is $70,852, with the highest median household income of $71,932 found in the 65+ years age bracket for the primary householder. A total of 108 households (31.1%) fall into this category. Meanwhile, the 15 to 24 years age bracket for the primary householder has the lowest median household income of $0, with 39 households (11.2%) in this group.
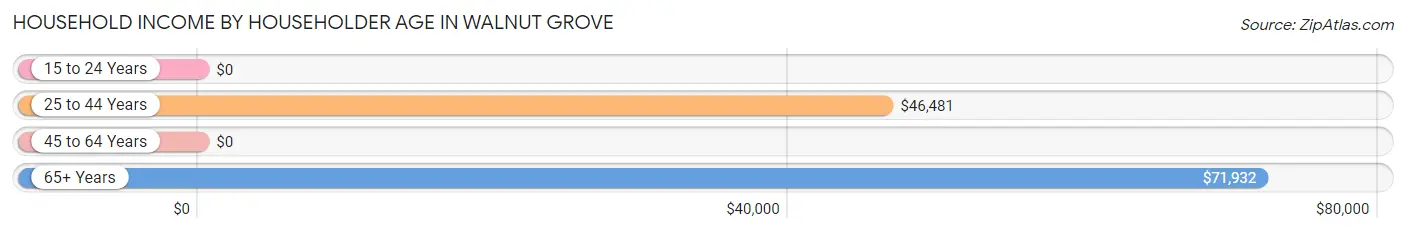
| Income Bracket | # Households | Median Income |
| 15 to 24 Years | 39 (11.2%) | $0 |
| 25 to 44 Years | 104 (30.0%) | $46,481 |
| 45 to 64 Years | 96 (27.7%) | $0 |
| 65+ Years | 108 (31.1%) | $71,932 |
| Total | 347 (100.0%) | $70,852 |
Poverty in Walnut Grove
Income Below Poverty by Sex and Age in Walnut Grove
With 20.8% poverty level for males and 14.4% for females among the residents of Walnut Grove, 6 to 11 year old males and 12 to 14 year old females are the most vulnerable to poverty, with 27 males (100.0%) and 26 females (100.0%) in their respective age groups living below the poverty level.
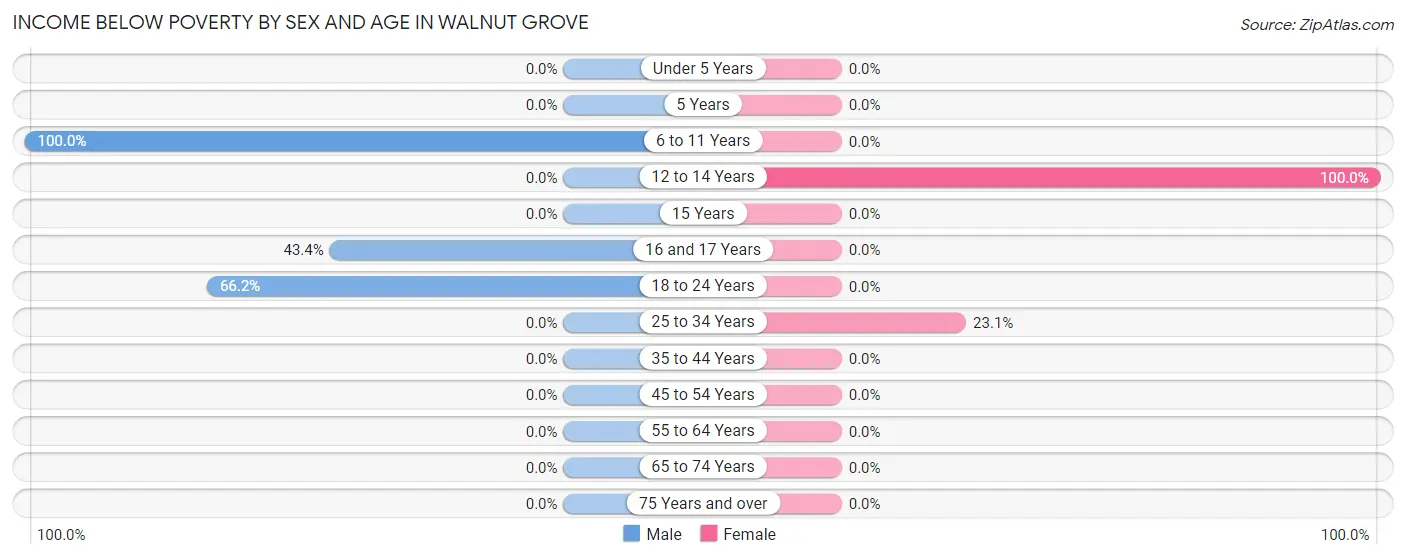
| Age Bracket | Male | Female |
| Under 5 Years | 0 (0.0%) | 0 (0.0%) |
| 5 Years | 0 (0.0%) | 0 (0.0%) |
| 6 to 11 Years | 27 (100.0%) | 0 (0.0%) |
| 12 to 14 Years | 0 (0.0%) | 26 (100.0%) |
| 15 Years | 0 (0.0%) | 0 (0.0%) |
| 16 and 17 Years | 23 (43.4%) | 0 (0.0%) |
| 18 to 24 Years | 43 (66.1%) | 0 (0.0%) |
| 25 to 34 Years | 0 (0.0%) | 27 (23.1%) |
| 35 to 44 Years | 0 (0.0%) | 0 (0.0%) |
| 45 to 54 Years | 0 (0.0%) | 0 (0.0%) |
| 55 to 64 Years | 0 (0.0%) | 0 (0.0%) |
| 65 to 74 Years | 0 (0.0%) | 0 (0.0%) |
| 75 Years and over | 0 (0.0%) | 0 (0.0%) |
| Total | 93 (20.8%) | 53 (14.4%) |
Income Above Poverty by Sex and Age in Walnut Grove
According to the poverty statistics in Walnut Grove, males aged under 5 years and females aged 16 and 17 years are the age groups that are most secure financially, with 100.0% of males and 100.0% of females in these age groups living above the poverty line.
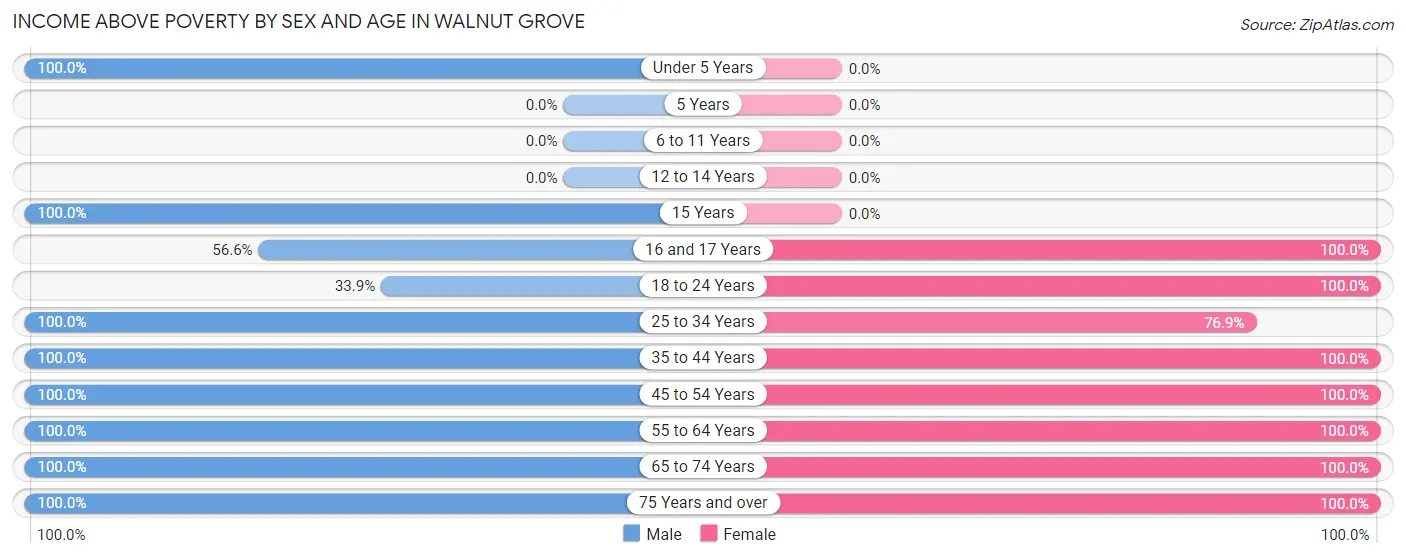
| Age Bracket | Male | Female |
| Under 5 Years | 30 (100.0%) | 0 (0.0%) |
| 5 Years | 0 (0.0%) | 0 (0.0%) |
| 6 to 11 Years | 0 (0.0%) | 0 (0.0%) |
| 12 to 14 Years | 0 (0.0%) | 0 (0.0%) |
| 15 Years | 10 (100.0%) | 0 (0.0%) |
| 16 and 17 Years | 30 (56.6%) | 28 (100.0%) |
| 18 to 24 Years | 22 (33.9%) | 18 (100.0%) |
| 25 to 34 Years | 73 (100.0%) | 90 (76.9%) |
| 35 to 44 Years | 11 (100.0%) | 16 (100.0%) |
| 45 to 54 Years | 43 (100.0%) | 12 (100.0%) |
| 55 to 64 Years | 53 (100.0%) | 25 (100.0%) |
| 65 to 74 Years | 17 (100.0%) | 99 (100.0%) |
| 75 Years and over | 65 (100.0%) | 26 (100.0%) |
| Total | 354 (79.2%) | 314 (85.6%) |
Income Below Poverty Among Married-Couple Families in Walnut Grove
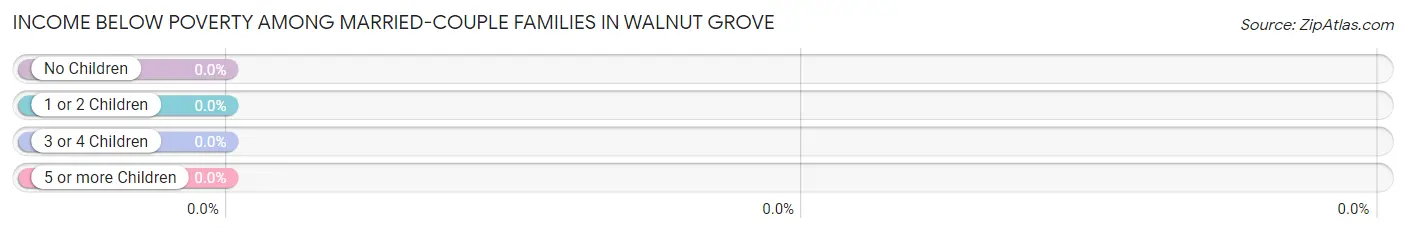
| Children | Above Poverty | Below Poverty |
| No Children | 141 (100.0%) | 0 (0.0%) |
| 1 or 2 Children | 36 (100.0%) | 0 (0.0%) |
| 3 or 4 Children | 0 (0.0%) | 0 (0.0%) |
| 5 or more Children | 0 (0.0%) | 0 (0.0%) |
| Total | 177 (100.0%) | 0 (0.0%) |
Income Below Poverty Among Single-Parent Households in Walnut Grove
According to the poverty data in Walnut Grove, 34.8% or 23 single-father households and 61.4% or 27 single-mother households are living below the poverty line. Among single-father households, those with no children have the highest poverty rate, with 23 households (67.6%) experiencing poverty. Likewise, among single-mother households, those with 1 or 2 children have the highest poverty rate, with 27 households (100.0%) falling below the poverty line.
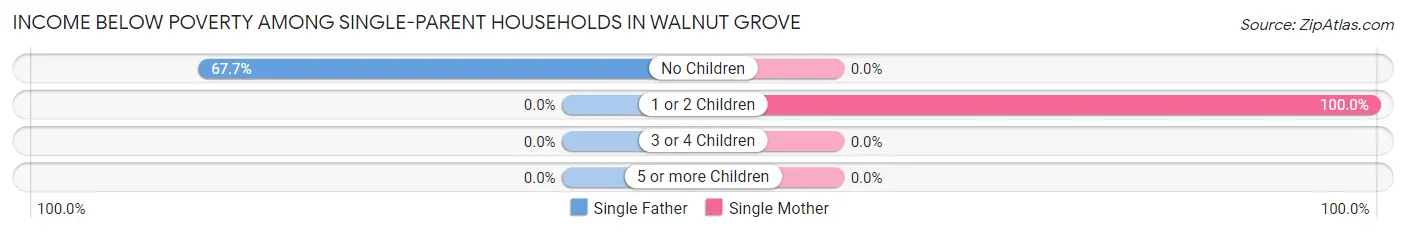
| Children | Single Father | Single Mother |
| No Children | 23 (67.6%) | 0 (0.0%) |
| 1 or 2 Children | 0 (0.0%) | 27 (100.0%) |
| 3 or 4 Children | 0 (0.0%) | 0 (0.0%) |
| 5 or more Children | 0 (0.0%) | 0 (0.0%) |
| Total | 23 (34.8%) | 27 (61.4%) |
Income Below Poverty Among Married-Couple vs Single-Parent Households in Walnut Grove
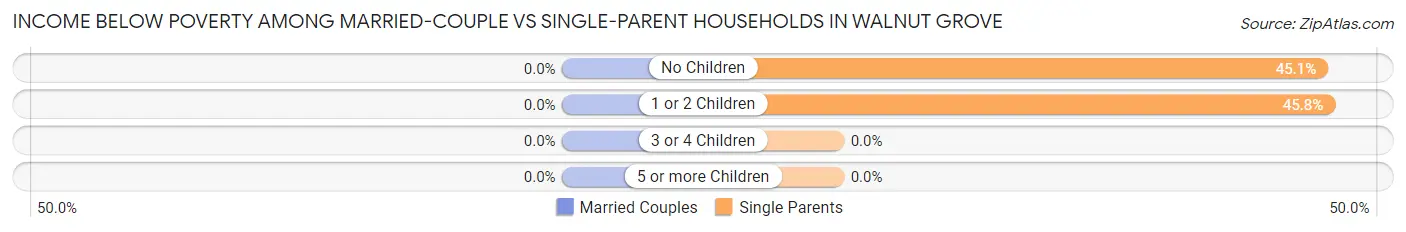
| Children | Married-Couple Families | Single-Parent Households |
| No Children | 0 (0.0%) | 23 (45.1%) |
| 1 or 2 Children | 0 (0.0%) | 27 (45.8%) |
| 3 or 4 Children | 0 (0.0%) | 0 (0.0%) |
| 5 or more Children | 0 (0.0%) | 0 (0.0%) |
| Total | 0 (0.0%) | 50 (45.5%) |
Race in Walnut Grove
The most populous races in Walnut Grove are White / Caucasian (496 | 60.9%), Hispanic or Latino (323 | 39.7%), and Some other Race (260 | 31.9%).
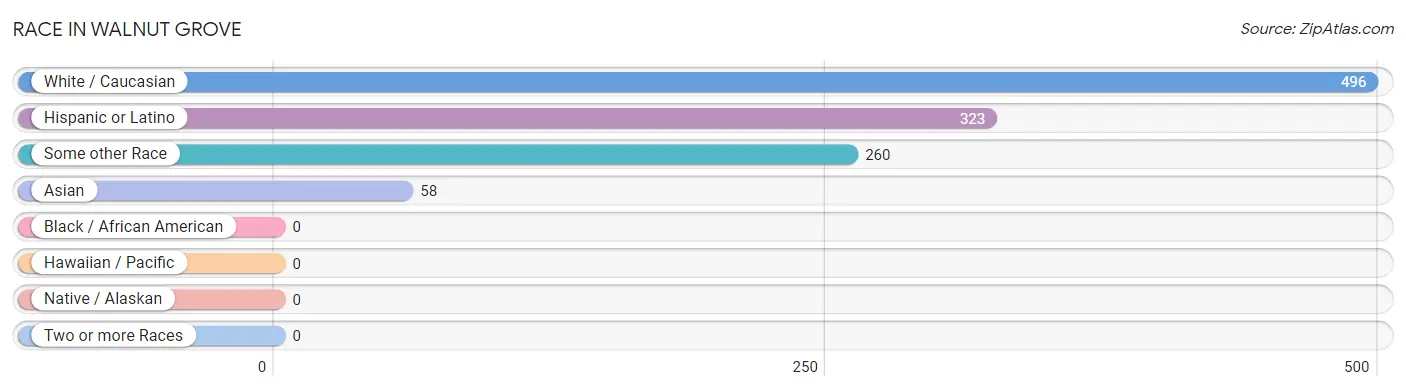
| Race | # Population | % Population |
| Asian | 58 | 7.1% |
| Black / African American | 0 | 0.0% |
| Hawaiian / Pacific | 0 | 0.0% |
| Hispanic or Latino | 323 | 39.7% |
| Native / Alaskan | 0 | 0.0% |
| White / Caucasian | 496 | 60.9% |
| Two or more Races | 0 | 0.0% |
| Some other Race | 260 | 31.9% |
| Total | 814 | 100.0% |
Ancestry in Walnut Grove
The most populous ancestries reported in Walnut Grove are Mexican (323 | 39.7%), Portuguese (90 | 11.1%), French (83 | 10.2%), Danish (76 | 9.3%), and English (75 | 9.2%), together accounting for 79.5% of all Walnut Grove residents.
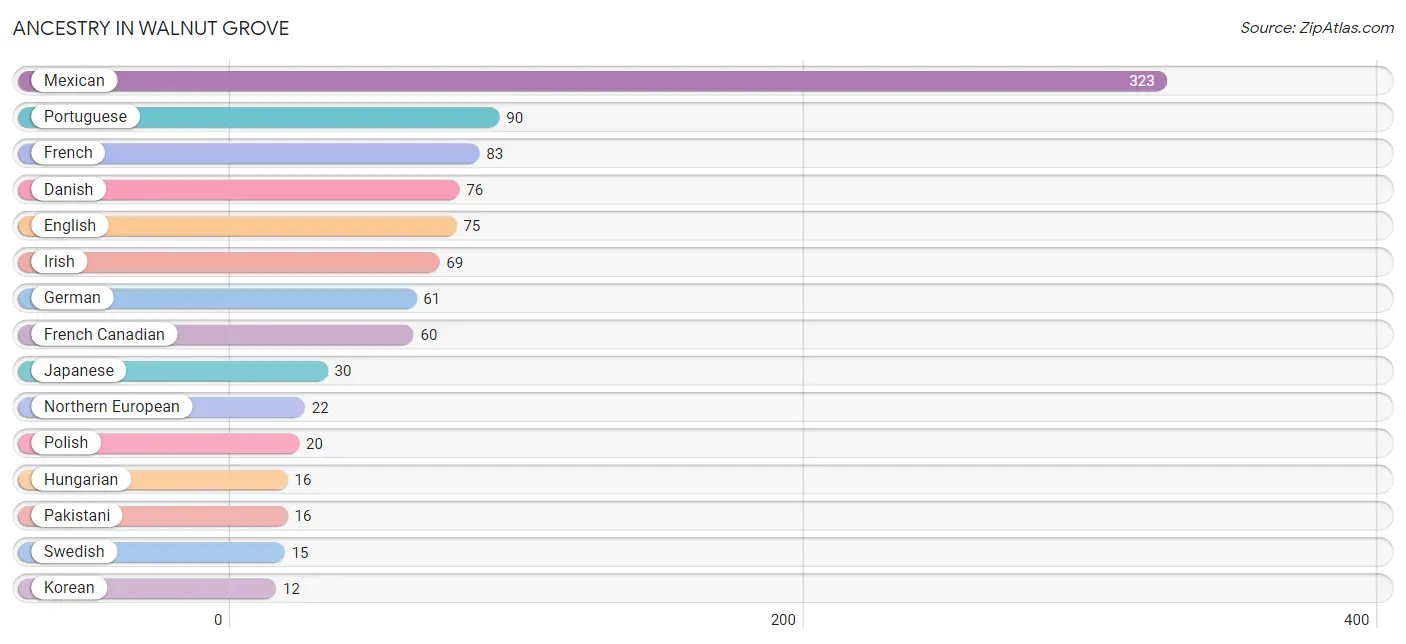
| Ancestry | # Population | % Population |
| Croatian | 9 | 1.1% |
| Danish | 76 | 9.3% |
| English | 75 | 9.2% |
| French | 83 | 10.2% |
| French Canadian | 60 | 7.4% |
| German | 61 | 7.5% |
| Hungarian | 16 | 2.0% |
| Irish | 69 | 8.5% |
| Italian | 9 | 1.1% |
| Japanese | 30 | 3.7% |
| Korean | 12 | 1.5% |
| Mexican | 323 | 39.7% |
| Northern European | 22 | 2.7% |
| Pakistani | 16 | 2.0% |
| Polish | 20 | 2.5% |
| Portuguese | 90 | 11.1% |
| Scandinavian | 9 | 1.1% |
| Swedish | 15 | 1.8% |
| Welsh | 8 | 1.0% | View All 19 Rows |
Immigrants in Walnut Grove
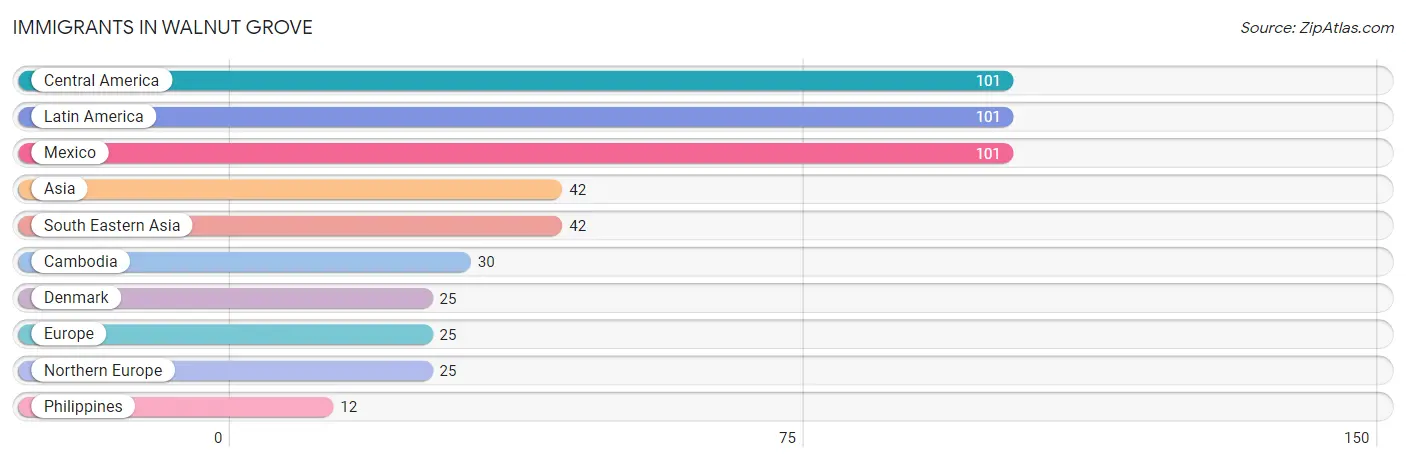
The most numerous immigrant groups reported in Walnut Grove came from Central America (101 | 12.4%), Latin America (101 | 12.4%), Mexico (101 | 12.4%), Asia (42 | 5.2%), and South Eastern Asia (42 | 5.2%), together accounting for 47.5% of all Walnut Grove residents.
| Immigration Origin | # Population | % Population |
| Asia | 42 | 5.2% |
| Cambodia | 30 | 3.7% |
| Central America | 101 | 12.4% |
| Denmark | 25 | 3.1% |
| Europe | 25 | 3.1% |
| Latin America | 101 | 12.4% |
| Mexico | 101 | 12.4% |
| Northern Europe | 25 | 3.1% |
| Philippines | 12 | 1.5% |
| South Eastern Asia | 42 | 5.2% | View All 10 Rows |
Sex and Age in Walnut Grove
Sex and Age in Walnut Grove
The most populous age groups in Walnut Grove are 15 to 19 Years (79 | 17.7%) for men and 30 to 34 Years (63 | 17.2%) for women.
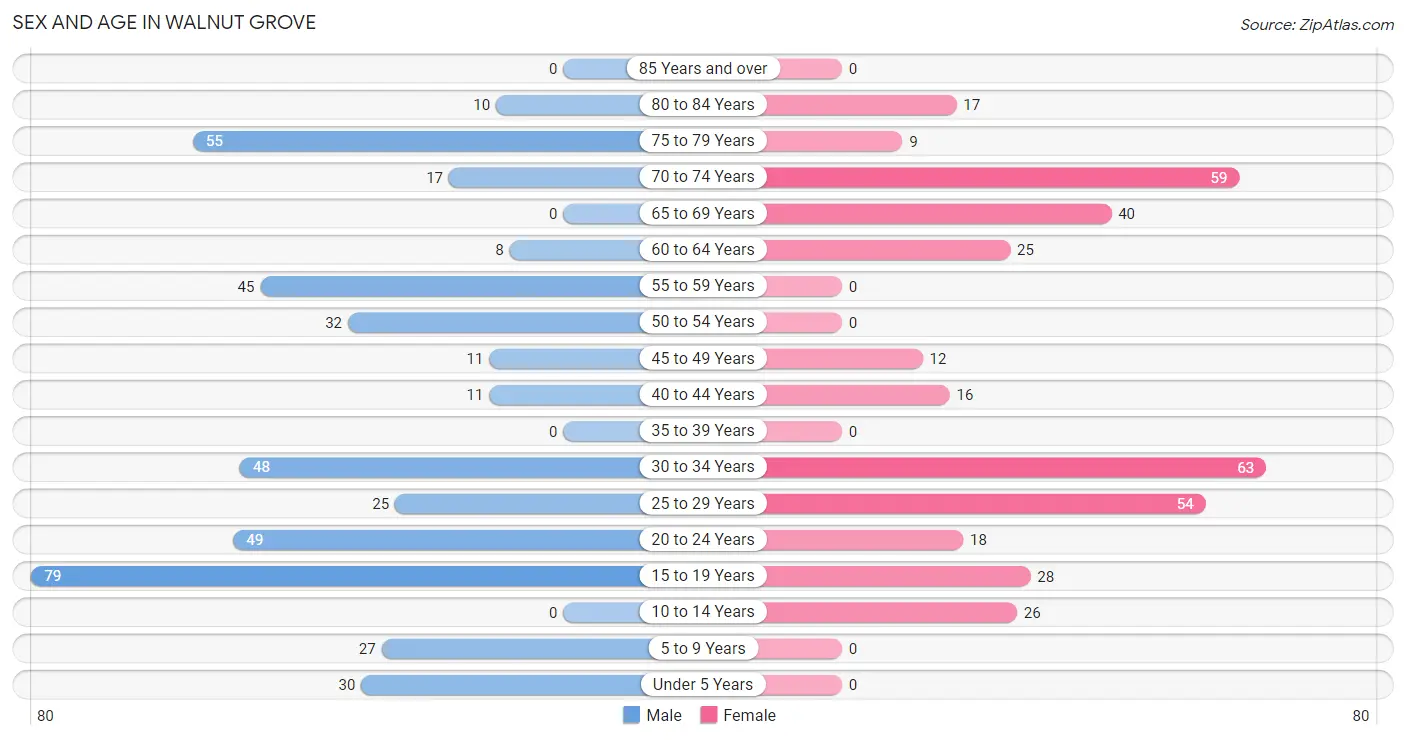
| Age Bracket | Male | Female |
| Under 5 Years | 30 (6.7%) | 0 (0.0%) |
| 5 to 9 Years | 27 (6.0%) | 0 (0.0%) |
| 10 to 14 Years | 0 (0.0%) | 26 (7.1%) |
| 15 to 19 Years | 79 (17.7%) | 28 (7.6%) |
| 20 to 24 Years | 49 (11.0%) | 18 (4.9%) |
| 25 to 29 Years | 25 (5.6%) | 54 (14.7%) |
| 30 to 34 Years | 48 (10.7%) | 63 (17.2%) |
| 35 to 39 Years | 0 (0.0%) | 0 (0.0%) |
| 40 to 44 Years | 11 (2.5%) | 16 (4.4%) |
| 45 to 49 Years | 11 (2.5%) | 12 (3.3%) |
| 50 to 54 Years | 32 (7.2%) | 0 (0.0%) |
| 55 to 59 Years | 45 (10.1%) | 0 (0.0%) |
| 60 to 64 Years | 8 (1.8%) | 25 (6.8%) |
| 65 to 69 Years | 0 (0.0%) | 40 (10.9%) |
| 70 to 74 Years | 17 (3.8%) | 59 (16.1%) |
| 75 to 79 Years | 55 (12.3%) | 9 (2.5%) |
| 80 to 84 Years | 10 (2.2%) | 17 (4.6%) |
| 85 Years and over | 0 (0.0%) | 0 (0.0%) |
| Total | 447 (100.0%) | 367 (100.0%) |
Families and Households in Walnut Grove
Median Family Size in Walnut Grove
The median family size in Walnut Grove is 2.54 persons per family, with single female/mother families (44 | 15.3%) accounting for the largest median family size of 3.07 persons per family. On the other hand, married-couple families (177 | 61.7%) represent the smallest median family size with 2.39 persons per family.
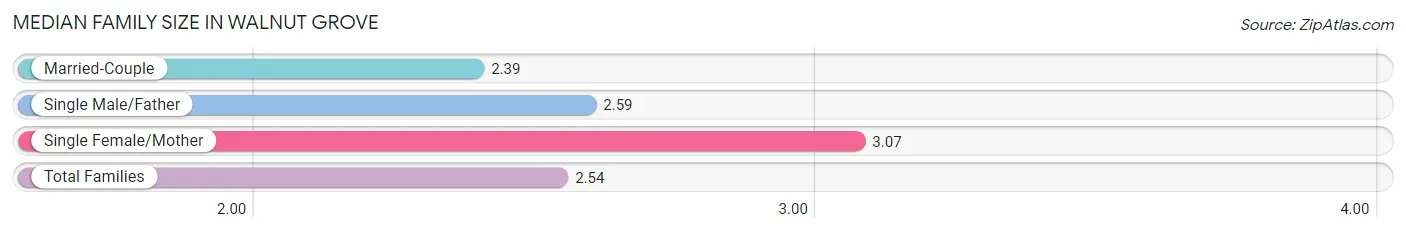
| Family Type | # Families | Family Size |
| Married-Couple | 177 (61.7%) | 2.39 |
| Single Male/Father | 66 (23.0%) | 2.59 |
| Single Female/Mother | 44 (15.3%) | 3.07 |
| Total Families | 287 (100.0%) | 2.54 |
Median Household Size in Walnut Grove
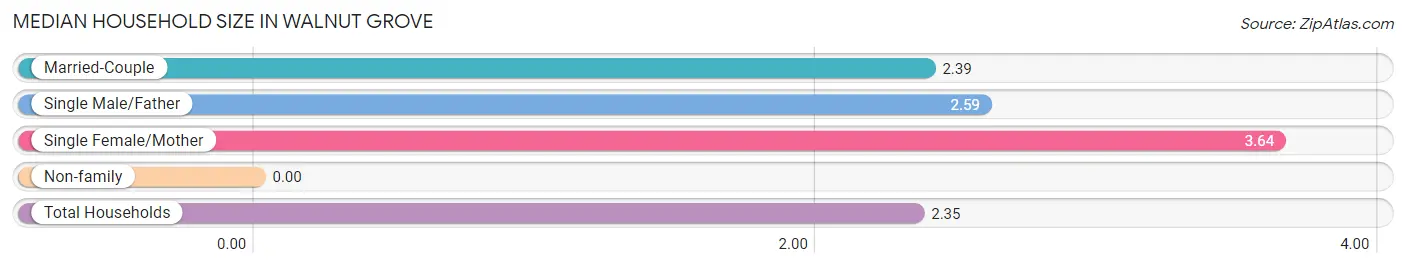
| Household Type | # Households | Household Size |
| Married-Couple | 177 (51.0%) | 2.39 |
| Single Male/Father | 66 (19.0%) | 2.59 |
| Single Female/Mother | 44 (12.7%) | 3.64 |
| Non-family | 60 (17.3%) | - |
| Total Households | 347 (100.0%) | 2.35 |
Household Size by Marriage Status in Walnut Grove
Out of a total of 347 households in Walnut Grove, 287 (82.7%) are family households, while 60 (17.3%) are nonfamily households. The most numerous type of family households are 2-person households, comprising 140, and the most common type of nonfamily households are 1-person households, comprising 60.
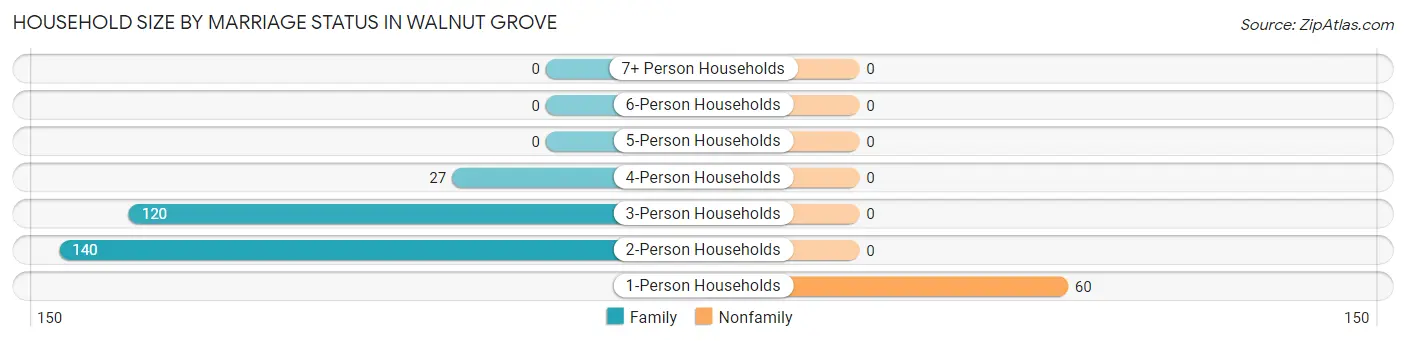
| Household Size | Family Households | Nonfamily Households |
| 1-Person Households | - | 60 (17.3%) |
| 2-Person Households | 140 (40.4%) | 0 (0.0%) |
| 3-Person Households | 120 (34.6%) | 0 (0.0%) |
| 4-Person Households | 27 (7.8%) | 0 (0.0%) |
| 5-Person Households | 0 (0.0%) | 0 (0.0%) |
| 6-Person Households | 0 (0.0%) | 0 (0.0%) |
| 7+ Person Households | 0 (0.0%) | 0 (0.0%) |
| Total | 287 (82.7%) | 60 (17.3%) |
Female Fertility in Walnut Grove
Fertility by Age in Walnut Grove
| Age Bracket | Women with Births | Births / 1,000 Women |
| 15 to 19 years | 0 (0.0%) | 0.0 |
| 20 to 34 years | 0 (0.0%) | 0.0 |
| 35 to 50 years | 0 (0.0%) | 0.0 |
| Total | 0 (0.0%) | 0.0 |
Fertility by Age by Marriage Status in Walnut Grove
| Age Bracket | Married | Unmarried |
| 15 to 19 years | 0 (0.0%) | 0 (0.0%) |
| 20 to 34 years | 0 (0.0%) | 0 (0.0%) |
| 35 to 50 years | 0 (0.0%) | 0 (0.0%) |
| Total | 0 (0.0%) | 0 (0.0%) |
Fertility by Education in Walnut Grove
| Educational Attainment | Women with Births | Births / 1,000 Women |
| Less than High School | 0 (0.0%) | 0.0 |
| High School Diploma | 0 (0.0%) | 0.0 |
| College or Associate's Degree | 0 (0.0%) | 0.0 |
| Bachelor's Degree | 0 (0.0%) | 0.0 |
| Graduate Degree | 0 (0.0%) | 0.0 |
| Total | 0 (0.0%) | 0.0 |
Fertility by Education by Marriage Status in Walnut Grove

| Educational Attainment | Married | Unmarried |
| Less than High School | 0 (0.0%) | 0 (0.0%) |
| High School Diploma | 0 (0.0%) | 0 (0.0%) |
| College or Associate's Degree | 0 (0.0%) | 0 (0.0%) |
| Bachelor's Degree | 0 (0.0%) | 0 (0.0%) |
| Graduate Degree | 0 (0.0%) | 0 (0.0%) |
| Total | 0 (0.0%) | 0 (0.0%) |
Employment Characteristics in Walnut Grove
Employment by Class of Employer in Walnut Grove
Among the 434 employed individuals in Walnut Grove, private company employees (306 | 70.5%), state government employees (53 | 12.2%), and not-for-profit organizations (41 | 9.5%) make up the most common classes of employment.
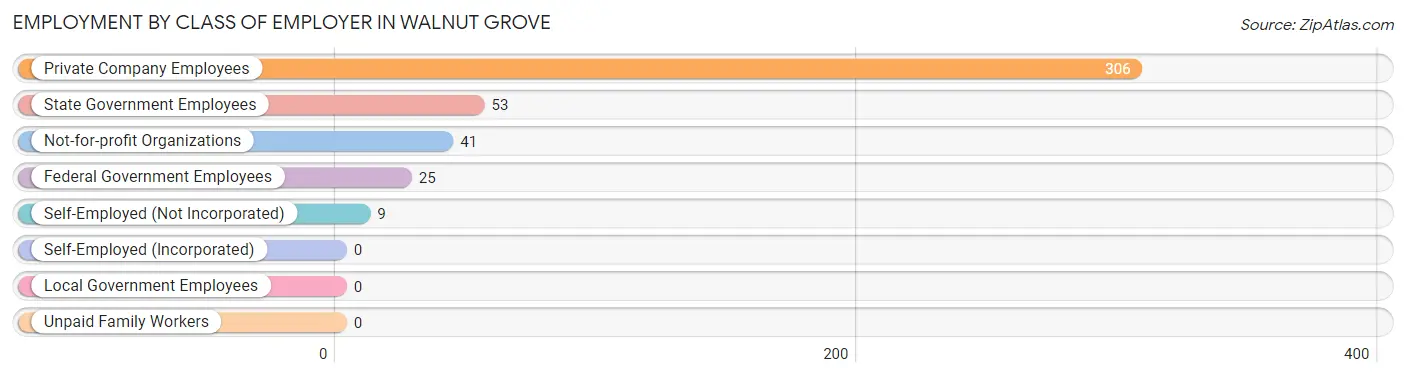
| Employer Class | # Employees | % Employees |
| Private Company Employees | 306 | 70.5% |
| Self-Employed (Incorporated) | 0 | 0.0% |
| Self-Employed (Not Incorporated) | 9 | 2.1% |
| Not-for-profit Organizations | 41 | 9.5% |
| Local Government Employees | 0 | 0.0% |
| State Government Employees | 53 | 12.2% |
| Federal Government Employees | 25 | 5.8% |
| Unpaid Family Workers | 0 | 0.0% |
| Total | 434 | 100.0% |
Employment Status by Age in Walnut Grove
According to the labor force statistics for Walnut Grove, out of the total population over 16 years of age (721), 61.7% or 445 individuals are in the labor force, with 2.5% or 11 of them unemployed. The age group with the highest labor force participation rate is 25 to 29 years, with 100.0% or 79 individuals in the labor force. Within the labor force, the 35 to 44 years age range has the highest percentage of unemployed individuals, with 40.7% or 11 of them being unemployed.
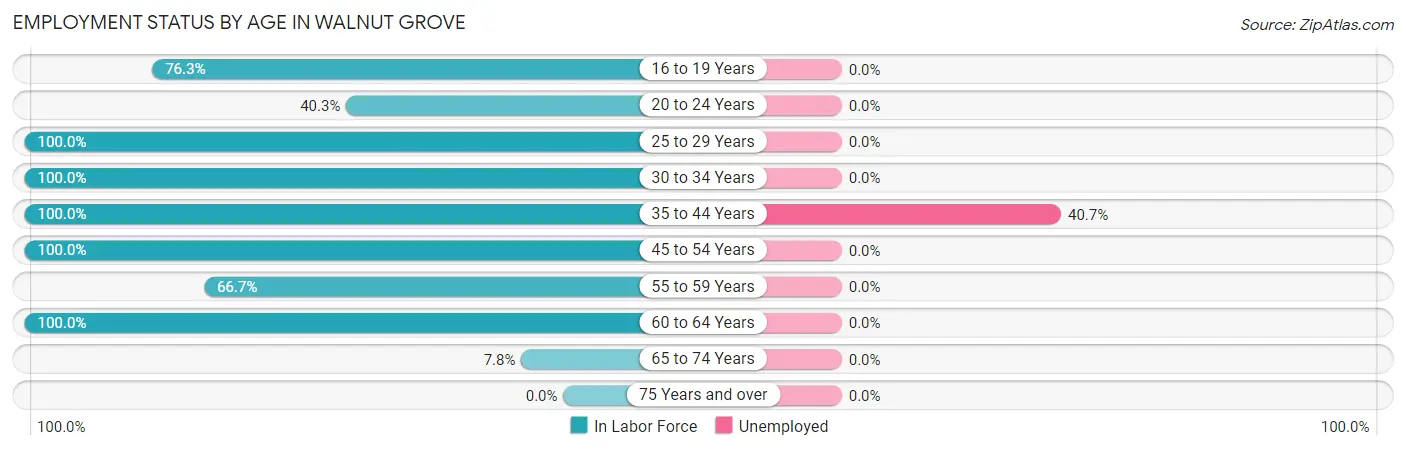
| Age Bracket | In Labor Force | Unemployed |
| 16 to 19 Years | 74 (76.3%) | 0 (0.0%) |
| 20 to 24 Years | 27 (40.3%) | 0 (0.0%) |
| 25 to 29 Years | 79 (100.0%) | 0 (0.0%) |
| 30 to 34 Years | 111 (100.0%) | 0 (0.0%) |
| 35 to 44 Years | 27 (100.0%) | 11 (40.7%) |
| 45 to 54 Years | 55 (100.0%) | 0 (0.0%) |
| 55 to 59 Years | 30 (66.7%) | 0 (0.0%) |
| 60 to 64 Years | 33 (100.0%) | 0 (0.0%) |
| 65 to 74 Years | 9 (7.8%) | 0 (0.0%) |
| 75 Years and over | 0 (0.0%) | 0 (0.0%) |
| Total | 445 (61.7%) | 11 (2.5%) |
Employment Status by Educational Attainment in Walnut Grove
According to labor force statistics for Walnut Grove, 95.7% of individuals (335) out of the total population between 25 and 64 years of age (350) are in the labor force, with 3.3% or 11 of them being unemployed. The group with the highest labor force participation rate are those with the educational attainment of less than high school, with 100.0% or 27 individuals in the labor force. Within the labor force, individuals with high school diploma education have the highest percentage of unemployment, with 12.0% or 11 of them being unemployed.
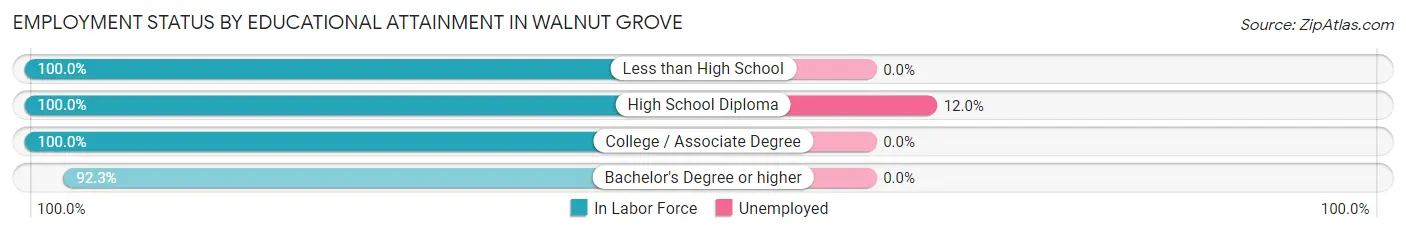
| Educational Attainment | In Labor Force | Unemployed |
| Less than High School | 27 (100.0%) | 0 (0.0%) |
| High School Diploma | 92 (100.0%) | 11 (12.0%) |
| College / Associate Degree | 35 (100.0%) | 0 (0.0%) |
| Bachelor's Degree or higher | 181 (92.3%) | 0 (0.0%) |
| Total | 335 (95.7%) | 12 (3.3%) |
Employment Occupations by Sex in Walnut Grove
Management, Business, Science and Arts Occupations
The most common Management, Business, Science and Arts occupations in Walnut Grove are Management (73 | 16.8%), Computers, Engineering & Science (30 | 6.9%), Computers & Mathematics (30 | 6.9%), Health Diagnosing & Treating (29 | 6.7%), and Business & Financial (28 | 6.5%).
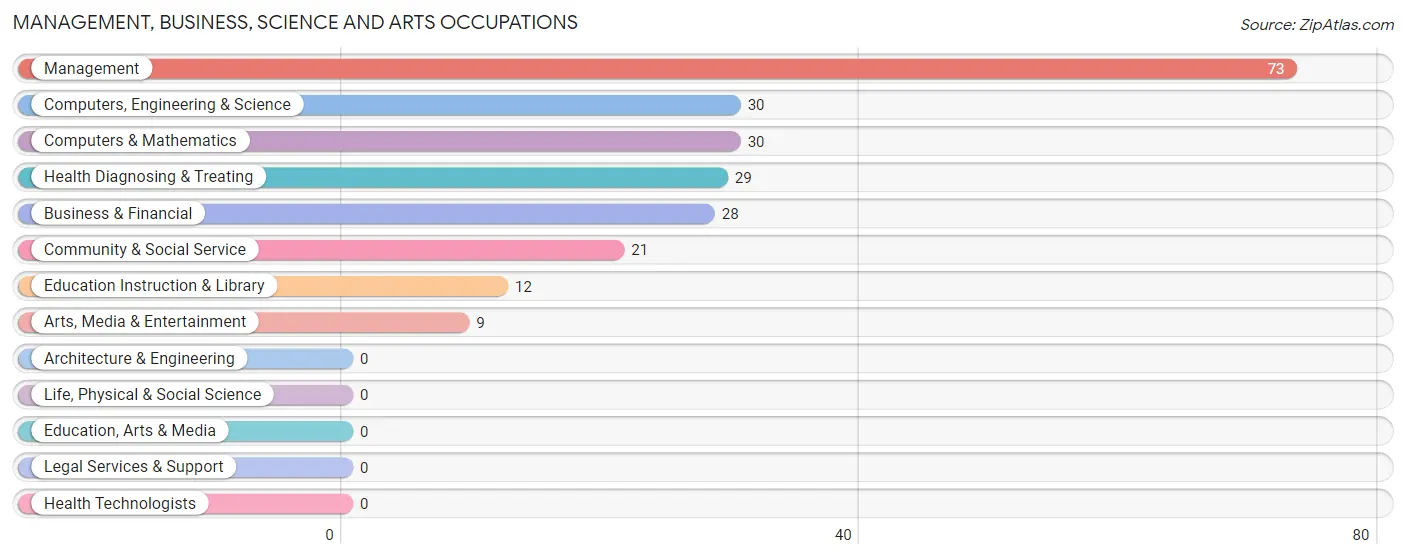
Management, Business, Science and Arts Occupations by Sex
Within the Management, Business, Science and Arts occupations in Walnut Grove, the most male-oriented occupations are Business & Financial (100.0%), Computers, Engineering & Science (100.0%), and Computers & Mathematics (100.0%), while the most female-oriented occupations are Community & Social Service (100.0%), Education Instruction & Library (100.0%), and Arts, Media & Entertainment (100.0%).
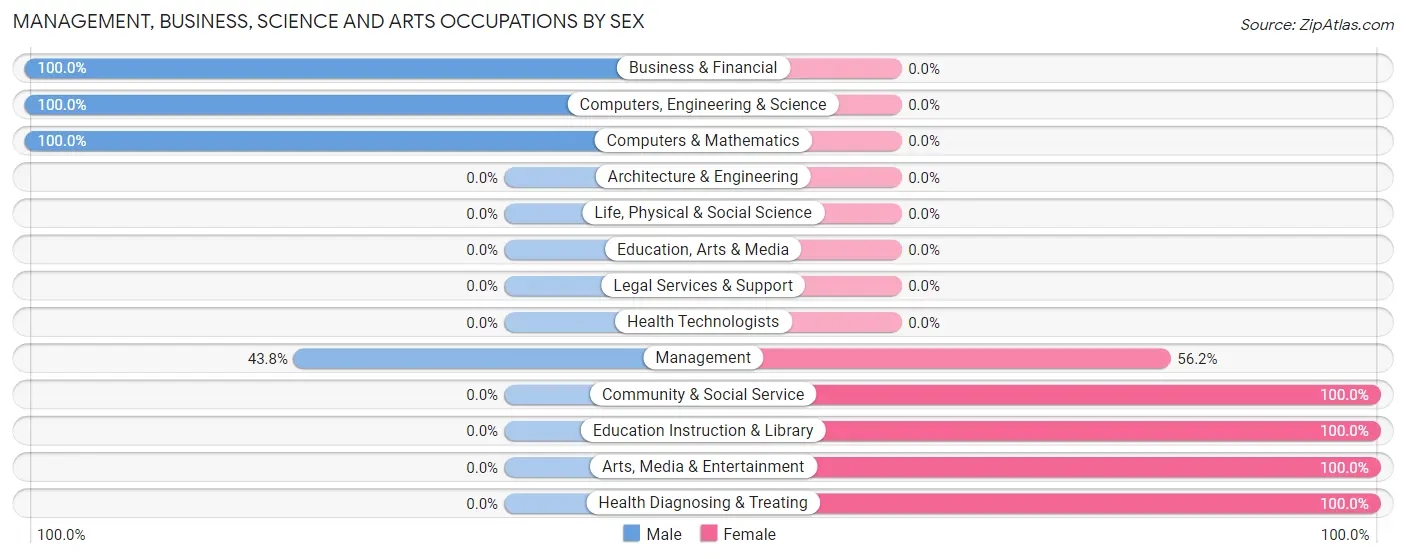
| Occupation | Male | Female |
| Management | 32 (43.8%) | 41 (56.2%) |
| Business & Financial | 28 (100.0%) | 0 (0.0%) |
| Computers, Engineering & Science | 30 (100.0%) | 0 (0.0%) |
| Computers & Mathematics | 30 (100.0%) | 0 (0.0%) |
| Architecture & Engineering | 0 (0.0%) | 0 (0.0%) |
| Life, Physical & Social Science | 0 (0.0%) | 0 (0.0%) |
| Community & Social Service | 0 (0.0%) | 21 (100.0%) |
| Education, Arts & Media | 0 (0.0%) | 0 (0.0%) |
| Legal Services & Support | 0 (0.0%) | 0 (0.0%) |
| Education Instruction & Library | 0 (0.0%) | 12 (100.0%) |
| Arts, Media & Entertainment | 0 (0.0%) | 9 (100.0%) |
| Health Diagnosing & Treating | 0 (0.0%) | 29 (100.0%) |
| Health Technologists | 0 (0.0%) | 0 (0.0%) |
| Total (Category) | 90 (49.7%) | 91 (50.3%) |
| Total (Overall) | 227 (52.3%) | 207 (47.7%) |
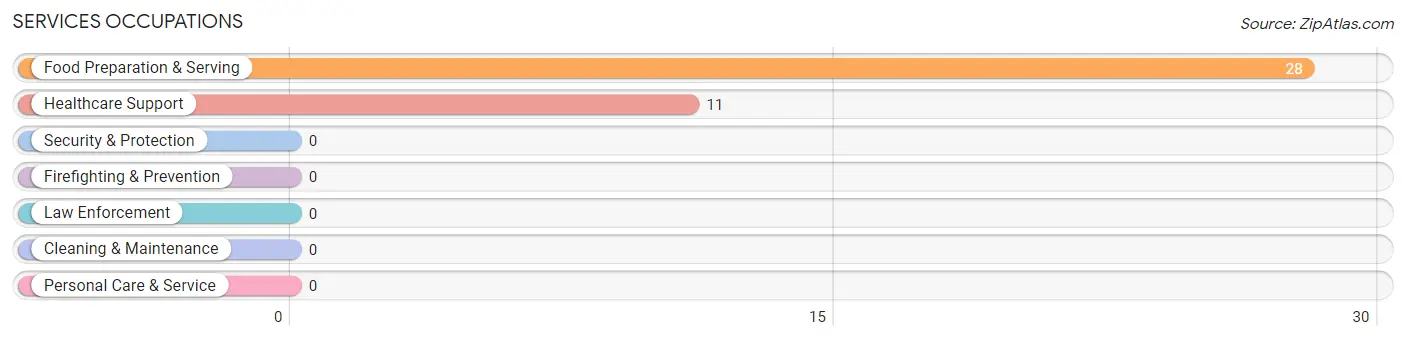
Services Occupations
The most common Services occupations in Walnut Grove are Food Preparation & Serving (28 | 6.5%), and Healthcare Support (11 | 2.5%).
Services Occupations by Sex
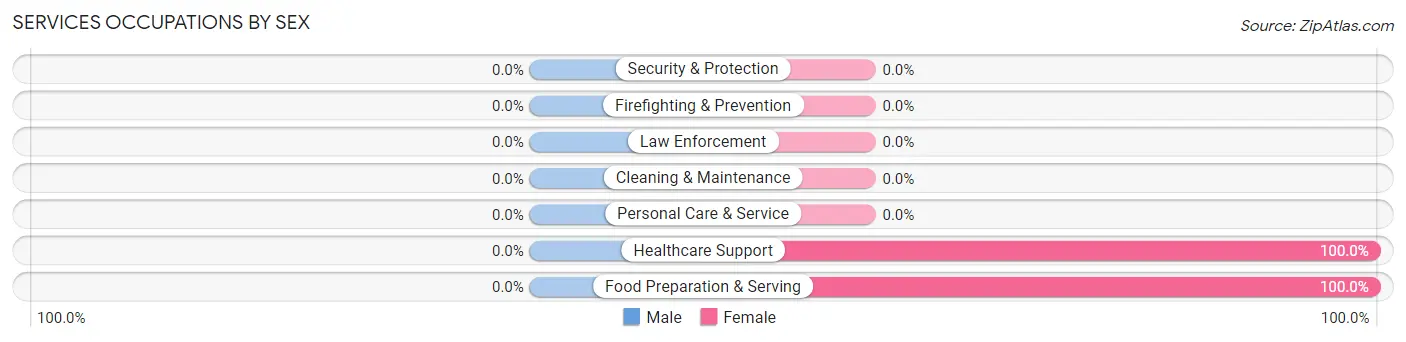
| Occupation | Male | Female |
| Healthcare Support | 0 (0.0%) | 11 (100.0%) |
| Security & Protection | 0 (0.0%) | 0 (0.0%) |
| Firefighting & Prevention | 0 (0.0%) | 0 (0.0%) |
| Law Enforcement | 0 (0.0%) | 0 (0.0%) |
| Food Preparation & Serving | 0 (0.0%) | 28 (100.0%) |
| Cleaning & Maintenance | 0 (0.0%) | 0 (0.0%) |
| Personal Care & Service | 0 (0.0%) | 0 (0.0%) |
| Total (Category) | 0 (0.0%) | 39 (100.0%) |
| Total (Overall) | 227 (52.3%) | 207 (47.7%) |
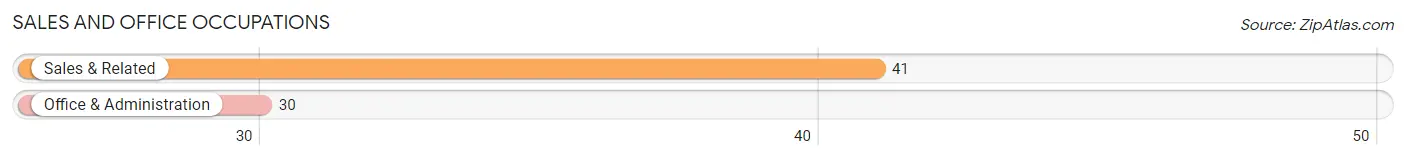
Sales and Office Occupations
The most common Sales and Office occupations in Walnut Grove are Sales & Related (41 | 9.5%), and Office & Administration (30 | 6.9%).
Sales and Office Occupations by Sex

| Occupation | Male | Female |
| Sales & Related | 16 (39.0%) | 25 (61.0%) |
| Office & Administration | 30 (100.0%) | 0 (0.0%) |
| Total (Category) | 46 (64.8%) | 25 (35.2%) |
| Total (Overall) | 227 (52.3%) | 207 (47.7%) |
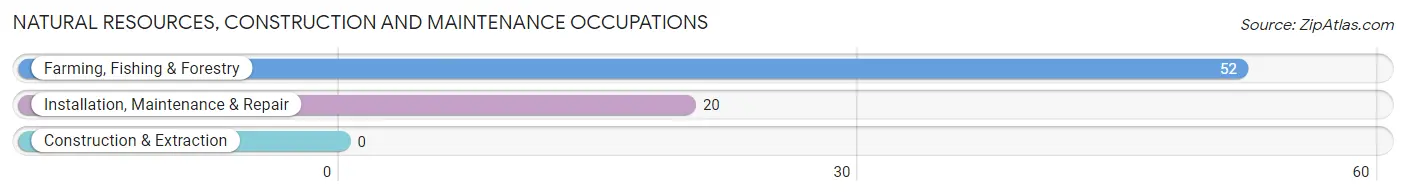
Natural Resources, Construction and Maintenance Occupations
The most common Natural Resources, Construction and Maintenance occupations in Walnut Grove are Farming, Fishing & Forestry (52 | 12.0%), and Installation, Maintenance & Repair (20 | 4.6%).
Natural Resources, Construction and Maintenance Occupations by Sex
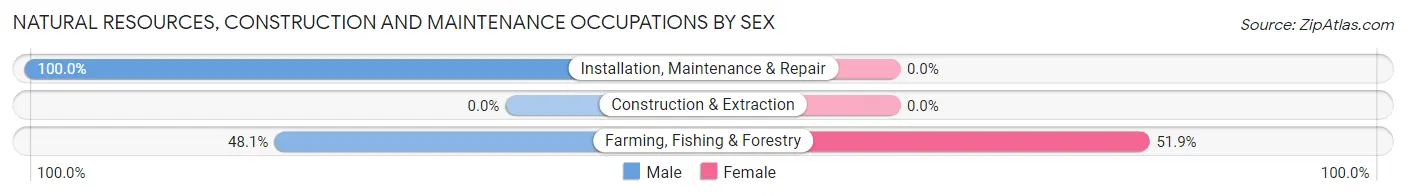
| Occupation | Male | Female |
| Farming, Fishing & Forestry | 25 (48.1%) | 27 (51.9%) |
| Construction & Extraction | 0 (0.0%) | 0 (0.0%) |
| Installation, Maintenance & Repair | 20 (100.0%) | 0 (0.0%) |
| Total (Category) | 45 (62.5%) | 27 (37.5%) |
| Total (Overall) | 227 (52.3%) | 207 (47.7%) |
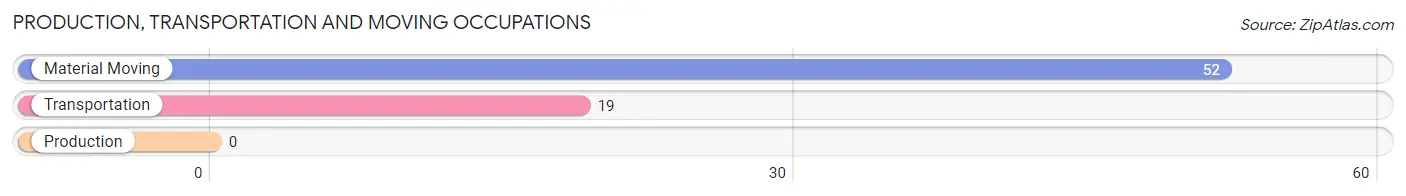
Production, Transportation and Moving Occupations
The most common Production, Transportation and Moving occupations in Walnut Grove are Material Moving (52 | 12.0%), and Transportation (19 | 4.4%).
Production, Transportation and Moving Occupations by Sex
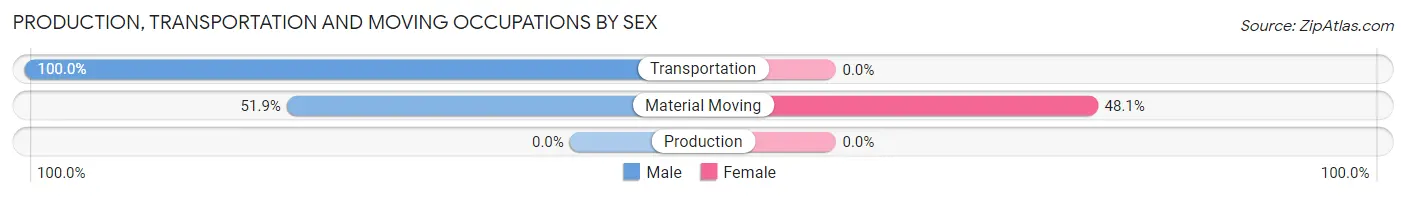
| Occupation | Male | Female |
| Production | 0 (0.0%) | 0 (0.0%) |
| Transportation | 19 (100.0%) | 0 (0.0%) |
| Material Moving | 27 (51.9%) | 25 (48.1%) |
| Total (Category) | 46 (64.8%) | 25 (35.2%) |
| Total (Overall) | 227 (52.3%) | 207 (47.7%) |
Employment Industries by Sex in Walnut Grove
Employment Industries in Walnut Grove
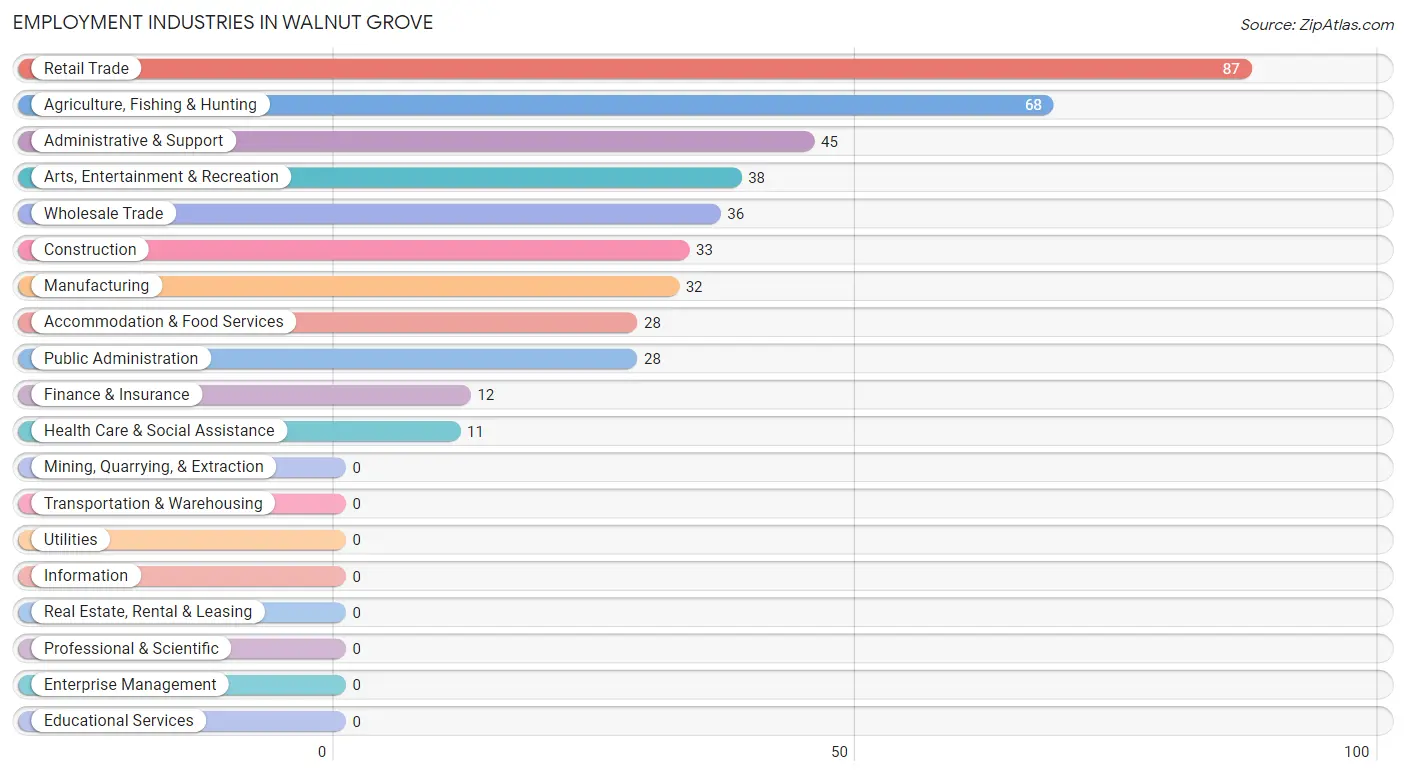
The major employment industries in Walnut Grove include Retail Trade (87 | 20.1%), Agriculture, Fishing & Hunting (68 | 15.7%), Administrative & Support (45 | 10.4%), Arts, Entertainment & Recreation (38 | 8.8%), and Wholesale Trade (36 | 8.3%).
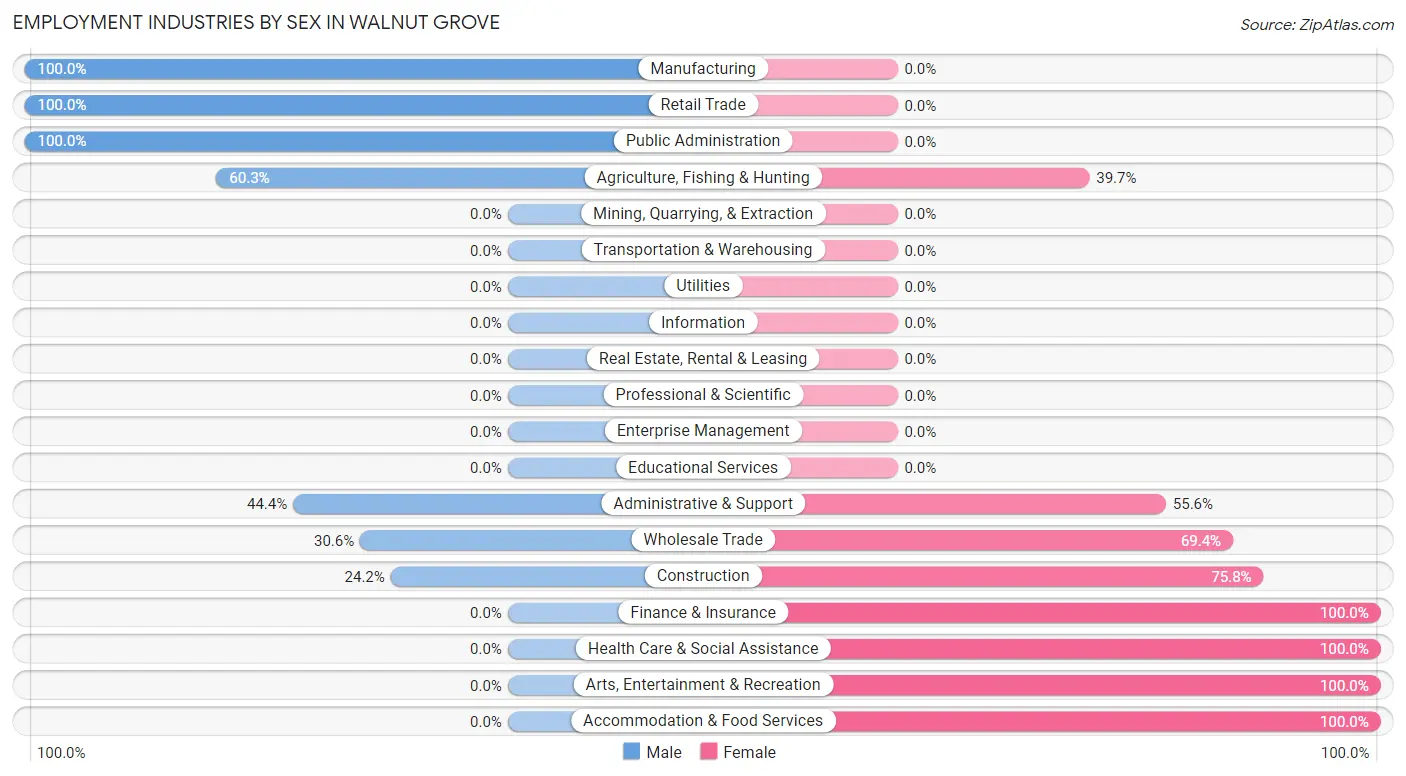
Employment Industries by Sex in Walnut Grove
The Walnut Grove industries that see more men than women are Manufacturing (100.0%), Retail Trade (100.0%), and Public Administration (100.0%), whereas the industries that tend to have a higher number of women are Finance & Insurance (100.0%), Health Care & Social Assistance (100.0%), and Arts, Entertainment & Recreation (100.0%).
| Industry | Male | Female |
| Agriculture, Fishing & Hunting | 41 (60.3%) | 27 (39.7%) |
| Mining, Quarrying, & Extraction | 0 (0.0%) | 0 (0.0%) |
| Construction | 8 (24.2%) | 25 (75.8%) |
| Manufacturing | 32 (100.0%) | 0 (0.0%) |
| Wholesale Trade | 11 (30.6%) | 25 (69.4%) |
| Retail Trade | 87 (100.0%) | 0 (0.0%) |
| Transportation & Warehousing | 0 (0.0%) | 0 (0.0%) |
| Utilities | 0 (0.0%) | 0 (0.0%) |
| Information | 0 (0.0%) | 0 (0.0%) |
| Finance & Insurance | 0 (0.0%) | 12 (100.0%) |
| Real Estate, Rental & Leasing | 0 (0.0%) | 0 (0.0%) |
| Professional & Scientific | 0 (0.0%) | 0 (0.0%) |
| Enterprise Management | 0 (0.0%) | 0 (0.0%) |
| Administrative & Support | 20 (44.4%) | 25 (55.6%) |
| Educational Services | 0 (0.0%) | 0 (0.0%) |
| Health Care & Social Assistance | 0 (0.0%) | 11 (100.0%) |
| Arts, Entertainment & Recreation | 0 (0.0%) | 38 (100.0%) |
| Accommodation & Food Services | 0 (0.0%) | 28 (100.0%) |
| Public Administration | 28 (100.0%) | 0 (0.0%) |
| Total | 227 (52.3%) | 207 (47.7%) |
Education in Walnut Grove
School Enrollment in Walnut Grove
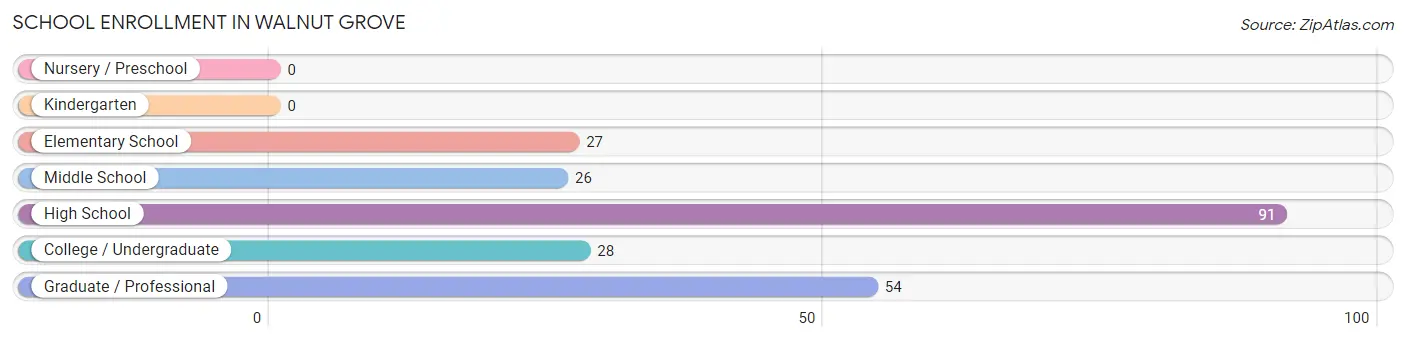
The most common levels of schooling among the 226 students in Walnut Grove are high school (91 | 40.3%), graduate / professional (54 | 23.9%), and college / undergraduate (28 | 12.4%).
| School Level | # Students | % Students |
| Nursery / Preschool | 0 | 0.0% |
| Kindergarten | 0 | 0.0% |
| Elementary School | 27 | 11.9% |
| Middle School | 26 | 11.5% |
| High School | 91 | 40.3% |
| College / Undergraduate | 28 | 12.4% |
| Graduate / Professional | 54 | 23.9% |
| Total | 226 | 100.0% |
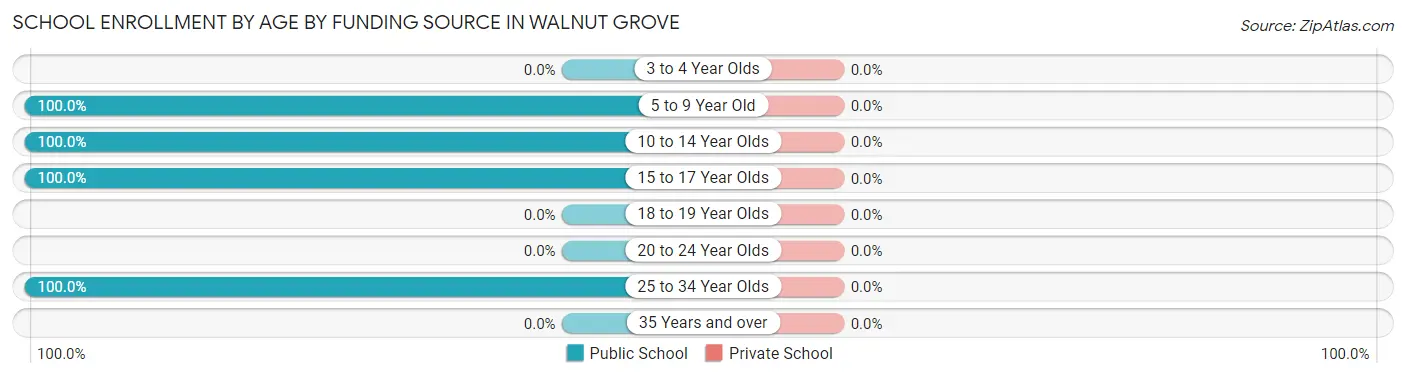
School Enrollment by Age by Funding Source in Walnut Grove
| Age Bracket | Public School | Private School |
| 3 to 4 Year Olds | 0 (0.0%) | 0 (0.0%) |
| 5 to 9 Year Old | 27 (100.0%) | 0 (0.0%) |
| 10 to 14 Year Olds | 26 (100.0%) | 0 (0.0%) |
| 15 to 17 Year Olds | 91 (100.0%) | 0 (0.0%) |
| 18 to 19 Year Olds | 0 (0.0%) | 0 (0.0%) |
| 20 to 24 Year Olds | 0 (0.0%) | 0 (0.0%) |
| 25 to 34 Year Olds | 82 (100.0%) | 0 (0.0%) |
| 35 Years and over | 0 (0.0%) | 0 (0.0%) |
| Total | 226 (100.0%) | 0 (0.0%) |
Educational Attainment by Field of Study in Walnut Grove
Business (111 | 37.8%), social sciences (91 | 30.9%), arts & humanities (29 | 9.9%), science & technology (24 | 8.2%), and liberal arts & history (18 | 6.1%) are the most common fields of study among 294 individuals in Walnut Grove who have obtained a bachelor's degree or higher.
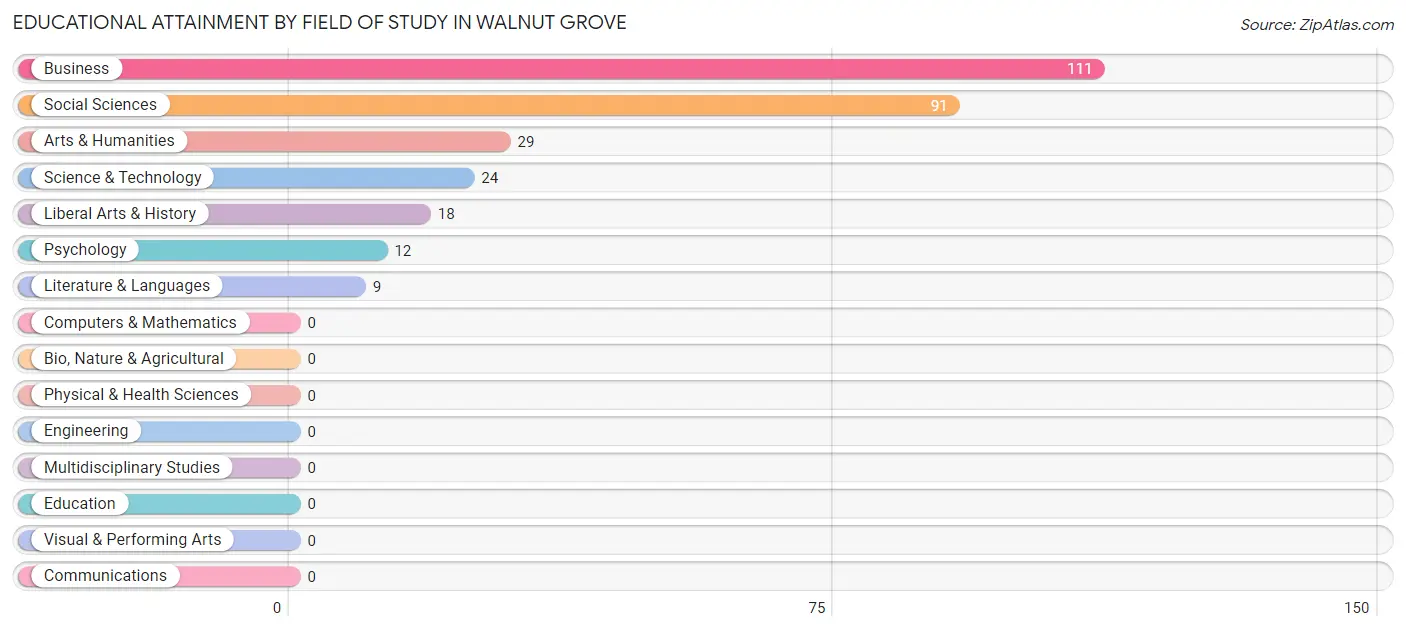
| Field of Study | # Graduates | % Graduates |
| Computers & Mathematics | 0 | 0.0% |
| Bio, Nature & Agricultural | 0 | 0.0% |
| Physical & Health Sciences | 0 | 0.0% |
| Psychology | 12 | 4.1% |
| Social Sciences | 91 | 30.9% |
| Engineering | 0 | 0.0% |
| Multidisciplinary Studies | 0 | 0.0% |
| Science & Technology | 24 | 8.2% |
| Business | 111 | 37.8% |
| Education | 0 | 0.0% |
| Literature & Languages | 9 | 3.1% |
| Liberal Arts & History | 18 | 6.1% |
| Visual & Performing Arts | 0 | 0.0% |
| Communications | 0 | 0.0% |
| Arts & Humanities | 29 | 9.9% |
| Total | 294 | 100.0% |
Transportation & Commute in Walnut Grove
Vehicle Availability by Sex in Walnut Grove
The most prevalent vehicle ownership categories in Walnut Grove are males with 3 vehicles (82, accounting for 36.1%) and females with 3 vehicles (82, making up 39.6%).
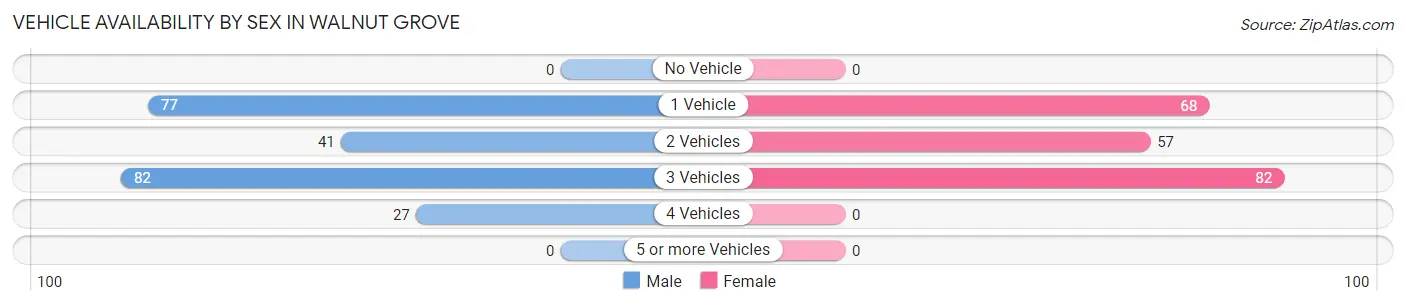
| Vehicles Available | Male | Female |
| No Vehicle | 0 (0.0%) | 0 (0.0%) |
| 1 Vehicle | 77 (33.9%) | 68 (32.9%) |
| 2 Vehicles | 41 (18.1%) | 57 (27.5%) |
| 3 Vehicles | 82 (36.1%) | 82 (39.6%) |
| 4 Vehicles | 27 (11.9%) | 0 (0.0%) |
| 5 or more Vehicles | 0 (0.0%) | 0 (0.0%) |
| Total | 227 (100.0%) | 207 (100.0%) |
Commute Time in Walnut Grove
The most frequently occuring commute durations in Walnut Grove are 45 to 59 minutes (114 commuters, 34.5%), 15 to 19 minutes (52 commuters, 15.8%), and 25 to 29 minutes (36 commuters, 10.9%).
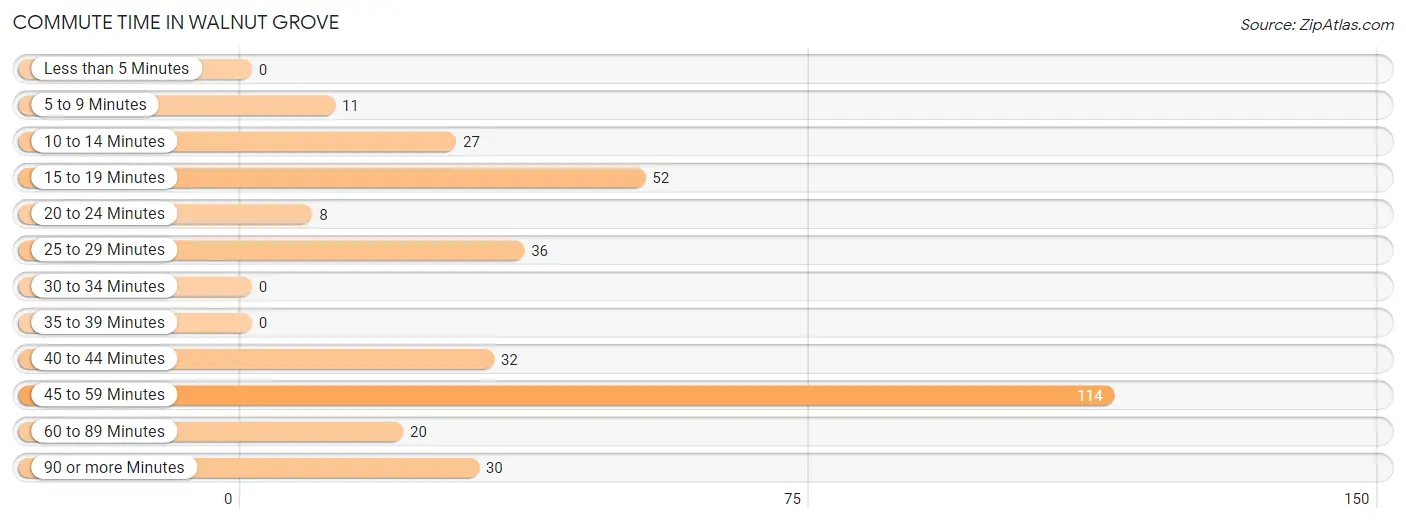
| Commute Time | # Commuters | % Commuters |
| Less than 5 Minutes | 0 | 0.0% |
| 5 to 9 Minutes | 11 | 3.3% |
| 10 to 14 Minutes | 27 | 8.2% |
| 15 to 19 Minutes | 52 | 15.8% |
| 20 to 24 Minutes | 8 | 2.4% |
| 25 to 29 Minutes | 36 | 10.9% |
| 30 to 34 Minutes | 0 | 0.0% |
| 35 to 39 Minutes | 0 | 0.0% |
| 40 to 44 Minutes | 32 | 9.7% |
| 45 to 59 Minutes | 114 | 34.5% |
| 60 to 89 Minutes | 20 | 6.1% |
| 90 or more Minutes | 30 | 9.1% |
Commute Time by Sex in Walnut Grove
The most common commute times in Walnut Grove are 45 to 59 minutes (32 commuters, 18.9%) for males and 45 to 59 minutes (82 commuters, 50.9%) for females.
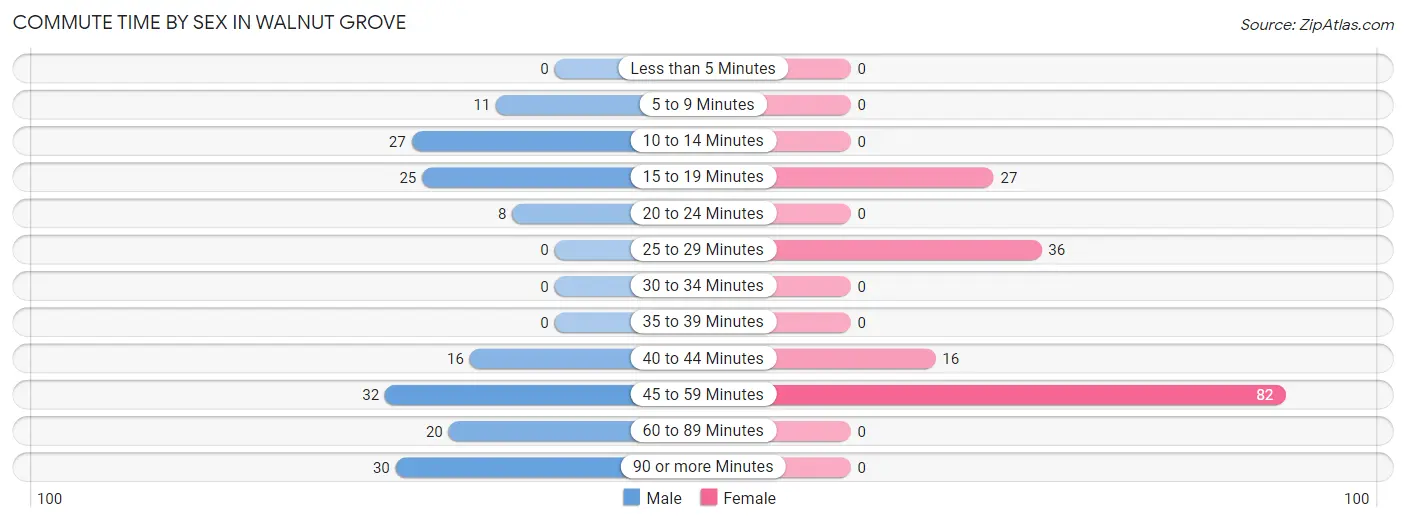
| Commute Time | Male | Female |
| Less than 5 Minutes | 0 (0.0%) | 0 (0.0%) |
| 5 to 9 Minutes | 11 (6.5%) | 0 (0.0%) |
| 10 to 14 Minutes | 27 (16.0%) | 0 (0.0%) |
| 15 to 19 Minutes | 25 (14.8%) | 27 (16.8%) |
| 20 to 24 Minutes | 8 (4.7%) | 0 (0.0%) |
| 25 to 29 Minutes | 0 (0.0%) | 36 (22.4%) |
| 30 to 34 Minutes | 0 (0.0%) | 0 (0.0%) |
| 35 to 39 Minutes | 0 (0.0%) | 0 (0.0%) |
| 40 to 44 Minutes | 16 (9.5%) | 16 (9.9%) |
| 45 to 59 Minutes | 32 (18.9%) | 82 (50.9%) |
| 60 to 89 Minutes | 20 (11.8%) | 0 (0.0%) |
| 90 or more Minutes | 30 (17.7%) | 0 (0.0%) |
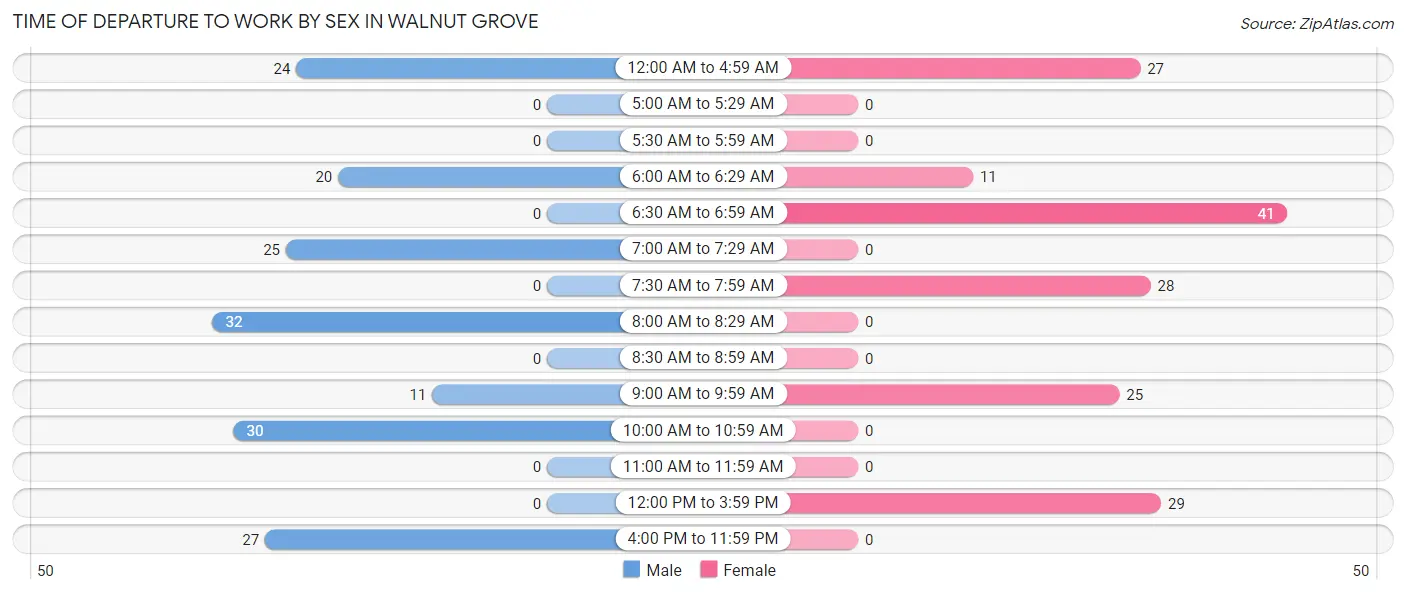
Time of Departure to Work by Sex in Walnut Grove
The most frequent times of departure to work in Walnut Grove are 8:00 AM to 8:29 AM (32, 18.9%) for males and 6:30 AM to 6:59 AM (41, 25.5%) for females.
| Time of Departure | Male | Female |
| 12:00 AM to 4:59 AM | 24 (14.2%) | 27 (16.8%) |
| 5:00 AM to 5:29 AM | 0 (0.0%) | 0 (0.0%) |
| 5:30 AM to 5:59 AM | 0 (0.0%) | 0 (0.0%) |
| 6:00 AM to 6:29 AM | 20 (11.8%) | 11 (6.8%) |
| 6:30 AM to 6:59 AM | 0 (0.0%) | 41 (25.5%) |
| 7:00 AM to 7:29 AM | 25 (14.8%) | 0 (0.0%) |
| 7:30 AM to 7:59 AM | 0 (0.0%) | 28 (17.4%) |
| 8:00 AM to 8:29 AM | 32 (18.9%) | 0 (0.0%) |
| 8:30 AM to 8:59 AM | 0 (0.0%) | 0 (0.0%) |
| 9:00 AM to 9:59 AM | 11 (6.5%) | 25 (15.5%) |
| 10:00 AM to 10:59 AM | 30 (17.7%) | 0 (0.0%) |
| 11:00 AM to 11:59 AM | 0 (0.0%) | 0 (0.0%) |
| 12:00 PM to 3:59 PM | 0 (0.0%) | 29 (18.0%) |
| 4:00 PM to 11:59 PM | 27 (16.0%) | 0 (0.0%) |
| Total | 169 (100.0%) | 161 (100.0%) |
Housing Occupancy in Walnut Grove
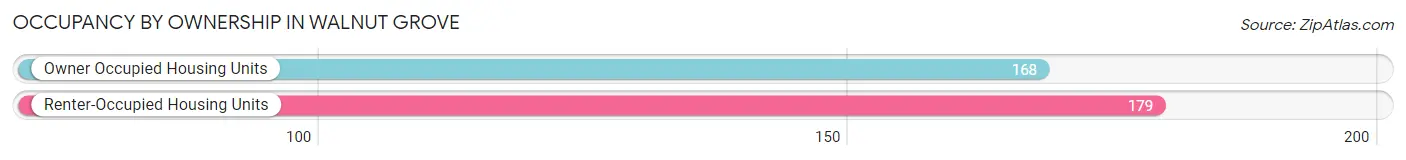
Occupancy by Ownership in Walnut Grove
Of the total 347 dwellings in Walnut Grove, owner-occupied units account for 168 (48.4%), while renter-occupied units make up 179 (51.6%).
| Occupancy | # Housing Units | % Housing Units |
| Owner Occupied Housing Units | 168 | 48.4% |
| Renter-Occupied Housing Units | 179 | 51.6% |
| Total Occupied Housing Units | 347 | 100.0% |
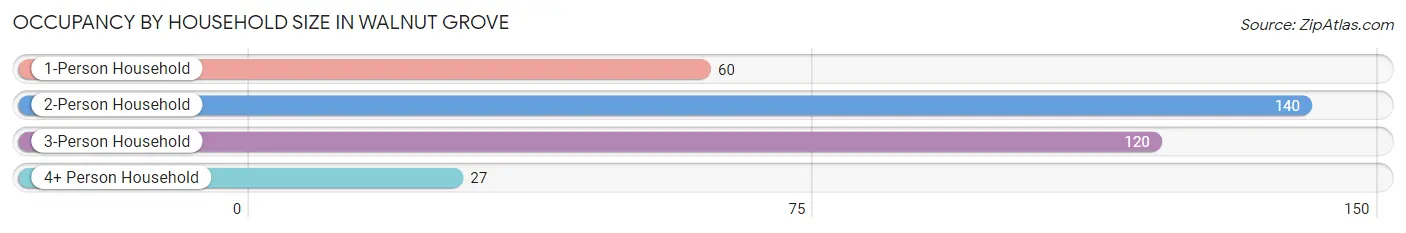
Occupancy by Household Size in Walnut Grove
| Household Size | # Housing Units | % Housing Units |
| 1-Person Household | 60 | 17.3% |
| 2-Person Household | 140 | 40.4% |
| 3-Person Household | 120 | 34.6% |
| 4+ Person Household | 27 | 7.8% |
| Total Housing Units | 347 | 100.0% |
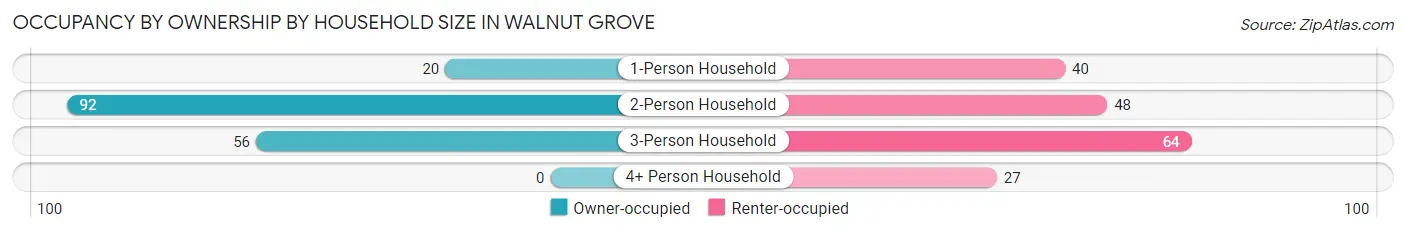
Occupancy by Ownership by Household Size in Walnut Grove
| Household Size | Owner-occupied | Renter-occupied |
| 1-Person Household | 20 (33.3%) | 40 (66.7%) |
| 2-Person Household | 92 (65.7%) | 48 (34.3%) |
| 3-Person Household | 56 (46.7%) | 64 (53.3%) |
| 4+ Person Household | 0 (0.0%) | 27 (100.0%) |
| Total Housing Units | 168 (48.4%) | 179 (51.6%) |
Occupancy by Educational Attainment in Walnut Grove
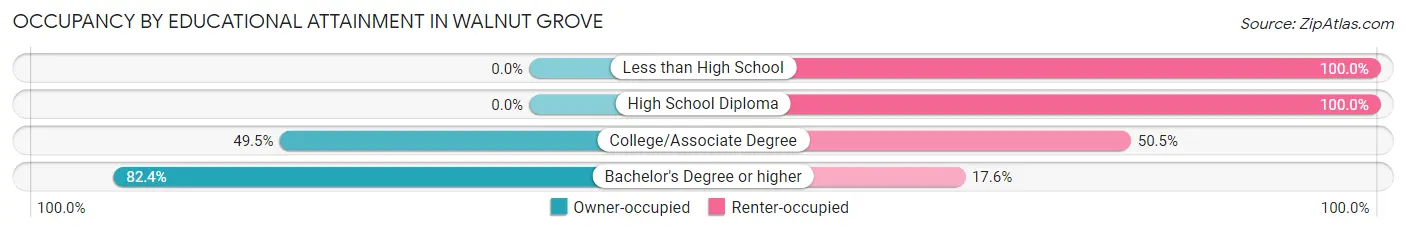
| Household Size | Owner-occupied | Renter-occupied |
| Less than High School | 0 (0.0%) | 50 (100.0%) |
| High School Diploma | 0 (0.0%) | 52 (100.0%) |
| College/Associate Degree | 51 (49.5%) | 52 (50.5%) |
| Bachelor's Degree or higher | 117 (82.4%) | 25 (17.6%) |
Occupancy by Age of Householder in Walnut Grove
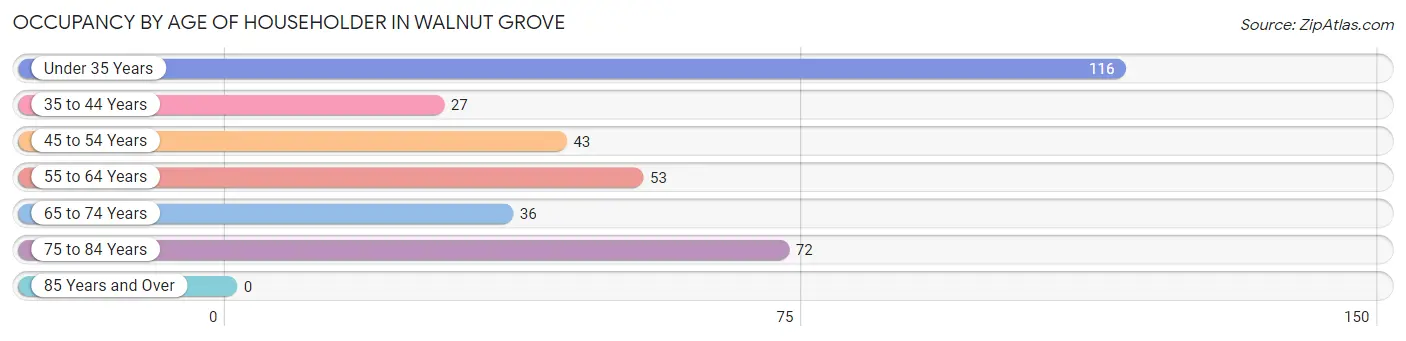
| Age Bracket | # Households | % Households |
| Under 35 Years | 116 | 33.4% |
| 35 to 44 Years | 27 | 7.8% |
| 45 to 54 Years | 43 | 12.4% |
| 55 to 64 Years | 53 | 15.3% |
| 65 to 74 Years | 36 | 10.4% |
| 75 to 84 Years | 72 | 20.7% |
| 85 Years and Over | 0 | 0.0% |
| Total | 347 | 100.0% |
Housing Finances in Walnut Grove
Median Income by Occupancy in Walnut Grove
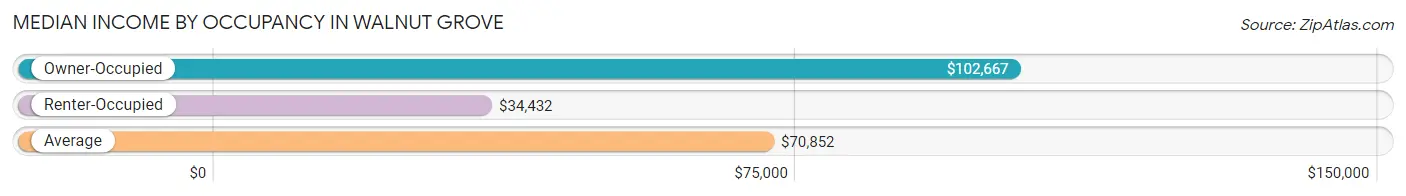
| Occupancy Type | # Households | Median Income |
| Owner-Occupied | 168 (48.4%) | $102,667 |
| Renter-Occupied | 179 (51.6%) | $34,432 |
| Average | 347 (100.0%) | $70,852 |
Occupancy by Householder Income Bracket in Walnut Grove
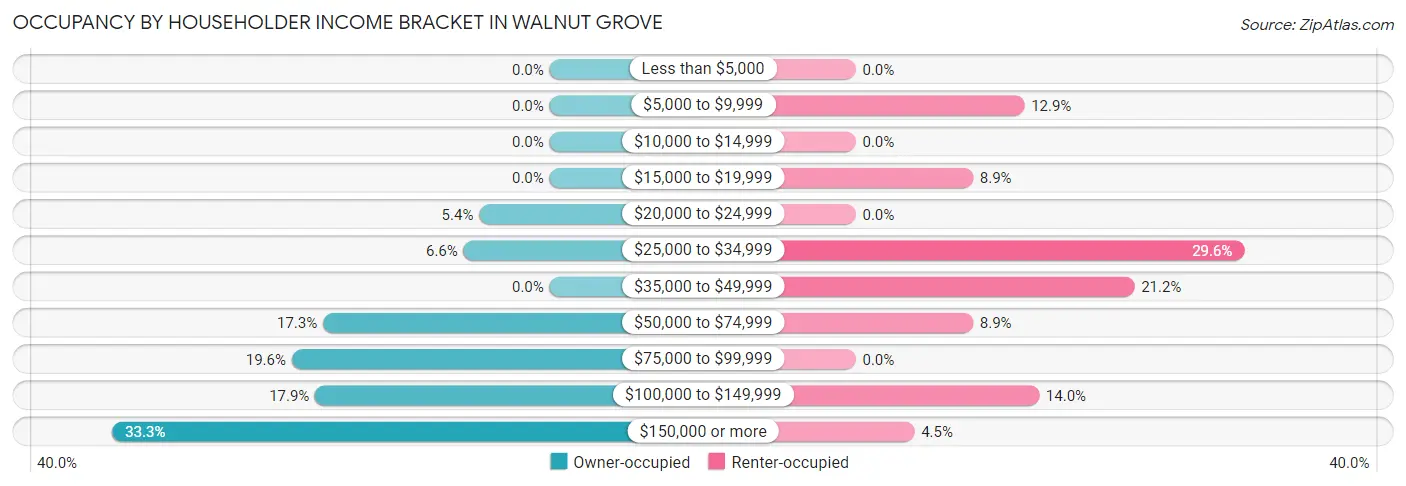
| Income Bracket | Owner-occupied | Renter-occupied |
| Less than $5,000 | 0 (0.0%) | 0 (0.0%) |
| $5,000 to $9,999 | 0 (0.0%) | 23 (12.9%) |
| $10,000 to $14,999 | 0 (0.0%) | 0 (0.0%) |
| $15,000 to $19,999 | 0 (0.0%) | 16 (8.9%) |
| $20,000 to $24,999 | 9 (5.4%) | 0 (0.0%) |
| $25,000 to $34,999 | 11 (6.6%) | 53 (29.6%) |
| $35,000 to $49,999 | 0 (0.0%) | 38 (21.2%) |
| $50,000 to $74,999 | 29 (17.3%) | 16 (8.9%) |
| $75,000 to $99,999 | 33 (19.6%) | 0 (0.0%) |
| $100,000 to $149,999 | 30 (17.9%) | 25 (14.0%) |
| $150,000 or more | 56 (33.3%) | 8 (4.5%) |
| Total | 168 (100.0%) | 179 (100.0%) |
Monthly Housing Cost Tiers in Walnut Grove
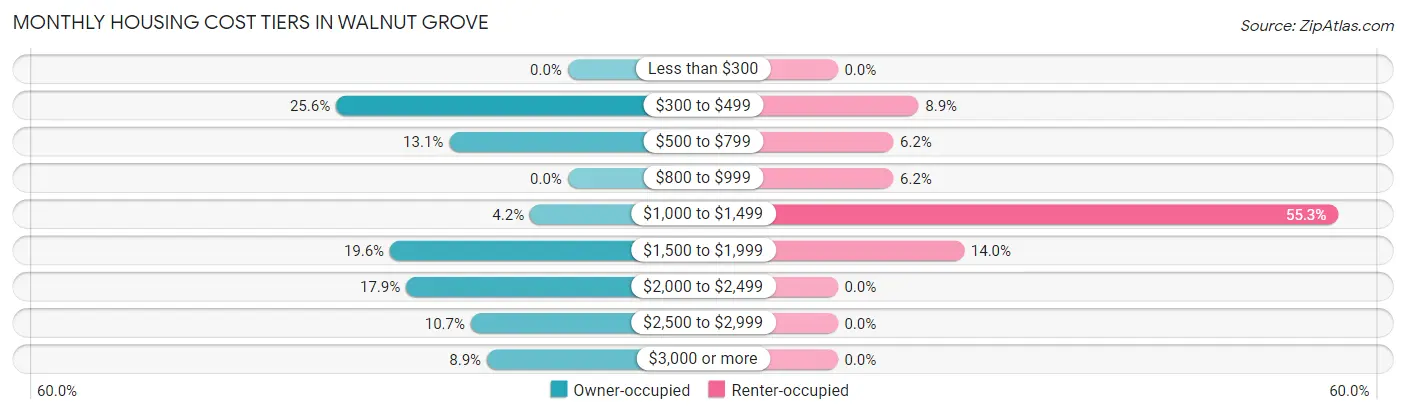
| Monthly Cost | Owner-occupied | Renter-occupied |
| Less than $300 | 0 (0.0%) | 0 (0.0%) |
| $300 to $499 | 43 (25.6%) | 16 (8.9%) |
| $500 to $799 | 22 (13.1%) | 11 (6.1%) |
| $800 to $999 | 0 (0.0%) | 11 (6.1%) |
| $1,000 to $1,499 | 7 (4.2%) | 99 (55.3%) |
| $1,500 to $1,999 | 33 (19.6%) | 25 (14.0%) |
| $2,000 to $2,499 | 30 (17.9%) | 0 (0.0%) |
| $2,500 to $2,999 | 18 (10.7%) | 0 (0.0%) |
| $3,000 or more | 15 (8.9%) | 0 (0.0%) |
| Total | 168 (100.0%) | 179 (100.0%) |
Physical Housing Characteristics in Walnut Grove
Housing Structures in Walnut Grove
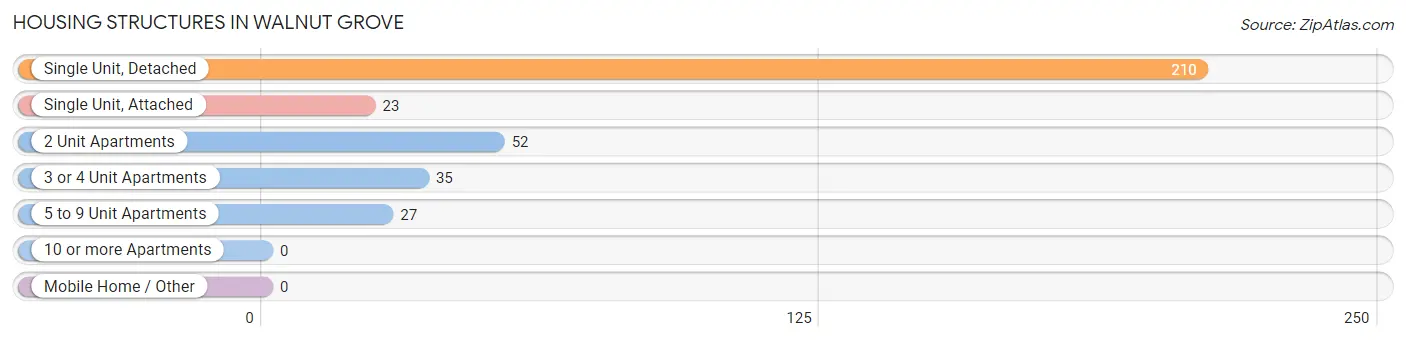
| Structure Type | # Housing Units | % Housing Units |
| Single Unit, Detached | 210 | 60.5% |
| Single Unit, Attached | 23 | 6.6% |
| 2 Unit Apartments | 52 | 15.0% |
| 3 or 4 Unit Apartments | 35 | 10.1% |
| 5 to 9 Unit Apartments | 27 | 7.8% |
| 10 or more Apartments | 0 | 0.0% |
| Mobile Home / Other | 0 | 0.0% |
| Total | 347 | 100.0% |
Housing Structures by Occupancy in Walnut Grove
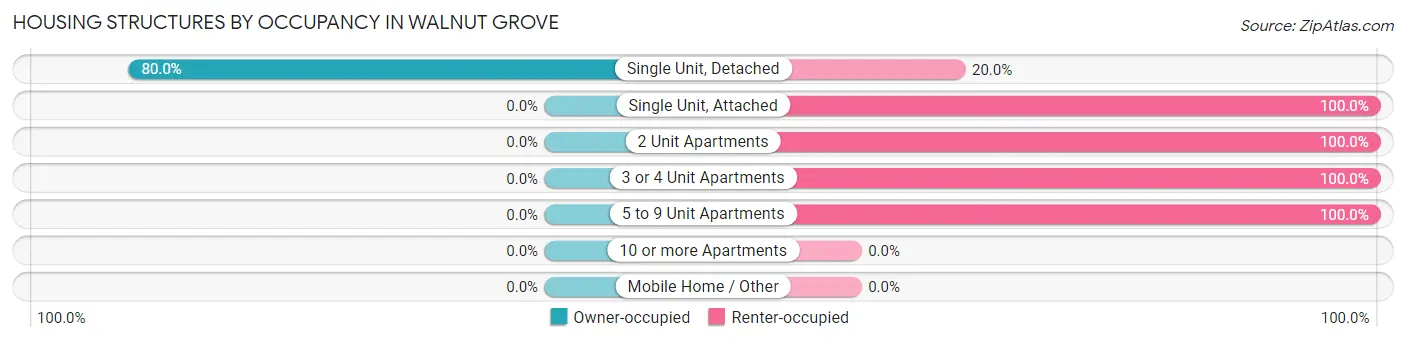
| Structure Type | Owner-occupied | Renter-occupied |
| Single Unit, Detached | 168 (80.0%) | 42 (20.0%) |
| Single Unit, Attached | 0 (0.0%) | 23 (100.0%) |
| 2 Unit Apartments | 0 (0.0%) | 52 (100.0%) |
| 3 or 4 Unit Apartments | 0 (0.0%) | 35 (100.0%) |
| 5 to 9 Unit Apartments | 0 (0.0%) | 27 (100.0%) |
| 10 or more Apartments | 0 (0.0%) | 0 (0.0%) |
| Mobile Home / Other | 0 (0.0%) | 0 (0.0%) |
| Total | 168 (48.4%) | 179 (51.6%) |
Housing Structures by Number of Rooms in Walnut Grove
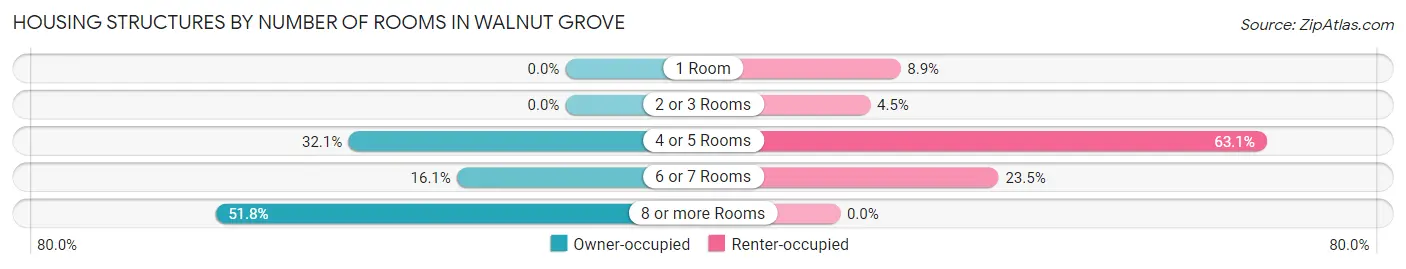
| Number of Rooms | Owner-occupied | Renter-occupied |
| 1 Room | 0 (0.0%) | 16 (8.9%) |
| 2 or 3 Rooms | 0 (0.0%) | 8 (4.5%) |
| 4 or 5 Rooms | 54 (32.1%) | 113 (63.1%) |
| 6 or 7 Rooms | 27 (16.1%) | 42 (23.5%) |
| 8 or more Rooms | 87 (51.8%) | 0 (0.0%) |
| Total | 168 (100.0%) | 179 (100.0%) |
Housing Structure by Heating Type in Walnut Grove
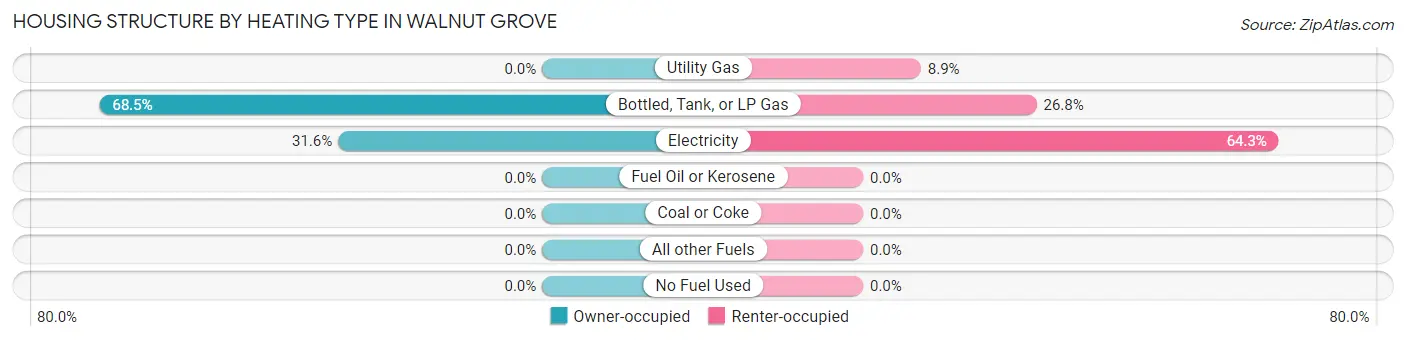
| Heating Type | Owner-occupied | Renter-occupied |
| Utility Gas | 0 (0.0%) | 16 (8.9%) |
| Bottled, Tank, or LP Gas | 115 (68.4%) | 48 (26.8%) |
| Electricity | 53 (31.6%) | 115 (64.2%) |
| Fuel Oil or Kerosene | 0 (0.0%) | 0 (0.0%) |
| Coal or Coke | 0 (0.0%) | 0 (0.0%) |
| All other Fuels | 0 (0.0%) | 0 (0.0%) |
| No Fuel Used | 0 (0.0%) | 0 (0.0%) |
| Total | 168 (100.0%) | 179 (100.0%) |
Household Vehicle Usage in Walnut Grove
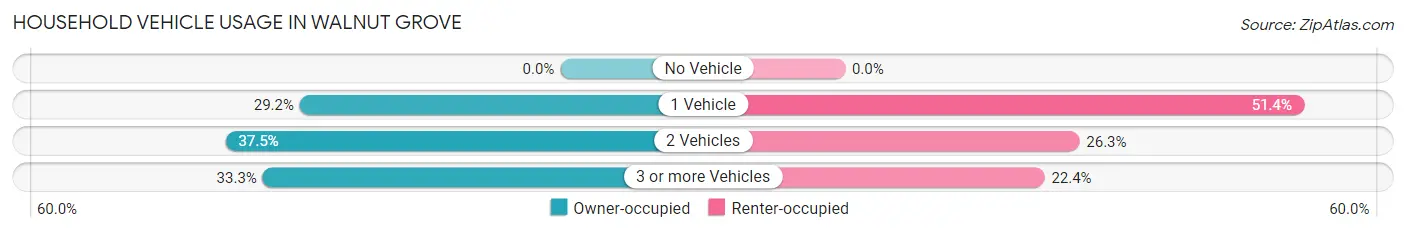
| Vehicles per Household | Owner-occupied | Renter-occupied |
| No Vehicle | 0 (0.0%) | 0 (0.0%) |
| 1 Vehicle | 49 (29.2%) | 92 (51.4%) |
| 2 Vehicles | 63 (37.5%) | 47 (26.3%) |
| 3 or more Vehicles | 56 (33.3%) | 40 (22.4%) |
| Total | 168 (100.0%) | 179 (100.0%) |
Real Estate & Mortgages in Walnut Grove
Real Estate and Mortgage Overview in Walnut Grove
| Characteristic | Without Mortgage | With Mortgage |
| Housing Units | 72 | 96 |
| Median Property Value | $583,300 | $671,900 |
| Median Household Income | - | - |
| Monthly Housing Costs | $484 | $15 |
| Real Estate Taxes | $2,091 | $0 |
Property Value by Mortgage Status in Walnut Grove
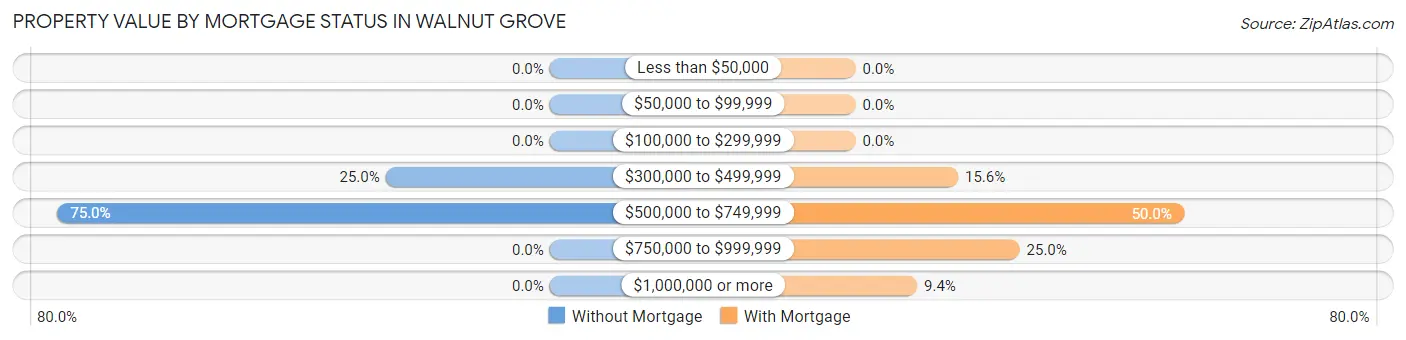
| Property Value | Without Mortgage | With Mortgage |
| Less than $50,000 | 0 (0.0%) | 0 (0.0%) |
| $50,000 to $99,999 | 0 (0.0%) | 0 (0.0%) |
| $100,000 to $299,999 | 0 (0.0%) | 0 (0.0%) |
| $300,000 to $499,999 | 18 (25.0%) | 15 (15.6%) |
| $500,000 to $749,999 | 54 (75.0%) | 48 (50.0%) |
| $750,000 to $999,999 | 0 (0.0%) | 24 (25.0%) |
| $1,000,000 or more | 0 (0.0%) | 9 (9.4%) |
| Total | 72 (100.0%) | 96 (100.0%) |
Household Income by Mortgage Status in Walnut Grove
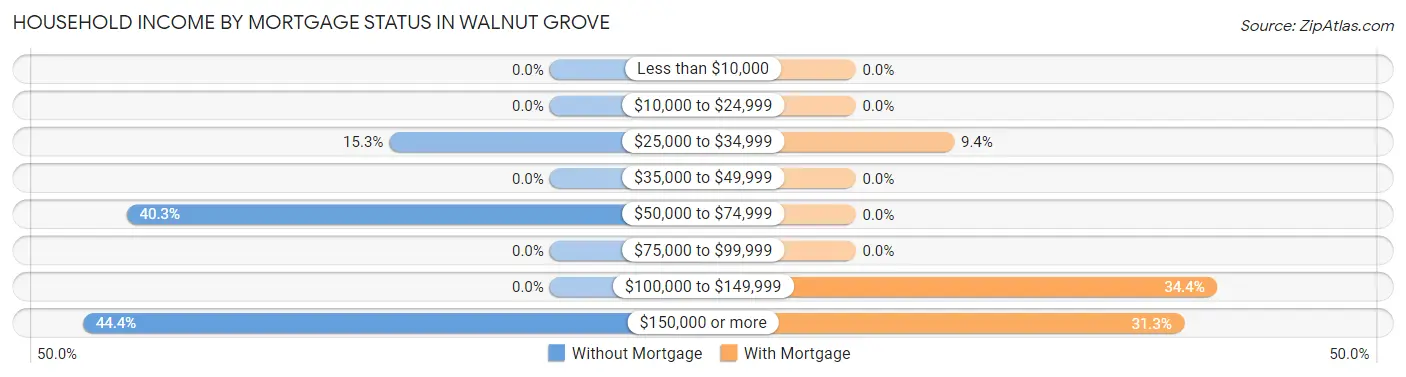
| Household Income | Without Mortgage | With Mortgage |
| Less than $10,000 | 0 (0.0%) | 0 (0.0%) |
| $10,000 to $24,999 | 0 (0.0%) | 0 (0.0%) |
| $25,000 to $34,999 | 11 (15.3%) | 9 (9.4%) |
| $35,000 to $49,999 | 0 (0.0%) | 0 (0.0%) |
| $50,000 to $74,999 | 29 (40.3%) | 0 (0.0%) |
| $75,000 to $99,999 | 0 (0.0%) | 0 (0.0%) |
| $100,000 to $149,999 | 0 (0.0%) | 33 (34.4%) |
| $150,000 or more | 32 (44.4%) | 30 (31.2%) |
| Total | 72 (100.0%) | 96 (100.0%) |
Property Value to Household Income Ratio in Walnut Grove
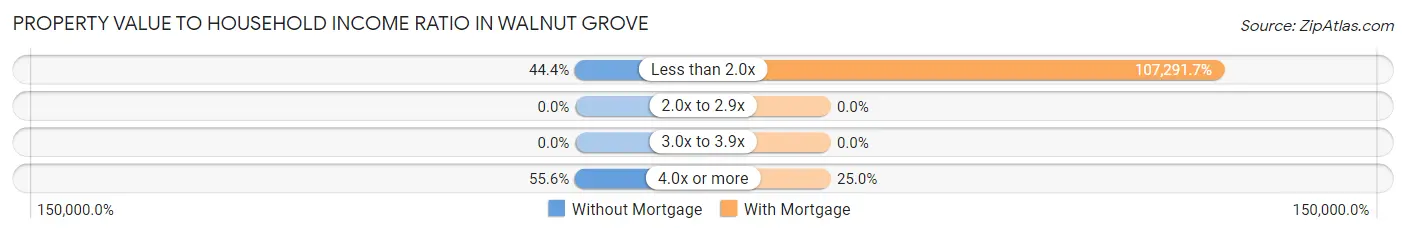
| Value-to-Income Ratio | Without Mortgage | With Mortgage |
| Less than 2.0x | 32 (44.4%) | 103,000 (107,291.7%) |
| 2.0x to 2.9x | 0 (0.0%) | 0 (0.0%) |
| 3.0x to 3.9x | 0 (0.0%) | 0 (0.0%) |
| 4.0x or more | 40 (55.6%) | 24 (25.0%) |
| Total | 72 (100.0%) | 96 (100.0%) |
Real Estate Taxes by Mortgage Status in Walnut Grove
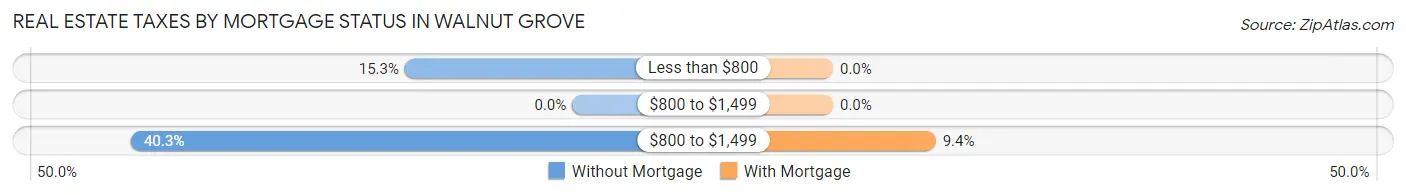
| Property Taxes | Without Mortgage | With Mortgage |
| Less than $800 | 11 (15.3%) | 0 (0.0%) |
| $800 to $1,499 | 0 (0.0%) | 0 (0.0%) |
| $800 to $1,499 | 29 (40.3%) | 9 (9.4%) |
| Total | 72 (100.0%) | 96 (100.0%) |
Health & Disability in Walnut Grove
Health Insurance Coverage by Age in Walnut Grove
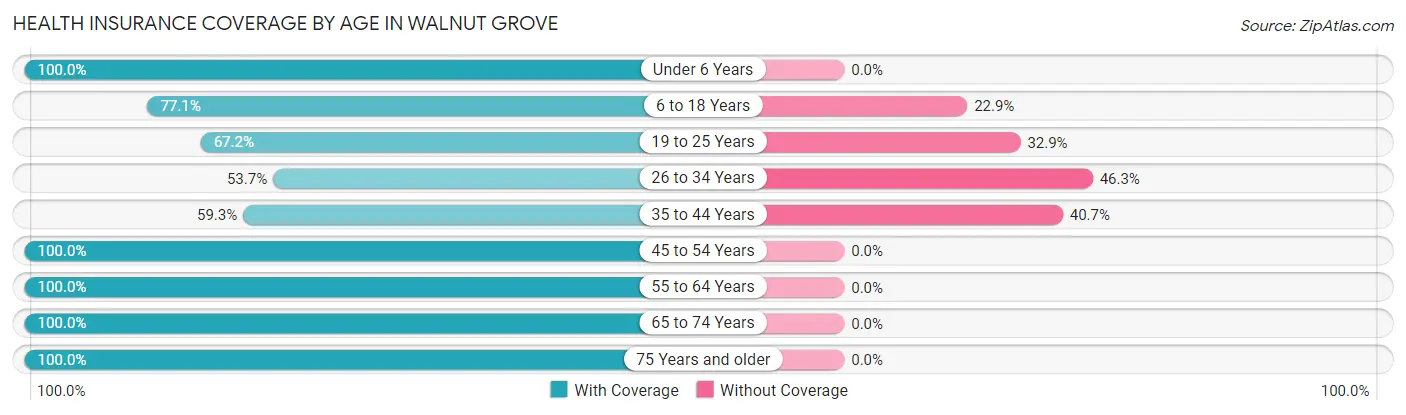
| Age Bracket | With Coverage | Without Coverage |
| Under 6 Years | 30 (100.0%) | 0 (0.0%) |
| 6 to 18 Years | 111 (77.1%) | 33 (22.9%) |
| 19 to 25 Years | 92 (67.1%) | 45 (32.9%) |
| 26 to 34 Years | 73 (53.7%) | 63 (46.3%) |
| 35 to 44 Years | 16 (59.3%) | 11 (40.7%) |
| 45 to 54 Years | 55 (100.0%) | 0 (0.0%) |
| 55 to 64 Years | 78 (100.0%) | 0 (0.0%) |
| 65 to 74 Years | 116 (100.0%) | 0 (0.0%) |
| 75 Years and older | 91 (100.0%) | 0 (0.0%) |
| Total | 662 (81.3%) | 152 (18.7%) |
Health Insurance Coverage by Citizenship Status in Walnut Grove
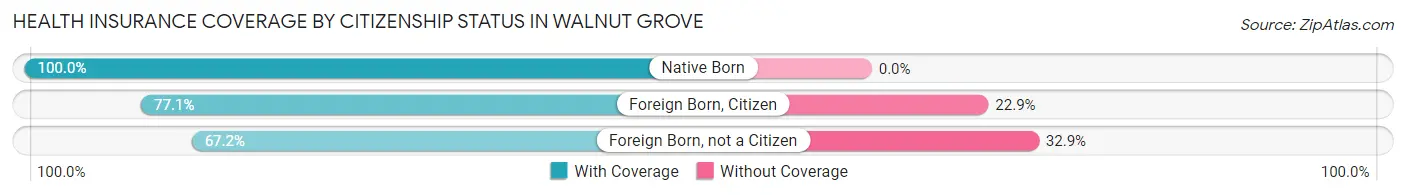
| Citizenship Status | With Coverage | Without Coverage |
| Native Born | 30 (100.0%) | 0 (0.0%) |
| Foreign Born, Citizen | 111 (77.1%) | 33 (22.9%) |
| Foreign Born, not a Citizen | 92 (67.1%) | 45 (32.9%) |
Health Insurance Coverage by Household Income in Walnut Grove
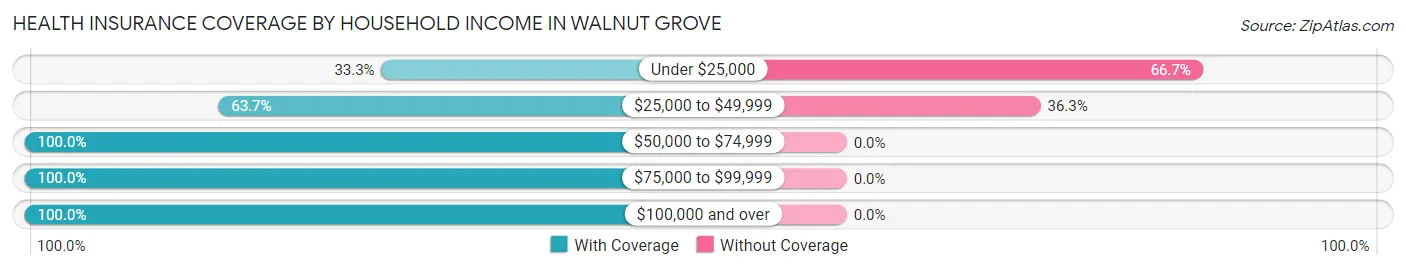
| Household Income | With Coverage | Without Coverage |
| Under $25,000 | 25 (33.3%) | 50 (66.7%) |
| $25,000 to $49,999 | 179 (63.7%) | 102 (36.3%) |
| $50,000 to $74,999 | 75 (100.0%) | 0 (0.0%) |
| $75,000 to $99,999 | 63 (100.0%) | 0 (0.0%) |
| $100,000 and over | 320 (100.0%) | 0 (0.0%) |
Public vs Private Health Insurance Coverage by Age in Walnut Grove
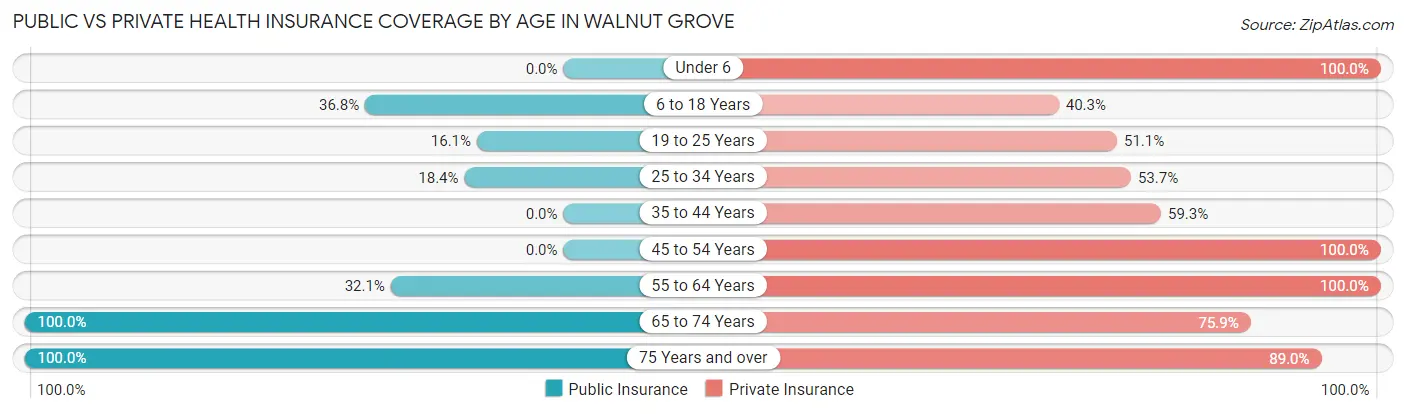
| Age Bracket | Public Insurance | Private Insurance |
| Under 6 | 0 (0.0%) | 30 (100.0%) |
| 6 to 18 Years | 53 (36.8%) | 58 (40.3%) |
| 19 to 25 Years | 22 (16.1%) | 70 (51.1%) |
| 25 to 34 Years | 25 (18.4%) | 73 (53.7%) |
| 35 to 44 Years | 0 (0.0%) | 16 (59.3%) |
| 45 to 54 Years | 0 (0.0%) | 55 (100.0%) |
| 55 to 64 Years | 25 (32.1%) | 78 (100.0%) |
| 65 to 74 Years | 116 (100.0%) | 88 (75.9%) |
| 75 Years and over | 91 (100.0%) | 81 (89.0%) |
| Total | 332 (40.8%) | 549 (67.4%) |
Disability Status by Sex by Age in Walnut Grove
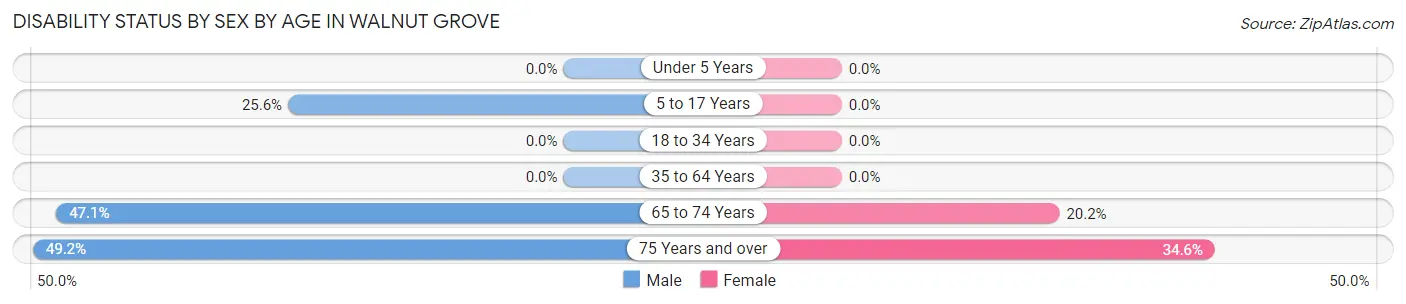
| Age Bracket | Male | Female |
| Under 5 Years | 0 (0.0%) | 0 (0.0%) |
| 5 to 17 Years | 23 (25.6%) | 0 (0.0%) |
| 18 to 34 Years | 0 (0.0%) | 0 (0.0%) |
| 35 to 64 Years | 0 (0.0%) | 0 (0.0%) |
| 65 to 74 Years | 8 (47.1%) | 20 (20.2%) |
| 75 Years and over | 32 (49.2%) | 9 (34.6%) |
Disability Class by Sex by Age in Walnut Grove
Disability Class: Hearing Difficulty
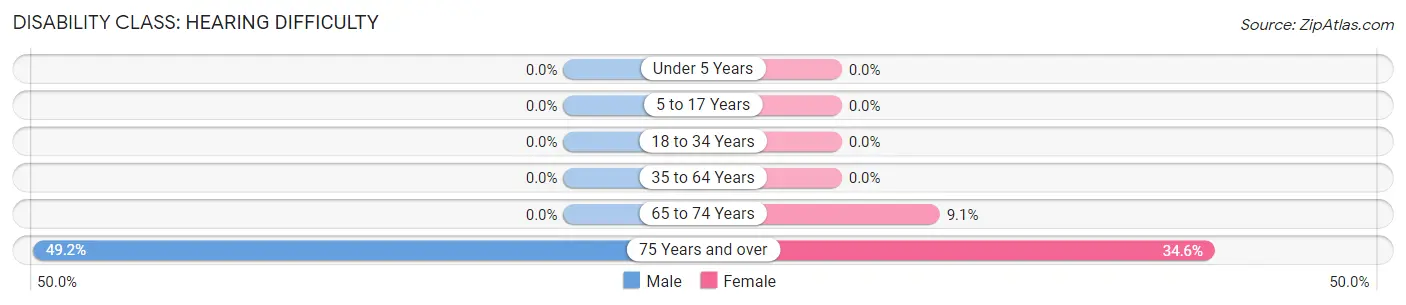
| Age Bracket | Male | Female |
| Under 5 Years | 0 (0.0%) | 0 (0.0%) |
| 5 to 17 Years | 0 (0.0%) | 0 (0.0%) |
| 18 to 34 Years | 0 (0.0%) | 0 (0.0%) |
| 35 to 64 Years | 0 (0.0%) | 0 (0.0%) |
| 65 to 74 Years | 0 (0.0%) | 9 (9.1%) |
| 75 Years and over | 32 (49.2%) | 9 (34.6%) |
Disability Class: Vision Difficulty
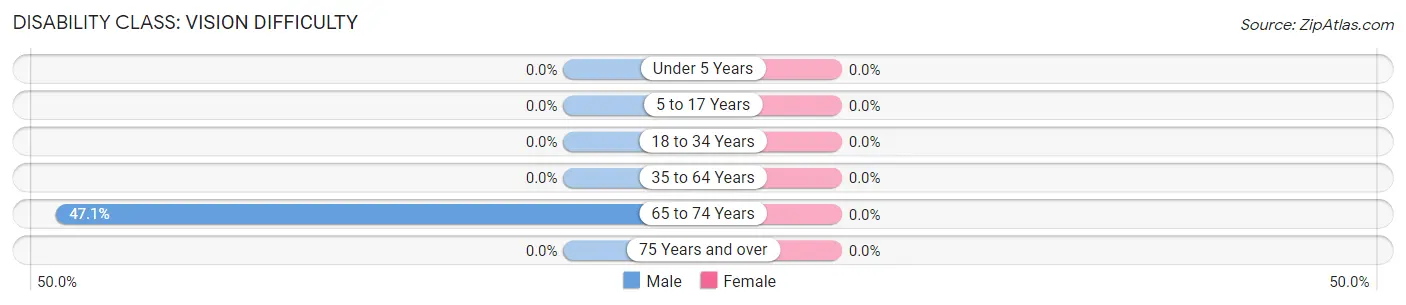
| Age Bracket | Male | Female |
| Under 5 Years | 0 (0.0%) | 0 (0.0%) |
| 5 to 17 Years | 0 (0.0%) | 0 (0.0%) |
| 18 to 34 Years | 0 (0.0%) | 0 (0.0%) |
| 35 to 64 Years | 0 (0.0%) | 0 (0.0%) |
| 65 to 74 Years | 8 (47.1%) | 0 (0.0%) |
| 75 Years and over | 0 (0.0%) | 0 (0.0%) |
Disability Class: Cognitive Difficulty
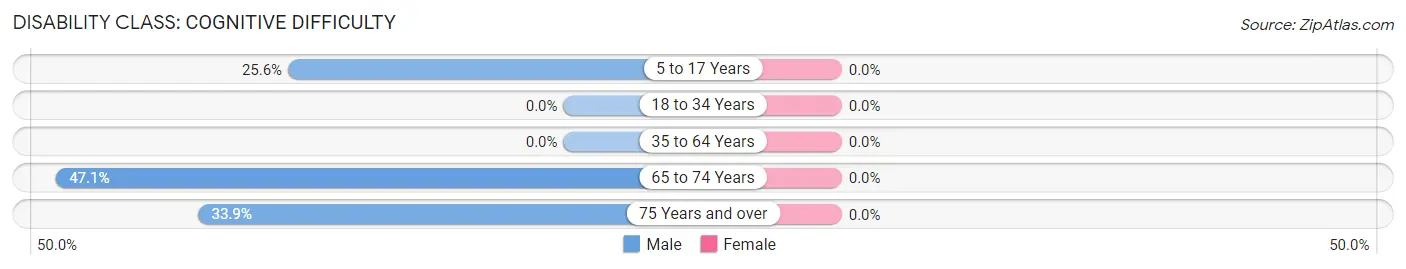
| Age Bracket | Male | Female |
| 5 to 17 Years | 23 (25.6%) | 0 (0.0%) |
| 18 to 34 Years | 0 (0.0%) | 0 (0.0%) |
| 35 to 64 Years | 0 (0.0%) | 0 (0.0%) |
| 65 to 74 Years | 8 (47.1%) | 0 (0.0%) |
| 75 Years and over | 22 (33.9%) | 0 (0.0%) |
Disability Class: Ambulatory Difficulty
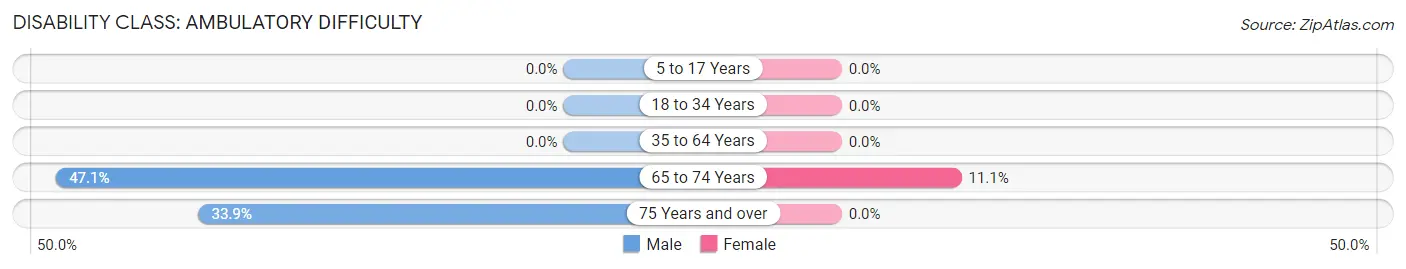
| Age Bracket | Male | Female |
| 5 to 17 Years | 0 (0.0%) | 0 (0.0%) |
| 18 to 34 Years | 0 (0.0%) | 0 (0.0%) |
| 35 to 64 Years | 0 (0.0%) | 0 (0.0%) |
| 65 to 74 Years | 8 (47.1%) | 11 (11.1%) |
| 75 Years and over | 22 (33.9%) | 0 (0.0%) |
Disability Class: Self-Care Difficulty
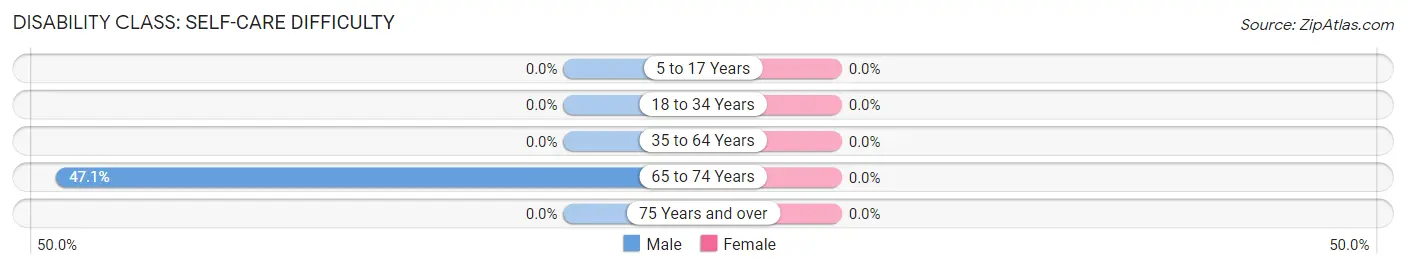
| Age Bracket | Male | Female |
| 5 to 17 Years | 0 (0.0%) | 0 (0.0%) |
| 18 to 34 Years | 0 (0.0%) | 0 (0.0%) |
| 35 to 64 Years | 0 (0.0%) | 0 (0.0%) |
| 65 to 74 Years | 8 (47.1%) | 0 (0.0%) |
| 75 Years and over | 0 (0.0%) | 0 (0.0%) |
Technology Access in Walnut Grove
Computing Device Access in Walnut Grove
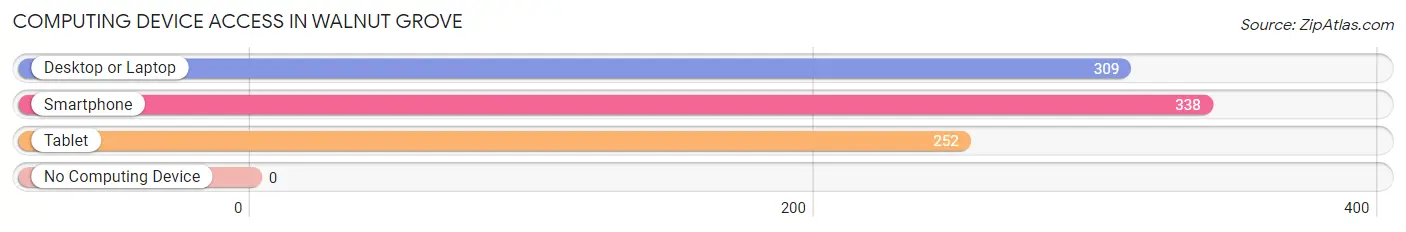
| Device Type | # Households | % Households |
| Desktop or Laptop | 309 | 89.0% |
| Smartphone | 338 | 97.4% |
| Tablet | 252 | 72.6% |
| No Computing Device | 0 | 0.0% |
| Total | 347 | 100.0% |
Internet Access in Walnut Grove
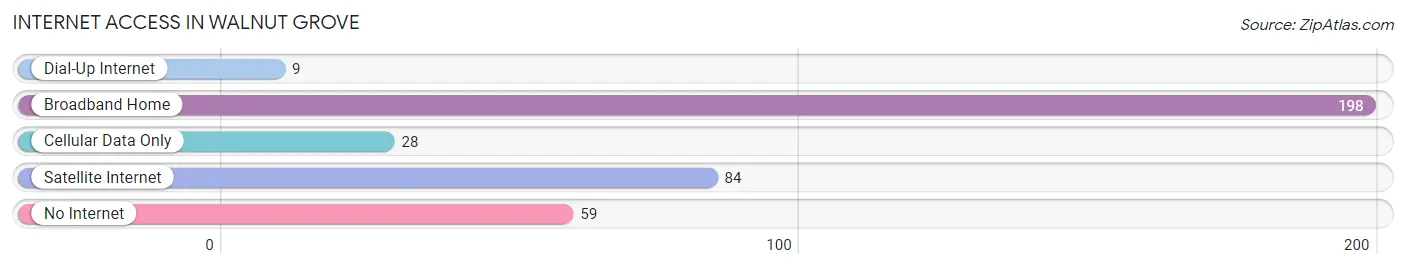
| Internet Type | # Households | % Households |
| Dial-Up Internet | 9 | 2.6% |
| Broadband Home | 198 | 57.1% |
| Cellular Data Only | 28 | 8.1% |
| Satellite Internet | 84 | 24.2% |
| No Internet | 59 | 17.0% |
| Total | 347 | 100.0% |
Walnut Grove Summary
Walnut Grove, California is a small town located in the Sacramento-San Joaquin Delta region of California. It is situated in the northern part of Sacramento County, approximately 25 miles south of Sacramento. The town has a population of approximately 1,500 people and is known for its agricultural heritage and rural lifestyle.
History
Walnut Grove was founded in 1851 by a group of settlers from the Midwest. The town was originally called “Walnut Grove” due to the abundance of walnut trees in the area. The town was incorporated in 1872 and has remained a small, rural community ever since.
The town was an important stop on the Sacramento River steamboat route in the late 19th century. The steamboats brought goods and passengers to the town, and the town’s economy was largely based on the river trade.
In the early 20th century, the town was a popular destination for tourists and vacationers. The town was known for its picturesque views of the river and its many attractions, such as the historic Walnut Grove Hotel.
Geography
Walnut Grove is located in the Sacramento-San Joaquin Delta region of California. The town is situated in the northern part of Sacramento County, approximately 25 miles south of Sacramento. The town is located on the banks of the Sacramento River and is surrounded by agricultural land.
The town has a total area of 1.2 square miles, all of which is land. The town has a warm-summer Mediterranean climate, with hot, dry summers and mild, wet winters.
Economy
The economy of Walnut Grove is largely based on agriculture. The town is home to several large farms and ranches, which produce a variety of crops, including walnuts, almonds, tomatoes, and other fruits and vegetables. The town is also home to several wineries and vineyards, which produce a variety of wines.
In addition to agriculture, the town is home to several small businesses, including restaurants, shops, and other services. The town is also home to a small airport, which serves the local area.
Demographics
As of the 2010 census, the population of Walnut Grove was 1,521. The racial makeup of the town was 79.3% White, 0.7% African American, 0.7% Native American, 0.7% Asian, 0.2% Pacific Islander, and 17.3% from other races. Hispanic or Latino of any race were 28.3% of the population.
The median household income in Walnut Grove was $45,938, and the median family income was $50,938. The per capita income for the town was $20,938. About 11.3% of families and 14.3% of the population were below the poverty line, including 18.3% of those under age 18 and 8.3% of those age 65 or over.
Walnut Grove is a small, rural town with a rich history and a strong agricultural heritage. The town is home to a diverse population and a variety of businesses and services. The town is a popular destination for tourists and vacationers, and is known for its picturesque views of the river and its many attractions.
Common Questions
What is Per Capita Income in Walnut Grove?
Per Capita income in Walnut Grove is $40,751.
What is the Median Family Income in Walnut Grove?
Median Family Income in Walnut Grove is $85,052.
What is the Median Household income in Walnut Grove?
Median Household Income in Walnut Grove is $70,852.
What is Inequality or Gini Index in Walnut Grove?
Inequality or Gini Index in Walnut Grove is 0.47.
What is the Total Population of Walnut Grove?
Total Population of Walnut Grove is 814.
What is the Total Male Population of Walnut Grove?
Total Male Population of Walnut Grove is 447.
What is the Total Female Population of Walnut Grove?
Total Female Population of Walnut Grove is 367.
What is the Ratio of Males per 100 Females in Walnut Grove?
There are 121.80 Males per 100 Females in Walnut Grove.
What is the Ratio of Females per 100 Males in Walnut Grove?
There are 82.10 Females per 100 Males in Walnut Grove.
What is the Median Population Age in Walnut Grove?
Median Population Age in Walnut Grove is 32.8 Years.
What is the Average Family Size in Walnut Grove
Average Family Size in Walnut Grove is 2.5 People.
What is the Average Household Size in Walnut Grove
Average Household Size in Walnut Grove is 2.4 People.
How Large is the Labor Force in Walnut Grove?
There are 445 People in the Labor Forcein in Walnut Grove.
What is the Percentage of People in the Labor Force in Walnut Grove?
61.7% of People are in the Labor Force in Walnut Grove.
What is the Unemployment Rate in Walnut Grove?
Unemployment Rate in Walnut Grove is 2.5%.