Zip Codes with the Highest Percentage of Population Employed in Life, Physical & Social Science in Utah
RELATED REPORTS & OPTIONS
Life, Physical & Social Science
Utah
Compare Zip Codes
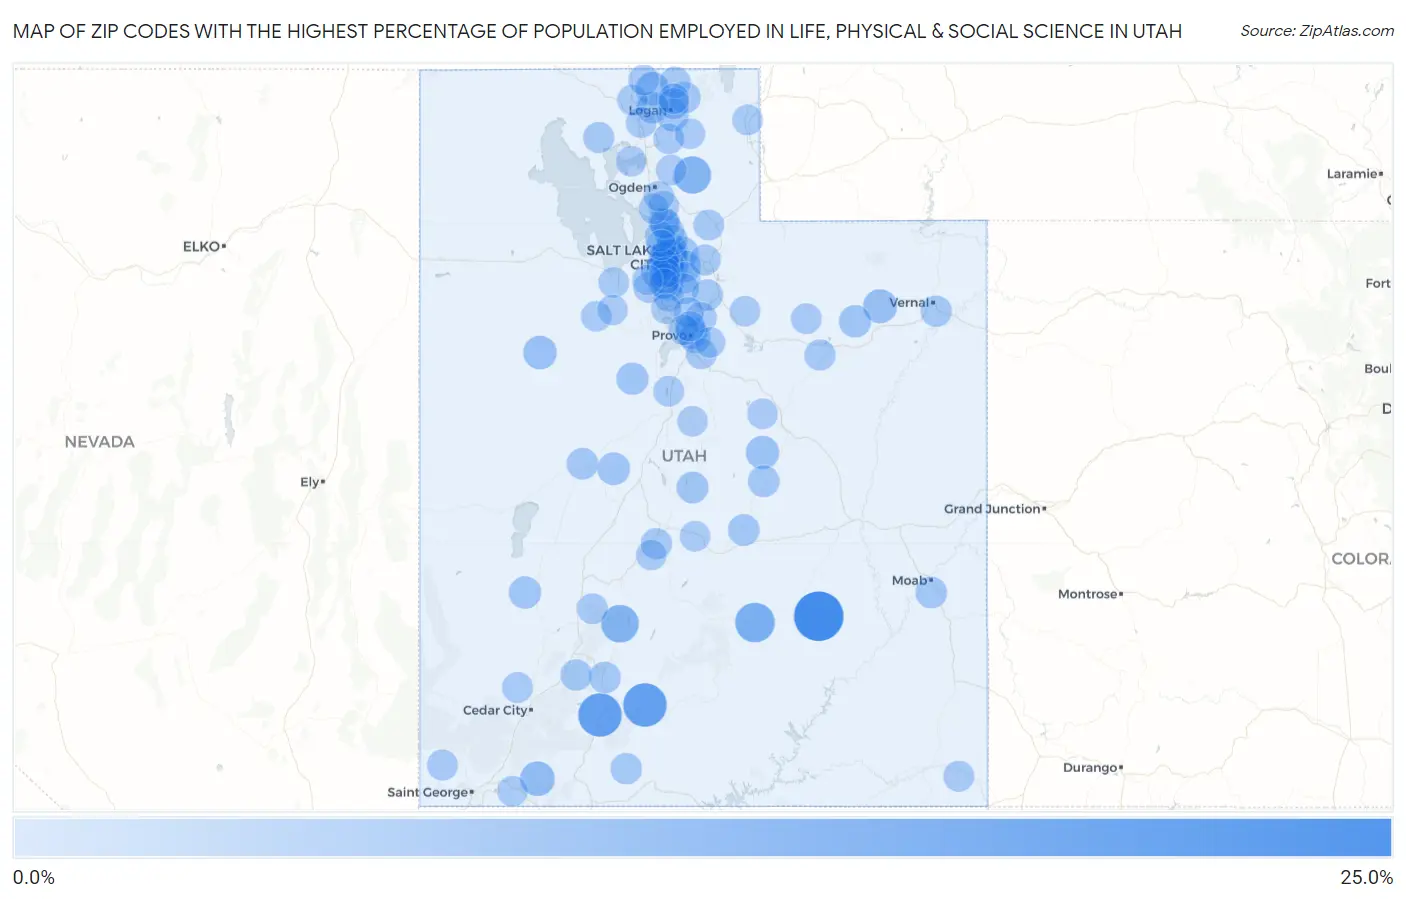
Map of Zip Codes with the Highest Percentage of Population Employed in Life, Physical & Social Science in Utah
0.0%
25.0%
Zip Codes with the Highest Percentage of Population Employed in Life, Physical & Social Science in Utah
| Zip Code | % Employed | vs State | vs National | |
| 1. | 84734 | 23.8% | 1.0%(+22.7)#1 | 1.1%(+22.7)#44 |
| 2. | 84764 | 16.3% | 1.0%(+15.3)#2 | 1.1%(+15.2)#93 |
| 3. | 84735 | 16.3% | 1.0%(+15.3)#3 | 1.1%(+15.2)#94 |
| 4. | 84775 | 11.6% | 1.0%(+10.6)#4 | 1.1%(+10.5)#151 |
| 5. | 84740 | 9.3% | 1.0%(+8.24)#5 | 1.1%(+8.17)#240 |
| 6. | 84317 | 8.9% | 1.0%(+7.89)#6 | 1.1%(+7.82)#262 |
| 7. | 84767 | 5.8% | 1.0%(+4.73)#7 | 1.1%(+4.66)#584 |
| 8. | 84053 | 5.0% | 1.0%(+3.96)#8 | 1.1%(+3.89)#766 |
| 9. | 84327 | 4.6% | 1.0%(+3.55)#9 | 1.1%(+3.49)#896 |
| 10. | 84102 | 4.5% | 1.0%(+3.43)#10 | 1.1%(+3.37)#940 |
| 11. | 84022 | 4.5% | 1.0%(+3.43)#11 | 1.1%(+3.36)#943 |
| 12. | 84528 | 4.2% | 1.0%(+3.18)#12 | 1.1%(+3.11)#1,047 |
| 13. | 84112 | 3.9% | 1.0%(+2.87)#13 | 1.1%(+2.80)#1,222 |
| 14. | 84113 | 3.4% | 1.0%(+2.40)#14 | 1.1%(+2.33)#1,487 |
| 15. | 84649 | 3.4% | 1.0%(+2.34)#15 | 1.1%(+2.28)#1,520 |
| 16. | 84751 | 3.2% | 1.0%(+2.13)#16 | 1.1%(+2.06)#1,705 |
| 17. | 84332 | 3.1% | 1.0%(+2.08)#17 | 1.1%(+2.01)#1,762 |
| 18. | 84103 | 3.1% | 1.0%(+2.06)#18 | 1.1%(+1.99)#1,778 |
| 19. | 84105 | 3.1% | 1.0%(+2.04)#19 | 1.1%(+1.98)#1,790 |
| 20. | 84628 | 3.0% | 1.0%(+1.95)#20 | 1.1%(+1.89)#1,906 |
| 21. | 84007 | 3.0% | 1.0%(+1.93)#21 | 1.1%(+1.86)#1,928 |
| 22. | 84602 | 2.8% | 1.0%(+1.82)#22 | 1.1%(+1.75)#2,063 |
| 23. | 84108 | 2.7% | 1.0%(+1.69)#23 | 1.1%(+1.63)#2,230 |
| 24. | 84325 | 2.7% | 1.0%(+1.63)#24 | 1.1%(+1.57)#2,300 |
| 25. | 84665 | 2.5% | 1.0%(+1.48)#25 | 1.1%(+1.41)#2,575 |
| 26. | 84109 | 2.5% | 1.0%(+1.46)#26 | 1.1%(+1.39)#2,601 |
| 27. | 84124 | 2.4% | 1.0%(+1.41)#27 | 1.1%(+1.34)#2,695 |
| 28. | 84513 | 2.4% | 1.0%(+1.37)#28 | 1.1%(+1.30)#2,771 |
| 29. | 84532 | 2.3% | 1.0%(+1.30)#29 | 1.1%(+1.23)#2,909 |
| 30. | 84624 | 2.3% | 1.0%(+1.29)#30 | 1.1%(+1.22)#2,936 |
| 31. | 84522 | 2.3% | 1.0%(+1.26)#31 | 1.1%(+1.19)#2,988 |
| 32. | 84759 | 2.3% | 1.0%(+1.24)#32 | 1.1%(+1.17)#3,042 |
| 33. | 84760 | 2.1% | 1.0%(+1.07)#33 | 1.1%(+1.00)#3,439 |
| 34. | 84606 | 2.1% | 1.0%(+1.05)#34 | 1.1%(+0.987)#3,470 |
| 35. | 84321 | 2.0% | 1.0%(+1.00)#35 | 1.1%(+0.936)#3,606 |
| 36. | 84741 | 2.0% | 1.0%(+0.981)#36 | 1.1%(+0.913)#3,678 |
| 37. | 84333 | 2.0% | 1.0%(+0.937)#37 | 1.1%(+0.870)#3,796 |
| 38. | 84117 | 1.9% | 1.0%(+0.905)#38 | 1.1%(+0.838)#3,892 |
| 39. | 84094 | 1.9% | 1.0%(+0.872)#39 | 1.1%(+0.805)#3,992 |
| 40. | 84106 | 1.9% | 1.0%(+0.872)#40 | 1.1%(+0.804)#3,994 |
| 41. | 84657 | 1.8% | 1.0%(+0.788)#41 | 1.1%(+0.721)#4,288 |
| 42. | 84121 | 1.8% | 1.0%(+0.783)#42 | 1.1%(+0.716)#4,300 |
| 43. | 84101 | 1.8% | 1.0%(+0.773)#43 | 1.1%(+0.706)#4,335 |
| 44. | 84078 | 1.8% | 1.0%(+0.747)#44 | 1.1%(+0.679)#4,441 |
| 45. | 84021 | 1.7% | 1.0%(+0.659)#45 | 1.1%(+0.591)#4,812 |
| 46. | 84049 | 1.7% | 1.0%(+0.640)#46 | 1.1%(+0.572)#4,882 |
| 47. | 84341 | 1.6% | 1.0%(+0.581)#47 | 1.1%(+0.514)#5,131 |
| 48. | 84098 | 1.6% | 1.0%(+0.575)#48 | 1.1%(+0.507)#5,166 |
| 49. | 84307 | 1.6% | 1.0%(+0.564)#49 | 1.1%(+0.496)#5,212 |
| 50. | 84765 | 1.5% | 1.0%(+0.465)#50 | 1.1%(+0.398)#5,717 |
| 51. | 84534 | 1.5% | 1.0%(+0.457)#51 | 1.1%(+0.390)#5,764 |
| 52. | 84009 | 1.5% | 1.0%(+0.453)#52 | 1.1%(+0.385)#5,790 |
| 53. | 84111 | 1.5% | 1.0%(+0.444)#53 | 1.1%(+0.377)#5,832 |
| 54. | 84014 | 1.5% | 1.0%(+0.443)#54 | 1.1%(+0.375)#5,835 |
| 55. | 84721 | 1.4% | 1.0%(+0.406)#55 | 1.1%(+0.338)#6,030 |
| 56. | 84312 | 1.4% | 1.0%(+0.403)#56 | 1.1%(+0.335)#6,050 |
| 57. | 84604 | 1.4% | 1.0%(+0.379)#57 | 1.1%(+0.311)#6,175 |
| 58. | 84092 | 1.4% | 1.0%(+0.339)#58 | 1.1%(+0.272)#6,406 |
| 59. | 84037 | 1.4% | 1.0%(+0.331)#59 | 1.1%(+0.263)#6,452 |
| 60. | 84010 | 1.3% | 1.0%(+0.307)#60 | 1.1%(+0.240)#6,599 |
| 61. | 84033 | 1.3% | 1.0%(+0.305)#61 | 1.1%(+0.237)#6,614 |
| 62. | 84645 | 1.3% | 1.0%(+0.294)#62 | 1.1%(+0.226)#6,689 |
| 63. | 84664 | 1.3% | 1.0%(+0.293)#63 | 1.1%(+0.226)#6,690 |
| 64. | 84305 | 1.3% | 1.0%(+0.255)#64 | 1.1%(+0.187)#6,942 |
| 65. | 84314 | 1.3% | 1.0%(+0.252)#65 | 1.1%(+0.184)#6,962 |
| 66. | 84713 | 1.2% | 1.0%(+0.199)#66 | 1.1%(+0.132)#7,321 |
| 67. | 84328 | 1.2% | 1.0%(+0.188)#67 | 1.1%(+0.120)#7,404 |
| 68. | 84072 | 1.2% | 1.0%(+0.182)#68 | 1.1%(+0.114)#7,460 |
| 69. | 84115 | 1.2% | 1.0%(+0.174)#69 | 1.1%(+0.107)#7,508 |
| 70. | 84064 | 1.2% | 1.0%(+0.174)#70 | 1.1%(+0.107)#7,512 |
| 71. | 84020 | 1.1% | 1.0%(+0.116)#71 | 1.1%(+0.048)#7,941 |
| 72. | 84047 | 1.1% | 1.0%(+0.114)#72 | 1.1%(+0.046)#7,955 |
| 73. | 84318 | 1.1% | 1.0%(+0.109)#73 | 1.1%(+0.041)#7,990 |
| 74. | 84129 | 1.1% | 1.0%(+0.088)#74 | 1.1%(+0.020)#8,138 |
| 75. | 84107 | 1.1% | 1.0%(+0.083)#75 | 1.1%(+0.016)#8,176 |
| 76. | 84040 | 1.1% | 1.0%(+0.078)#76 | 1.1%(+0.010)#8,212 |
| 77. | 84069 | 1.1% | 1.0%(+0.076)#77 | 1.1%(+0.008)#8,232 |
| 78. | 84062 | 1.1% | 1.0%(+0.072)#78 | 1.1%(+0.005)#8,259 |
| 79. | 84070 | 1.1% | 1.0%(+0.064)#79 | 1.1%(-0.003)#8,318 |
| 80. | 84663 | 1.0% | 1.0%(+0.026)#80 | 1.1%(-0.041)#8,626 |
| 81. | 84032 | 1.0% | 1.0%(+0.012)#81 | 1.1%(-0.056)#8,754 |
| 82. | 84087 | 1.0% | 1.0%(+0.009)#82 | 1.1%(-0.059)#8,785 |
| 83. | 84654 | 1.0% | 1.0%(+0.006)#83 | 1.1%(-0.062)#8,808 |
| 84. | 84310 | 1.00% | 1.0%(-0.024)#84 | 1.1%(-0.091)#9,050 |
| 85. | 84737 | 1.00% | 1.0%(-0.026)#85 | 1.1%(-0.094)#9,067 |
| 86. | 84025 | 0.99% | 1.0%(-0.038)#86 | 1.1%(-0.105)#9,174 |
| 87. | 84730 | 0.98% | 1.0%(-0.040)#87 | 1.1%(-0.107)#9,198 |
| 88. | 84074 | 0.97% | 1.0%(-0.054)#88 | 1.1%(-0.122)#9,338 |
| 89. | 84043 | 0.96% | 1.0%(-0.067)#89 | 1.1%(-0.135)#9,439 |
| 90. | 84632 | 0.95% | 1.0%(-0.074)#90 | 1.1%(-0.141)#9,495 |
| 91. | 84526 | 0.93% | 1.0%(-0.093)#91 | 1.1%(-0.161)#9,666 |
| 92. | 84340 | 0.92% | 1.0%(-0.105)#92 | 1.1%(-0.172)#9,778 |
| 93. | 84054 | 0.91% | 1.0%(-0.117)#93 | 1.1%(-0.184)#9,899 |
| 94. | 84058 | 0.90% | 1.0%(-0.126)#94 | 1.1%(-0.193)#9,987 |
| 95. | 84081 | 0.89% | 1.0%(-0.137)#95 | 1.1%(-0.205)#10,094 |
| 96. | 84041 | 0.88% | 1.0%(-0.142)#96 | 1.1%(-0.210)#10,138 |
| 97. | 84319 | 0.87% | 1.0%(-0.152)#97 | 1.1%(-0.220)#10,240 |
| 98. | 84405 | 0.87% | 1.0%(-0.152)#98 | 1.1%(-0.220)#10,243 |
| 99. | 84071 | 0.86% | 1.0%(-0.161)#99 | 1.1%(-0.229)#10,345 |
| 100. | 84097 | 0.86% | 1.0%(-0.161)#100 | 1.1%(-0.229)#10,352 |
Common Questions
What are the Top 10 Zip Codes with the Highest Percentage of Population Employed in Life, Physical & Social Science in Utah?
Top 10 Zip Codes with the Highest Percentage of Population Employed in Life, Physical & Social Science in Utah are:
What zip code has the Highest Percentage of Population Employed in Life, Physical & Social Science in Utah?
84734 has the Highest Percentage of Population Employed in Life, Physical & Social Science in Utah with 23.8%.
What is the Percentage of Population Employed in Life, Physical & Social Science in the State of Utah?
Percentage of Population Employed in Life, Physical & Social Science in Utah is 1.0%.
What is the Percentage of Population Employed in Life, Physical & Social Science in the United States?
Percentage of Population Employed in Life, Physical & Social Science in the United States is 1.1%.