Scotch-Irish Disability Age 35 to 64
COMPARE
Scotch-Irish
Select to Compare
Disability Age 35 to 64
Scotch-Irish Disability Age 35 to 64
13.0%
DISABILITY | AGE 35 TO 64
0.1/ 100
METRIC RATING
281st/ 347
METRIC RANK
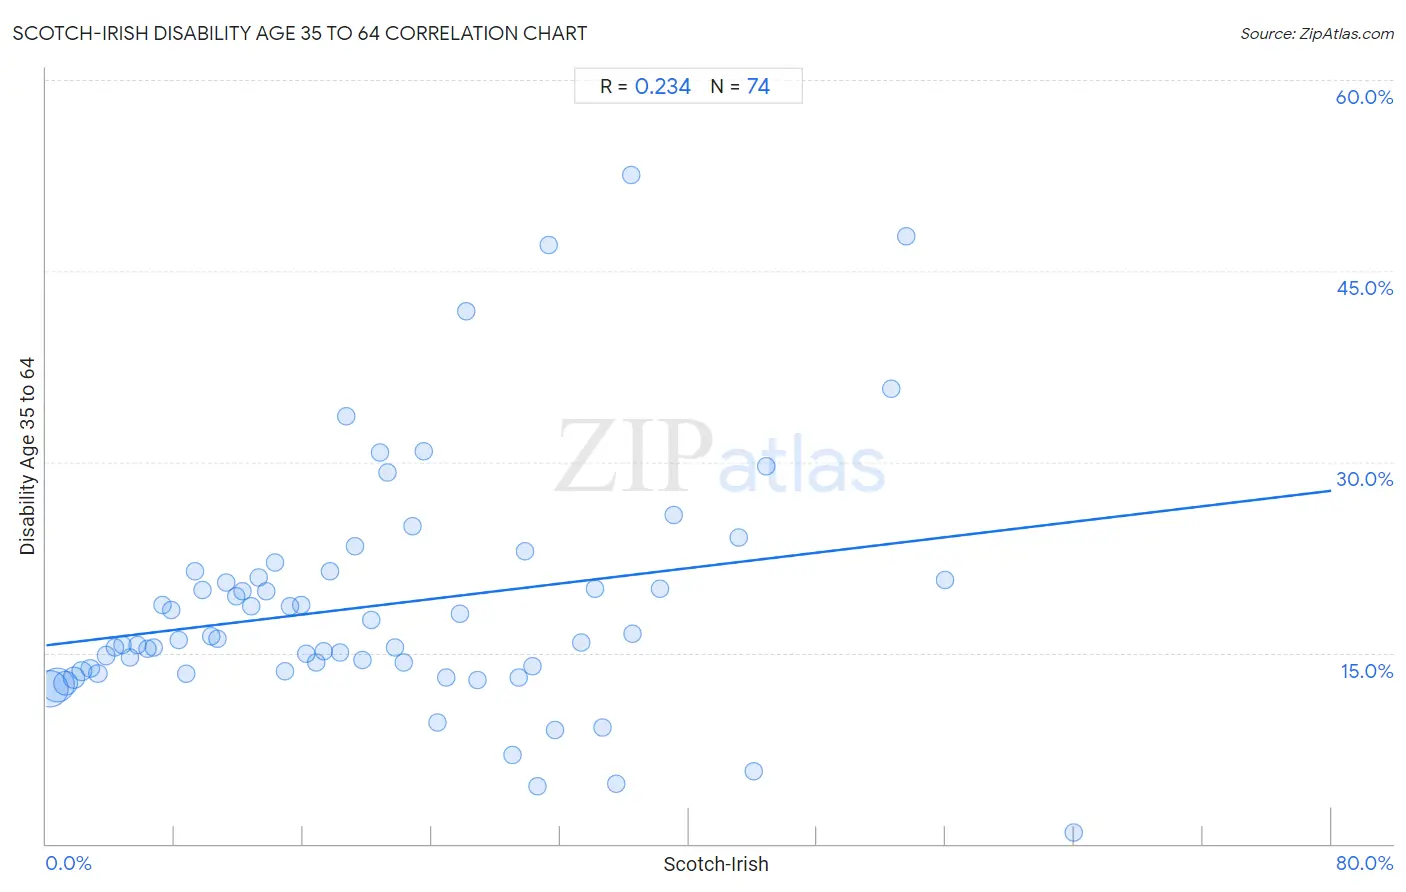
Scotch-Irish Disability Age 35 to 64 Correlation Chart
The statistical analysis conducted on geographies consisting of 548,060,326 people shows a weak positive correlation between the proportion of Scotch-Irish and percentage of population with a disability between the ages 34 and 64 in the United States with a correlation coefficient (R) of 0.234 and weighted average of 13.0%. On average, for every 1% (one percent) increase in Scotch-Irish within a typical geography, there is an increase of 0.15% in percentage of population with a disability between the ages 34 and 64.
It is essential to understand that the correlation between the percentage of Scotch-Irish and percentage of population with a disability between the ages 34 and 64 does not imply a direct cause-and-effect relationship. It remains uncertain whether the presence of Scotch-Irish influences an upward or downward trend in the level of percentage of population with a disability between the ages 34 and 64 within an area, or if Scotch-Irish simply ended up residing in those areas with higher or lower levels of percentage of population with a disability between the ages 34 and 64 due to other factors.
Demographics Similar to Scotch-Irish by Disability Age 35 to 64
In terms of disability age 35 to 64, the demographic groups most similar to Scotch-Irish are Immigrants from Laos (13.0%, a difference of 0.090%), Liberian (12.9%, a difference of 0.20%), Immigrants from Micronesia (12.9%, a difference of 0.36%), French Canadian (12.9%, a difference of 0.39%), and Immigrants from Dominican Republic (12.9%, a difference of 0.42%).
| Demographics | Rating | Rank | Disability Age 35 to 64 |
| Celtics | 0.1 /100 | #274 | Tragic 12.9% |
| Dominicans | 0.1 /100 | #275 | Tragic 12.9% |
| Somalis | 0.1 /100 | #276 | Tragic 12.9% |
| Immigrants from Dominican Republic | 0.1 /100 | #277 | Tragic 12.9% |
| French Canadians | 0.1 /100 | #278 | Tragic 12.9% |
| Immigrants from Micronesia | 0.1 /100 | #279 | Tragic 12.9% |
| Liberians | 0.1 /100 | #280 | Tragic 12.9% |
| Scotch-Irish | 0.1 /100 | #281 | Tragic 13.0% |
| Immigrants from Laos | 0.1 /100 | #282 | Tragic 13.0% |
| Central American Indians | 0.0 /100 | #283 | Tragic 13.0% |
| Nonimmigrants | 0.0 /100 | #284 | Tragic 13.0% |
| Immigrants from Somalia | 0.0 /100 | #285 | Tragic 13.1% |
| Hmong | 0.0 /100 | #286 | Tragic 13.1% |
| Tlingit-Haida | 0.0 /100 | #287 | Tragic 13.2% |
| Fijians | 0.0 /100 | #288 | Tragic 13.2% |
Scotch-Irish Disability Age 35 to 64 Correlation Summary
| Measurement | Scotch-Irish Data | Disability Age 35 to 64 Data |
| Minimum | 0.25% | 0.87% |
| Maximum | 64.0% | 52.5% |
| Range | 63.7% | 51.7% |
| Mean | 20.8% | 18.7% |
| Median | 18.5% | 16.1% |
| Interquartile 25% (IQ1) | 9.2% | 13.6% |
| Interquartile 75% (IQ3) | 30.3% | 20.9% |
| Interquartile Range (IQR) | 21.0% | 7.3% |
| Standard Deviation (Sample) | 14.5% | 9.4% |
| Standard Deviation (Population) | 14.4% | 9.4% |
Correlation Details
| Scotch-Irish Percentile | Sample Size | Disability Age 35 to 64 |
[ 0.0% - 0.5% ] 0.25% | 210,535,509 | 12.2% |
[ 0.5% - 1.0% ] 0.72% | 183,144,706 | 12.5% |
[ 1.0% - 1.5% ] 1.21% | 82,655,066 | 12.6% |
[ 1.5% - 2.0% ] 1.72% | 36,429,697 | 13.1% |
[ 2.0% - 2.5% ] 2.21% | 15,877,922 | 13.6% |
[ 2.5% - 3.0% ] 2.73% | 7,846,635 | 13.8% |
[ 3.0% - 3.5% ] 3.23% | 5,118,312 | 13.3% |
[ 3.5% - 4.0% ] 3.75% | 2,449,885 | 14.8% |
[ 4.0% - 4.5% ] 4.25% | 1,271,022 | 15.5% |
[ 4.5% - 5.0% ] 4.76% | 743,378 | 15.6% |
[ 5.0% - 5.5% ] 5.23% | 638,139 | 14.7% |
[ 5.5% - 6.0% ] 5.71% | 321,376 | 15.7% |
[ 6.0% - 6.5% ] 6.29% | 206,802 | 15.3% |
[ 6.5% - 7.0% ] 6.71% | 137,541 | 15.4% |
[ 7.0% - 7.5% ] 7.24% | 119,441 | 18.7% |
[ 7.5% - 8.0% ] 7.79% | 111,442 | 18.4% |
[ 8.0% - 8.5% ] 8.22% | 75,220 | 16.0% |
[ 8.5% - 9.0% ] 8.75% | 59,942 | 13.3% |
[ 9.0% - 9.5% ] 9.25% | 39,974 | 21.4% |
[ 9.5% - 10.0% ] 9.76% | 37,972 | 19.9% |
[ 10.0% - 10.5% ] 10.27% | 38,474 | 16.3% |
[ 10.5% - 11.0% ] 10.70% | 26,247 | 16.1% |
[ 11.0% - 11.5% ] 11.24% | 20,069 | 20.5% |
[ 11.5% - 12.0% ] 11.80% | 17,078 | 19.4% |
[ 12.0% - 12.5% ] 12.23% | 8,591 | 19.9% |
[ 12.5% - 13.0% ] 12.75% | 5,136 | 18.7% |
[ 13.0% - 13.5% ] 13.22% | 18,587 | 20.9% |
[ 13.5% - 14.0% ] 13.72% | 14,777 | 19.8% |
[ 14.0% - 14.5% ] 14.26% | 16,014 | 22.1% |
[ 14.5% - 15.0% ] 14.86% | 2,760 | 13.5% |
[ 15.0% - 15.5% ] 15.17% | 6,528 | 18.6% |
[ 15.5% - 16.0% ] 15.86% | 5,209 | 18.8% |
[ 16.0% - 16.5% ] 16.22% | 10,336 | 14.9% |
[ 16.5% - 17.0% ] 16.81% | 4,835 | 14.2% |
[ 17.0% - 17.5% ] 17.24% | 7,469 | 15.2% |
[ 17.5% - 18.0% ] 17.66% | 9,569 | 21.4% |
[ 18.0% - 18.5% ] 18.32% | 1,987 | 15.0% |
[ 18.5% - 19.0% ] 18.65% | 2,970 | 33.6% |
[ 19.0% - 19.5% ] 19.22% | 1,868 | 23.4% |
[ 19.5% - 20.0% ] 19.73% | 1,171 | 14.4% |
[ 20.0% - 20.5% ] 20.25% | 716 | 17.6% |
[ 20.5% - 21.0% ] 20.76% | 2,283 | 30.8% |
[ 21.0% - 21.5% ] 21.24% | 1,342 | 29.1% |
[ 21.5% - 22.0% ] 21.72% | 1,395 | 15.4% |
[ 22.0% - 22.5% ] 22.22% | 18 | 14.3% |
[ 22.5% - 23.0% ] 22.77% | 1,458 | 24.9% |
[ 23.0% - 23.5% ] 23.48% | 903 | 30.8% |
[ 24.0% - 24.5% ] 24.34% | 226 | 9.5% |
[ 24.5% - 25.0% ] 24.87% | 1,773 | 13.1% |
[ 25.5% - 26.0% ] 25.79% | 570 | 18.1% |
[ 26.0% - 26.5% ] 26.16% | 237 | 41.9% |
[ 26.5% - 27.0% ] 26.87% | 67 | 12.9% |
[ 28.5% - 29.0% ] 29.00% | 100 | 7.0% |
[ 29.0% - 29.5% ] 29.42% | 469 | 13.0% |
[ 29.5% - 30.0% ] 29.83% | 905 | 23.0% |
[ 30.0% - 30.5% ] 30.26% | 3,024 | 14.0% |
[ 30.5% - 31.0% ] 30.57% | 386 | 4.5% |
[ 31.0% - 31.5% ] 31.25% | 32 | 47.1% |
[ 31.5% - 32.0% ] 31.65% | 79 | 8.9% |
[ 33.0% - 33.5% ] 33.33% | 36 | 15.8% |
[ 34.0% - 34.5% ] 34.17% | 1,080 | 20.0% |
[ 34.5% - 35.0% ] 34.62% | 234 | 9.2% |
[ 35.0% - 35.5% ] 35.46% | 141 | 4.8% |
[ 36.0% - 36.5% ] 36.40% | 728 | 52.5% |
[ 36.5% - 37.0% ] 36.53% | 605 | 16.5% |
[ 38.0% - 38.5% ] 38.18% | 55 | 20.0% |
[ 39.0% - 39.5% ] 39.08% | 87 | 25.8% |
[ 43.0% - 43.5% ] 43.13% | 473 | 24.0% |
[ 44.0% - 44.5% ] 44.08% | 338 | 5.7% |
[ 44.5% - 45.0% ] 44.84% | 339 | 29.7% |
[ 52.5% - 53.0% ] 52.63% | 38 | 35.7% |
[ 53.5% - 54.0% ] 53.51% | 299 | 47.7% |
[ 55.5% - 56.0% ] 55.93% | 59 | 20.7% |
[ 64.0% - 64.5% ] 64.00% | 175 | 0.87% |