Scotch-Irish Vision Disability
COMPARE
Scotch-Irish
Select to Compare
Vision Disability
Scotch-Irish Vision Disability
2.4%
VISION DISABILITY
0.0/ 100
METRIC RATING
276th/ 347
METRIC RANK
Scotch-Irish Vision Disability Correlation Chart
The statistical analysis conducted on geographies consisting of 547,366,805 people shows a mild positive correlation between the proportion of Scotch-Irish and percentage of population with vision disability in the United States with a correlation coefficient (R) of 0.359 and weighted average of 2.4%. On average, for every 1% (one percent) increase in Scotch-Irish within a typical geography, there is an increase of 0.20% in percentage of population with vision disability.
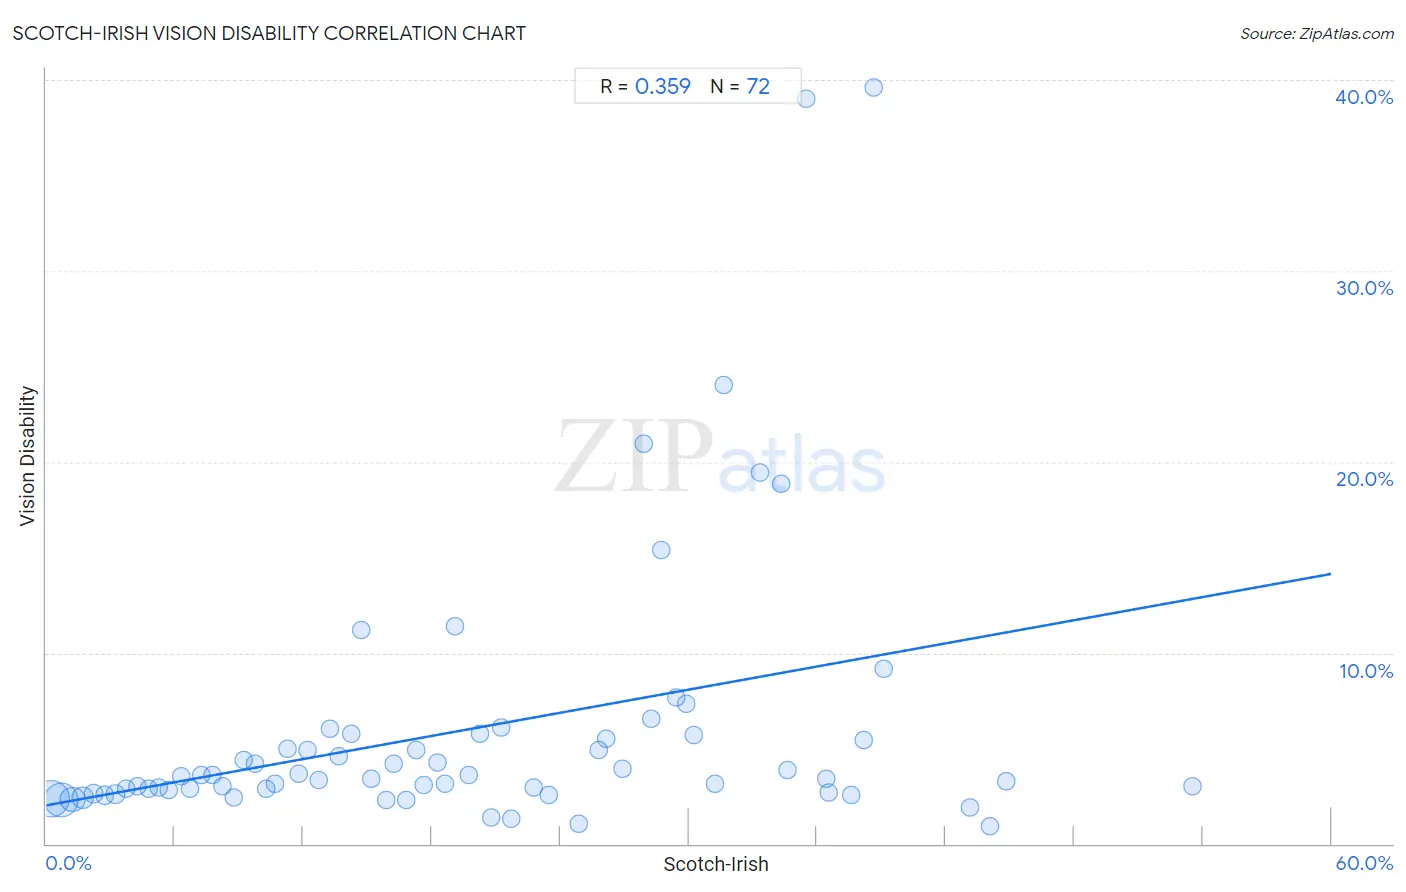
It is essential to understand that the correlation between the percentage of Scotch-Irish and percentage of population with vision disability does not imply a direct cause-and-effect relationship. It remains uncertain whether the presence of Scotch-Irish influences an upward or downward trend in the level of percentage of population with vision disability within an area, or if Scotch-Irish simply ended up residing in those areas with higher or lower levels of percentage of population with vision disability due to other factors.
Demographics Similar to Scotch-Irish by Vision Disability
In terms of vision disability, the demographic groups most similar to Scotch-Irish are Bahamian (2.4%, a difference of 0.040%), Chippewa (2.4%, a difference of 0.090%), Spanish (2.4%, a difference of 0.20%), Nepalese (2.4%, a difference of 0.21%), and Cape Verdean (2.4%, a difference of 0.25%).
| Demographics | Rating | Rank | Vision Disability |
| Celtics | 0.1 /100 | #269 | Tragic 2.4% |
| Cubans | 0.1 /100 | #270 | Tragic 2.4% |
| Immigrants from the Azores | 0.1 /100 | #271 | Tragic 2.4% |
| Spaniards | 0.1 /100 | #272 | Tragic 2.4% |
| Immigrants from Bahamas | 0.1 /100 | #273 | Tragic 2.4% |
| Immigrants from Latin America | 0.0 /100 | #274 | Tragic 2.4% |
| Chippewa | 0.0 /100 | #275 | Tragic 2.4% |
| Scotch-Irish | 0.0 /100 | #276 | Tragic 2.4% |
| Bahamians | 0.0 /100 | #277 | Tragic 2.4% |
| Spanish | 0.0 /100 | #278 | Tragic 2.4% |
| Nepalese | 0.0 /100 | #279 | Tragic 2.4% |
| Cape Verdeans | 0.0 /100 | #280 | Tragic 2.4% |
| U.S. Virgin Islanders | 0.0 /100 | #281 | Tragic 2.5% |
| Immigrants from Caribbean | 0.0 /100 | #282 | Tragic 2.5% |
| Puget Sound Salish | 0.0 /100 | #283 | Tragic 2.5% |
Scotch-Irish Vision Disability Correlation Summary
| Measurement | Scotch-Irish Data | Vision Disability Data |
| Minimum | 0.25% | 0.89% |
| Maximum | 53.5% | 39.6% |
| Range | 53.3% | 38.7% |
| Mean | 19.7% | 6.0% |
| Median | 18.0% | 3.5% |
| Interquartile 25% (IQ1) | 9.0% | 2.7% |
| Interquartile 75% (IQ3) | 29.6% | 5.6% |
| Interquartile Range (IQR) | 20.7% | 2.9% |
| Standard Deviation (Sample) | 12.9% | 7.3% |
| Standard Deviation (Population) | 12.8% | 7.2% |
Correlation Details
| Scotch-Irish Percentile | Sample Size | Vision Disability |
[ 0.0% - 0.5% ] 0.25% | 210,502,174 | 2.4% |
[ 0.5% - 1.0% ] 0.72% | 182,953,150 | 2.3% |
[ 1.0% - 1.5% ] 1.21% | 82,544,885 | 2.3% |
[ 1.5% - 2.0% ] 1.72% | 36,352,014 | 2.4% |
[ 2.0% - 2.5% ] 2.21% | 15,819,028 | 2.6% |
[ 2.5% - 3.0% ] 2.73% | 7,820,775 | 2.6% |
[ 3.0% - 3.5% ] 3.23% | 5,090,514 | 2.6% |
[ 3.5% - 4.0% ] 3.75% | 2,418,736 | 2.9% |
[ 4.0% - 4.5% ] 4.25% | 1,241,791 | 3.0% |
[ 4.5% - 5.0% ] 4.76% | 724,913 | 2.9% |
[ 5.0% - 5.5% ] 5.23% | 629,148 | 2.9% |
[ 5.5% - 6.0% ] 5.71% | 312,711 | 2.8% |
[ 6.0% - 6.5% ] 6.29% | 195,816 | 3.5% |
[ 6.5% - 7.0% ] 6.71% | 134,482 | 2.9% |
[ 7.0% - 7.5% ] 7.23% | 107,598 | 3.6% |
[ 7.5% - 8.0% ] 7.79% | 108,760 | 3.6% |
[ 8.0% - 8.5% ] 8.21% | 66,220 | 3.0% |
[ 8.5% - 9.0% ] 8.74% | 55,624 | 2.4% |
[ 9.0% - 9.5% ] 9.25% | 39,077 | 4.4% |
[ 9.5% - 10.0% ] 9.76% | 37,585 | 4.2% |
[ 10.0% - 10.5% ] 10.27% | 35,441 | 2.9% |
[ 10.5% - 11.0% ] 10.67% | 22,540 | 3.1% |
[ 11.0% - 11.5% ] 11.24% | 17,655 | 5.0% |
[ 11.5% - 12.0% ] 11.80% | 16,495 | 3.6% |
[ 12.0% - 12.5% ] 12.21% | 7,763 | 4.9% |
[ 12.5% - 13.0% ] 12.74% | 3,799 | 3.3% |
[ 13.0% - 13.5% ] 13.22% | 18,860 | 6.0% |
[ 13.5% - 14.0% ] 13.69% | 13,751 | 4.6% |
[ 14.0% - 14.5% ] 14.25% | 14,151 | 5.7% |
[ 14.5% - 15.0% ] 14.73% | 1,555 | 11.2% |
[ 15.0% - 15.5% ] 15.16% | 4,511 | 3.4% |
[ 15.5% - 16.0% ] 15.87% | 3,434 | 2.3% |
[ 16.0% - 16.5% ] 16.23% | 9,539 | 4.2% |
[ 16.5% - 17.0% ] 16.81% | 4,652 | 2.3% |
[ 17.0% - 17.5% ] 17.29% | 4,830 | 4.9% |
[ 17.5% - 18.0% ] 17.65% | 8,555 | 3.1% |
[ 18.0% - 18.5% ] 18.30% | 2,044 | 4.3% |
[ 18.5% - 19.0% ] 18.63% | 1,696 | 3.1% |
[ 19.0% - 19.5% ] 19.10% | 1,403 | 11.4% |
[ 19.5% - 20.0% ] 19.73% | 1,171 | 3.6% |
[ 20.0% - 20.5% ] 20.26% | 543 | 5.7% |
[ 20.5% - 21.0% ] 20.77% | 1,271 | 1.4% |
[ 21.0% - 21.5% ] 21.27% | 1,105 | 6.1% |
[ 21.5% - 22.0% ] 21.73% | 1,574 | 1.3% |
[ 22.5% - 23.0% ] 22.77% | 1,458 | 3.0% |
[ 23.0% - 23.5% ] 23.48% | 903 | 2.5% |
[ 24.5% - 25.0% ] 24.87% | 1,600 | 1.1% |
[ 25.5% - 26.0% ] 25.79% | 570 | 4.9% |
[ 26.0% - 26.5% ] 26.17% | 405 | 5.5% |
[ 26.5% - 27.0% ] 26.91% | 431 | 3.9% |
[ 27.5% - 28.0% ] 27.91% | 86 | 20.9% |
[ 28.0% - 28.5% ] 28.26% | 92 | 6.5% |
[ 28.5% - 29.0% ] 28.74% | 254 | 15.4% |
[ 29.0% - 29.5% ] 29.44% | 248 | 7.7% |
[ 29.5% - 30.0% ] 29.86% | 807 | 7.3% |
[ 30.0% - 30.5% ] 30.25% | 2,724 | 5.7% |
[ 31.0% - 31.5% ] 31.25% | 32 | 3.1% |
[ 31.5% - 32.0% ] 31.65% | 79 | 24.1% |
[ 33.0% - 33.5% ] 33.33% | 36 | 19.4% |
[ 34.0% - 34.5% ] 34.33% | 233 | 18.9% |
[ 34.5% - 35.0% ] 34.62% | 234 | 3.8% |
[ 35.0% - 35.5% ] 35.46% | 141 | 39.0% |
[ 36.0% - 36.5% ] 36.40% | 728 | 3.4% |
[ 36.5% - 37.0% ] 36.51% | 556 | 2.7% |
[ 37.5% - 38.0% ] 37.58% | 157 | 2.5% |
[ 38.0% - 38.5% ] 38.18% | 55 | 5.5% |
[ 38.5% - 39.0% ] 38.61% | 101 | 39.6% |
[ 39.0% - 39.5% ] 39.08% | 87 | 9.2% |
[ 43.0% - 43.5% ] 43.13% | 473 | 1.9% |
[ 44.0% - 44.5% ] 44.08% | 338 | 0.89% |
[ 44.5% - 45.0% ] 44.84% | 339 | 3.2% |
[ 53.5% - 54.0% ] 53.51% | 299 | 3.0% |