Scotch-Irish Disability Age 65 to 74
COMPARE
Scotch-Irish
Select to Compare
Disability Age 65 to 74
Scotch-Irish Disability Age 65 to 74
24.4%
DISABILITY | AGE 65 TO 74
3.8/ 100
METRIC RATING
235th/ 347
METRIC RANK
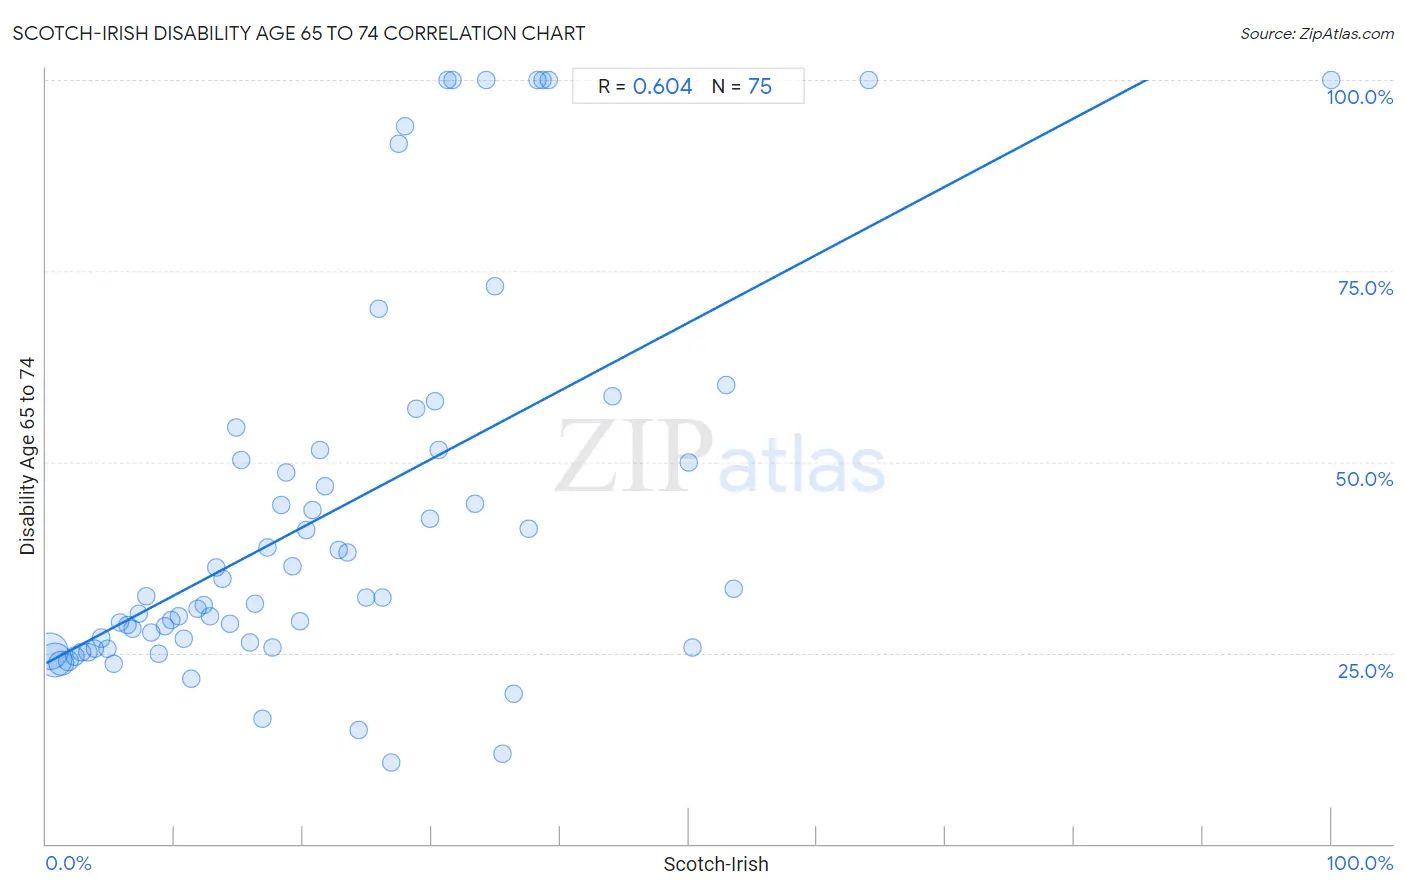
Scotch-Irish Disability Age 65 to 74 Correlation Chart
The statistical analysis conducted on geographies consisting of 546,992,221 people shows a significant positive correlation between the proportion of Scotch-Irish and percentage of population with a disability between the ages 65 and 75 in the United States with a correlation coefficient (R) of 0.604 and weighted average of 24.4%. On average, for every 1% (one percent) increase in Scotch-Irish within a typical geography, there is an increase of 0.89% in percentage of population with a disability between the ages 65 and 75.
It is essential to understand that the correlation between the percentage of Scotch-Irish and percentage of population with a disability between the ages 65 and 75 does not imply a direct cause-and-effect relationship. It remains uncertain whether the presence of Scotch-Irish influences an upward or downward trend in the level of percentage of population with a disability between the ages 65 and 75 within an area, or if Scotch-Irish simply ended up residing in those areas with higher or lower levels of percentage of population with a disability between the ages 65 and 75 due to other factors.
Demographics Similar to Scotch-Irish by Disability Age 65 to 74
In terms of disability age 65 to 74, the demographic groups most similar to Scotch-Irish are German Russian (24.4%, a difference of 0.040%), West Indian (24.5%, a difference of 0.14%), Panamanian (24.4%, a difference of 0.16%), Bahamian (24.4%, a difference of 0.26%), and Immigrants from Ghana (24.5%, a difference of 0.31%).
| Demographics | Rating | Rank | Disability Age 65 to 74 |
| Whites/Caucasians | 6.6 /100 | #228 | Tragic 24.2% |
| Celtics | 6.4 /100 | #229 | Tragic 24.2% |
| Barbadians | 6.0 /100 | #230 | Tragic 24.3% |
| Immigrants from Thailand | 5.2 /100 | #231 | Tragic 24.3% |
| Immigrants from Zaire | 5.0 /100 | #232 | Tragic 24.3% |
| Bahamians | 4.5 /100 | #233 | Tragic 24.4% |
| Panamanians | 4.2 /100 | #234 | Tragic 24.4% |
| Scotch-Irish | 3.8 /100 | #235 | Tragic 24.4% |
| German Russians | 3.7 /100 | #236 | Tragic 24.4% |
| West Indians | 3.4 /100 | #237 | Tragic 24.5% |
| Immigrants from Ghana | 3.0 /100 | #238 | Tragic 24.5% |
| Immigrants from Caribbean | 2.6 /100 | #239 | Tragic 24.6% |
| Spaniards | 2.4 /100 | #240 | Tragic 24.6% |
| Immigrants from Western Africa | 2.3 /100 | #241 | Tragic 24.6% |
| Immigrants from Senegal | 2.2 /100 | #242 | Tragic 24.6% |
Scotch-Irish Disability Age 65 to 74 Correlation Summary
| Measurement | Scotch-Irish Data | Disability Age 65 to 74 Data |
| Minimum | 0.25% | 10.7% |
| Maximum | 100.0% | 100.0% |
| Range | 99.7% | 89.3% |
| Mean | 21.8% | 43.1% |
| Median | 18.7% | 32.3% |
| Interquartile 25% (IQ1) | 9.2% | 25.8% |
| Interquartile 75% (IQ3) | 30.6% | 51.5% |
| Interquartile Range (IQR) | 21.3% | 25.7% |
| Standard Deviation (Sample) | 17.0% | 25.2% |
| Standard Deviation (Population) | 16.9% | 25.0% |
Correlation Details
| Scotch-Irish Percentile | Sample Size | Disability Age 65 to 74 |
[ 0.0% - 0.5% ] 0.25% | 210,195,572 | 25.2% |
[ 0.5% - 1.0% ] 0.72% | 182,778,496 | 24.1% |
[ 1.0% - 1.5% ] 1.21% | 82,516,344 | 23.6% |
[ 1.5% - 2.0% ] 1.72% | 36,376,285 | 23.9% |
[ 2.0% - 2.5% ] 2.21% | 15,839,416 | 24.6% |
[ 2.5% - 3.0% ] 2.73% | 7,817,270 | 25.1% |
[ 3.0% - 3.5% ] 3.23% | 5,100,129 | 25.1% |
[ 3.5% - 4.0% ] 3.75% | 2,437,700 | 25.6% |
[ 4.0% - 4.5% ] 4.25% | 1,256,877 | 26.9% |
[ 4.5% - 5.0% ] 4.76% | 737,348 | 25.5% |
[ 5.0% - 5.5% ] 5.23% | 628,215 | 23.6% |
[ 5.5% - 6.0% ] 5.71% | 317,661 | 29.0% |
[ 6.0% - 6.5% ] 6.29% | 199,491 | 28.6% |
[ 6.5% - 7.0% ] 6.71% | 135,498 | 28.2% |
[ 7.0% - 7.5% ] 7.24% | 110,255 | 30.2% |
[ 7.5% - 8.0% ] 7.79% | 108,943 | 32.4% |
[ 8.0% - 8.5% ] 8.22% | 73,965 | 27.6% |
[ 8.5% - 9.0% ] 8.75% | 57,997 | 24.9% |
[ 9.0% - 9.5% ] 9.23% | 37,536 | 28.5% |
[ 9.5% - 10.0% ] 9.76% | 36,867 | 29.3% |
[ 10.0% - 10.5% ] 10.27% | 37,628 | 29.9% |
[ 10.5% - 11.0% ] 10.70% | 26,378 | 26.9% |
[ 11.0% - 11.5% ] 11.24% | 18,569 | 21.6% |
[ 11.5% - 12.0% ] 11.78% | 16,226 | 30.8% |
[ 12.0% - 12.5% ] 12.24% | 7,869 | 31.3% |
[ 12.5% - 13.0% ] 12.76% | 4,709 | 29.8% |
[ 13.0% - 13.5% ] 13.22% | 18,920 | 36.1% |
[ 13.5% - 14.0% ] 13.70% | 16,841 | 34.8% |
[ 14.0% - 14.5% ] 14.26% | 15,404 | 28.8% |
[ 14.5% - 15.0% ] 14.79% | 2,407 | 54.4% |
[ 15.0% - 15.5% ] 15.17% | 6,210 | 50.3% |
[ 15.5% - 16.0% ] 15.87% | 4,190 | 26.3% |
[ 16.0% - 16.5% ] 16.21% | 10,928 | 31.5% |
[ 16.5% - 17.0% ] 16.81% | 4,776 | 16.4% |
[ 17.0% - 17.5% ] 17.26% | 6,530 | 38.8% |
[ 17.5% - 18.0% ] 17.65% | 8,555 | 25.8% |
[ 18.0% - 18.5% ] 18.28% | 1,805 | 44.4% |
[ 18.5% - 19.0% ] 18.66% | 2,642 | 48.6% |
[ 19.0% - 19.5% ] 19.19% | 1,204 | 36.3% |
[ 19.5% - 20.0% ] 19.73% | 1,171 | 29.1% |
[ 20.0% - 20.5% ] 20.25% | 716 | 41.0% |
[ 20.5% - 21.0% ] 20.72% | 2,375 | 43.8% |
[ 21.0% - 21.5% ] 21.27% | 978 | 51.5% |
[ 21.5% - 22.0% ] 21.68% | 1,033 | 46.9% |
[ 22.5% - 23.0% ] 22.76% | 1,173 | 38.5% |
[ 23.0% - 23.5% ] 23.48% | 903 | 38.1% |
[ 24.0% - 24.5% ] 24.34% | 189 | 14.8% |
[ 24.5% - 25.0% ] 24.86% | 1,766 | 32.2% |
[ 25.5% - 26.0% ] 25.83% | 724 | 70.1% |
[ 26.0% - 26.5% ] 26.17% | 405 | 32.3% |
[ 26.5% - 27.0% ] 26.87% | 67 | 10.7% |
[ 27.0% - 27.5% ] 27.43% | 175 | 91.7% |
[ 27.5% - 28.0% ] 27.93% | 179 | 94.0% |
[ 28.5% - 29.0% ] 28.81% | 354 | 57.0% |
[ 29.5% - 30.0% ] 29.86% | 807 | 42.5% |
[ 30.0% - 30.5% ] 30.25% | 2,139 | 57.9% |
[ 30.5% - 31.0% ] 30.57% | 386 | 51.5% |
[ 31.0% - 31.5% ] 31.25% | 32 | 100.0% |
[ 31.5% - 32.0% ] 31.65% | 79 | 100.0% |
[ 33.0% - 33.5% ] 33.33% | 36 | 44.4% |
[ 34.0% - 34.5% ] 34.22% | 450 | 100.0% |
[ 34.5% - 35.0% ] 34.96% | 123 | 73.0% |
[ 35.5% - 36.0% ] 35.54% | 166 | 11.8% |
[ 36.0% - 36.5% ] 36.40% | 728 | 19.7% |
[ 37.5% - 38.0% ] 37.58% | 157 | 41.2% |
[ 38.0% - 38.5% ] 38.18% | 55 | 100.0% |
[ 38.5% - 39.0% ] 38.61% | 101 | 100.0% |
[ 39.0% - 39.5% ] 39.08% | 87 | 100.0% |
[ 44.0% - 44.5% ] 44.08% | 338 | 58.6% |
[ 50.0% - 50.5% ] 50.00% | 26 | 50.0% |
[ 50.0% - 50.5% ] 50.34% | 149 | 25.6% |
[ 52.5% - 53.0% ] 52.94% | 17 | 60.0% |
[ 53.5% - 54.0% ] 53.51% | 299 | 33.3% |
[ 64.0% - 64.5% ] 64.00% | 175 | 100.0% |
[ 99.5% - 100.0% ] 100.00% | 7 | 100.0% |