Scotch-Irish Disability Age 5 to 17
COMPARE
Scotch-Irish
Select to Compare
Disability Age 5 to 17
Scotch-Irish Disability Age 5 to 17
6.3%
DISABILITY | AGE 5 TO 17
0.0/ 100
METRIC RATING
308th/ 347
METRIC RANK
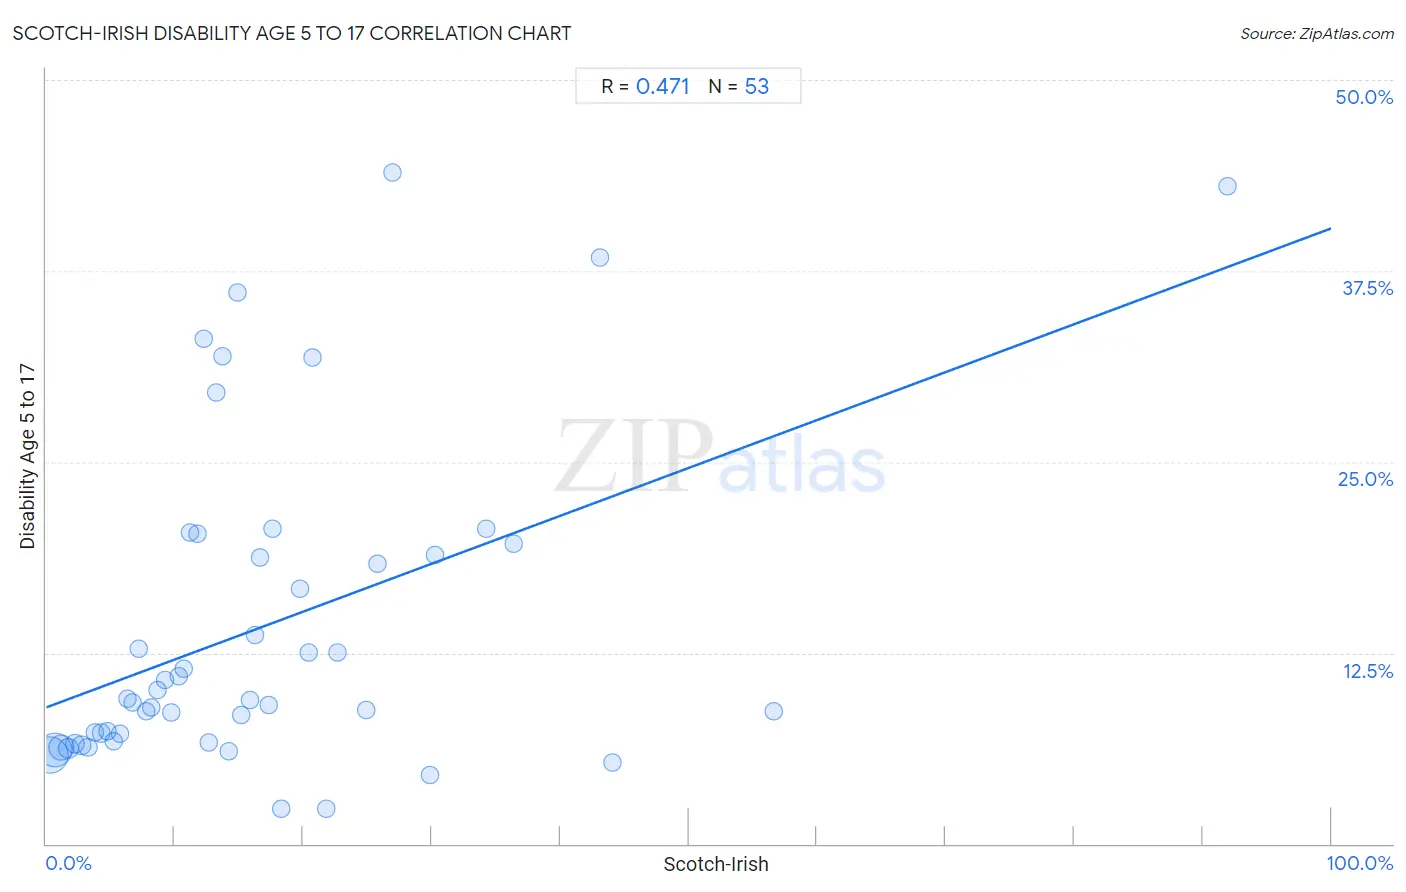
Scotch-Irish Disability Age 5 to 17 Correlation Chart
The statistical analysis conducted on geographies consisting of 537,256,381 people shows a moderate positive correlation between the proportion of Scotch-Irish and percentage of population with a disability between the ages 5 and 17 in the United States with a correlation coefficient (R) of 0.471 and weighted average of 6.3%. On average, for every 1% (one percent) increase in Scotch-Irish within a typical geography, there is an increase of 0.31% in percentage of population with a disability between the ages 5 and 17.
It is essential to understand that the correlation between the percentage of Scotch-Irish and percentage of population with a disability between the ages 5 and 17 does not imply a direct cause-and-effect relationship. It remains uncertain whether the presence of Scotch-Irish influences an upward or downward trend in the level of percentage of population with a disability between the ages 5 and 17 within an area, or if Scotch-Irish simply ended up residing in those areas with higher or lower levels of percentage of population with a disability between the ages 5 and 17 due to other factors.
Demographics Similar to Scotch-Irish by Disability Age 5 to 17
In terms of disability age 5 to 17, the demographic groups most similar to Scotch-Irish are Hmong (6.3%, a difference of 0.020%), Alaskan Athabascan (6.3%, a difference of 0.16%), Immigrants from Dominica (6.3%, a difference of 0.20%), Bahamian (6.3%, a difference of 0.23%), and Bermudan (6.4%, a difference of 0.32%).
| Demographics | Rating | Rank | Disability Age 5 to 17 |
| U.S. Virgin Islanders | 0.0 /100 | #301 | Tragic 6.3% |
| Celtics | 0.0 /100 | #302 | Tragic 6.3% |
| Yakama | 0.0 /100 | #303 | Tragic 6.3% |
| Senegalese | 0.0 /100 | #304 | Tragic 6.3% |
| Natives/Alaskans | 0.0 /100 | #305 | Tragic 6.3% |
| Nonimmigrants | 0.0 /100 | #306 | Tragic 6.3% |
| Bahamians | 0.0 /100 | #307 | Tragic 6.3% |
| Scotch-Irish | 0.0 /100 | #308 | Tragic 6.3% |
| Hmong | 0.0 /100 | #309 | Tragic 6.3% |
| Alaskan Athabascans | 0.0 /100 | #310 | Tragic 6.3% |
| Immigrants from Dominica | 0.0 /100 | #311 | Tragic 6.3% |
| Bermudans | 0.0 /100 | #312 | Tragic 6.4% |
| Apache | 0.0 /100 | #313 | Tragic 6.4% |
| French | 0.0 /100 | #314 | Tragic 6.4% |
| Immigrants from Portugal | 0.0 /100 | #315 | Tragic 6.4% |
Scotch-Irish Disability Age 5 to 17 Correlation Summary
| Measurement | Scotch-Irish Data | Disability Age 5 to 17 Data |
| Minimum | 0.25% | 2.3% |
| Maximum | 91.9% | 43.9% |
| Range | 91.6% | 41.6% |
| Mean | 16.8% | 14.2% |
| Median | 13.2% | 9.4% |
| Interquartile 25% (IQ1) | 6.5% | 6.7% |
| Interquartile 75% (IQ3) | 21.2% | 19.3% |
| Interquartile Range (IQR) | 14.7% | 12.6% |
| Standard Deviation (Sample) | 15.9% | 10.6% |
| Standard Deviation (Population) | 15.8% | 10.5% |
Correlation Details
| Scotch-Irish Percentile | Sample Size | Disability Age 5 to 17 |
[ 0.0% - 0.5% ] 0.25% | 207,675,714 | 5.8% |
[ 0.5% - 1.0% ] 0.72% | 180,514,886 | 6.1% |
[ 1.0% - 1.5% ] 1.21% | 80,900,713 | 6.3% |
[ 1.5% - 2.0% ] 1.72% | 35,248,665 | 6.2% |
[ 2.0% - 2.5% ] 2.21% | 15,222,863 | 6.6% |
[ 2.5% - 3.0% ] 2.73% | 7,432,660 | 6.5% |
[ 3.0% - 3.5% ] 3.23% | 4,716,766 | 6.3% |
[ 3.5% - 4.0% ] 3.75% | 2,229,637 | 7.3% |
[ 4.0% - 4.5% ] 4.25% | 1,112,682 | 7.2% |
[ 4.5% - 5.0% ] 4.76% | 646,857 | 7.3% |
[ 5.0% - 5.5% ] 5.23% | 567,790 | 6.7% |
[ 5.5% - 6.0% ] 5.72% | 278,553 | 7.2% |
[ 6.0% - 6.5% ] 6.31% | 148,844 | 9.5% |
[ 6.5% - 7.0% ] 6.71% | 103,569 | 9.3% |
[ 7.0% - 7.5% ] 7.22% | 81,172 | 12.8% |
[ 7.5% - 8.0% ] 7.80% | 91,024 | 8.7% |
[ 8.0% - 8.5% ] 8.20% | 43,137 | 8.9% |
[ 8.5% - 9.0% ] 8.69% | 30,220 | 10.1% |
[ 9.0% - 9.5% ] 9.25% | 21,849 | 10.7% |
[ 9.5% - 10.0% ] 9.73% | 27,809 | 8.6% |
[ 10.0% - 10.5% ] 10.29% | 32,005 | 11.0% |
[ 10.5% - 11.0% ] 10.69% | 18,326 | 11.5% |
[ 11.0% - 11.5% ] 11.23% | 13,005 | 20.4% |
[ 11.5% - 12.0% ] 11.80% | 8,821 | 20.3% |
[ 12.0% - 12.5% ] 12.23% | 4,171 | 33.1% |
[ 12.5% - 13.0% ] 12.68% | 1,435 | 6.7% |
[ 13.0% - 13.5% ] 13.22% | 16,972 | 29.5% |
[ 13.5% - 14.0% ] 13.71% | 14,459 | 31.9% |
[ 14.0% - 14.5% ] 14.23% | 13,010 | 6.0% |
[ 14.5% - 15.0% ] 14.88% | 766 | 36.1% |
[ 15.0% - 15.5% ] 15.22% | 1,636 | 8.4% |
[ 15.5% - 16.0% ] 15.88% | 4,306 | 9.4% |
[ 16.0% - 16.5% ] 16.23% | 7,018 | 13.6% |
[ 16.5% - 17.0% ] 16.60% | 1,271 | 18.7% |
[ 17.0% - 17.5% ] 17.31% | 2,241 | 9.1% |
[ 17.5% - 18.0% ] 17.64% | 7,705 | 20.7% |
[ 18.0% - 18.5% ] 18.32% | 1,867 | 2.3% |
[ 19.5% - 20.0% ] 19.72% | 1,136 | 16.7% |
[ 20.0% - 20.5% ] 20.45% | 44 | 12.5% |
[ 20.5% - 21.0% ] 20.71% | 1,748 | 31.8% |
[ 21.5% - 22.0% ] 21.76% | 740 | 2.3% |
[ 22.5% - 23.0% ] 22.71% | 960 | 12.5% |
[ 24.5% - 25.0% ] 24.87% | 1,600 | 8.7% |
[ 25.5% - 26.0% ] 25.79% | 570 | 18.3% |
[ 26.5% - 27.0% ] 26.92% | 364 | 43.9% |
[ 29.5% - 30.0% ] 29.91% | 662 | 4.5% |
[ 30.0% - 30.5% ] 30.23% | 1,839 | 18.9% |
[ 34.0% - 34.5% ] 34.22% | 450 | 20.6% |
[ 36.0% - 36.5% ] 36.40% | 728 | 19.6% |
[ 43.0% - 43.5% ] 43.13% | 473 | 38.4% |
[ 44.0% - 44.5% ] 44.08% | 338 | 5.3% |
[ 56.5% - 57.0% ] 56.63% | 83 | 8.7% |
[ 91.5% - 92.0% ] 91.89% | 222 | 43.1% |