Scotch-Irish vs Immigrants from St. Vincent and the Grenadines Married-Couple Family Poverty
COMPARE
Scotch-Irish
Immigrants from St. Vincent and the Grenadines
Married-Couple Family Poverty
Married-Couple Family Poverty Comparison
Scotch-Irish
Immigrants from St. Vincent and the Grenadines
4.5%
MARRIED-COUPLE FAMILY POVERTY
99.1/ 100
METRIC RATING
78th/ 347
METRIC RANK
7.1%
MARRIED-COUPLE FAMILY POVERTY
0.0/ 100
METRIC RATING
313th/ 347
METRIC RANK
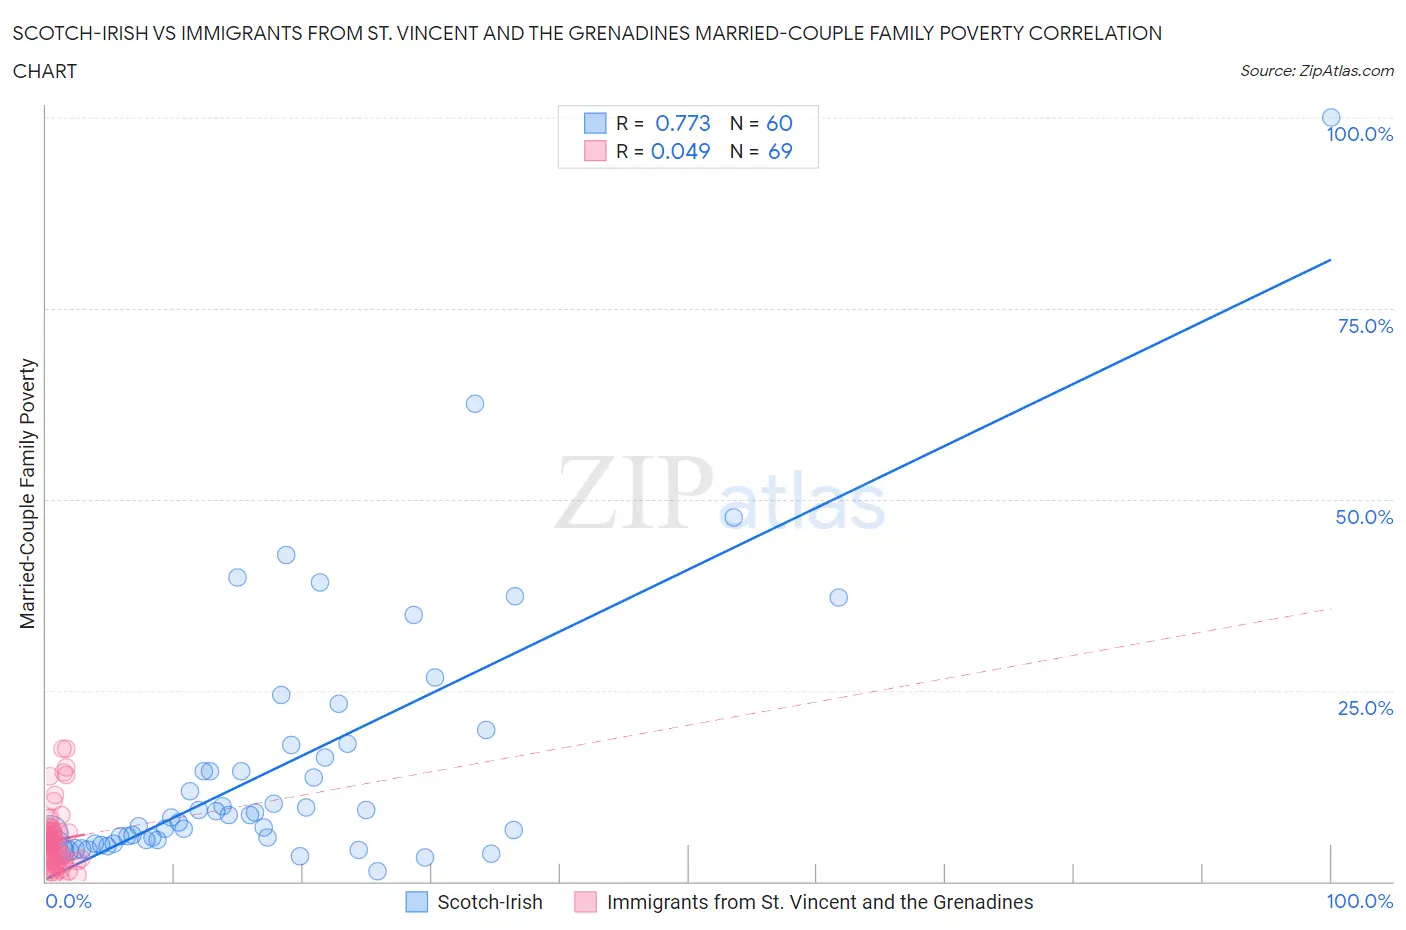
Scotch-Irish vs Immigrants from St. Vincent and the Grenadines Married-Couple Family Poverty Correlation Chart
The statistical analysis conducted on geographies consisting of 536,697,572 people shows a strong positive correlation between the proportion of Scotch-Irish and poverty level among married-couple families in the United States with a correlation coefficient (R) of 0.773 and weighted average of 4.5%. Similarly, the statistical analysis conducted on geographies consisting of 56,063,959 people shows no correlation between the proportion of Immigrants from St. Vincent and the Grenadines and poverty level among married-couple families in the United States with a correlation coefficient (R) of 0.049 and weighted average of 7.1%, a difference of 57.5%.
Married-Couple Family Poverty Correlation Summary
| Measurement | Scotch-Irish | Immigrants from St. Vincent and the Grenadines |
| Minimum | 1.4% | 0.34% |
| Maximum | 100.0% | 17.4% |
| Range | 98.6% | 17.1% |
| Mean | 14.9% | 5.4% |
| Median | 8.5% | 4.9% |
| Interquartile 25% (IQ1) | 5.1% | 2.8% |
| Interquartile 75% (IQ3) | 17.0% | 6.5% |
| Interquartile Range (IQR) | 11.9% | 3.7% |
| Standard Deviation (Sample) | 17.2% | 3.8% |
| Standard Deviation (Population) | 17.1% | 3.8% |
Similar Demographics by Married-Couple Family Poverty
Demographics Similar to Scotch-Irish by Married-Couple Family Poverty
In terms of married-couple family poverty, the demographic groups most similar to Scotch-Irish are Immigrants from Latvia (4.5%, a difference of 0.080%), Immigrants from Iran (4.5%, a difference of 0.23%), Immigrants from South Africa (4.5%, a difference of 0.25%), Icelander (4.5%, a difference of 0.29%), and Cambodian (4.5%, a difference of 0.36%).
| Demographics | Rating | Rank | Married-Couple Family Poverty |
| Immigrants | North America | 99.3 /100 | #71 | Exceptional 4.5% |
| Immigrants | England | 99.3 /100 | #72 | Exceptional 4.5% |
| Ukrainians | 99.2 /100 | #73 | Exceptional 4.5% |
| Immigrants | Austria | 99.2 /100 | #74 | Exceptional 4.5% |
| Cambodians | 99.2 /100 | #75 | Exceptional 4.5% |
| Immigrants | South Africa | 99.1 /100 | #76 | Exceptional 4.5% |
| Immigrants | Latvia | 99.1 /100 | #77 | Exceptional 4.5% |
| Scotch-Irish | 99.1 /100 | #78 | Exceptional 4.5% |
| Immigrants | Iran | 99.0 /100 | #79 | Exceptional 4.5% |
| Icelanders | 99.0 /100 | #80 | Exceptional 4.5% |
| Immigrants | Greece | 98.9 /100 | #81 | Exceptional 4.5% |
| Canadians | 98.8 /100 | #82 | Exceptional 4.5% |
| Immigrants | Denmark | 98.8 /100 | #83 | Exceptional 4.6% |
| Immigrants | Croatia | 98.7 /100 | #84 | Exceptional 4.6% |
| South Africans | 98.7 /100 | #85 | Exceptional 4.6% |
Demographics Similar to Immigrants from St. Vincent and the Grenadines by Married-Couple Family Poverty
In terms of married-couple family poverty, the demographic groups most similar to Immigrants from St. Vincent and the Grenadines are Immigrants from Dominica (7.1%, a difference of 0.11%), Immigrants from Armenia (7.1%, a difference of 0.11%), Immigrants from Nicaragua (7.1%, a difference of 0.17%), Hopi (7.1%, a difference of 0.19%), and British West Indian (7.1%, a difference of 0.30%).
| Demographics | Rating | Rank | Married-Couple Family Poverty |
| Immigrants | Haiti | 0.0 /100 | #306 | Tragic 7.0% |
| Guatemalans | 0.0 /100 | #307 | Tragic 7.0% |
| Spanish American Indians | 0.0 /100 | #308 | Tragic 7.1% |
| Hopi | 0.0 /100 | #309 | Tragic 7.1% |
| Immigrants | Nicaragua | 0.0 /100 | #310 | Tragic 7.1% |
| Immigrants | Dominica | 0.0 /100 | #311 | Tragic 7.1% |
| Immigrants | Armenia | 0.0 /100 | #312 | Tragic 7.1% |
| Immigrants | St. Vincent and the Grenadines | 0.0 /100 | #313 | Tragic 7.1% |
| British West Indians | 0.0 /100 | #314 | Tragic 7.1% |
| Inupiat | 0.0 /100 | #315 | Tragic 7.1% |
| Hondurans | 0.0 /100 | #316 | Tragic 7.2% |
| Mexicans | 0.0 /100 | #317 | Tragic 7.2% |
| Immigrants | Guatemala | 0.0 /100 | #318 | Tragic 7.2% |
| Immigrants | Latin America | 0.0 /100 | #319 | Tragic 7.2% |
| Immigrants | Grenada | 0.0 /100 | #320 | Tragic 7.3% |