Scotch-Irish Family Poverty
COMPARE
Scotch-Irish
Select to Compare
Family Poverty
Scotch-Irish Family Poverty
8.6%
POVERTY | FAMILIES
82.2/ 100
METRIC RATING
148th/ 347
METRIC RANK
Scotch-Irish Family Poverty Correlation Chart
The statistical analysis conducted on geographies consisting of 545,166,810 people shows a strong positive correlation between the proportion of Scotch-Irish and poverty level among families in the United States with a correlation coefficient (R) of 0.785 and weighted average of 8.6%. On average, for every 1% (one percent) increase in Scotch-Irish within a typical geography, there is an increase of 0.76% in poverty level among families.
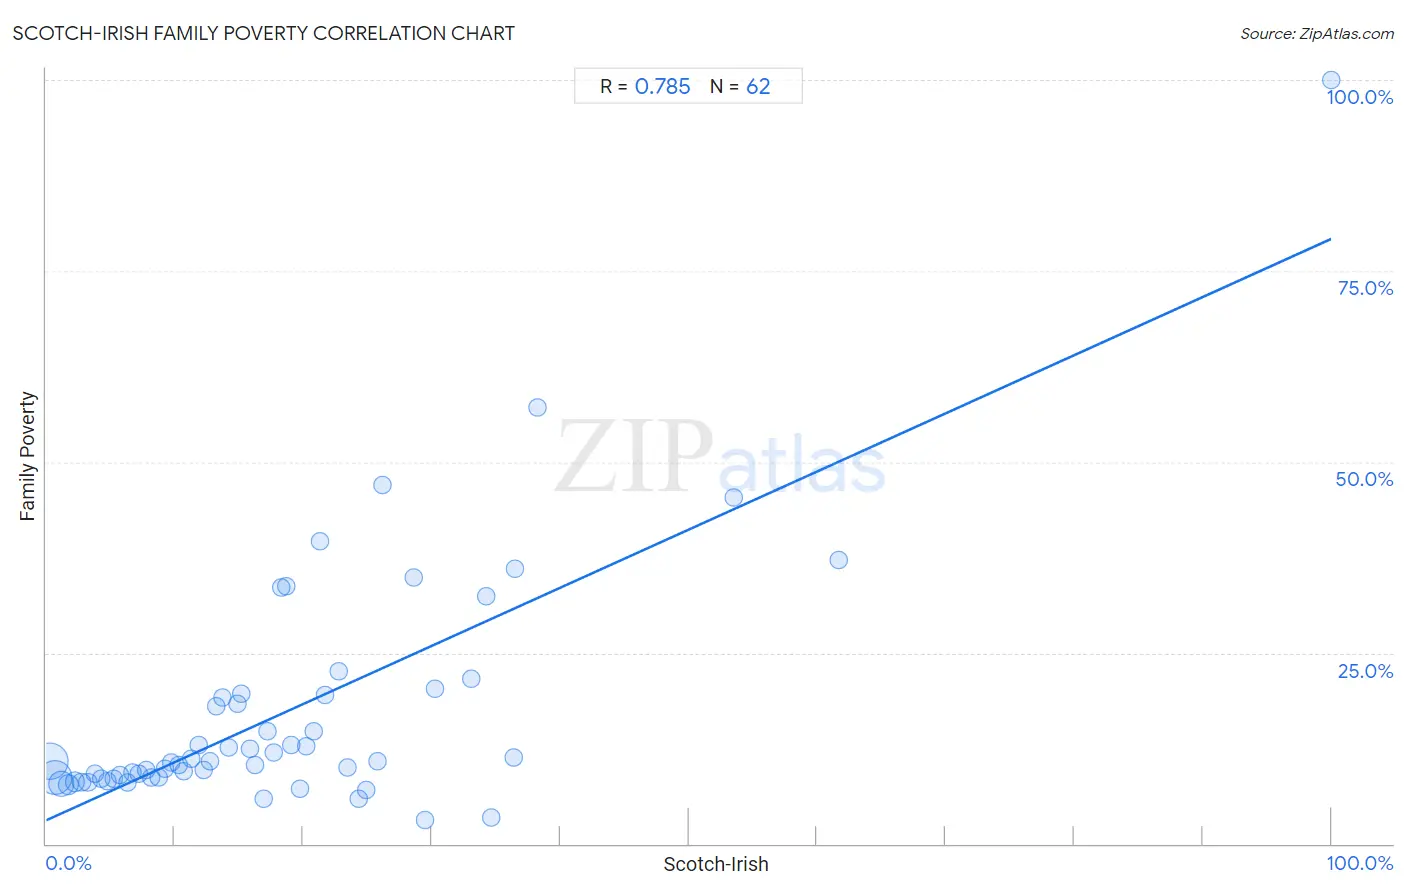
It is essential to understand that the correlation between the percentage of Scotch-Irish and poverty level among families does not imply a direct cause-and-effect relationship. It remains uncertain whether the presence of Scotch-Irish influences an upward or downward trend in the level of poverty level among families within an area, or if Scotch-Irish simply ended up residing in those areas with higher or lower levels of poverty level among families due to other factors.
Demographics Similar to Scotch-Irish by Family Poverty
In terms of family poverty, the demographic groups most similar to Scotch-Irish are Immigrants from Jordan (8.5%, a difference of 0.21%), Immigrants from Belarus (8.5%, a difference of 0.24%), Immigrants from South Eastern Asia (8.5%, a difference of 0.25%), Albanian (8.5%, a difference of 0.27%), and Immigrants from Germany (8.5%, a difference of 0.29%).
| Demographics | Rating | Rank | Family Poverty |
| Immigrants from Ukraine | 83.9 /100 | #141 | Excellent 8.5% |
| Yugoslavians | 83.5 /100 | #142 | Excellent 8.5% |
| Immigrants from Germany | 83.3 /100 | #143 | Excellent 8.5% |
| Albanians | 83.3 /100 | #144 | Excellent 8.5% |
| Immigrants from South Eastern Asia | 83.2 /100 | #145 | Excellent 8.5% |
| Immigrants from Belarus | 83.2 /100 | #146 | Excellent 8.5% |
| Immigrants from Jordan | 83.0 /100 | #147 | Excellent 8.5% |
| Scotch-Irish | 82.2 /100 | #148 | Excellent 8.6% |
| Mongolians | 80.4 /100 | #149 | Excellent 8.6% |
| Syrians | 80.3 /100 | #150 | Excellent 8.6% |
| Brazilians | 80.1 /100 | #151 | Excellent 8.6% |
| Samoans | 79.8 /100 | #152 | Good 8.6% |
| Immigrants from Spain | 79.1 /100 | #153 | Good 8.6% |
| Immigrants from Vietnam | 75.4 /100 | #154 | Good 8.7% |
| Immigrants from Kuwait | 73.6 /100 | #155 | Good 8.7% |
Scotch-Irish Family Poverty Correlation Summary
| Measurement | Scotch-Irish Data | Family Poverty Data |
| Minimum | 0.25% | 3.0% |
| Maximum | 100.0% | 100.0% |
| Range | 99.7% | 97.0% |
| Mean | 18.5% | 17.2% |
| Median | 15.5% | 10.8% |
| Interquartile 25% (IQ1) | 7.8% | 8.6% |
| Interquartile 75% (IQ3) | 24.3% | 19.4% |
| Interquartile Range (IQR) | 16.5% | 10.8% |
| Standard Deviation (Sample) | 16.4% | 15.9% |
| Standard Deviation (Population) | 16.2% | 15.7% |
Correlation Details
| Scotch-Irish Percentile | Sample Size | Family Poverty |
[ 0.0% - 0.5% ] 0.25% | 209,778,200 | 10.9% |
[ 0.5% - 1.0% ] 0.72% | 182,439,758 | 8.7% |
[ 1.0% - 1.5% ] 1.21% | 82,191,904 | 7.8% |
[ 1.5% - 2.0% ] 1.72% | 36,123,843 | 7.7% |
[ 2.0% - 2.5% ] 2.21% | 15,705,118 | 8.1% |
[ 2.5% - 3.0% ] 2.73% | 7,736,248 | 8.1% |
[ 3.0% - 3.5% ] 3.23% | 5,015,617 | 8.1% |
[ 3.5% - 4.0% ] 3.75% | 2,390,581 | 9.2% |
[ 4.0% - 4.5% ] 4.25% | 1,243,599 | 8.5% |
[ 4.5% - 5.0% ] 4.76% | 702,886 | 8.1% |
[ 5.0% - 5.5% ] 5.23% | 613,708 | 8.5% |
[ 5.5% - 6.0% ] 5.71% | 305,150 | 9.1% |
[ 6.0% - 6.5% ] 6.29% | 190,292 | 8.0% |
[ 6.5% - 7.0% ] 6.71% | 126,527 | 9.4% |
[ 7.0% - 7.5% ] 7.23% | 105,415 | 9.2% |
[ 7.5% - 8.0% ] 7.79% | 102,401 | 9.7% |
[ 8.0% - 8.5% ] 8.22% | 71,584 | 8.6% |
[ 8.5% - 9.0% ] 8.75% | 57,882 | 8.7% |
[ 9.0% - 9.5% ] 9.23% | 35,344 | 9.8% |
[ 9.5% - 10.0% ] 9.76% | 34,707 | 10.6% |
[ 10.0% - 10.5% ] 10.27% | 35,516 | 10.3% |
[ 10.5% - 11.0% ] 10.68% | 23,087 | 9.4% |
[ 11.0% - 11.5% ] 11.24% | 12,996 | 11.1% |
[ 11.5% - 12.0% ] 11.86% | 11,741 | 12.8% |
[ 12.0% - 12.5% ] 12.23% | 4,741 | 9.7% |
[ 12.5% - 13.0% ] 12.75% | 3,199 | 10.7% |
[ 13.0% - 13.5% ] 13.22% | 17,785 | 18.1% |
[ 13.5% - 14.0% ] 13.71% | 13,706 | 19.2% |
[ 14.0% - 14.5% ] 14.24% | 14,252 | 12.7% |
[ 14.5% - 15.0% ] 14.84% | 2,365 | 18.3% |
[ 15.0% - 15.5% ] 15.19% | 4,985 | 19.6% |
[ 15.5% - 16.0% ] 15.86% | 4,786 | 12.4% |
[ 16.0% - 16.5% ] 16.24% | 9,194 | 10.3% |
[ 16.5% - 17.0% ] 16.89% | 3,505 | 6.0% |
[ 17.0% - 17.5% ] 17.25% | 5,781 | 14.7% |
[ 17.5% - 18.0% ] 17.66% | 7,790 | 12.0% |
[ 18.0% - 18.5% ] 18.28% | 1,805 | 33.6% |
[ 18.5% - 19.0% ] 18.65% | 2,917 | 33.7% |
[ 19.0% - 19.5% ] 19.11% | 874 | 13.0% |
[ 19.5% - 20.0% ] 19.71% | 974 | 7.2% |
[ 20.0% - 20.5% ] 20.24% | 499 | 12.8% |
[ 20.5% - 21.0% ] 20.79% | 1,539 | 14.7% |
[ 21.0% - 21.5% ] 21.28% | 1,062 | 39.6% |
[ 21.5% - 22.0% ] 21.73% | 939 | 19.4% |
[ 22.5% - 23.0% ] 22.74% | 1,060 | 22.5% |
[ 23.0% - 23.5% ] 23.48% | 903 | 10.1% |
[ 24.0% - 24.5% ] 24.34% | 189 | 5.9% |
[ 24.5% - 25.0% ] 24.89% | 1,571 | 7.0% |
[ 25.5% - 26.0% ] 25.79% | 570 | 10.9% |
[ 26.0% - 26.5% ] 26.19% | 168 | 47.0% |
[ 28.5% - 29.0% ] 28.57% | 112 | 34.9% |
[ 29.0% - 29.5% ] 29.49% | 217 | 3.0% |
[ 30.0% - 30.5% ] 30.25% | 2,724 | 20.2% |
[ 33.0% - 33.5% ] 33.12% | 157 | 21.7% |
[ 34.0% - 34.5% ] 34.22% | 450 | 32.4% |
[ 34.5% - 35.0% ] 34.59% | 185 | 3.5% |
[ 36.0% - 36.5% ] 36.40% | 728 | 11.2% |
[ 36.5% - 37.0% ] 36.51% | 556 | 36.0% |
[ 38.0% - 38.5% ] 38.18% | 55 | 57.1% |
[ 53.5% - 54.0% ] 53.51% | 299 | 45.3% |
[ 61.5% - 62.0% ] 61.67% | 60 | 37.1% |
[ 99.5% - 100.0% ] 100.00% | 4 | 100.0% |