Scotch-Irish Currently Married
COMPARE
Scotch-Irish
Select to Compare
Currently Married
Scotch-Irish Currently Married
48.7%
CURRENTLY MARRIED
99.3/ 100
METRIC RATING
43rd/ 347
METRIC RANK
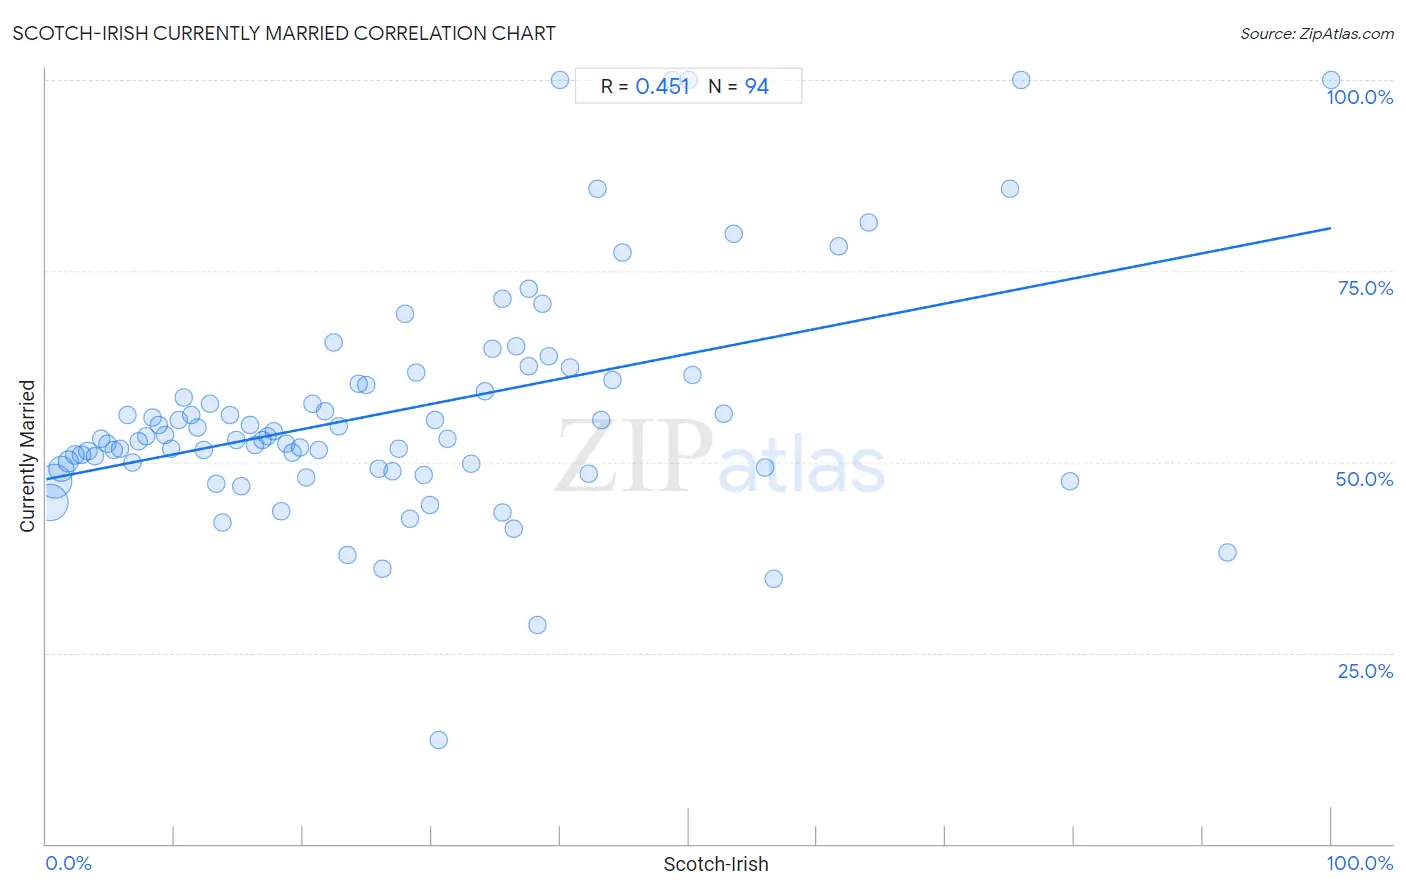
Scotch-Irish Currently Married Correlation Chart
The statistical analysis conducted on geographies consisting of 548,698,308 people shows a moderate positive correlation between the proportion of Scotch-Irish and percentage of population currently married in the United States with a correlation coefficient (R) of 0.451 and weighted average of 48.7%. On average, for every 1% (one percent) increase in Scotch-Irish within a typical geography, there is an increase of 0.33% in percentage of population currently married.
It is essential to understand that the correlation between the percentage of Scotch-Irish and percentage of population currently married does not imply a direct cause-and-effect relationship. It remains uncertain whether the presence of Scotch-Irish influences an upward or downward trend in the level of percentage of population currently married within an area, or if Scotch-Irish simply ended up residing in those areas with higher or lower levels of percentage of population currently married due to other factors.
Demographics Similar to Scotch-Irish by Currently Married
In terms of currently married, the demographic groups most similar to Scotch-Irish are Finnish (48.8%, a difference of 0.010%), Immigrants from North America (48.7%, a difference of 0.030%), Greek (48.8%, a difference of 0.050%), Belgian (48.7%, a difference of 0.060%), and Immigrants from Canada (48.8%, a difference of 0.070%).
| Demographics | Rating | Rank | Currently Married |
| Italians | 99.4 /100 | #36 | Exceptional 48.8% |
| Hungarians | 99.4 /100 | #37 | Exceptional 48.8% |
| Czechoslovakians | 99.4 /100 | #38 | Exceptional 48.8% |
| British | 99.4 /100 | #39 | Exceptional 48.8% |
| Immigrants from Canada | 99.4 /100 | #40 | Exceptional 48.8% |
| Greeks | 99.3 /100 | #41 | Exceptional 48.8% |
| Finns | 99.3 /100 | #42 | Exceptional 48.8% |
| Scotch-Irish | 99.3 /100 | #43 | Exceptional 48.7% |
| Immigrants from North America | 99.3 /100 | #44 | Exceptional 48.7% |
| Belgians | 99.3 /100 | #45 | Exceptional 48.7% |
| Immigrants from Iran | 99.2 /100 | #46 | Exceptional 48.7% |
| Northern Europeans | 99.2 /100 | #47 | Exceptional 48.7% |
| Austrians | 99.2 /100 | #48 | Exceptional 48.7% |
| Bhutanese | 99.1 /100 | #49 | Exceptional 48.6% |
| Iranians | 99.0 /100 | #50 | Exceptional 48.6% |
Scotch-Irish Currently Married Correlation Summary
| Measurement | Scotch-Irish Data | Currently Married Data |
| Minimum | 0.25% | 13.6% |
| Maximum | 100.0% | 100.0% |
| Range | 99.7% | 86.4% |
| Mean | 27.6% | 56.8% |
| Median | 23.9% | 53.2% |
| Interquartile 25% (IQ1) | 11.8% | 49.2% |
| Interquartile 75% (IQ3) | 38.2% | 60.7% |
| Interquartile Range (IQR) | 26.4% | 11.5% |
| Standard Deviation (Sample) | 20.8% | 15.2% |
| Standard Deviation (Population) | 20.7% | 15.1% |
Correlation Details
| Scotch-Irish Percentile | Sample Size | Currently Married |
[ 0.0% - 0.5% ] 0.25% | 210,773,290 | 44.6% |
[ 0.5% - 1.0% ] 0.72% | 183,287,443 | 47.4% |
[ 1.0% - 1.5% ] 1.21% | 82,713,491 | 49.0% |
[ 1.5% - 2.0% ] 1.72% | 36,469,834 | 50.1% |
[ 2.0% - 2.5% ] 2.21% | 15,919,973 | 50.9% |
[ 2.5% - 3.0% ] 2.73% | 7,861,873 | 51.0% |
[ 3.0% - 3.5% ] 3.23% | 5,137,872 | 51.4% |
[ 3.5% - 4.0% ] 3.75% | 2,461,740 | 50.8% |
[ 4.0% - 4.5% ] 4.25% | 1,279,775 | 53.0% |
[ 4.5% - 5.0% ] 4.76% | 753,049 | 52.4% |
[ 5.0% - 5.5% ] 5.23% | 645,028 | 51.6% |
[ 5.5% - 6.0% ] 5.71% | 328,314 | 51.6% |
[ 6.0% - 6.5% ] 6.29% | 211,698 | 56.1% |
[ 6.5% - 7.0% ] 6.71% | 140,328 | 49.9% |
[ 7.0% - 7.5% ] 7.24% | 123,134 | 52.7% |
[ 7.5% - 8.0% ] 7.78% | 113,462 | 53.3% |
[ 8.0% - 8.5% ] 8.22% | 77,398 | 55.8% |
[ 8.5% - 9.0% ] 8.75% | 61,743 | 54.8% |
[ 9.0% - 9.5% ] 9.25% | 40,511 | 53.6% |
[ 9.5% - 10.0% ] 9.76% | 39,379 | 51.8% |
[ 10.0% - 10.5% ] 10.27% | 39,547 | 55.5% |
[ 10.5% - 11.0% ] 10.70% | 27,649 | 58.4% |
[ 11.0% - 11.5% ] 11.24% | 20,175 | 56.2% |
[ 11.5% - 12.0% ] 11.80% | 18,678 | 54.5% |
[ 12.0% - 12.5% ] 12.23% | 9,506 | 51.5% |
[ 12.5% - 13.0% ] 12.75% | 5,191 | 57.7% |
[ 13.0% - 13.5% ] 13.22% | 19,170 | 47.1% |
[ 13.5% - 14.0% ] 13.70% | 16,987 | 42.1% |
[ 14.0% - 14.5% ] 14.26% | 16,611 | 56.1% |
[ 14.5% - 15.0% ] 14.82% | 3,732 | 52.9% |
[ 15.0% - 15.5% ] 15.17% | 6,541 | 46.8% |
[ 15.5% - 16.0% ] 15.86% | 5,689 | 54.9% |
[ 16.0% - 16.5% ] 16.20% | 11,312 | 52.2% |
[ 16.5% - 17.0% ] 16.81% | 5,163 | 52.9% |
[ 17.0% - 17.5% ] 17.25% | 8,190 | 53.3% |
[ 17.5% - 18.0% ] 17.66% | 9,659 | 54.1% |
[ 18.0% - 18.5% ] 18.30% | 2,300 | 43.5% |
[ 18.5% - 19.0% ] 18.65% | 3,018 | 52.4% |
[ 19.0% - 19.5% ] 19.19% | 2,293 | 51.2% |
[ 19.5% - 20.0% ] 19.70% | 1,284 | 51.9% |
[ 20.0% - 20.5% ] 20.26% | 770 | 48.0% |
[ 20.5% - 21.0% ] 20.75% | 3,046 | 57.6% |
[ 21.0% - 21.5% ] 21.24% | 1,356 | 51.6% |
[ 21.5% - 22.0% ] 21.70% | 1,972 | 56.6% |
[ 22.0% - 22.5% ] 22.39% | 67 | 65.7% |
[ 22.5% - 23.0% ] 22.77% | 1,458 | 54.7% |
[ 23.0% - 23.5% ] 23.41% | 1,072 | 37.8% |
[ 24.0% - 24.5% ] 24.31% | 288 | 60.3% |
[ 24.5% - 25.0% ] 24.86% | 1,943 | 60.1% |
[ 25.5% - 26.0% ] 25.83% | 724 | 49.1% |
[ 26.0% - 26.5% ] 26.17% | 405 | 36.1% |
[ 26.5% - 27.0% ] 26.91% | 431 | 48.7% |
[ 27.0% - 27.5% ] 27.42% | 383 | 51.7% |
[ 27.5% - 28.0% ] 27.93% | 179 | 69.4% |
[ 28.0% - 28.5% ] 28.26% | 92 | 42.6% |
[ 28.5% - 29.0% ] 28.76% | 466 | 61.7% |
[ 29.0% - 29.5% ] 29.40% | 500 | 48.4% |
[ 29.5% - 30.0% ] 29.83% | 905 | 44.4% |
[ 30.0% - 30.5% ] 30.25% | 3,223 | 55.4% |
[ 30.5% - 31.0% ] 30.57% | 386 | 13.6% |
[ 31.0% - 31.5% ] 31.25% | 32 | 53.1% |
[ 33.0% - 33.5% ] 33.12% | 157 | 49.7% |
[ 34.0% - 34.5% ] 34.17% | 1,080 | 59.3% |
[ 34.5% - 35.0% ] 34.73% | 357 | 64.8% |
[ 35.0% - 35.5% ] 35.46% | 141 | 71.3% |
[ 35.5% - 36.0% ] 35.54% | 166 | 43.4% |
[ 36.0% - 36.5% ] 36.40% | 728 | 41.3% |
[ 36.5% - 37.0% ] 36.53% | 605 | 65.2% |
[ 37.0% - 37.5% ] 37.50% | 72 | 62.5% |
[ 37.5% - 38.0% ] 37.58% | 157 | 72.7% |
[ 38.0% - 38.5% ] 38.18% | 55 | 28.6% |
[ 38.5% - 39.0% ] 38.60% | 171 | 70.8% |
[ 39.0% - 39.5% ] 39.08% | 87 | 63.8% |
[ 40.0% - 40.5% ] 40.00% | 5 | 100.0% |
[ 40.5% - 41.0% ] 40.78% | 103 | 62.3% |
[ 42.0% - 42.5% ] 42.19% | 64 | 48.4% |
[ 42.5% - 43.0% ] 42.86% | 35 | 85.7% |
[ 43.0% - 43.5% ] 43.17% | 556 | 55.5% |
[ 44.0% - 44.5% ] 44.08% | 338 | 60.7% |
[ 44.5% - 45.0% ] 44.84% | 339 | 77.4% |
[ 48.5% - 49.0% ] 48.72% | 78 | 100.0% |
[ 50.0% - 50.5% ] 50.00% | 72 | 100.0% |
[ 50.0% - 50.5% ] 50.34% | 149 | 61.3% |
[ 52.5% - 53.0% ] 52.73% | 55 | 56.3% |
[ 53.5% - 54.0% ] 53.51% | 299 | 79.8% |
[ 55.5% - 56.0% ] 55.93% | 59 | 49.2% |
[ 56.5% - 57.0% ] 56.63% | 83 | 34.7% |
[ 61.5% - 62.0% ] 61.67% | 60 | 78.3% |
[ 64.0% - 64.5% ] 64.00% | 175 | 81.3% |
[ 75.0% - 75.5% ] 75.00% | 20 | 85.7% |
[ 75.5% - 76.0% ] 75.86% | 29 | 100.0% |
[ 79.5% - 80.0% ] 79.66% | 59 | 47.5% |
[ 91.5% - 92.0% ] 91.89% | 222 | 38.2% |
[ 99.5% - 100.0% ] 100.00% | 4 | 100.0% |