Scotch-Irish Disability Age Over 75
COMPARE
Scotch-Irish
Select to Compare
Disability Age Over 75
Scotch-Irish Disability Age Over 75
47.3%
DISABILITY | AGE OVER 75
52.5/ 100
METRIC RATING
172nd/ 347
METRIC RANK
Scotch-Irish Disability Age Over 75 Correlation Chart
The statistical analysis conducted on geographies consisting of 547,171,445 people shows a moderate positive correlation between the proportion of Scotch-Irish and percentage of population with a disability over the age of 75 in the United States with a correlation coefficient (R) of 0.413 and weighted average of 47.3%. On average, for every 1% (one percent) increase in Scotch-Irish within a typical geography, there is an increase of 0.57% in percentage of population with a disability over the age of 75.
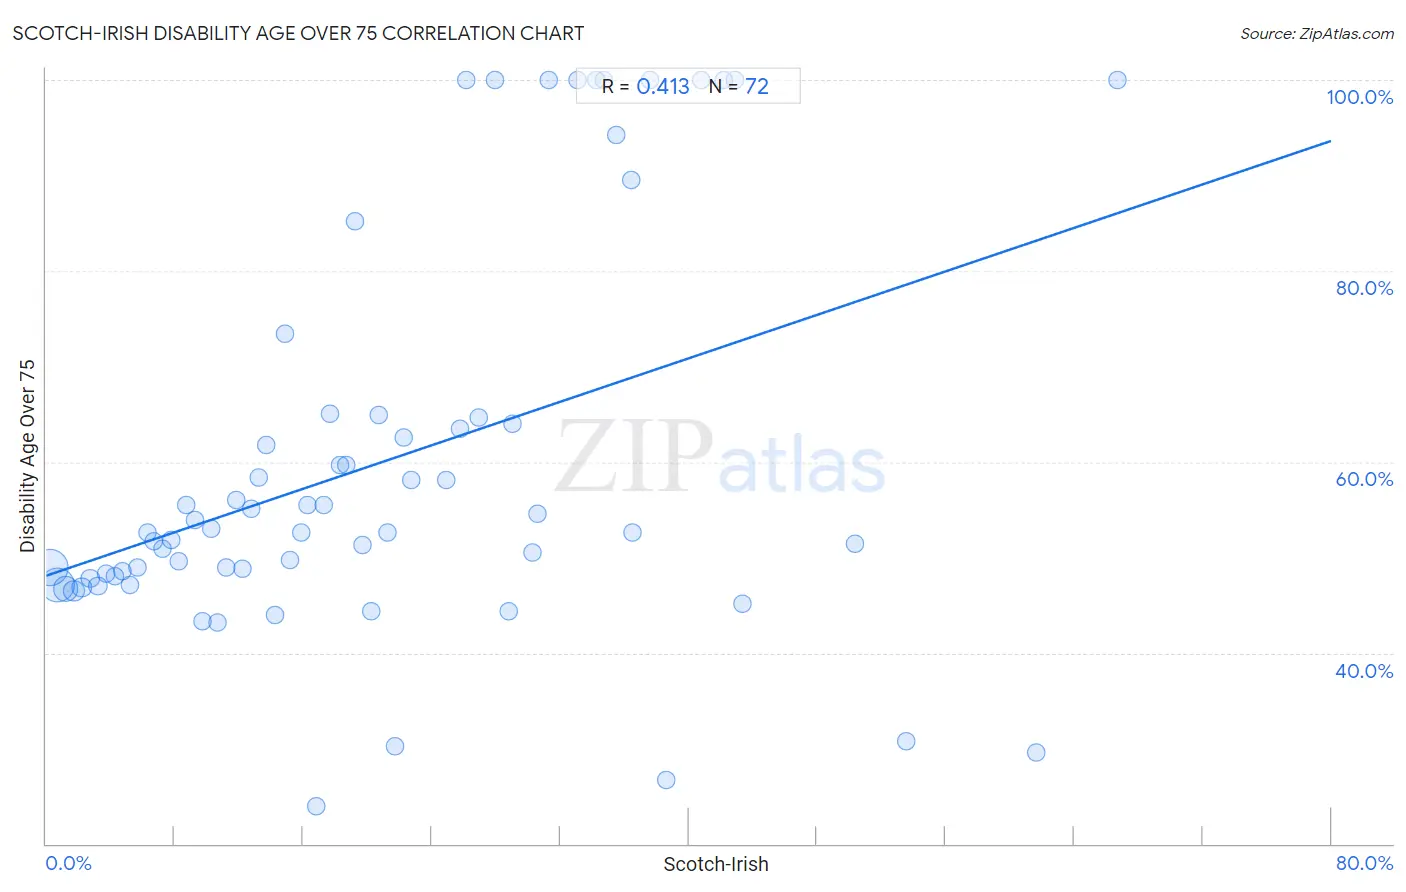
It is essential to understand that the correlation between the percentage of Scotch-Irish and percentage of population with a disability over the age of 75 does not imply a direct cause-and-effect relationship. It remains uncertain whether the presence of Scotch-Irish influences an upward or downward trend in the level of percentage of population with a disability over the age of 75 within an area, or if Scotch-Irish simply ended up residing in those areas with higher or lower levels of percentage of population with a disability over the age of 75 due to other factors.
Demographics Similar to Scotch-Irish by Disability Age Over 75
In terms of disability age over 75, the demographic groups most similar to Scotch-Irish are Alsatian (47.3%, a difference of 0.010%), Immigrants from Africa (47.3%, a difference of 0.030%), White/Caucasian (47.3%, a difference of 0.060%), Immigrants from Haiti (47.3%, a difference of 0.060%), and German Russian (47.3%, a difference of 0.080%).
| Demographics | Rating | Rank | Disability Age Over 75 |
| Immigrants from Zimbabwe | 64.4 /100 | #165 | Good 47.2% |
| Immigrants from Sierra Leone | 64.4 /100 | #166 | Good 47.2% |
| Moroccans | 62.9 /100 | #167 | Good 47.2% |
| Kenyans | 58.8 /100 | #168 | Average 47.2% |
| Celtics | 58.7 /100 | #169 | Average 47.2% |
| German Russians | 56.2 /100 | #170 | Average 47.3% |
| Immigrants from Africa | 53.6 /100 | #171 | Average 47.3% |
| Scotch-Irish | 52.5 /100 | #172 | Average 47.3% |
| Alsatians | 51.9 /100 | #173 | Average 47.3% |
| Whites/Caucasians | 50.0 /100 | #174 | Average 47.3% |
| Immigrants from Haiti | 49.7 /100 | #175 | Average 47.3% |
| Ecuadorians | 46.7 /100 | #176 | Average 47.4% |
| Haitians | 44.6 /100 | #177 | Average 47.4% |
| Cubans | 42.1 /100 | #178 | Average 47.4% |
| Sierra Leoneans | 41.7 /100 | #179 | Average 47.4% |
Scotch-Irish Disability Age Over 75 Correlation Summary
| Measurement | Scotch-Irish Data | Disability Age Over 75 Data |
| Minimum | 0.25% | 24.0% |
| Maximum | 66.7% | 100.0% |
| Range | 66.4% | 76.0% |
| Mean | 20.8% | 59.9% |
| Median | 18.0% | 52.7% |
| Interquartile 25% (IQ1) | 9.0% | 47.9% |
| Interquartile 75% (IQ3) | 30.4% | 64.4% |
| Interquartile Range (IQR) | 21.4% | 16.4% |
| Standard Deviation (Sample) | 15.0% | 20.7% |
| Standard Deviation (Population) | 14.9% | 20.5% |
Correlation Details
| Scotch-Irish Percentile | Sample Size | Disability Age Over 75 |
[ 0.0% - 0.5% ] 0.25% | 210,216,476 | 49.0% |
[ 0.5% - 1.0% ] 0.72% | 182,895,034 | 47.1% |
[ 1.0% - 1.5% ] 1.21% | 82,503,891 | 46.7% |
[ 1.5% - 2.0% ] 1.72% | 36,371,924 | 46.5% |
[ 2.0% - 2.5% ] 2.21% | 15,854,867 | 46.8% |
[ 2.5% - 3.0% ] 2.73% | 7,828,221 | 47.8% |
[ 3.0% - 3.5% ] 3.23% | 5,111,188 | 47.0% |
[ 3.5% - 4.0% ] 3.75% | 2,439,961 | 48.3% |
[ 4.0% - 4.5% ] 4.25% | 1,256,297 | 48.1% |
[ 4.5% - 5.0% ] 4.76% | 740,877 | 48.5% |
[ 5.0% - 5.5% ] 5.23% | 638,660 | 47.1% |
[ 5.5% - 6.0% ] 5.71% | 318,348 | 48.9% |
[ 6.0% - 6.5% ] 6.29% | 200,484 | 52.7% |
[ 6.5% - 7.0% ] 6.71% | 134,913 | 51.6% |
[ 7.0% - 7.5% ] 7.23% | 116,440 | 50.9% |
[ 7.5% - 8.0% ] 7.78% | 110,768 | 51.8% |
[ 8.0% - 8.5% ] 8.22% | 74,838 | 49.6% |
[ 8.5% - 9.0% ] 8.75% | 60,336 | 55.5% |
[ 9.0% - 9.5% ] 9.24% | 35,303 | 53.9% |
[ 9.5% - 10.0% ] 9.75% | 37,252 | 43.3% |
[ 10.0% - 10.5% ] 10.28% | 35,277 | 53.0% |
[ 10.5% - 11.0% ] 10.69% | 25,893 | 43.2% |
[ 11.0% - 11.5% ] 11.24% | 19,699 | 48.9% |
[ 11.5% - 12.0% ] 11.80% | 16,132 | 56.0% |
[ 12.0% - 12.5% ] 12.23% | 8,672 | 48.8% |
[ 12.5% - 13.0% ] 12.75% | 4,070 | 55.1% |
[ 13.0% - 13.5% ] 13.22% | 18,967 | 58.4% |
[ 13.5% - 14.0% ] 13.70% | 15,596 | 61.8% |
[ 14.0% - 14.5% ] 14.26% | 15,583 | 44.0% |
[ 14.5% - 15.0% ] 14.83% | 2,563 | 73.4% |
[ 15.0% - 15.5% ] 15.16% | 5,107 | 49.8% |
[ 15.5% - 16.0% ] 15.86% | 4,444 | 52.6% |
[ 16.0% - 16.5% ] 16.23% | 9,743 | 55.5% |
[ 16.5% - 17.0% ] 16.81% | 5,104 | 24.0% |
[ 17.0% - 17.5% ] 17.26% | 6,175 | 55.4% |
[ 17.5% - 18.0% ] 17.67% | 9,312 | 65.0% |
[ 18.0% - 18.5% ] 18.31% | 1,764 | 59.7% |
[ 18.5% - 19.0% ] 18.66% | 2,695 | 59.7% |
[ 19.0% - 19.5% ] 19.23% | 442 | 85.1% |
[ 19.5% - 20.0% ] 19.73% | 1,171 | 51.3% |
[ 20.0% - 20.5% ] 20.23% | 682 | 44.4% |
[ 20.5% - 21.0% ] 20.73% | 2,750 | 64.9% |
[ 21.0% - 21.5% ] 21.25% | 833 | 52.6% |
[ 21.5% - 22.0% ] 21.72% | 1,395 | 30.2% |
[ 22.0% - 22.5% ] 22.22% | 18 | 62.5% |
[ 22.5% - 23.0% ] 22.74% | 1,073 | 58.1% |
[ 24.5% - 25.0% ] 24.87% | 1,600 | 58.1% |
[ 25.5% - 26.0% ] 25.79% | 570 | 63.5% |
[ 26.0% - 26.5% ] 26.17% | 405 | 100.0% |
[ 26.5% - 27.0% ] 26.92% | 364 | 64.7% |
[ 27.5% - 28.0% ] 27.91% | 86 | 100.0% |
[ 28.5% - 29.0% ] 28.81% | 361 | 44.4% |
[ 29.0% - 29.5% ] 29.03% | 31 | 64.0% |
[ 30.0% - 30.5% ] 30.26% | 2,991 | 50.5% |
[ 30.5% - 31.0% ] 30.57% | 386 | 54.5% |
[ 31.0% - 31.5% ] 31.25% | 32 | 100.0% |
[ 33.0% - 33.5% ] 33.06% | 121 | 100.0% |
[ 34.0% - 34.5% ] 34.26% | 683 | 100.0% |
[ 34.5% - 35.0% ] 34.69% | 49 | 100.0% |
[ 35.0% - 35.5% ] 35.46% | 141 | 94.3% |
[ 36.0% - 36.5% ] 36.40% | 728 | 89.5% |
[ 36.5% - 37.0% ] 36.53% | 605 | 52.7% |
[ 37.5% - 38.0% ] 37.58% | 157 | 100.0% |
[ 38.5% - 39.0% ] 38.61% | 101 | 26.7% |
[ 40.5% - 41.0% ] 40.78% | 103 | 100.0% |
[ 42.0% - 42.5% ] 42.19% | 64 | 100.0% |
[ 42.5% - 43.0% ] 42.86% | 35 | 100.0% |
[ 43.0% - 43.5% ] 43.37% | 83 | 45.2% |
[ 50.0% - 50.5% ] 50.34% | 149 | 51.4% |
[ 53.5% - 54.0% ] 53.51% | 299 | 30.8% |
[ 61.5% - 62.0% ] 61.67% | 60 | 29.5% |
[ 66.5% - 67.0% ] 66.67% | 3 | 100.0% |