Navajo Disability Age Under 5
COMPARE
Navajo
Select to Compare
Disability Age Under 5
Navajo Disability Age Under 5
1.6%
DISABILITY | AGE UNDER 5
0.0/ 100
METRIC RATING
308th/ 347
METRIC RANK
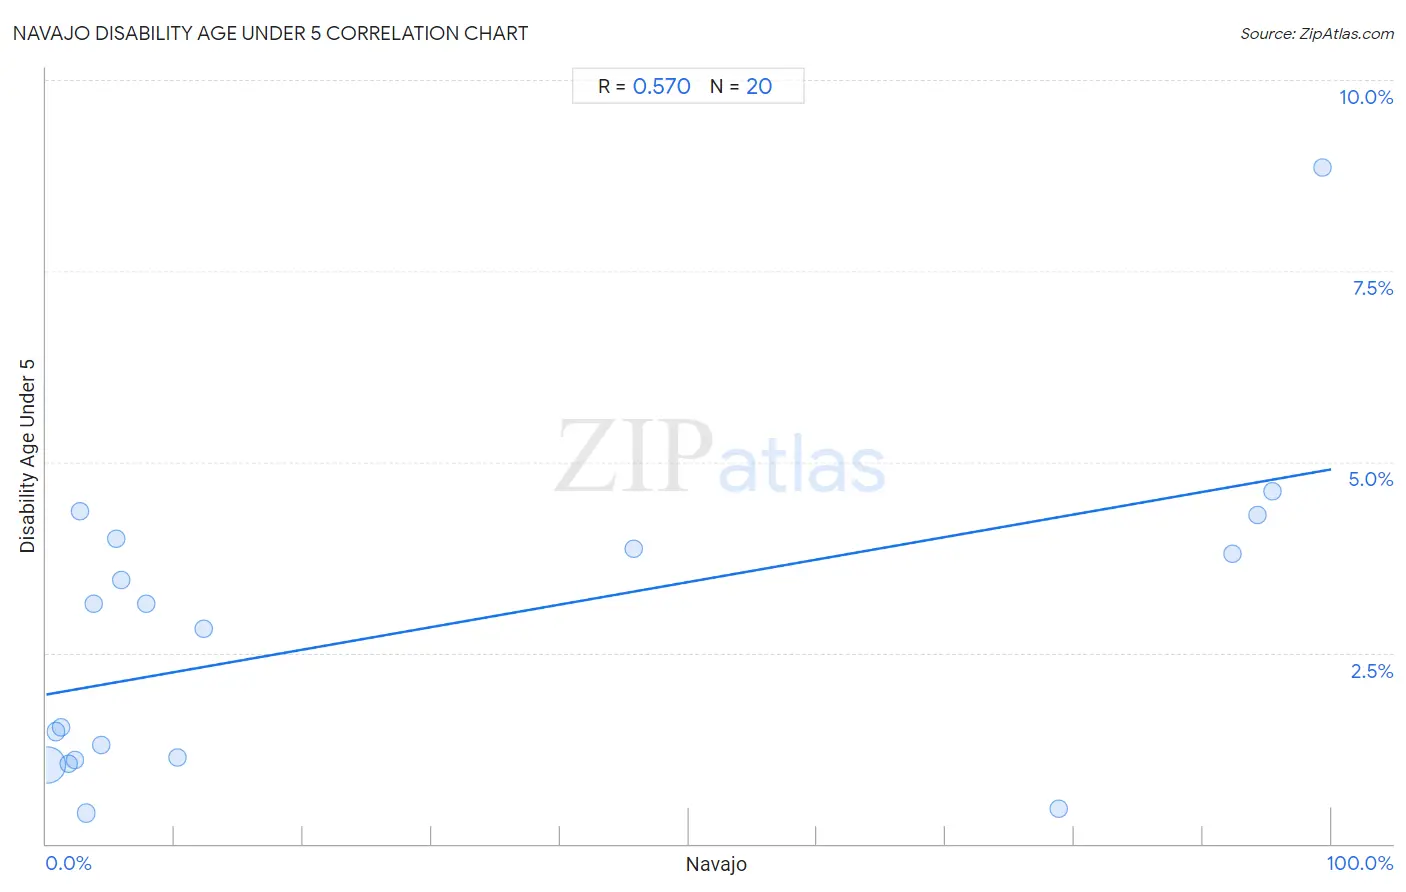
Navajo Disability Age Under 5 Correlation Chart
The statistical analysis conducted on geographies consisting of 151,471,391 people shows a substantial positive correlation between the proportion of Navajo and percentage of population with a disability under the age of 5 in the United States with a correlation coefficient (R) of 0.570 and weighted average of 1.6%. On average, for every 1% (one percent) increase in Navajo within a typical geography, there is an increase of 0.029% in percentage of population with a disability under the age of 5.
It is essential to understand that the correlation between the percentage of Navajo and percentage of population with a disability under the age of 5 does not imply a direct cause-and-effect relationship. It remains uncertain whether the presence of Navajo influences an upward or downward trend in the level of percentage of population with a disability under the age of 5 within an area, or if Navajo simply ended up residing in those areas with higher or lower levels of percentage of population with a disability under the age of 5 due to other factors.
Demographics Similar to Navajo by Disability Age Under 5
In terms of disability age under 5, the demographic groups most similar to Navajo are Scottish (1.6%, a difference of 0.14%), Creek (1.6%, a difference of 0.21%), Blackfeet (1.6%, a difference of 0.25%), Seminole (1.6%, a difference of 0.40%), and Cape Verdean (1.7%, a difference of 0.63%).
| Demographics | Rating | Rank | Disability Age Under 5 |
| German Russians | 0.0 /100 | #301 | Tragic 1.6% |
| Welsh | 0.0 /100 | #302 | Tragic 1.6% |
| Swiss | 0.0 /100 | #303 | Tragic 1.6% |
| Seminole | 0.0 /100 | #304 | Tragic 1.6% |
| Blackfeet | 0.0 /100 | #305 | Tragic 1.6% |
| Creek | 0.0 /100 | #306 | Tragic 1.6% |
| Scottish | 0.0 /100 | #307 | Tragic 1.6% |
| Navajo | 0.0 /100 | #308 | Tragic 1.6% |
| Cape Verdeans | 0.0 /100 | #309 | Tragic 1.7% |
| Whites/Caucasians | 0.0 /100 | #310 | Tragic 1.7% |
| English | 0.0 /100 | #311 | Tragic 1.7% |
| Puerto Ricans | 0.0 /100 | #312 | Tragic 1.7% |
| Celtics | 0.0 /100 | #313 | Tragic 1.7% |
| Norwegians | 0.0 /100 | #314 | Tragic 1.7% |
| Dutch | 0.0 /100 | #315 | Tragic 1.7% |
Navajo Disability Age Under 5 Correlation Summary
| Measurement | Navajo Data | Disability Age Under 5 Data |
| Minimum | 0.068% | 0.40% |
| Maximum | 99.3% | 8.9% |
| Range | 99.2% | 8.5% |
| Mean | 28.3% | 2.8% |
| Median | 5.6% | 3.0% |
| Interquartile 25% (IQ1) | 2.5% | 1.1% |
| Interquartile 75% (IQ3) | 62.3% | 3.9% |
| Interquartile Range (IQR) | 59.8% | 2.8% |
| Standard Deviation (Sample) | 39.1% | 2.0% |
| Standard Deviation (Population) | 38.1% | 2.0% |
Correlation Details
| Navajo Percentile | Sample Size | Disability Age Under 5 |
[ 0.0% - 0.5% ] 0.068% | 142,642,167 | 1.0% |
[ 0.5% - 1.0% ] 0.74% | 4,396,981 | 1.5% |
[ 1.0% - 1.5% ] 1.12% | 2,741,388 | 1.5% |
[ 1.5% - 2.0% ] 1.74% | 453,144 | 1.0% |
[ 2.0% - 2.5% ] 2.23% | 346,299 | 1.1% |
[ 2.5% - 3.0% ] 2.67% | 127,792 | 4.4% |
[ 3.0% - 3.5% ] 3.10% | 565,477 | 0.40% |
[ 3.5% - 4.0% ] 3.66% | 25,843 | 3.1% |
[ 4.0% - 4.5% ] 4.31% | 45,843 | 1.3% |
[ 5.0% - 5.5% ] 5.44% | 14,449 | 4.0% |
[ 5.5% - 6.0% ] 5.82% | 7,900 | 3.5% |
[ 7.5% - 8.0% ] 7.78% | 17,299 | 3.1% |
[ 10.0% - 10.5% ] 10.22% | 36,590 | 1.1% |
[ 12.0% - 12.5% ] 12.23% | 2,878 | 2.8% |
[ 45.5% - 46.0% ] 45.72% | 9,175 | 3.9% |
[ 78.5% - 79.0% ] 78.79% | 11,154 | 0.45% |
[ 92.0% - 92.5% ] 92.28% | 5,027 | 3.8% |
[ 94.0% - 94.5% ] 94.25% | 14,704 | 4.3% |
[ 95.0% - 95.5% ] 95.46% | 2,290 | 4.6% |
[ 99.0% - 99.5% ] 99.28% | 4,991 | 8.9% |