Navajo 4 or more Vehicles in Household
COMPARE
Navajo
Select to Compare
4 or more Vehicles in Household
Navajo 4 or more Vehicles in Household
8.2%
4+ VEHICLES AVAILABLE
100.0/ 100
METRIC RATING
30th/ 347
METRIC RANK
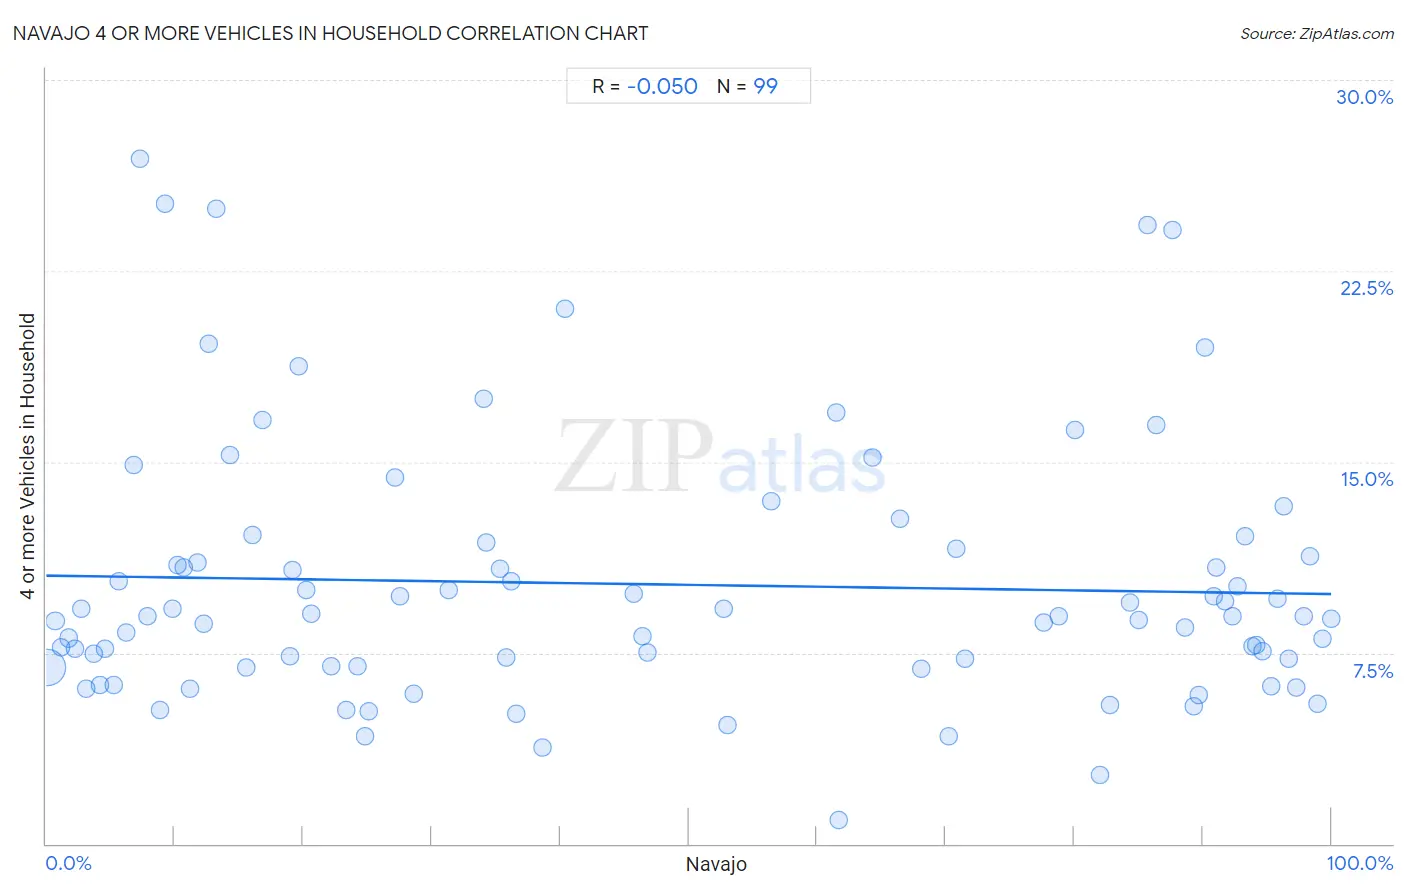
Navajo 4 or more Vehicles in Household Correlation Chart
The statistical analysis conducted on geographies consisting of 224,231,101 people shows a slight negative correlation between the proportion of Navajo and percentage of households with 4 or more vehicles available in the United States with a correlation coefficient (R) of -0.050 and weighted average of 8.2%. On average, for every 1% (one percent) increase in Navajo within a typical geography, there is a decrease of 0.0073% in percentage of households with 4 or more vehicles available.
It is essential to understand that the correlation between the percentage of Navajo and percentage of households with 4 or more vehicles available does not imply a direct cause-and-effect relationship. It remains uncertain whether the presence of Navajo influences an upward or downward trend in the level of percentage of households with 4 or more vehicles available within an area, or if Navajo simply ended up residing in those areas with higher or lower levels of percentage of households with 4 or more vehicles available due to other factors.
Demographics Similar to Navajo by 4 or more Vehicles in Household
In terms of 4 or more vehicles in household, the demographic groups most similar to Navajo are Immigrants from South Eastern Asia (8.2%, a difference of 0.030%), Native/Alaskan (8.2%, a difference of 0.40%), Cheyenne (8.3%, a difference of 0.69%), Marshallese (8.1%, a difference of 0.94%), and Yaqui (8.1%, a difference of 1.2%).
| Demographics | Rating | Rank | 4 or more Vehicles in Household |
| Immigrants from Philippines | 100.0 /100 | #23 | Exceptional 8.5% |
| Immigrants from Central America | 100.0 /100 | #24 | Exceptional 8.5% |
| Basques | 100.0 /100 | #25 | Exceptional 8.4% |
| Mexican American Indians | 100.0 /100 | #26 | Exceptional 8.4% |
| Sri Lankans | 100.0 /100 | #27 | Exceptional 8.4% |
| Cheyenne | 100.0 /100 | #28 | Exceptional 8.3% |
| Immigrants from South Eastern Asia | 100.0 /100 | #29 | Exceptional 8.2% |
| Navajo | 100.0 /100 | #30 | Exceptional 8.2% |
| Natives/Alaskans | 100.0 /100 | #31 | Exceptional 8.2% |
| Marshallese | 100.0 /100 | #32 | Exceptional 8.1% |
| Yaqui | 100.0 /100 | #33 | Exceptional 8.1% |
| Alaskan Athabascans | 100.0 /100 | #34 | Exceptional 8.1% |
| Guamanians/Chamorros | 100.0 /100 | #35 | Exceptional 8.1% |
| Norwegians | 100.0 /100 | #36 | Exceptional 8.0% |
| Scandinavians | 100.0 /100 | #37 | Exceptional 8.0% |
Navajo 4 or more Vehicles in Household Correlation Summary
| Measurement | Navajo Data | 4 or more Vehicles in Household Data |
| Minimum | 0.078% | 0.93% |
| Maximum | 100.0% | 26.9% |
| Range | 99.9% | 26.0% |
| Mean | 47.4% | 10.2% |
| Median | 36.5% | 8.9% |
| Interquartile 25% (IQ1) | 12.7% | 7.0% |
| Interquartile 75% (IQ3) | 86.3% | 11.6% |
| Interquartile Range (IQR) | 73.7% | 4.6% |
| Standard Deviation (Sample) | 35.5% | 5.1% |
| Standard Deviation (Population) | 35.3% | 5.1% |
Correlation Details
| Navajo Percentile | Sample Size | 4 or more Vehicles in Household |
[ 0.0% - 0.5% ] 0.078% | 208,534,966 | 6.9% |
[ 0.5% - 1.0% ] 0.71% | 7,584,918 | 8.8% |
[ 1.0% - 1.5% ] 1.15% | 4,164,730 | 7.7% |
[ 1.5% - 2.0% ] 1.73% | 982,895 | 8.1% |
[ 2.0% - 2.5% ] 2.23% | 650,397 | 7.7% |
[ 2.5% - 3.0% ] 2.69% | 284,596 | 9.2% |
[ 3.0% - 3.5% ] 3.12% | 771,939 | 6.1% |
[ 3.5% - 4.0% ] 3.73% | 158,495 | 7.5% |
[ 4.0% - 4.5% ] 4.21% | 102,573 | 6.3% |
[ 4.5% - 5.0% ] 4.56% | 38,919 | 7.6% |
[ 5.0% - 5.5% ] 5.22% | 96,378 | 6.2% |
[ 5.5% - 6.0% ] 5.68% | 31,067 | 10.3% |
[ 6.0% - 6.5% ] 6.25% | 10,831 | 8.3% |
[ 6.5% - 7.0% ] 6.76% | 8,118 | 14.9% |
[ 7.0% - 7.5% ] 7.31% | 7,030 | 26.9% |
[ 7.5% - 8.0% ] 7.86% | 40,609 | 8.9% |
[ 8.5% - 9.0% ] 8.82% | 131,661 | 5.3% |
[ 9.0% - 9.5% ] 9.28% | 4,858 | 25.1% |
[ 9.5% - 10.0% ] 9.81% | 19,204 | 9.3% |
[ 10.0% - 10.5% ] 10.24% | 50,066 | 10.9% |
[ 10.5% - 11.0% ] 10.71% | 1,858 | 10.9% |
[ 11.0% - 11.5% ] 11.21% | 9,287 | 6.1% |
[ 11.5% - 12.0% ] 11.73% | 452 | 11.0% |
[ 12.0% - 12.5% ] 12.28% | 14,241 | 8.6% |
[ 12.5% - 13.0% ] 12.66% | 2,440 | 19.7% |
[ 13.0% - 13.5% ] 13.24% | 3,921 | 25.0% |
[ 14.0% - 14.5% ] 14.29% | 217 | 15.3% |
[ 15.5% - 16.0% ] 15.61% | 6,214 | 6.9% |
[ 16.0% - 16.5% ] 16.03% | 343 | 12.1% |
[ 16.5% - 17.0% ] 16.84% | 962 | 16.7% |
[ 18.5% - 19.0% ] 18.93% | 7,038 | 7.4% |
[ 19.0% - 19.5% ] 19.16% | 2,793 | 10.8% |
[ 19.5% - 20.0% ] 19.69% | 3,591 | 18.7% |
[ 20.0% - 20.5% ] 20.21% | 11,199 | 10.0% |
[ 20.5% - 21.0% ] 20.59% | 1,093 | 9.0% |
[ 22.0% - 22.5% ] 22.14% | 14,980 | 7.0% |
[ 23.0% - 23.5% ] 23.33% | 583 | 5.3% |
[ 24.0% - 24.5% ] 24.25% | 3,345 | 7.0% |
[ 24.5% - 25.0% ] 24.83% | 7,430 | 4.2% |
[ 25.0% - 25.5% ] 25.12% | 3,308 | 5.2% |
[ 27.0% - 27.5% ] 27.16% | 4,834 | 14.4% |
[ 27.5% - 28.0% ] 27.52% | 46,457 | 9.7% |
[ 28.5% - 29.0% ] 28.57% | 4,858 | 5.9% |
[ 31.0% - 31.5% ] 31.29% | 46,398 | 10.0% |
[ 34.0% - 34.5% ] 34.00% | 100 | 17.5% |
[ 34.0% - 34.5% ] 34.25% | 5,317 | 11.9% |
[ 35.0% - 35.5% ] 35.30% | 4,842 | 10.8% |
[ 35.5% - 36.0% ] 35.82% | 8,943 | 7.3% |
[ 36.0% - 36.5% ] 36.17% | 188 | 10.3% |
[ 36.5% - 37.0% ] 36.54% | 728 | 5.1% |
[ 38.5% - 39.0% ] 38.63% | 1,504 | 3.8% |
[ 40.0% - 40.5% ] 40.35% | 456 | 21.0% |
[ 45.5% - 46.0% ] 45.72% | 9,175 | 9.8% |
[ 46.0% - 46.5% ] 46.36% | 22,997 | 8.2% |
[ 46.5% - 47.0% ] 46.82% | 22,454 | 7.5% |
[ 52.5% - 53.0% ] 52.68% | 16,651 | 9.2% |
[ 53.0% - 53.5% ] 53.06% | 98 | 4.7% |
[ 56.0% - 56.5% ] 56.43% | 8,855 | 13.5% |
[ 61.0% - 61.5% ] 61.48% | 610 | 16.9% |
[ 61.5% - 62.0% ] 61.69% | 2,665 | 0.93% |
[ 64.0% - 64.5% ] 64.27% | 10,785 | 15.2% |
[ 66.0% - 66.5% ] 66.44% | 1,612 | 12.8% |
[ 68.0% - 68.5% ] 68.13% | 5,600 | 6.9% |
[ 70.0% - 70.5% ] 70.24% | 1,482 | 4.2% |
[ 70.5% - 71.0% ] 70.81% | 1,552 | 11.6% |
[ 71.0% - 71.5% ] 71.50% | 1,607 | 7.3% |
[ 77.5% - 78.0% ] 77.65% | 4,345 | 8.7% |
[ 78.5% - 79.0% ] 78.78% | 11,541 | 9.0% |
[ 80.0% - 80.5% ] 80.04% | 526 | 16.3% |
[ 81.5% - 82.0% ] 81.99% | 594 | 2.7% |
[ 82.5% - 83.0% ] 82.74% | 2,653 | 5.5% |
[ 84.0% - 84.5% ] 84.30% | 8,372 | 9.5% |
[ 85.0% - 85.5% ] 85.03% | 2,945 | 8.8% |
[ 85.5% - 86.0% ] 85.71% | 238 | 24.3% |
[ 86.0% - 86.5% ] 86.35% | 1,311 | 16.5% |
[ 87.5% - 88.0% ] 87.61% | 1,009 | 24.1% |
[ 88.5% - 89.0% ] 88.61% | 7,409 | 8.5% |
[ 89.0% - 89.5% ] 89.34% | 722 | 5.4% |
[ 89.5% - 90.0% ] 89.73% | 867 | 5.8% |
[ 90.0% - 90.5% ] 90.22% | 2,137 | 19.5% |
[ 90.5% - 91.0% ] 90.85% | 11,122 | 9.7% |
[ 91.0% - 91.5% ] 91.07% | 9,234 | 10.9% |
[ 91.5% - 92.0% ] 91.69% | 8,424 | 9.5% |
[ 92.0% - 92.5% ] 92.32% | 8,411 | 8.9% |
[ 92.5% - 93.0% ] 92.75% | 19,851 | 10.1% |
[ 93.0% - 93.5% ] 93.33% | 3,269 | 12.1% |
[ 93.5% - 94.0% ] 93.92% | 8,846 | 7.8% |
[ 94.0% - 94.5% ] 94.20% | 27,550 | 7.8% |
[ 94.5% - 95.0% ] 94.66% | 6,329 | 7.5% |
[ 95.0% - 95.5% ] 95.36% | 13,953 | 6.2% |
[ 95.5% - 96.0% ] 95.82% | 9,234 | 9.6% |
[ 96.0% - 96.5% ] 96.27% | 5,901 | 13.2% |
[ 96.5% - 97.0% ] 96.72% | 16,594 | 7.2% |
[ 97.0% - 97.5% ] 97.23% | 2,453 | 6.1% |
[ 97.5% - 98.0% ] 97.89% | 8,718 | 8.9% |
[ 98.0% - 98.5% ] 98.34% | 3,863 | 11.3% |
[ 98.5% - 99.0% ] 98.90% | 5,369 | 5.5% |
[ 99.0% - 99.5% ] 99.30% | 11,093 | 8.0% |
[ 99.5% - 100.0% ] 100.00% | 5,905 | 8.9% |