Navajo Wage/Income Gap
COMPARE
Navajo
Select to Compare
Wage/Income Gap
Navajo Wage/Income Gap
22.4%
WAGE/INCOME GAP
100.0/ 100
METRIC RATING
59th/ 347
METRIC RANK
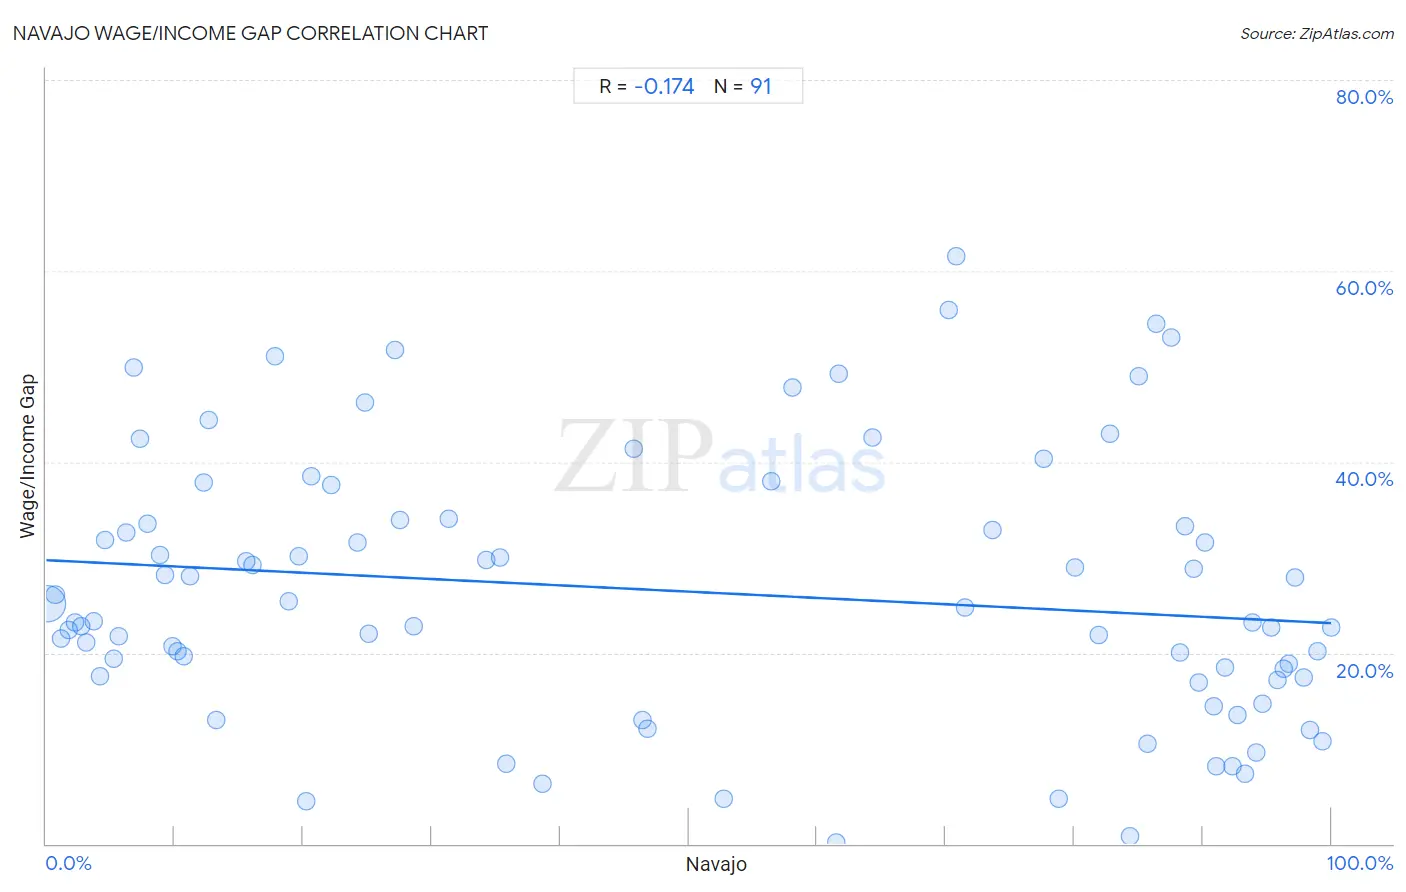
Navajo Wage/Income Gap Correlation Chart
The statistical analysis conducted on geographies consisting of 224,670,877 people shows a poor negative correlation between the proportion of Navajo and wage/income gap percentage in the United States with a correlation coefficient (R) of -0.174 and weighted average of 22.4%. On average, for every 1% (one percent) increase in Navajo within a typical geography, there is a decrease of 0.066% in wage/income gap percentage.
It is essential to understand that the correlation between the percentage of Navajo and wage/income gap percentage does not imply a direct cause-and-effect relationship. It remains uncertain whether the presence of Navajo influences an upward or downward trend in the level of wage/income gap percentage within an area, or if Navajo simply ended up residing in those areas with higher or lower levels of wage/income gap percentage due to other factors.
Demographics Similar to Navajo by Wage/Income Gap
In terms of wage/income gap, the demographic groups most similar to Navajo are Immigrants from Middle Africa (22.4%, a difference of 0.020%), Immigrants from Cuba (22.4%, a difference of 0.040%), Ghanaian (22.3%, a difference of 0.12%), Immigrants from Fiji (22.4%, a difference of 0.19%), and Immigrants from Ghana (22.3%, a difference of 0.22%).
| Demographics | Rating | Rank | Wage/Income Gap |
| Immigrants from Cameroon | 100.0 /100 | #52 | Exceptional 22.2% |
| Bangladeshis | 100.0 /100 | #53 | Exceptional 22.2% |
| Nepalese | 100.0 /100 | #54 | Exceptional 22.2% |
| Immigrants from Zaire | 100.0 /100 | #55 | Exceptional 22.3% |
| Immigrants from Ghana | 100.0 /100 | #56 | Exceptional 22.3% |
| Ghanaians | 100.0 /100 | #57 | Exceptional 22.3% |
| Immigrants from Cuba | 100.0 /100 | #58 | Exceptional 22.4% |
| Navajo | 100.0 /100 | #59 | Exceptional 22.4% |
| Immigrants from Middle Africa | 100.0 /100 | #60 | Exceptional 22.4% |
| Immigrants from Fiji | 100.0 /100 | #61 | Exceptional 22.4% |
| Immigrants from Guatemala | 100.0 /100 | #62 | Exceptional 22.5% |
| Immigrants from Ecuador | 100.0 /100 | #63 | Exceptional 22.5% |
| Spanish American Indians | 100.0 /100 | #64 | Exceptional 22.5% |
| Guatemalans | 99.9 /100 | #65 | Exceptional 22.6% |
| Central American Indians | 99.9 /100 | #66 | Exceptional 22.7% |
Navajo Wage/Income Gap Correlation Summary
| Measurement | Navajo Data | Wage/Income Gap Data |
| Minimum | 0.078% | 0.15% |
| Maximum | 100.0% | 61.5% |
| Range | 99.9% | 61.3% |
| Mean | 49.6% | 26.4% |
| Median | 46.4% | 23.3% |
| Interquartile 25% (IQ1) | 12.3% | 17.5% |
| Interquartile 75% (IQ3) | 88.6% | 33.9% |
| Interquartile Range (IQR) | 76.3% | 16.4% |
| Standard Deviation (Sample) | 36.6% | 13.9% |
| Standard Deviation (Population) | 36.4% | 13.8% |
Correlation Details
| Navajo Percentile | Sample Size | Wage/Income Gap |
[ 0.0% - 0.5% ] 0.078% | 208,966,180 | 25.1% |
[ 0.5% - 1.0% ] 0.71% | 7,636,045 | 26.1% |
[ 1.0% - 1.5% ] 1.15% | 4,163,978 | 21.5% |
[ 1.5% - 2.0% ] 1.72% | 976,711 | 22.4% |
[ 2.0% - 2.5% ] 2.23% | 651,353 | 23.2% |
[ 2.5% - 3.0% ] 2.69% | 276,333 | 22.8% |
[ 3.0% - 3.5% ] 3.12% | 771,534 | 21.1% |
[ 3.5% - 4.0% ] 3.73% | 156,758 | 23.3% |
[ 4.0% - 4.5% ] 4.21% | 104,227 | 17.5% |
[ 4.5% - 5.0% ] 4.55% | 37,943 | 31.8% |
[ 5.0% - 5.5% ] 5.22% | 94,871 | 19.4% |
[ 5.5% - 6.0% ] 5.68% | 31,067 | 21.8% |
[ 6.0% - 6.5% ] 6.24% | 9,719 | 32.6% |
[ 6.5% - 7.0% ] 6.76% | 7,910 | 49.9% |
[ 7.0% - 7.5% ] 7.31% | 6,608 | 42.4% |
[ 7.5% - 8.0% ] 7.86% | 40,609 | 33.6% |
[ 8.5% - 9.0% ] 8.82% | 133,611 | 30.2% |
[ 9.0% - 9.5% ] 9.28% | 4,858 | 28.1% |
[ 9.5% - 10.0% ] 9.80% | 17,435 | 20.6% |
[ 10.0% - 10.5% ] 10.23% | 48,796 | 20.2% |
[ 10.5% - 11.0% ] 10.71% | 1,709 | 19.7% |
[ 11.0% - 11.5% ] 11.20% | 8,832 | 28.1% |
[ 12.0% - 12.5% ] 12.29% | 13,426 | 37.8% |
[ 12.5% - 13.0% ] 12.66% | 2,440 | 44.4% |
[ 13.0% - 13.5% ] 13.24% | 3,921 | 12.9% |
[ 15.5% - 16.0% ] 15.61% | 6,214 | 29.5% |
[ 16.0% - 16.5% ] 16.03% | 343 | 29.2% |
[ 17.5% - 18.0% ] 17.76% | 411 | 51.0% |
[ 18.5% - 19.0% ] 18.89% | 4,488 | 25.4% |
[ 19.5% - 20.0% ] 19.69% | 3,591 | 30.2% |
[ 20.0% - 20.5% ] 20.21% | 11,199 | 4.5% |
[ 20.5% - 21.0% ] 20.59% | 1,093 | 38.5% |
[ 22.0% - 22.5% ] 22.14% | 14,980 | 37.6% |
[ 24.0% - 24.5% ] 24.26% | 3,591 | 31.5% |
[ 24.5% - 25.0% ] 24.84% | 7,898 | 46.3% |
[ 25.0% - 25.5% ] 25.12% | 3,308 | 22.0% |
[ 27.0% - 27.5% ] 27.16% | 4,834 | 51.7% |
[ 27.5% - 28.0% ] 27.52% | 46,457 | 33.9% |
[ 28.5% - 29.0% ] 28.57% | 4,858 | 22.8% |
[ 31.0% - 31.5% ] 31.29% | 46,398 | 34.1% |
[ 34.0% - 34.5% ] 34.25% | 5,317 | 29.7% |
[ 35.0% - 35.5% ] 35.30% | 4,842 | 30.0% |
[ 35.5% - 36.0% ] 35.82% | 8,943 | 8.4% |
[ 38.5% - 39.0% ] 38.63% | 1,504 | 6.3% |
[ 45.5% - 46.0% ] 45.72% | 9,175 | 41.4% |
[ 46.0% - 46.5% ] 46.36% | 22,997 | 13.0% |
[ 46.5% - 47.0% ] 46.82% | 22,454 | 12.1% |
[ 52.5% - 53.0% ] 52.68% | 16,651 | 4.7% |
[ 56.0% - 56.5% ] 56.45% | 7,933 | 38.0% |
[ 58.0% - 58.5% ] 58.03% | 193 | 47.8% |
[ 61.0% - 61.5% ] 61.48% | 610 | 0.15% |
[ 61.5% - 62.0% ] 61.69% | 2,665 | 49.3% |
[ 64.0% - 64.5% ] 64.27% | 10,785 | 42.6% |
[ 70.0% - 70.5% ] 70.24% | 1,482 | 55.9% |
[ 70.5% - 71.0% ] 70.81% | 1,552 | 61.5% |
[ 71.0% - 71.5% ] 71.50% | 1,607 | 24.8% |
[ 73.5% - 74.0% ] 73.68% | 494 | 32.9% |
[ 77.5% - 78.0% ] 77.65% | 4,345 | 40.3% |
[ 78.5% - 79.0% ] 78.78% | 11,541 | 4.8% |
[ 80.0% - 80.5% ] 80.04% | 526 | 28.9% |
[ 81.5% - 82.0% ] 81.91% | 1,039 | 21.8% |
[ 82.5% - 83.0% ] 82.74% | 2,653 | 42.9% |
[ 84.0% - 84.5% ] 84.30% | 8,372 | 0.73% |
[ 85.0% - 85.5% ] 85.03% | 2,945 | 49.0% |
[ 85.5% - 86.0% ] 85.71% | 238 | 10.4% |
[ 86.0% - 86.5% ] 86.35% | 967 | 54.5% |
[ 87.5% - 88.0% ] 87.56% | 868 | 53.0% |
[ 88.0% - 88.5% ] 88.28% | 435 | 20.1% |
[ 88.5% - 89.0% ] 88.60% | 7,238 | 33.3% |
[ 89.0% - 89.5% ] 89.34% | 722 | 28.8% |
[ 89.5% - 90.0% ] 89.73% | 867 | 16.8% |
[ 90.0% - 90.5% ] 90.16% | 1,453 | 31.5% |
[ 90.5% - 91.0% ] 90.84% | 11,403 | 14.4% |
[ 91.0% - 91.5% ] 91.07% | 9,234 | 8.1% |
[ 91.5% - 92.0% ] 91.69% | 8,424 | 18.4% |
[ 92.0% - 92.5% ] 92.29% | 6,760 | 8.1% |
[ 92.5% - 93.0% ] 92.75% | 19,851 | 13.4% |
[ 93.0% - 93.5% ] 93.33% | 3,269 | 7.4% |
[ 93.5% - 94.0% ] 93.92% | 8,846 | 23.2% |
[ 94.0% - 94.5% ] 94.20% | 27,550 | 9.6% |
[ 94.5% - 95.0% ] 94.64% | 5,751 | 14.7% |
[ 95.0% - 95.5% ] 95.37% | 13,309 | 22.7% |
[ 95.5% - 96.0% ] 95.82% | 9,234 | 17.2% |
[ 96.0% - 96.5% ] 96.30% | 6,750 | 18.4% |
[ 96.5% - 97.0% ] 96.72% | 16,156 | 18.8% |
[ 97.0% - 97.5% ] 97.21% | 2,040 | 27.9% |
[ 97.5% - 98.0% ] 97.87% | 9,584 | 17.5% |
[ 98.0% - 98.5% ] 98.30% | 2,475 | 11.9% |
[ 98.5% - 99.0% ] 98.91% | 5,027 | 20.2% |
[ 99.0% - 99.5% ] 99.30% | 11,093 | 10.7% |
[ 99.5% - 100.0% ] 100.00% | 4,171 | 22.7% |