Navajo vs Immigrants from Grenada Married-Couple Family Poverty
COMPARE
Navajo
Immigrants from Grenada
Married-Couple Family Poverty
Married-Couple Family Poverty Comparison
Navajo
Immigrants from Grenada
11.9%
MARRIED-COUPLE FAMILY POVERTY
0.0/ 100
METRIC RATING
344th/ 347
METRIC RANK
7.3%
MARRIED-COUPLE FAMILY POVERTY
0.0/ 100
METRIC RATING
320th/ 347
METRIC RANK
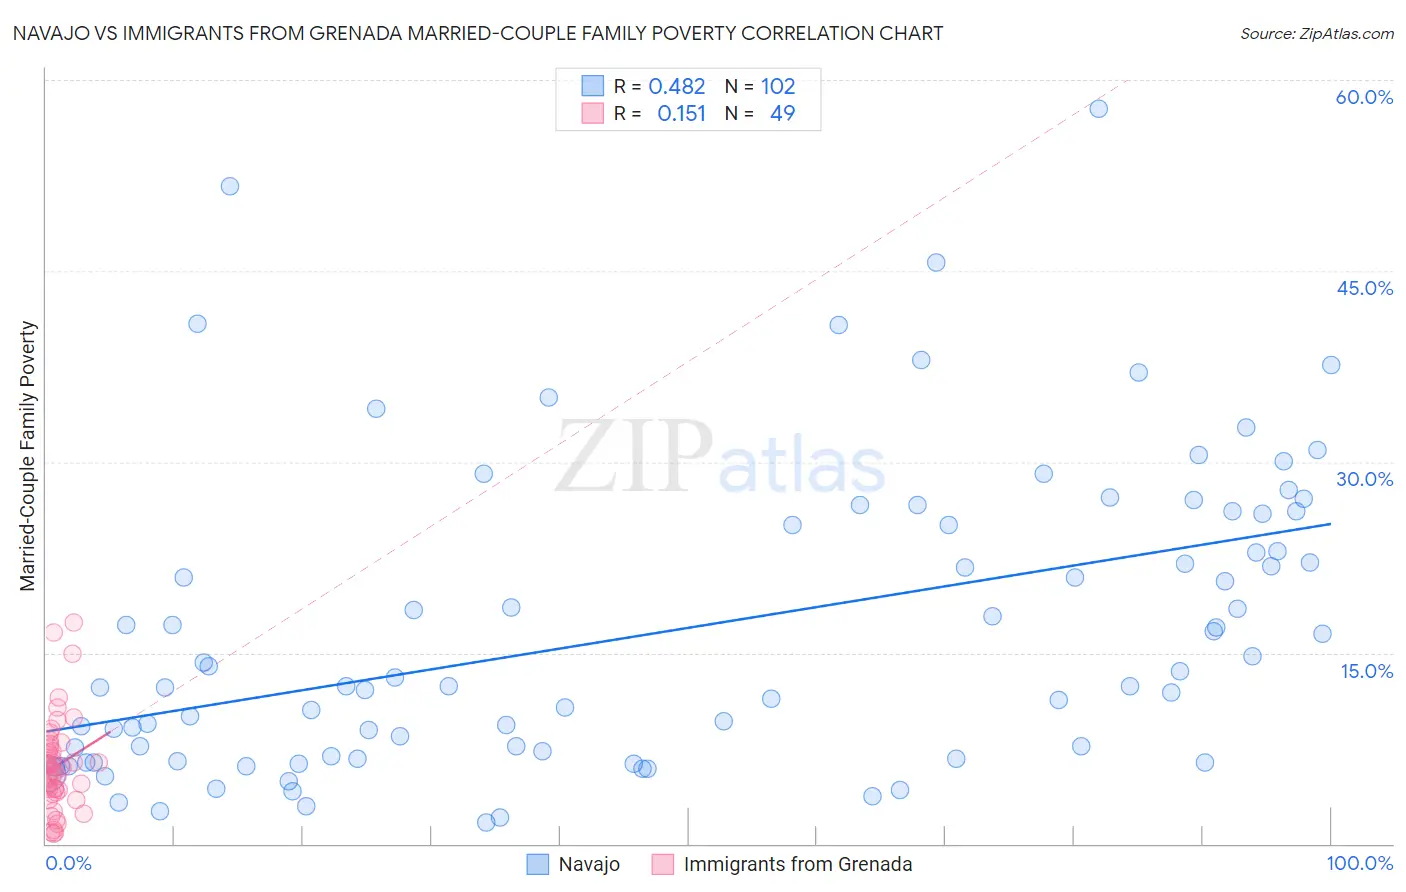
Navajo vs Immigrants from Grenada Married-Couple Family Poverty Correlation Chart
The statistical analysis conducted on geographies consisting of 223,988,346 people shows a moderate positive correlation between the proportion of Navajo and poverty level among married-couple families in the United States with a correlation coefficient (R) of 0.482 and weighted average of 11.9%. Similarly, the statistical analysis conducted on geographies consisting of 67,074,791 people shows a poor positive correlation between the proportion of Immigrants from Grenada and poverty level among married-couple families in the United States with a correlation coefficient (R) of 0.151 and weighted average of 7.3%, a difference of 62.6%.
Married-Couple Family Poverty Correlation Summary
| Measurement | Navajo | Immigrants from Grenada |
| Minimum | 1.7% | 0.79% |
| Maximum | 57.8% | 17.4% |
| Range | 56.1% | 16.6% |
| Mean | 16.7% | 6.1% |
| Median | 12.4% | 5.7% |
| Interquartile 25% (IQ1) | 6.7% | 4.0% |
| Interquartile 75% (IQ3) | 25.0% | 7.7% |
| Interquartile Range (IQR) | 18.3% | 3.8% |
| Standard Deviation (Sample) | 11.8% | 3.7% |
| Standard Deviation (Population) | 11.8% | 3.7% |
Similar Demographics by Married-Couple Family Poverty
Demographics Similar to Navajo by Married-Couple Family Poverty
In terms of married-couple family poverty, the demographic groups most similar to Navajo are Pima (11.4%, a difference of 3.9%), Tohono O'odham (11.2%, a difference of 5.6%), Puerto Rican (12.6%, a difference of 6.6%), Pueblo (11.1%, a difference of 6.6%), and Immigrants from Yemen (12.8%, a difference of 8.0%).
| Demographics | Rating | Rank | Married-Couple Family Poverty |
| Lumbee | 0.0 /100 | #333 | Tragic 8.3% |
| Immigrants | Dominican Republic | 0.0 /100 | #334 | Tragic 8.4% |
| Sioux | 0.0 /100 | #335 | Tragic 8.7% |
| Apache | 0.0 /100 | #336 | Tragic 9.0% |
| Yakama | 0.0 /100 | #337 | Tragic 9.0% |
| Cheyenne | 0.0 /100 | #338 | Tragic 9.4% |
| Crow | 0.0 /100 | #339 | Tragic 9.6% |
| Yuman | 0.0 /100 | #340 | Tragic 9.7% |
| Pueblo | 0.0 /100 | #341 | Tragic 11.1% |
| Tohono O'odham | 0.0 /100 | #342 | Tragic 11.2% |
| Pima | 0.0 /100 | #343 | Tragic 11.4% |
| Navajo | 0.0 /100 | #344 | Tragic 11.9% |
| Puerto Ricans | 0.0 /100 | #345 | Tragic 12.6% |
| Immigrants | Yemen | 0.0 /100 | #346 | Tragic 12.8% |
| Yup'ik | 0.0 /100 | #347 | Tragic 13.4% |
Demographics Similar to Immigrants from Grenada by Married-Couple Family Poverty
In terms of married-couple family poverty, the demographic groups most similar to Immigrants from Grenada are Immigrants from Caribbean (7.3%, a difference of 0.77%), Immigrants from Honduras (7.3%, a difference of 0.79%), Immigrants from Latin America (7.2%, a difference of 1.2%), Immigrants from Guatemala (7.2%, a difference of 1.4%), and Mexican (7.2%, a difference of 1.5%).
| Demographics | Rating | Rank | Married-Couple Family Poverty |
| Immigrants | St. Vincent and the Grenadines | 0.0 /100 | #313 | Tragic 7.1% |
| British West Indians | 0.0 /100 | #314 | Tragic 7.1% |
| Inupiat | 0.0 /100 | #315 | Tragic 7.1% |
| Hondurans | 0.0 /100 | #316 | Tragic 7.2% |
| Mexicans | 0.0 /100 | #317 | Tragic 7.2% |
| Immigrants | Guatemala | 0.0 /100 | #318 | Tragic 7.2% |
| Immigrants | Latin America | 0.0 /100 | #319 | Tragic 7.2% |
| Immigrants | Grenada | 0.0 /100 | #320 | Tragic 7.3% |
| Immigrants | Caribbean | 0.0 /100 | #321 | Tragic 7.3% |
| Immigrants | Honduras | 0.0 /100 | #322 | Tragic 7.3% |
| Vietnamese | 0.0 /100 | #323 | Tragic 7.4% |
| Immigrants | Central America | 0.0 /100 | #324 | Tragic 7.4% |
| Immigrants | Cuba | 0.0 /100 | #325 | Tragic 7.5% |
| Immigrants | Bangladesh | 0.0 /100 | #326 | Tragic 7.5% |
| Hispanics or Latinos | 0.0 /100 | #327 | Tragic 7.5% |