Navajo vs Colombian Married-Couple Family Poverty
COMPARE
Navajo
Colombian
Married-Couple Family Poverty
Married-Couple Family Poverty Comparison
Navajo
Colombians
11.9%
MARRIED-COUPLE FAMILY POVERTY
0.0/ 100
METRIC RATING
344th/ 347
METRIC RANK
5.6%
MARRIED-COUPLE FAMILY POVERTY
9.2/ 100
METRIC RATING
220th/ 347
METRIC RANK
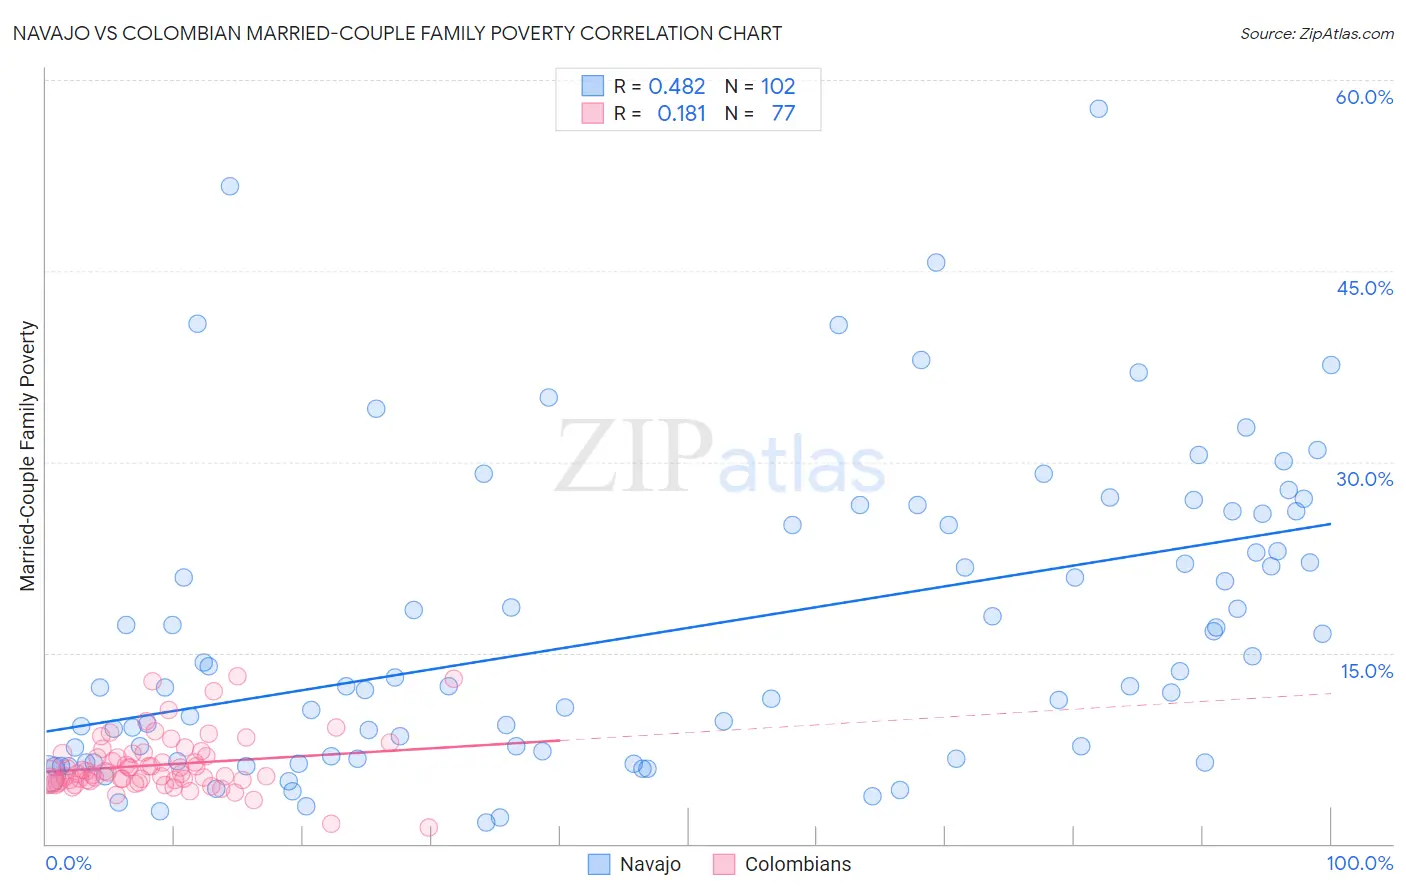
Navajo vs Colombian Married-Couple Family Poverty Correlation Chart
The statistical analysis conducted on geographies consisting of 223,988,346 people shows a moderate positive correlation between the proportion of Navajo and poverty level among married-couple families in the United States with a correlation coefficient (R) of 0.482 and weighted average of 11.9%. Similarly, the statistical analysis conducted on geographies consisting of 415,629,712 people shows a poor positive correlation between the proportion of Colombians and poverty level among married-couple families in the United States with a correlation coefficient (R) of 0.181 and weighted average of 5.6%, a difference of 113.0%.
Married-Couple Family Poverty Correlation Summary
| Measurement | Navajo | Colombian |
| Minimum | 1.7% | 1.3% |
| Maximum | 57.8% | 13.2% |
| Range | 56.1% | 11.9% |
| Mean | 16.7% | 6.2% |
| Median | 12.4% | 5.5% |
| Interquartile 25% (IQ1) | 6.7% | 5.0% |
| Interquartile 75% (IQ3) | 25.0% | 7.1% |
| Interquartile Range (IQR) | 18.3% | 2.1% |
| Standard Deviation (Sample) | 11.8% | 2.2% |
| Standard Deviation (Population) | 11.8% | 2.2% |
Similar Demographics by Married-Couple Family Poverty
Demographics Similar to Navajo by Married-Couple Family Poverty
In terms of married-couple family poverty, the demographic groups most similar to Navajo are Pima (11.4%, a difference of 3.9%), Tohono O'odham (11.2%, a difference of 5.6%), Puerto Rican (12.6%, a difference of 6.6%), Pueblo (11.1%, a difference of 6.6%), and Immigrants from Yemen (12.8%, a difference of 8.0%).
| Demographics | Rating | Rank | Married-Couple Family Poverty |
| Lumbee | 0.0 /100 | #333 | Tragic 8.3% |
| Immigrants | Dominican Republic | 0.0 /100 | #334 | Tragic 8.4% |
| Sioux | 0.0 /100 | #335 | Tragic 8.7% |
| Apache | 0.0 /100 | #336 | Tragic 9.0% |
| Yakama | 0.0 /100 | #337 | Tragic 9.0% |
| Cheyenne | 0.0 /100 | #338 | Tragic 9.4% |
| Crow | 0.0 /100 | #339 | Tragic 9.6% |
| Yuman | 0.0 /100 | #340 | Tragic 9.7% |
| Pueblo | 0.0 /100 | #341 | Tragic 11.1% |
| Tohono O'odham | 0.0 /100 | #342 | Tragic 11.2% |
| Pima | 0.0 /100 | #343 | Tragic 11.4% |
| Navajo | 0.0 /100 | #344 | Tragic 11.9% |
| Puerto Ricans | 0.0 /100 | #345 | Tragic 12.6% |
| Immigrants | Yemen | 0.0 /100 | #346 | Tragic 12.8% |
| Yup'ik | 0.0 /100 | #347 | Tragic 13.4% |
Demographics Similar to Colombians by Married-Couple Family Poverty
In terms of married-couple family poverty, the demographic groups most similar to Colombians are Panamanian (5.6%, a difference of 0.020%), Japanese (5.6%, a difference of 0.19%), Afghan (5.5%, a difference of 0.59%), Immigrants from Nigeria (5.5%, a difference of 0.61%), and Cajun (5.6%, a difference of 0.87%).
| Demographics | Rating | Rank | Married-Couple Family Poverty |
| Immigrants | Liberia | 13.3 /100 | #213 | Poor 5.5% |
| Iroquois | 13.1 /100 | #214 | Poor 5.5% |
| Armenians | 12.8 /100 | #215 | Poor 5.5% |
| Potawatomi | 12.4 /100 | #216 | Poor 5.5% |
| Immigrants | Nigeria | 11.3 /100 | #217 | Poor 5.5% |
| Afghans | 11.2 /100 | #218 | Poor 5.5% |
| Japanese | 9.8 /100 | #219 | Tragic 5.6% |
| Colombians | 9.2 /100 | #220 | Tragic 5.6% |
| Panamanians | 9.2 /100 | #221 | Tragic 5.6% |
| Cajuns | 6.9 /100 | #222 | Tragic 5.6% |
| Immigrants | Fiji | 6.7 /100 | #223 | Tragic 5.6% |
| Sudanese | 6.4 /100 | #224 | Tragic 5.6% |
| Immigrants | Cambodia | 6.1 /100 | #225 | Tragic 5.6% |
| South Americans | 5.7 /100 | #226 | Tragic 5.6% |
| Immigrants | Zaire | 5.6 /100 | #227 | Tragic 5.6% |