Navajo Unemployment Among Women with Children Ages 6 to 17 years
COMPARE
Navajo
Select to Compare
Unemployment Among Women with Children Ages 6 to 17 years
Navajo Unemployment Among Women with Children Ages 6 to 17 years
14.2%
UNEMPLOYMENT | WOMEN W/ CHILDREN 6 TO 17
0.0/ 100
METRIC RATING
341st/ 347
METRIC RANK
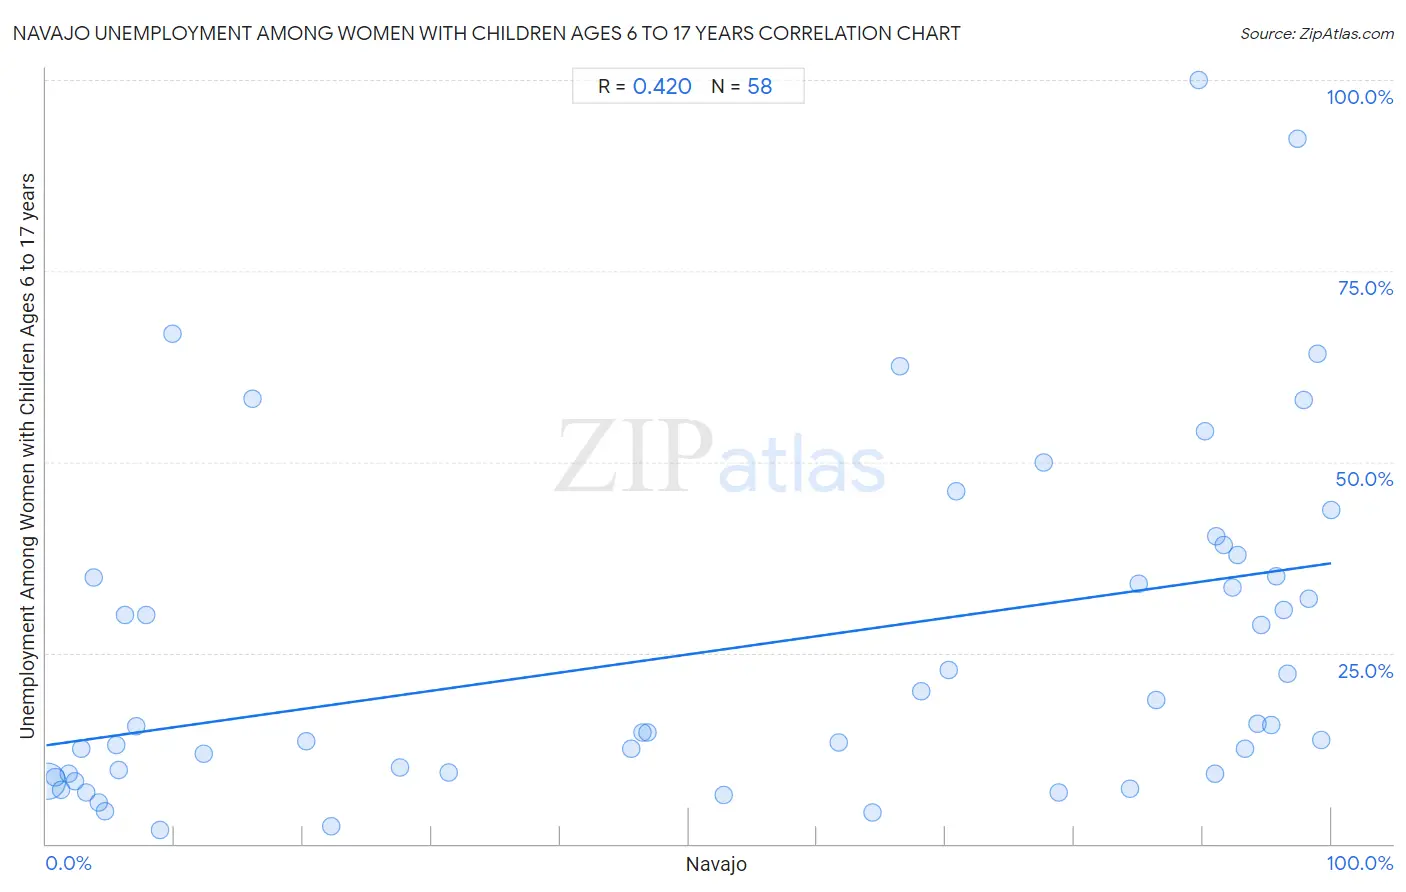
Navajo Unemployment Among Women with Children Ages 6 to 17 years Correlation Chart
The statistical analysis conducted on geographies consisting of 183,231,342 people shows a moderate positive correlation between the proportion of Navajo and unemployment rate among women with children between the ages 6 and 17 in the United States with a correlation coefficient (R) of 0.420 and weighted average of 14.2%. On average, for every 1% (one percent) increase in Navajo within a typical geography, there is an increase of 0.24% in unemployment rate among women with children between the ages 6 and 17.
It is essential to understand that the correlation between the percentage of Navajo and unemployment rate among women with children between the ages 6 and 17 does not imply a direct cause-and-effect relationship. It remains uncertain whether the presence of Navajo influences an upward or downward trend in the level of unemployment rate among women with children between the ages 6 and 17 within an area, or if Navajo simply ended up residing in those areas with higher or lower levels of unemployment rate among women with children between the ages 6 and 17 due to other factors.
Demographics Similar to Navajo by Unemployment Among Women with Children Ages 6 to 17 years
In terms of unemployment among women with children ages 6 to 17 years, the demographic groups most similar to Navajo are Puerto Rican (13.9%, a difference of 2.1%), Yuman (14.8%, a difference of 4.6%), Inupiat (14.9%, a difference of 4.9%), Sioux (13.2%, a difference of 6.9%), and Hopi (12.9%, a difference of 9.8%).
| Demographics | Rating | Rank | Unemployment Among Women with Children Ages 6 to 17 years |
| Natives/Alaskans | 0.0 /100 | #333 | Tragic 11.5% |
| Ugandans | 0.0 /100 | #334 | Tragic 12.0% |
| Colville | 0.0 /100 | #335 | Tragic 12.3% |
| Houma | 0.0 /100 | #336 | Tragic 12.5% |
| Immigrants from Yemen | 0.0 /100 | #337 | Tragic 12.7% |
| Hopi | 0.0 /100 | #338 | Tragic 12.9% |
| Sioux | 0.0 /100 | #339 | Tragic 13.2% |
| Puerto Ricans | 0.0 /100 | #340 | Tragic 13.9% |
| Navajo | 0.0 /100 | #341 | Tragic 14.2% |
| Yuman | 0.0 /100 | #342 | Tragic 14.8% |
| Inupiat | 0.0 /100 | #343 | Tragic 14.9% |
| Cheyenne | 0.0 /100 | #344 | Tragic 16.4% |
| Arapaho | 0.0 /100 | #345 | Tragic 16.8% |
| Yup'ik | 0.0 /100 | #346 | Tragic 18.6% |
| Pima | 0.0 /100 | #347 | Tragic 18.9% |
Navajo Unemployment Among Women with Children Ages 6 to 17 years Correlation Summary
| Measurement | Navajo Data | Unemployment Among Women with Children Ages 6 to 17 years Data |
| Minimum | 0.071% | 1.8% |
| Maximum | 100.0% | 100.0% |
| Range | 99.9% | 98.2% |
| Mean | 53.5% | 25.7% |
| Median | 65.4% | 15.5% |
| Interquartile 25% (IQ1) | 7.8% | 9.2% |
| Interquartile 75% (IQ3) | 92.3% | 35.0% |
| Interquartile Range (IQR) | 84.5% | 25.8% |
| Standard Deviation (Sample) | 39.2% | 22.2% |
| Standard Deviation (Population) | 38.8% | 22.0% |
Correlation Details
| Navajo Percentile | Sample Size | Unemployment Among Women with Children Ages 6 to 17 years |
[ 0.0% - 0.5% ] 0.071% | 172,664,663 | 8.2% |
[ 0.5% - 1.0% ] 0.73% | 4,926,046 | 8.8% |
[ 1.0% - 1.5% ] 1.14% | 3,302,769 | 7.1% |
[ 1.5% - 2.0% ] 1.75% | 585,632 | 9.2% |
[ 2.0% - 2.5% ] 2.24% | 335,696 | 8.2% |
[ 2.5% - 3.0% ] 2.68% | 186,636 | 12.4% |
[ 3.0% - 3.5% ] 3.11% | 660,303 | 6.7% |
[ 3.5% - 4.0% ] 3.71% | 49,024 | 34.9% |
[ 4.0% - 4.5% ] 4.06% | 10,725 | 5.3% |
[ 4.5% - 5.0% ] 4.53% | 29,894 | 4.3% |
[ 5.0% - 5.5% ] 5.41% | 31,756 | 12.9% |
[ 5.5% - 6.0% ] 5.61% | 22,198 | 9.6% |
[ 6.0% - 6.5% ] 6.08% | 4,405 | 29.9% |
[ 6.5% - 7.0% ] 6.99% | 501 | 15.4% |
[ 7.5% - 8.0% ] 7.81% | 5,378 | 29.9% |
[ 8.5% - 9.0% ] 8.81% | 76,177 | 1.8% |
[ 9.5% - 10.0% ] 9.79% | 2,063 | 66.7% |
[ 12.0% - 12.5% ] 12.25% | 1,257 | 11.8% |
[ 16.0% - 16.5% ] 16.03% | 343 | 58.3% |
[ 20.0% - 20.5% ] 20.22% | 10,362 | 13.4% |
[ 22.0% - 22.5% ] 22.14% | 14,980 | 2.3% |
[ 27.5% - 28.0% ] 27.52% | 46,457 | 10.0% |
[ 31.0% - 31.5% ] 31.29% | 46,398 | 9.4% |
[ 45.5% - 46.0% ] 45.53% | 3,817 | 12.4% |
[ 46.0% - 46.5% ] 46.35% | 21,672 | 14.6% |
[ 46.5% - 47.0% ] 46.82% | 22,454 | 14.6% |
[ 52.5% - 53.0% ] 52.68% | 16,651 | 6.3% |
[ 61.5% - 62.0% ] 61.69% | 2,665 | 13.2% |
[ 64.0% - 64.5% ] 64.27% | 10,785 | 4.1% |
[ 66.0% - 66.5% ] 66.44% | 1,612 | 62.5% |
[ 68.0% - 68.5% ] 68.13% | 5,600 | 20.0% |
[ 70.0% - 70.5% ] 70.24% | 1,482 | 22.7% |
[ 70.5% - 71.0% ] 70.81% | 1,552 | 46.2% |
[ 77.5% - 78.0% ] 77.65% | 4,345 | 50.0% |
[ 78.5% - 79.0% ] 78.79% | 11,154 | 6.7% |
[ 84.0% - 84.5% ] 84.30% | 8,372 | 7.2% |
[ 85.0% - 85.5% ] 85.03% | 2,945 | 34.0% |
[ 86.0% - 86.5% ] 86.35% | 762 | 18.8% |
[ 89.5% - 90.0% ] 89.66% | 174 | 100.0% |
[ 90.0% - 90.5% ] 90.22% | 2,137 | 54.0% |
[ 90.5% - 91.0% ] 90.95% | 1,326 | 9.1% |
[ 91.0% - 91.5% ] 91.07% | 8,275 | 40.3% |
[ 91.5% - 92.0% ] 91.60% | 2,823 | 39.1% |
[ 92.0% - 92.5% ] 92.32% | 6,678 | 33.5% |
[ 92.5% - 93.0% ] 92.72% | 17,412 | 37.8% |
[ 93.0% - 93.5% ] 93.30% | 1,119 | 12.5% |
[ 94.0% - 94.5% ] 94.21% | 18,424 | 15.7% |
[ 94.5% - 95.0% ] 94.60% | 3,148 | 28.6% |
[ 95.0% - 95.5% ] 95.37% | 12,991 | 15.6% |
[ 95.5% - 96.0% ] 95.72% | 4,489 | 35.0% |
[ 96.0% - 96.5% ] 96.30% | 1,892 | 30.6% |
[ 96.5% - 97.0% ] 96.62% | 3,844 | 22.3% |
[ 97.0% - 97.5% ] 97.39% | 689 | 92.3% |
[ 97.5% - 98.0% ] 97.82% | 5,735 | 58.1% |
[ 98.0% - 98.5% ] 98.24% | 1,989 | 32.1% |
[ 98.5% - 99.0% ] 98.89% | 3,058 | 64.2% |
[ 99.0% - 99.5% ] 99.25% | 4,004 | 13.6% |
[ 99.5% - 100.0% ] 100.00% | 1,604 | 43.6% |