Italian Disability Age 65 to 74
COMPARE
Italian
Select to Compare
Disability Age 65 to 74
Italian Disability Age 65 to 74
22.0%
DISABILITY | AGE 65 TO 74
97.9/ 100
METRIC RATING
90th/ 347
METRIC RANK
Italian Disability Age 65 to 74 Correlation Chart
The statistical analysis conducted on geographies consisting of 572,372,600 people shows a substantial positive correlation between the proportion of Italians and percentage of population with a disability between the ages 65 and 75 in the United States with a correlation coefficient (R) of 0.556 and weighted average of 22.0%. On average, for every 1% (one percent) increase in Italians within a typical geography, there is an increase of 0.54% in percentage of population with a disability between the ages 65 and 75.
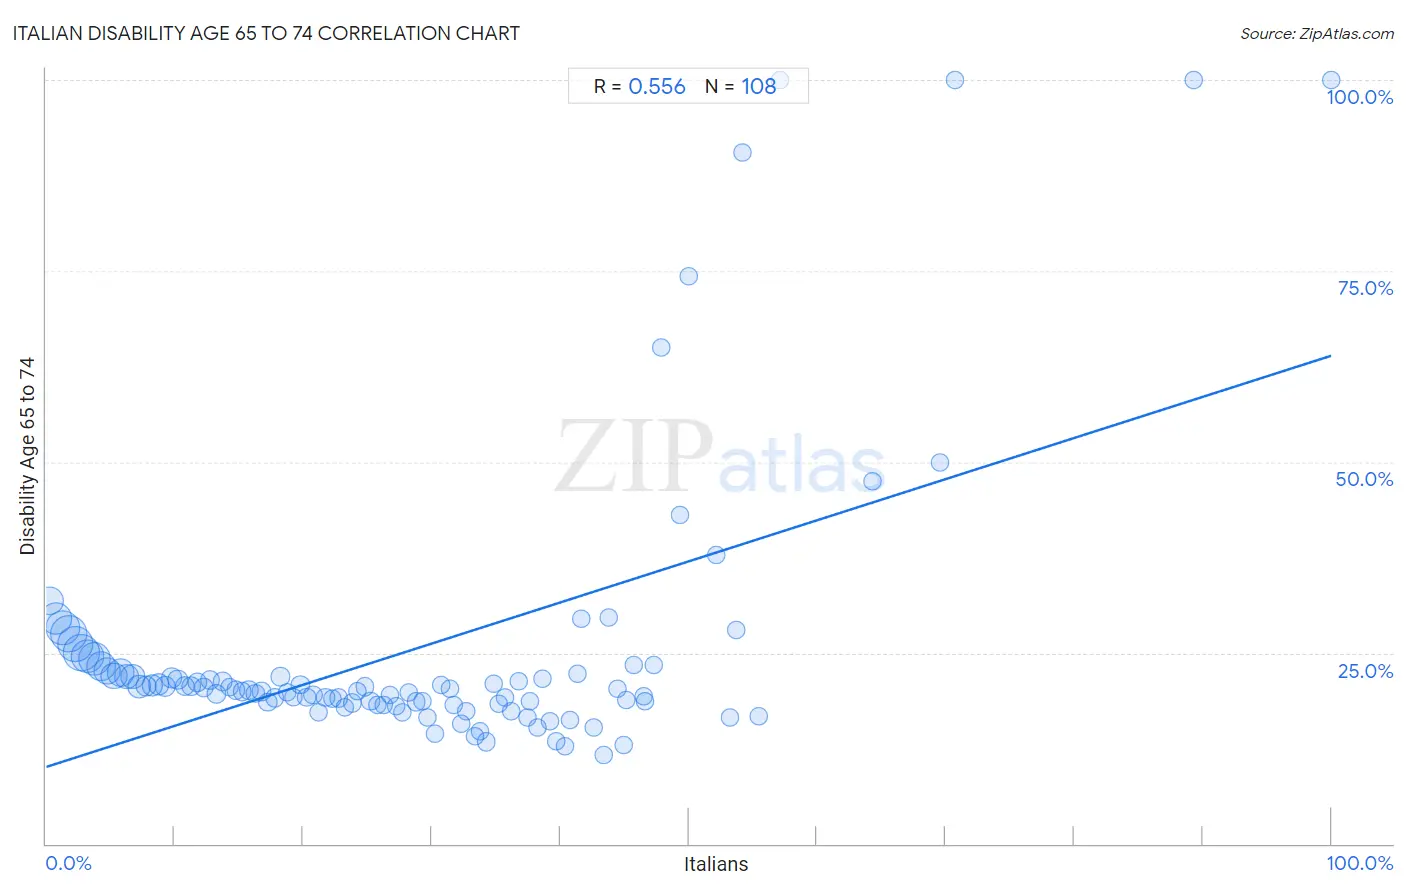
It is essential to understand that the correlation between the percentage of Italians and percentage of population with a disability between the ages 65 and 75 does not imply a direct cause-and-effect relationship. It remains uncertain whether the presence of Italians influences an upward or downward trend in the level of percentage of population with a disability between the ages 65 and 75 within an area, or if Italians simply ended up residing in those areas with higher or lower levels of percentage of population with a disability between the ages 65 and 75 due to other factors.
Demographics Similar to Italians by Disability Age 65 to 74
In terms of disability age 65 to 74, the demographic groups most similar to Italians are Immigrants from Kuwait (22.0%, a difference of 0.010%), Immigrants from Netherlands (22.0%, a difference of 0.020%), Chilean (22.0%, a difference of 0.020%), Australian (22.0%, a difference of 0.030%), and Polish (22.0%, a difference of 0.070%).
| Demographics | Rating | Rank | Disability Age 65 to 74 |
| Immigrants from Brazil | 98.5 /100 | #83 | Exceptional 21.9% |
| Immigrants from Spain | 98.5 /100 | #84 | Exceptional 21.9% |
| Immigrants from Lebanon | 98.4 /100 | #85 | Exceptional 21.9% |
| South Africans | 98.4 /100 | #86 | Exceptional 21.9% |
| Australians | 98.0 /100 | #87 | Exceptional 22.0% |
| Immigrants from Netherlands | 97.9 /100 | #88 | Exceptional 22.0% |
| Immigrants from Kuwait | 97.9 /100 | #89 | Exceptional 22.0% |
| Italians | 97.9 /100 | #90 | Exceptional 22.0% |
| Chileans | 97.9 /100 | #91 | Exceptional 22.0% |
| Poles | 97.8 /100 | #92 | Exceptional 22.0% |
| Immigrants from Canada | 97.8 /100 | #93 | Exceptional 22.1% |
| Immigrants from Chile | 97.7 /100 | #94 | Exceptional 22.1% |
| Romanians | 97.7 /100 | #95 | Exceptional 22.1% |
| Immigrants from North America | 97.5 /100 | #96 | Exceptional 22.1% |
| Immigrants from Southern Europe | 97.2 /100 | #97 | Exceptional 22.1% |
Italian Disability Age 65 to 74 Correlation Summary
| Measurement | Italian Data | Disability Age 65 to 74 Data |
| Minimum | 0.27% | 11.6% |
| Maximum | 100.0% | 100.0% |
| Range | 99.7% | 88.4% |
| Mean | 28.5% | 25.4% |
| Median | 27.0% | 20.2% |
| Interquartile 25% (IQ1) | 13.5% | 18.3% |
| Interquartile 75% (IQ3) | 40.6% | 22.3% |
| Interquartile Range (IQR) | 27.1% | 4.0% |
| Standard Deviation (Sample) | 19.0% | 18.4% |
| Standard Deviation (Population) | 18.9% | 18.3% |
Correlation Details
| Italian Percentile | Sample Size | Disability Age 65 to 74 |
[ 0.0% - 0.5% ] 0.27% | 28,762,439 | 31.8% |
[ 0.5% - 1.0% ] 0.77% | 37,973,858 | 29.5% |
[ 1.0% - 1.5% ] 1.26% | 41,776,386 | 28.3% |
[ 1.5% - 2.0% ] 1.74% | 49,904,723 | 27.5% |
[ 2.0% - 2.5% ] 2.25% | 45,024,804 | 26.1% |
[ 2.5% - 3.0% ] 2.74% | 49,210,917 | 25.0% |
[ 3.0% - 3.5% ] 3.25% | 40,130,617 | 24.6% |
[ 3.5% - 4.0% ] 3.76% | 39,433,000 | 24.2% |
[ 4.0% - 4.5% ] 4.25% | 30,383,733 | 23.2% |
[ 4.5% - 5.0% ] 4.73% | 25,204,352 | 22.6% |
[ 5.0% - 5.5% ] 5.25% | 21,808,168 | 22.0% |
[ 5.5% - 6.0% ] 5.79% | 25,996,197 | 22.4% |
[ 6.0% - 6.5% ] 6.24% | 14,782,357 | 21.9% |
[ 6.5% - 7.0% ] 6.75% | 14,908,758 | 21.9% |
[ 7.0% - 7.5% ] 7.23% | 11,411,477 | 20.6% |
[ 7.5% - 8.0% ] 7.74% | 7,726,728 | 20.7% |
[ 8.0% - 8.5% ] 8.25% | 7,602,641 | 20.7% |
[ 8.5% - 9.0% ] 8.73% | 6,804,030 | 20.9% |
[ 9.0% - 9.5% ] 9.24% | 5,824,555 | 20.6% |
[ 9.5% - 10.0% ] 9.75% | 4,619,461 | 21.7% |
[ 10.0% - 10.5% ] 10.25% | 5,293,657 | 21.5% |
[ 10.5% - 11.0% ] 10.77% | 4,307,265 | 20.6% |
[ 11.0% - 11.5% ] 11.27% | 3,463,841 | 20.6% |
[ 11.5% - 12.0% ] 11.75% | 4,071,145 | 21.1% |
[ 12.0% - 12.5% ] 12.23% | 3,481,163 | 20.4% |
[ 12.5% - 13.0% ] 12.74% | 3,175,726 | 21.4% |
[ 13.0% - 13.5% ] 13.23% | 2,612,025 | 19.7% |
[ 13.5% - 14.0% ] 13.76% | 2,255,703 | 21.2% |
[ 14.0% - 14.5% ] 14.26% | 2,082,890 | 20.5% |
[ 14.5% - 15.0% ] 14.74% | 2,273,331 | 20.1% |
[ 15.0% - 15.5% ] 15.24% | 1,757,910 | 19.9% |
[ 15.5% - 16.0% ] 15.77% | 2,473,079 | 20.1% |
[ 16.0% - 16.5% ] 16.25% | 1,761,607 | 19.6% |
[ 16.5% - 17.0% ] 16.74% | 2,070,795 | 19.9% |
[ 17.0% - 17.5% ] 17.25% | 1,633,866 | 18.5% |
[ 17.5% - 18.0% ] 17.76% | 1,411,542 | 19.1% |
[ 18.0% - 18.5% ] 18.23% | 988,161 | 21.9% |
[ 18.5% - 19.0% ] 18.74% | 1,284,207 | 19.9% |
[ 19.0% - 19.5% ] 19.22% | 1,578,769 | 19.2% |
[ 19.5% - 20.0% ] 19.77% | 1,380,598 | 20.8% |
[ 20.0% - 20.5% ] 20.25% | 1,256,337 | 19.2% |
[ 20.5% - 21.0% ] 20.76% | 695,374 | 19.6% |
[ 21.0% - 21.5% ] 21.17% | 889,763 | 17.2% |
[ 21.5% - 22.0% ] 21.73% | 670,808 | 19.2% |
[ 22.0% - 22.5% ] 22.27% | 627,433 | 19.0% |
[ 22.5% - 23.0% ] 22.73% | 590,314 | 19.1% |
[ 23.0% - 23.5% ] 23.22% | 801,051 | 17.9% |
[ 23.5% - 24.0% ] 23.79% | 627,632 | 18.4% |
[ 24.0% - 24.5% ] 24.19% | 606,318 | 20.0% |
[ 24.5% - 25.0% ] 24.78% | 692,706 | 20.6% |
[ 25.0% - 25.5% ] 25.24% | 659,323 | 18.6% |
[ 25.5% - 26.0% ] 25.77% | 491,603 | 18.2% |
[ 26.0% - 26.5% ] 26.25% | 408,870 | 18.2% |
[ 26.5% - 27.0% ] 26.73% | 395,296 | 19.5% |
[ 27.0% - 27.5% ] 27.23% | 514,255 | 18.0% |
[ 27.5% - 28.0% ] 27.75% | 663,047 | 17.1% |
[ 28.0% - 28.5% ] 28.21% | 240,642 | 19.9% |
[ 28.5% - 29.0% ] 28.75% | 297,358 | 18.6% |
[ 29.0% - 29.5% ] 29.24% | 334,766 | 18.7% |
[ 29.5% - 30.0% ] 29.70% | 241,057 | 16.6% |
[ 30.0% - 30.5% ] 30.25% | 207,021 | 14.4% |
[ 30.5% - 31.0% ] 30.76% | 188,529 | 20.8% |
[ 31.0% - 31.5% ] 31.41% | 191,923 | 20.3% |
[ 31.5% - 32.0% ] 31.74% | 108,674 | 18.2% |
[ 32.0% - 32.5% ] 32.33% | 136,232 | 15.7% |
[ 32.5% - 33.0% ] 32.72% | 118,859 | 17.3% |
[ 33.0% - 33.5% ] 33.35% | 88,955 | 14.2% |
[ 33.5% - 34.0% ] 33.76% | 59,714 | 14.8% |
[ 34.0% - 34.5% ] 34.22% | 74,297 | 13.3% |
[ 34.5% - 35.0% ] 34.86% | 54,573 | 20.9% |
[ 35.0% - 35.5% ] 35.22% | 75,177 | 18.3% |
[ 35.5% - 36.0% ] 35.74% | 89,083 | 19.1% |
[ 36.0% - 36.5% ] 36.16% | 90,304 | 17.4% |
[ 36.5% - 37.0% ] 36.73% | 78,168 | 21.3% |
[ 37.0% - 37.5% ] 37.42% | 64,551 | 16.5% |
[ 37.5% - 38.0% ] 37.62% | 11,613 | 18.7% |
[ 38.0% - 38.5% ] 38.28% | 41,694 | 15.2% |
[ 38.5% - 39.0% ] 38.63% | 2,581 | 21.6% |
[ 39.0% - 39.5% ] 39.21% | 39,437 | 16.0% |
[ 39.5% - 40.0% ] 39.69% | 92,875 | 13.4% |
[ 40.0% - 40.5% ] 40.34% | 32,610 | 12.8% |
[ 40.5% - 41.0% ] 40.79% | 2,645 | 16.1% |
[ 41.0% - 41.5% ] 41.39% | 1,353 | 22.3% |
[ 41.5% - 42.0% ] 41.63% | 1,297 | 29.5% |
[ 42.5% - 43.0% ] 42.64% | 54,970 | 15.3% |
[ 43.0% - 43.5% ] 43.36% | 11,894 | 11.6% |
[ 43.5% - 44.0% ] 43.80% | 1,507 | 29.5% |
[ 44.0% - 44.5% ] 44.41% | 53,871 | 20.2% |
[ 44.5% - 45.0% ] 44.93% | 1,607 | 12.9% |
[ 45.0% - 45.5% ] 45.12% | 492 | 18.8% |
[ 45.5% - 46.0% ] 45.73% | 1,135 | 23.4% |
[ 46.0% - 46.5% ] 46.47% | 15,548 | 19.3% |
[ 46.5% - 47.0% ] 46.61% | 6,179 | 18.6% |
[ 47.0% - 47.5% ] 47.30% | 463 | 23.4% |
[ 47.5% - 48.0% ] 47.81% | 3,384 | 65.0% |
[ 49.0% - 49.5% ] 49.27% | 619 | 43.1% |
[ 50.0% - 50.5% ] 50.00% | 280 | 74.3% |
[ 52.0% - 52.5% ] 52.15% | 7,195 | 37.8% |
[ 53.0% - 53.5% ] 53.17% | 7,895 | 16.5% |
[ 53.5% - 54.0% ] 53.73% | 335 | 28.0% |
[ 54.0% - 54.5% ] 54.17% | 24 | 90.5% |
[ 55.0% - 55.5% ] 55.41% | 1,785 | 16.7% |
[ 57.0% - 57.5% ] 57.14% | 63 | 100.0% |
[ 64.0% - 64.5% ] 64.34% | 272 | 47.4% |
[ 69.5% - 70.0% ] 69.57% | 46 | 50.0% |
[ 70.5% - 71.0% ] 70.76% | 236 | 100.0% |
[ 89.0% - 89.5% ] 89.30% | 187 | 100.0% |
[ 99.5% - 100.0% ] 100.00% | 14 | 100.0% |