Italian Wage/Income Gap
COMPARE
Italian
Select to Compare
Wage/Income Gap
Italian Wage/Income Gap
28.1%
WAGE/INCOME GAP
0.4/ 100
METRIC RATING
285th/ 347
METRIC RANK
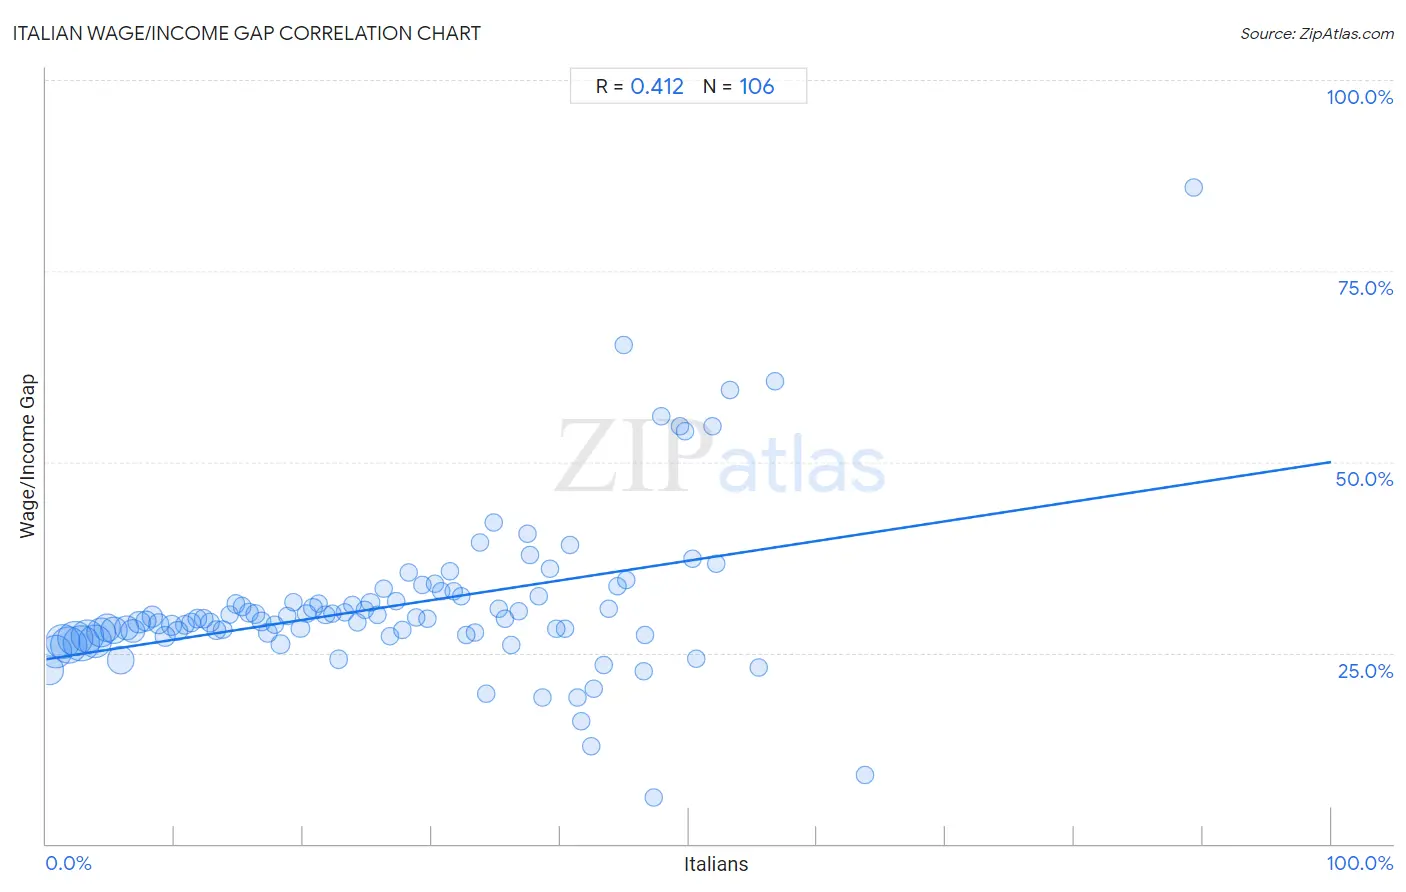
Italian Wage/Income Gap Correlation Chart
The statistical analysis conducted on geographies consisting of 571,985,194 people shows a moderate positive correlation between the proportion of Italians and wage/income gap percentage in the United States with a correlation coefficient (R) of 0.412 and weighted average of 28.1%. On average, for every 1% (one percent) increase in Italians within a typical geography, there is an increase of 0.26% in wage/income gap percentage.
It is essential to understand that the correlation between the percentage of Italians and wage/income gap percentage does not imply a direct cause-and-effect relationship. It remains uncertain whether the presence of Italians influences an upward or downward trend in the level of wage/income gap percentage within an area, or if Italians simply ended up residing in those areas with higher or lower levels of wage/income gap percentage due to other factors.
Demographics Similar to Italians by Wage/Income Gap
In terms of wage/income gap, the demographic groups most similar to Italians are Immigrants from Austria (28.1%, a difference of 0.030%), Okinawan (28.1%, a difference of 0.070%), Choctaw (28.1%, a difference of 0.10%), Immigrants from Sweden (28.1%, a difference of 0.13%), and French Canadian (28.1%, a difference of 0.14%).
| Demographics | Rating | Rank | Wage/Income Gap |
| Immigrants from England | 0.6 /100 | #278 | Tragic 27.9% |
| Romanians | 0.5 /100 | #279 | Tragic 28.0% |
| Russians | 0.5 /100 | #280 | Tragic 28.0% |
| Burmese | 0.5 /100 | #281 | Tragic 28.0% |
| South Africans | 0.5 /100 | #282 | Tragic 28.0% |
| French Canadians | 0.4 /100 | #283 | Tragic 28.1% |
| Immigrants from Sweden | 0.4 /100 | #284 | Tragic 28.1% |
| Italians | 0.4 /100 | #285 | Tragic 28.1% |
| Immigrants from Austria | 0.4 /100 | #286 | Tragic 28.1% |
| Okinawans | 0.4 /100 | #287 | Tragic 28.1% |
| Choctaw | 0.4 /100 | #288 | Tragic 28.1% |
| Canadians | 0.3 /100 | #289 | Tragic 28.1% |
| Australians | 0.3 /100 | #290 | Tragic 28.2% |
| Czechoslovakians | 0.3 /100 | #291 | Tragic 28.2% |
| Immigrants from Australia | 0.3 /100 | #292 | Tragic 28.2% |
Italian Wage/Income Gap Correlation Summary
| Measurement | Italian Data | Wage/Income Gap Data |
| Minimum | 0.27% | 6.1% |
| Maximum | 89.3% | 86.0% |
| Range | 89.0% | 79.9% |
| Mean | 27.2% | 31.2% |
| Median | 26.5% | 29.5% |
| Interquartile 25% (IQ1) | 13.2% | 27.3% |
| Interquartile 75% (IQ3) | 39.7% | 32.4% |
| Interquartile Range (IQR) | 26.5% | 5.1% |
| Standard Deviation (Sample) | 16.9% | 10.6% |
| Standard Deviation (Population) | 16.8% | 10.5% |
Correlation Details
| Italian Percentile | Sample Size | Wage/Income Gap |
[ 0.0% - 0.5% ] 0.27% | 28,575,133 | 22.7% |
[ 0.5% - 1.0% ] 0.77% | 37,807,755 | 25.2% |
[ 1.0% - 1.5% ] 1.26% | 41,628,280 | 26.4% |
[ 1.5% - 2.0% ] 1.74% | 49,878,178 | 26.0% |
[ 2.0% - 2.5% ] 2.25% | 45,021,406 | 26.9% |
[ 2.5% - 3.0% ] 2.74% | 49,185,768 | 26.2% |
[ 3.0% - 3.5% ] 3.25% | 40,137,713 | 27.1% |
[ 3.5% - 4.0% ] 3.76% | 39,505,961 | 26.5% |
[ 4.0% - 4.5% ] 4.25% | 30,460,218 | 27.6% |
[ 4.5% - 5.0% ] 4.73% | 25,233,228 | 28.3% |
[ 5.0% - 5.5% ] 5.25% | 21,859,043 | 27.9% |
[ 5.5% - 6.0% ] 5.79% | 26,046,810 | 24.1% |
[ 6.0% - 6.5% ] 6.24% | 14,788,919 | 28.2% |
[ 6.5% - 7.0% ] 6.75% | 14,944,024 | 27.9% |
[ 7.0% - 7.5% ] 7.23% | 11,401,823 | 29.0% |
[ 7.5% - 8.0% ] 7.74% | 7,713,823 | 29.1% |
[ 8.0% - 8.5% ] 8.25% | 7,587,843 | 29.7% |
[ 8.5% - 9.0% ] 8.73% | 6,826,515 | 28.7% |
[ 9.0% - 9.5% ] 9.24% | 5,802,240 | 27.1% |
[ 9.5% - 10.0% ] 9.75% | 4,631,117 | 28.6% |
[ 10.0% - 10.5% ] 10.25% | 5,274,284 | 27.9% |
[ 10.5% - 11.0% ] 10.77% | 4,310,460 | 28.6% |
[ 11.0% - 11.5% ] 11.27% | 3,459,623 | 28.9% |
[ 11.5% - 12.0% ] 11.75% | 4,052,874 | 29.5% |
[ 12.0% - 12.5% ] 12.23% | 3,465,825 | 29.5% |
[ 12.5% - 13.0% ] 12.74% | 3,168,182 | 29.0% |
[ 13.0% - 13.5% ] 13.23% | 2,622,033 | 28.0% |
[ 13.5% - 14.0% ] 13.76% | 2,246,763 | 28.0% |
[ 14.0% - 14.5% ] 14.26% | 2,073,457 | 30.0% |
[ 14.5% - 15.0% ] 14.74% | 2,269,337 | 31.4% |
[ 15.0% - 15.5% ] 15.24% | 1,747,212 | 31.0% |
[ 15.5% - 16.0% ] 15.77% | 2,465,915 | 30.3% |
[ 16.0% - 16.5% ] 16.25% | 1,750,307 | 30.0% |
[ 16.5% - 17.0% ] 16.74% | 2,071,750 | 29.1% |
[ 17.0% - 17.5% ] 17.25% | 1,641,058 | 27.6% |
[ 17.5% - 18.0% ] 17.76% | 1,406,683 | 28.7% |
[ 18.0% - 18.5% ] 18.24% | 985,761 | 26.1% |
[ 18.5% - 19.0% ] 18.74% | 1,293,516 | 29.8% |
[ 19.0% - 19.5% ] 19.22% | 1,585,826 | 31.6% |
[ 19.5% - 20.0% ] 19.77% | 1,386,102 | 28.2% |
[ 20.0% - 20.5% ] 20.25% | 1,258,983 | 30.2% |
[ 20.5% - 21.0% ] 20.76% | 694,792 | 30.9% |
[ 21.0% - 21.5% ] 21.17% | 890,301 | 31.4% |
[ 21.5% - 22.0% ] 21.73% | 668,434 | 30.0% |
[ 22.0% - 22.5% ] 22.26% | 627,230 | 30.1% |
[ 22.5% - 23.0% ] 22.73% | 587,028 | 24.1% |
[ 23.0% - 23.5% ] 23.22% | 795,276 | 30.3% |
[ 23.5% - 24.0% ] 23.79% | 632,135 | 31.3% |
[ 24.0% - 24.5% ] 24.19% | 601,958 | 29.0% |
[ 24.5% - 25.0% ] 24.78% | 695,333 | 30.6% |
[ 25.0% - 25.5% ] 25.24% | 659,810 | 31.6% |
[ 25.5% - 26.0% ] 25.77% | 492,961 | 30.0% |
[ 26.0% - 26.5% ] 26.25% | 403,846 | 33.4% |
[ 26.5% - 27.0% ] 26.73% | 391,861 | 27.1% |
[ 27.0% - 27.5% ] 27.23% | 518,441 | 31.8% |
[ 27.5% - 28.0% ] 27.75% | 662,788 | 28.0% |
[ 28.0% - 28.5% ] 28.21% | 240,152 | 35.5% |
[ 28.5% - 29.0% ] 28.75% | 296,319 | 29.7% |
[ 29.0% - 29.5% ] 29.24% | 331,220 | 33.9% |
[ 29.5% - 30.0% ] 29.69% | 238,285 | 29.4% |
[ 30.0% - 30.5% ] 30.25% | 197,564 | 34.1% |
[ 30.5% - 31.0% ] 30.76% | 187,164 | 33.0% |
[ 31.0% - 31.5% ] 31.41% | 193,580 | 35.7% |
[ 31.5% - 32.0% ] 31.74% | 108,554 | 33.0% |
[ 32.0% - 32.5% ] 32.33% | 135,712 | 32.4% |
[ 32.5% - 33.0% ] 32.72% | 117,724 | 27.3% |
[ 33.0% - 33.5% ] 33.35% | 87,347 | 27.6% |
[ 33.5% - 34.0% ] 33.75% | 46,411 | 39.4% |
[ 34.0% - 34.5% ] 34.22% | 73,104 | 19.7% |
[ 34.5% - 35.0% ] 34.87% | 53,008 | 42.1% |
[ 35.0% - 35.5% ] 35.22% | 72,991 | 30.8% |
[ 35.5% - 36.0% ] 35.73% | 86,736 | 29.5% |
[ 36.0% - 36.5% ] 36.16% | 89,869 | 26.1% |
[ 36.5% - 37.0% ] 36.74% | 75,430 | 30.5% |
[ 37.0% - 37.5% ] 37.42% | 64,887 | 40.6% |
[ 37.5% - 38.0% ] 37.61% | 10,903 | 37.8% |
[ 38.0% - 38.5% ] 38.29% | 39,237 | 32.4% |
[ 38.5% - 39.0% ] 38.66% | 6,218 | 19.2% |
[ 39.0% - 39.5% ] 39.21% | 38,956 | 36.1% |
[ 39.5% - 40.0% ] 39.69% | 93,034 | 28.2% |
[ 40.0% - 40.5% ] 40.34% | 32,511 | 28.2% |
[ 40.5% - 41.0% ] 40.75% | 1,578 | 39.1% |
[ 41.0% - 41.5% ] 41.38% | 1,450 | 19.1% |
[ 41.5% - 42.0% ] 41.63% | 1,218 | 16.1% |
[ 42.0% - 42.5% ] 42.44% | 344 | 12.7% |
[ 42.5% - 43.0% ] 42.64% | 54,970 | 20.2% |
[ 43.0% - 43.5% ] 43.36% | 11,894 | 23.5% |
[ 43.5% - 44.0% ] 43.80% | 1,363 | 30.8% |
[ 44.0% - 44.5% ] 44.41% | 53,871 | 33.7% |
[ 44.5% - 45.0% ] 44.98% | 1,256 | 65.3% |
[ 45.0% - 45.5% ] 45.12% | 492 | 34.6% |
[ 46.0% - 46.5% ] 46.47% | 15,548 | 22.6% |
[ 46.5% - 47.0% ] 46.61% | 6,179 | 27.4% |
[ 47.0% - 47.5% ] 47.30% | 482 | 6.1% |
[ 47.5% - 48.0% ] 47.81% | 3,384 | 56.0% |
[ 49.0% - 49.5% ] 49.27% | 619 | 54.6% |
[ 49.5% - 50.0% ] 49.75% | 400 | 54.0% |
[ 50.0% - 50.5% ] 50.32% | 626 | 37.3% |
[ 50.5% - 51.0% ] 50.61% | 164 | 24.2% |
[ 51.5% - 52.0% ] 51.82% | 384 | 54.6% |
[ 52.0% - 52.5% ] 52.16% | 8,114 | 36.7% |
[ 53.0% - 53.5% ] 53.17% | 7,723 | 59.5% |
[ 55.0% - 55.5% ] 55.41% | 1,785 | 23.0% |
[ 56.5% - 57.0% ] 56.67% | 60 | 60.5% |
[ 63.5% - 64.0% ] 63.67% | 245 | 9.0% |
[ 89.0% - 89.5% ] 89.30% | 187 | 86.0% |