Italian Disability
COMPARE
Italian
Select to Compare
Disability
Italian Disability
12.2%
DISABILITY
2.5/ 100
METRIC RATING
232nd/ 347
METRIC RANK
Italian Disability Correlation Chart
The statistical analysis conducted on geographies consisting of 574,930,842 people shows a moderate positive correlation between the proportion of Italians and percentage of population with a disability in the United States with a correlation coefficient (R) of 0.409 and weighted average of 12.2%. On average, for every 1% (one percent) increase in Italians within a typical geography, there is an increase of 0.13% in percentage of population with a disability.
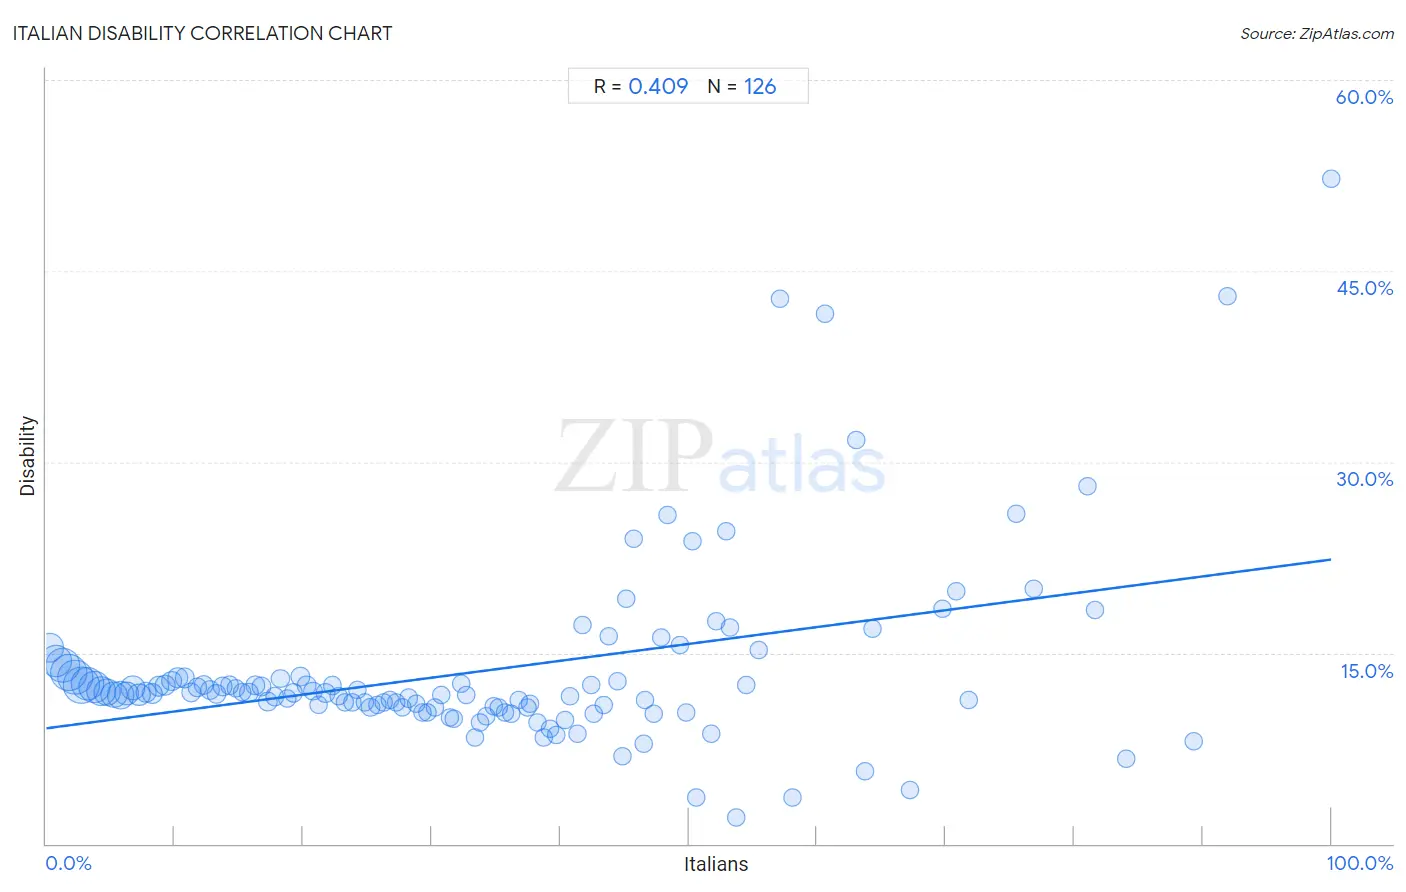
It is essential to understand that the correlation between the percentage of Italians and percentage of population with a disability does not imply a direct cause-and-effect relationship. It remains uncertain whether the presence of Italians influences an upward or downward trend in the level of percentage of population with a disability within an area, or if Italians simply ended up residing in those areas with higher or lower levels of percentage of population with a disability due to other factors.
Demographics Similar to Italians by Disability
In terms of disability, the demographic groups most similar to Italians are Malaysian (12.2%, a difference of 0.010%), Samoan (12.2%, a difference of 0.040%), Bahamian (12.2%, a difference of 0.090%), Inupiat (12.2%, a difference of 0.12%), and Japanese (12.2%, a difference of 0.12%).
| Demographics | Rating | Rank | Disability |
| Senegalese | 3.5 /100 | #225 | Tragic 12.1% |
| Jamaicans | 3.3 /100 | #226 | Tragic 12.1% |
| Alsatians | 3.3 /100 | #227 | Tragic 12.1% |
| West Indians | 2.9 /100 | #228 | Tragic 12.2% |
| Inupiat | 2.8 /100 | #229 | Tragic 12.2% |
| Samoans | 2.6 /100 | #230 | Tragic 12.2% |
| Malaysians | 2.5 /100 | #231 | Tragic 12.2% |
| Italians | 2.5 /100 | #232 | Tragic 12.2% |
| Bahamians | 2.3 /100 | #233 | Tragic 12.2% |
| Japanese | 2.3 /100 | #234 | Tragic 12.2% |
| Yup'ik | 2.2 /100 | #235 | Tragic 12.2% |
| Chinese | 2.0 /100 | #236 | Tragic 12.2% |
| Immigrants from Congo | 1.9 /100 | #237 | Tragic 12.2% |
| Norwegians | 1.9 /100 | #238 | Tragic 12.2% |
| Swedes | 1.8 /100 | #239 | Tragic 12.2% |
Italian Disability Correlation Summary
| Measurement | Italian Data | Disability Data |
| Minimum | 0.27% | 2.1% |
| Maximum | 100.0% | 52.3% |
| Range | 99.7% | 50.2% |
| Mean | 33.8% | 13.5% |
| Median | 31.6% | 11.8% |
| Interquartile 25% (IQ1) | 15.8% | 10.7% |
| Interquartile 75% (IQ3) | 47.3% | 13.0% |
| Interquartile Range (IQR) | 31.5% | 2.3% |
| Standard Deviation (Sample) | 22.4% | 7.3% |
| Standard Deviation (Population) | 22.3% | 7.2% |
Correlation Details
| Italian Percentile | Sample Size | Disability |
[ 0.0% - 0.5% ] 0.27% | 28,821,000 | 15.4% |
[ 0.5% - 1.0% ] 0.77% | 38,100,942 | 14.3% |
[ 1.0% - 1.5% ] 1.26% | 41,884,349 | 14.0% |
[ 1.5% - 2.0% ] 1.74% | 50,098,758 | 13.5% |
[ 2.0% - 2.5% ] 2.25% | 45,200,627 | 13.1% |
[ 2.5% - 3.0% ] 2.74% | 49,312,259 | 12.5% |
[ 3.0% - 3.5% ] 3.25% | 40,262,675 | 12.6% |
[ 3.5% - 4.0% ] 3.76% | 39,615,772 | 12.3% |
[ 4.0% - 4.5% ] 4.25% | 30,553,759 | 12.0% |
[ 4.5% - 5.0% ] 4.73% | 25,303,957 | 11.9% |
[ 5.0% - 5.5% ] 5.25% | 21,932,839 | 11.7% |
[ 5.5% - 6.0% ] 5.79% | 26,124,682 | 11.7% |
[ 6.0% - 6.5% ] 6.24% | 14,861,725 | 11.8% |
[ 6.5% - 7.0% ] 6.75% | 14,997,319 | 12.2% |
[ 7.0% - 7.5% ] 7.23% | 11,465,843 | 11.7% |
[ 7.5% - 8.0% ] 7.74% | 7,769,861 | 11.9% |
[ 8.0% - 8.5% ] 8.25% | 7,638,963 | 11.8% |
[ 8.5% - 9.0% ] 8.73% | 6,868,402 | 12.4% |
[ 9.0% - 9.5% ] 9.23% | 5,844,819 | 12.4% |
[ 9.5% - 10.0% ] 9.75% | 4,675,162 | 12.8% |
[ 10.0% - 10.5% ] 10.25% | 5,323,713 | 13.0% |
[ 10.5% - 11.0% ] 10.77% | 4,340,003 | 13.0% |
[ 11.0% - 11.5% ] 11.27% | 3,486,691 | 11.9% |
[ 11.5% - 12.0% ] 11.75% | 4,094,157 | 12.3% |
[ 12.0% - 12.5% ] 12.23% | 3,498,610 | 12.5% |
[ 12.5% - 13.0% ] 12.74% | 3,196,608 | 12.1% |
[ 13.0% - 13.5% ] 13.23% | 2,651,364 | 11.7% |
[ 13.5% - 14.0% ] 13.76% | 2,270,829 | 12.4% |
[ 14.0% - 14.5% ] 14.26% | 2,099,364 | 12.4% |
[ 14.5% - 15.0% ] 14.74% | 2,292,118 | 12.2% |
[ 15.0% - 15.5% ] 15.24% | 1,769,886 | 11.9% |
[ 15.5% - 16.0% ] 15.77% | 2,483,854 | 11.9% |
[ 16.0% - 16.5% ] 16.25% | 1,769,242 | 12.4% |
[ 16.5% - 17.0% ] 16.74% | 2,083,748 | 12.4% |
[ 17.0% - 17.5% ] 17.25% | 1,662,112 | 11.2% |
[ 17.5% - 18.0% ] 17.76% | 1,427,766 | 11.6% |
[ 18.0% - 18.5% ] 18.24% | 996,645 | 13.0% |
[ 18.5% - 19.0% ] 18.74% | 1,301,108 | 11.4% |
[ 19.0% - 19.5% ] 19.22% | 1,592,180 | 11.9% |
[ 19.5% - 20.0% ] 19.77% | 1,397,549 | 13.1% |
[ 20.0% - 20.5% ] 20.25% | 1,270,376 | 12.4% |
[ 20.5% - 21.0% ] 20.76% | 705,782 | 12.0% |
[ 21.0% - 21.5% ] 21.17% | 898,337 | 10.9% |
[ 21.5% - 22.0% ] 21.73% | 677,688 | 11.8% |
[ 22.0% - 22.5% ] 22.27% | 631,186 | 12.4% |
[ 22.5% - 23.0% ] 22.73% | 592,619 | 11.6% |
[ 23.0% - 23.5% ] 23.22% | 804,426 | 11.1% |
[ 23.5% - 24.0% ] 23.79% | 634,865 | 11.1% |
[ 24.0% - 24.5% ] 24.19% | 608,074 | 12.1% |
[ 24.5% - 25.0% ] 24.78% | 698,939 | 11.1% |
[ 25.0% - 25.5% ] 25.24% | 663,896 | 10.7% |
[ 25.5% - 26.0% ] 25.77% | 497,674 | 10.9% |
[ 26.0% - 26.5% ] 26.25% | 412,185 | 11.1% |
[ 26.5% - 27.0% ] 26.73% | 395,614 | 11.3% |
[ 27.0% - 27.5% ] 27.23% | 521,811 | 11.1% |
[ 27.5% - 28.0% ] 27.75% | 669,370 | 10.7% |
[ 28.0% - 28.5% ] 28.21% | 243,246 | 11.4% |
[ 28.5% - 29.0% ] 28.75% | 298,856 | 11.0% |
[ 29.0% - 29.5% ] 29.24% | 335,860 | 10.3% |
[ 29.5% - 30.0% ] 29.70% | 241,197 | 10.3% |
[ 30.0% - 30.5% ] 30.25% | 208,754 | 10.7% |
[ 30.5% - 31.0% ] 30.76% | 190,039 | 11.7% |
[ 31.0% - 31.5% ] 31.41% | 194,712 | 10.0% |
[ 31.5% - 32.0% ] 31.74% | 110,441 | 9.8% |
[ 32.0% - 32.5% ] 32.33% | 138,104 | 12.5% |
[ 32.5% - 33.0% ] 32.72% | 119,984 | 11.7% |
[ 33.0% - 33.5% ] 33.35% | 89,115 | 8.4% |
[ 33.5% - 34.0% ] 33.76% | 60,605 | 9.5% |
[ 34.0% - 34.5% ] 34.22% | 74,431 | 10.0% |
[ 34.5% - 35.0% ] 34.86% | 54,668 | 10.8% |
[ 35.0% - 35.5% ] 35.22% | 75,271 | 10.7% |
[ 35.5% - 36.0% ] 35.74% | 89,111 | 10.3% |
[ 36.0% - 36.5% ] 36.16% | 91,700 | 10.2% |
[ 36.5% - 37.0% ] 36.74% | 78,619 | 11.3% |
[ 37.0% - 37.5% ] 37.42% | 64,832 | 10.7% |
[ 37.5% - 38.0% ] 37.66% | 13,360 | 11.0% |
[ 38.0% - 38.5% ] 38.28% | 42,122 | 9.5% |
[ 38.5% - 39.0% ] 38.69% | 7,842 | 8.3% |
[ 39.0% - 39.5% ] 39.21% | 40,965 | 9.1% |
[ 39.5% - 40.0% ] 39.69% | 93,762 | 8.5% |
[ 40.0% - 40.5% ] 40.34% | 32,938 | 9.7% |
[ 40.5% - 41.0% ] 40.77% | 3,272 | 11.6% |
[ 41.0% - 41.5% ] 41.34% | 1,674 | 8.7% |
[ 41.5% - 42.0% ] 41.70% | 2,043 | 17.2% |
[ 42.0% - 42.5% ] 42.44% | 344 | 12.5% |
[ 42.5% - 43.0% ] 42.64% | 54,970 | 10.2% |
[ 43.0% - 43.5% ] 43.36% | 11,894 | 10.9% |
[ 43.5% - 44.0% ] 43.80% | 1,507 | 16.3% |
[ 44.0% - 44.5% ] 44.41% | 53,961 | 12.8% |
[ 44.5% - 45.0% ] 44.89% | 2,045 | 6.9% |
[ 45.0% - 45.5% ] 45.14% | 514 | 19.3% |
[ 45.5% - 46.0% ] 45.71% | 1,853 | 24.0% |
[ 46.0% - 46.5% ] 46.47% | 15,548 | 7.9% |
[ 46.5% - 47.0% ] 46.61% | 6,179 | 11.3% |
[ 47.0% - 47.5% ] 47.30% | 685 | 10.2% |
[ 47.5% - 48.0% ] 47.81% | 3,384 | 16.2% |
[ 48.0% - 48.5% ] 48.39% | 186 | 25.8% |
[ 49.0% - 49.5% ] 49.30% | 927 | 15.6% |
[ 49.5% - 50.0% ] 49.85% | 680 | 10.3% |
[ 50.0% - 50.5% ] 50.32% | 626 | 23.8% |
[ 50.5% - 51.0% ] 50.61% | 164 | 3.7% |
[ 51.5% - 52.0% ] 51.77% | 564 | 8.7% |
[ 52.0% - 52.5% ] 52.16% | 8,114 | 17.4% |
[ 52.5% - 53.0% ] 52.90% | 310 | 24.5% |
[ 53.0% - 53.5% ] 53.18% | 8,165 | 17.0% |
[ 53.5% - 54.0% ] 53.73% | 335 | 2.1% |
[ 54.0% - 54.5% ] 54.45% | 281 | 12.5% |
[ 55.0% - 55.5% ] 55.41% | 1,785 | 15.2% |
[ 57.0% - 57.5% ] 57.14% | 63 | 42.9% |
[ 58.0% - 58.5% ] 58.09% | 272 | 3.7% |
[ 60.5% - 61.0% ] 60.61% | 132 | 41.7% |
[ 63.0% - 63.5% ] 63.07% | 287 | 31.7% |
[ 63.5% - 64.0% ] 63.67% | 245 | 5.7% |
[ 64.0% - 64.5% ] 64.34% | 272 | 16.9% |
[ 67.0% - 67.5% ] 67.23% | 235 | 4.3% |
[ 69.5% - 70.0% ] 69.74% | 76 | 18.4% |
[ 70.5% - 71.0% ] 70.81% | 298 | 19.8% |
[ 71.5% - 72.0% ] 71.83% | 71 | 11.3% |
[ 75.0% - 75.5% ] 75.45% | 220 | 25.9% |
[ 76.5% - 77.0% ] 76.87% | 640 | 20.0% |
[ 80.5% - 81.0% ] 80.99% | 605 | 28.1% |
[ 81.5% - 82.0% ] 81.63% | 49 | 18.4% |
[ 84.0% - 84.5% ] 84.07% | 226 | 6.6% |
[ 89.0% - 89.5% ] 89.30% | 187 | 8.0% |
[ 91.5% - 92.0% ] 91.94% | 186 | 43.0% |
[ 99.5% - 100.0% ] 100.00% | 132 | 52.3% |