Italian Married-couple Households
COMPARE
Italian
Select to Compare
Married-couple Households
Italian Married-couple Households
49.0%
MARRIED-COUPLE HOUSEHOLDS
99.7/ 100
METRIC RATING
34th/ 347
METRIC RANK
Italian Married-couple Households Correlation Chart
The statistical analysis conducted on geographies consisting of 574,410,066 people shows a mild positive correlation between the proportion of Italians and percentage of married-couple family households in the United States with a correlation coefficient (R) of 0.346 and weighted average of 49.0%. On average, for every 1% (one percent) increase in Italians within a typical geography, there is an increase of 0.24% in percentage of married-couple family households.
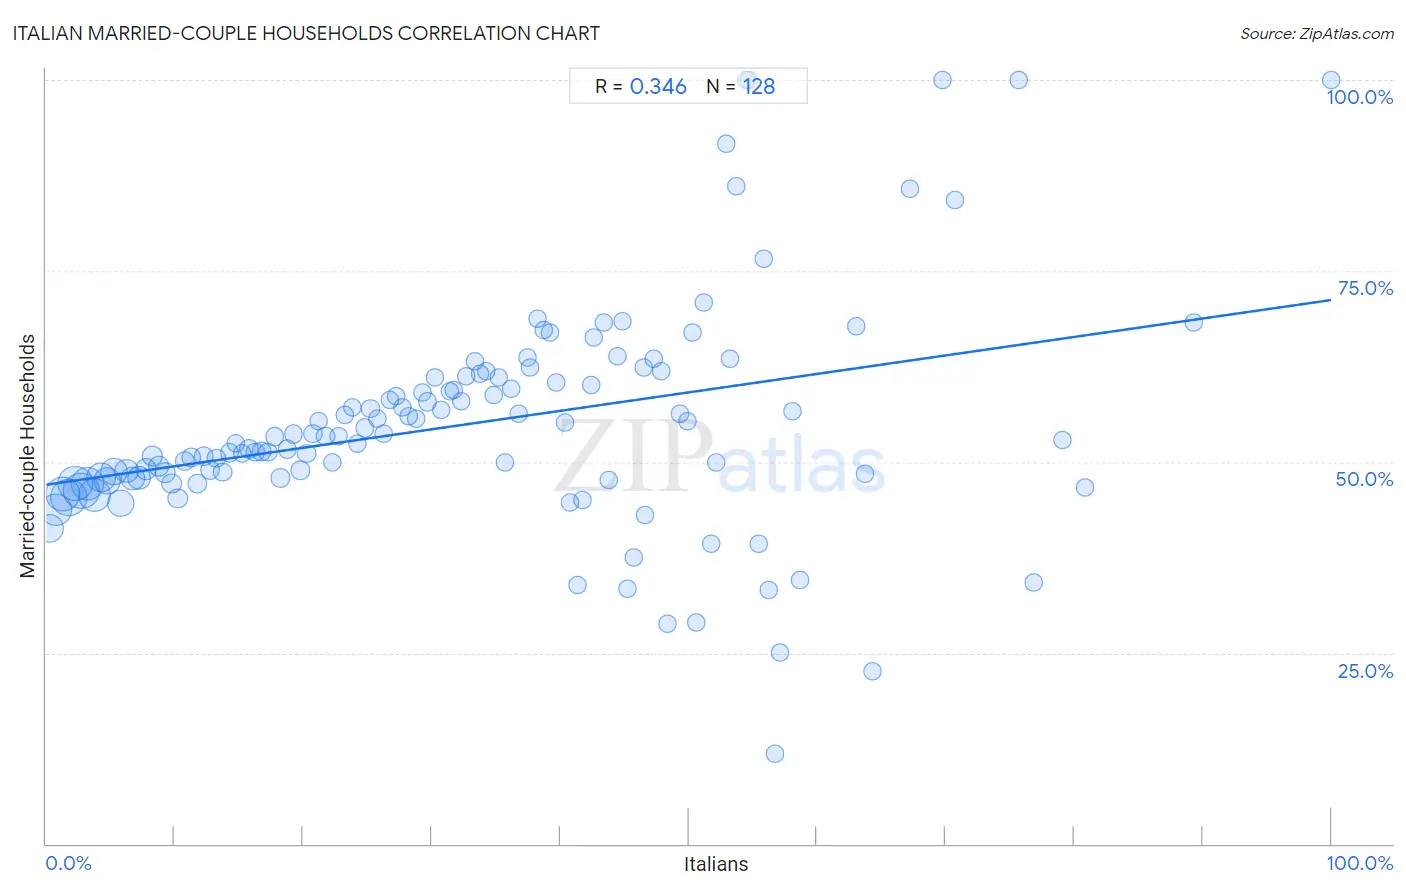
It is essential to understand that the correlation between the percentage of Italians and percentage of married-couple family households does not imply a direct cause-and-effect relationship. It remains uncertain whether the presence of Italians influences an upward or downward trend in the level of percentage of married-couple family households within an area, or if Italians simply ended up residing in those areas with higher or lower levels of percentage of married-couple family households due to other factors.
Demographics Similar to Italians by Married-couple Households
In terms of married-couple households, the demographic groups most similar to Italians are Scottish (49.0%, a difference of 0.020%), Immigrants from Asia (49.1%, a difference of 0.080%), Hungarian (49.1%, a difference of 0.11%), Iranian (49.0%, a difference of 0.11%), and Sri Lankan (49.0%, a difference of 0.11%).
| Demographics | Rating | Rank | Married-couple Households |
| Bhutanese | 99.8 /100 | #27 | Exceptional 49.3% |
| Germans | 99.8 /100 | #28 | Exceptional 49.2% |
| Maltese | 99.8 /100 | #29 | Exceptional 49.2% |
| Bolivians | 99.8 /100 | #30 | Exceptional 49.2% |
| Native Hawaiians | 99.8 /100 | #31 | Exceptional 49.1% |
| Hungarians | 99.8 /100 | #32 | Exceptional 49.1% |
| Immigrants from Asia | 99.7 /100 | #33 | Exceptional 49.1% |
| Italians | 99.7 /100 | #34 | Exceptional 49.0% |
| Scottish | 99.7 /100 | #35 | Exceptional 49.0% |
| Iranians | 99.7 /100 | #36 | Exceptional 49.0% |
| Sri Lankans | 99.7 /100 | #37 | Exceptional 49.0% |
| Greeks | 99.7 /100 | #38 | Exceptional 48.9% |
| Lithuanians | 99.6 /100 | #39 | Exceptional 48.9% |
| Immigrants from Bolivia | 99.6 /100 | #40 | Exceptional 48.9% |
| Immigrants from Lebanon | 99.6 /100 | #41 | Exceptional 48.9% |
Italian Married-couple Households Correlation Summary
| Measurement | Italian Data | Married-couple Households Data |
| Minimum | 0.27% | 11.8% |
| Maximum | 100.0% | 100.0% |
| Range | 99.7% | 88.2% |
| Mean | 33.4% | 55.1% |
| Median | 32.0% | 53.3% |
| Interquartile 25% (IQ1) | 16.0% | 47.9% |
| Interquartile 75% (IQ3) | 48.1% | 61.1% |
| Interquartile Range (IQR) | 32.1% | 13.2% |
| Standard Deviation (Sample) | 21.3% | 14.9% |
| Standard Deviation (Population) | 21.2% | 14.8% |
Correlation Details
| Italian Percentile | Sample Size | Married-couple Households |
[ 0.0% - 0.5% ] 0.27% | 28,810,499 | 41.3% |
[ 0.5% - 1.0% ] 0.77% | 38,078,245 | 43.8% |
[ 1.0% - 1.5% ] 1.26% | 41,868,960 | 45.8% |
[ 1.5% - 2.0% ] 1.74% | 50,076,934 | 45.4% |
[ 2.0% - 2.5% ] 2.25% | 45,176,775 | 47.2% |
[ 2.5% - 3.0% ] 2.74% | 49,283,600 | 46.2% |
[ 3.0% - 3.5% ] 3.25% | 40,236,972 | 47.1% |
[ 3.5% - 4.0% ] 3.76% | 39,556,735 | 45.7% |
[ 4.0% - 4.5% ] 4.25% | 30,524,541 | 48.0% |
[ 4.5% - 5.0% ] 4.73% | 25,286,906 | 47.5% |
[ 5.0% - 5.5% ] 5.25% | 21,913,556 | 48.7% |
[ 5.5% - 6.0% ] 5.79% | 26,105,688 | 44.6% |
[ 6.0% - 6.5% ] 6.24% | 14,844,228 | 48.8% |
[ 6.5% - 7.0% ] 6.75% | 14,976,654 | 47.9% |
[ 7.0% - 7.5% ] 7.23% | 11,445,570 | 47.9% |
[ 7.5% - 8.0% ] 7.74% | 7,758,770 | 49.1% |
[ 8.0% - 8.5% ] 8.25% | 7,627,354 | 50.7% |
[ 8.5% - 9.0% ] 8.73% | 6,856,781 | 49.4% |
[ 9.0% - 9.5% ] 9.23% | 5,842,090 | 48.6% |
[ 9.5% - 10.0% ] 9.75% | 4,661,342 | 47.1% |
[ 10.0% - 10.5% ] 10.25% | 5,315,634 | 45.2% |
[ 10.5% - 11.0% ] 10.77% | 4,330,228 | 50.1% |
[ 11.0% - 11.5% ] 11.27% | 3,482,591 | 50.6% |
[ 11.5% - 12.0% ] 11.75% | 4,093,449 | 47.1% |
[ 12.0% - 12.5% ] 12.23% | 3,493,056 | 50.8% |
[ 12.5% - 13.0% ] 12.74% | 3,195,506 | 49.0% |
[ 13.0% - 13.5% ] 13.23% | 2,629,171 | 50.5% |
[ 13.5% - 14.0% ] 13.76% | 2,267,128 | 48.7% |
[ 14.0% - 14.5% ] 14.26% | 2,095,941 | 51.2% |
[ 14.5% - 15.0% ] 14.74% | 2,283,230 | 52.4% |
[ 15.0% - 15.5% ] 15.24% | 1,767,603 | 51.1% |
[ 15.5% - 16.0% ] 15.77% | 2,483,265 | 51.7% |
[ 16.0% - 16.5% ] 16.25% | 1,769,801 | 51.3% |
[ 16.5% - 17.0% ] 16.74% | 2,083,992 | 51.3% |
[ 17.0% - 17.5% ] 17.25% | 1,660,277 | 51.3% |
[ 17.5% - 18.0% ] 17.76% | 1,421,752 | 53.3% |
[ 18.0% - 18.5% ] 18.24% | 997,056 | 47.9% |
[ 18.5% - 19.0% ] 18.74% | 1,296,657 | 51.7% |
[ 19.0% - 19.5% ] 19.22% | 1,588,616 | 53.7% |
[ 19.5% - 20.0% ] 19.77% | 1,389,959 | 48.9% |
[ 20.0% - 20.5% ] 20.25% | 1,264,359 | 51.1% |
[ 20.5% - 21.0% ] 20.76% | 706,614 | 53.8% |
[ 21.0% - 21.5% ] 21.17% | 898,174 | 55.4% |
[ 21.5% - 22.0% ] 21.73% | 677,790 | 53.4% |
[ 22.0% - 22.5% ] 22.27% | 629,933 | 49.9% |
[ 22.5% - 23.0% ] 22.73% | 592,528 | 53.3% |
[ 23.0% - 23.5% ] 23.22% | 804,524 | 56.1% |
[ 23.5% - 24.0% ] 23.79% | 633,059 | 57.1% |
[ 24.0% - 24.5% ] 24.19% | 608,715 | 52.4% |
[ 24.5% - 25.0% ] 24.78% | 695,838 | 54.4% |
[ 25.0% - 25.5% ] 25.24% | 662,031 | 57.0% |
[ 25.5% - 26.0% ] 25.77% | 495,120 | 55.6% |
[ 26.0% - 26.5% ] 26.25% | 412,277 | 53.6% |
[ 26.5% - 27.0% ] 26.73% | 395,943 | 58.1% |
[ 27.0% - 27.5% ] 27.23% | 516,885 | 58.6% |
[ 27.5% - 28.0% ] 27.75% | 664,625 | 57.2% |
[ 28.0% - 28.5% ] 28.21% | 243,420 | 56.0% |
[ 28.5% - 29.0% ] 28.75% | 297,150 | 55.7% |
[ 29.0% - 29.5% ] 29.24% | 335,901 | 59.0% |
[ 29.5% - 30.0% ] 29.70% | 241,334 | 57.9% |
[ 30.0% - 30.5% ] 30.25% | 208,721 | 61.1% |
[ 30.5% - 31.0% ] 30.76% | 190,176 | 56.8% |
[ 31.0% - 31.5% ] 31.41% | 193,816 | 59.2% |
[ 31.5% - 32.0% ] 31.74% | 110,523 | 59.4% |
[ 32.0% - 32.5% ] 32.33% | 136,390 | 58.0% |
[ 32.5% - 33.0% ] 32.72% | 120,142 | 61.3% |
[ 33.0% - 33.5% ] 33.35% | 89,127 | 63.1% |
[ 33.5% - 34.0% ] 33.76% | 60,196 | 61.6% |
[ 34.0% - 34.5% ] 34.22% | 74,431 | 61.9% |
[ 34.5% - 35.0% ] 34.86% | 54,616 | 58.7% |
[ 35.0% - 35.5% ] 35.22% | 75,359 | 61.1% |
[ 35.5% - 36.0% ] 35.74% | 89,111 | 50.0% |
[ 36.0% - 36.5% ] 36.16% | 91,983 | 59.6% |
[ 36.5% - 37.0% ] 36.74% | 78,799 | 56.3% |
[ 37.0% - 37.5% ] 37.42% | 64,994 | 63.6% |
[ 37.5% - 38.0% ] 37.66% | 13,582 | 62.4% |
[ 38.0% - 38.5% ] 38.28% | 42,122 | 68.7% |
[ 38.5% - 39.0% ] 38.70% | 8,060 | 67.2% |
[ 39.0% - 39.5% ] 39.21% | 40,965 | 67.0% |
[ 39.5% - 40.0% ] 39.69% | 94,040 | 60.4% |
[ 40.0% - 40.5% ] 40.34% | 32,672 | 55.2% |
[ 40.5% - 41.0% ] 40.76% | 3,378 | 44.8% |
[ 41.0% - 41.5% ] 41.34% | 1,674 | 33.8% |
[ 41.5% - 42.0% ] 41.70% | 1,964 | 45.0% |
[ 42.0% - 42.5% ] 42.44% | 344 | 60.1% |
[ 42.5% - 43.0% ] 42.64% | 54,970 | 66.2% |
[ 43.0% - 43.5% ] 43.36% | 11,894 | 68.3% |
[ 43.5% - 44.0% ] 43.80% | 1,507 | 47.7% |
[ 44.0% - 44.5% ] 44.41% | 54,015 | 63.9% |
[ 44.5% - 45.0% ] 44.89% | 2,065 | 68.4% |
[ 45.0% - 45.5% ] 45.26% | 791 | 33.3% |
[ 45.5% - 46.0% ] 45.71% | 1,853 | 37.5% |
[ 46.0% - 46.5% ] 46.47% | 15,691 | 62.4% |
[ 46.5% - 47.0% ] 46.61% | 6,179 | 43.0% |
[ 47.0% - 47.5% ] 47.30% | 704 | 63.5% |
[ 47.5% - 48.0% ] 47.81% | 3,384 | 61.9% |
[ 48.0% - 48.5% ] 48.39% | 186 | 28.8% |
[ 49.0% - 49.5% ] 49.27% | 619 | 56.4% |
[ 49.5% - 50.0% ] 49.87% | 770 | 55.3% |
[ 50.0% - 50.5% ] 50.32% | 626 | 67.0% |
[ 50.5% - 51.0% ] 50.61% | 164 | 28.9% |
[ 51.0% - 51.5% ] 51.12% | 268 | 70.8% |
[ 51.5% - 52.0% ] 51.77% | 564 | 39.3% |
[ 52.0% - 52.5% ] 52.16% | 8,114 | 49.8% |
[ 52.5% - 53.0% ] 52.90% | 310 | 91.7% |
[ 53.0% - 53.5% ] 53.18% | 8,227 | 63.5% |
[ 53.5% - 54.0% ] 53.73% | 335 | 86.1% |
[ 54.0% - 54.5% ] 54.47% | 257 | 100.0% |
[ 54.5% - 55.0% ] 54.71% | 170 | 100.0% |
[ 55.0% - 55.5% ] 55.42% | 1,476 | 39.3% |
[ 55.5% - 56.0% ] 55.88% | 136 | 76.7% |
[ 56.0% - 56.5% ] 56.20% | 121 | 33.2% |
[ 56.5% - 57.0% ] 56.67% | 60 | 11.8% |
[ 57.0% - 57.5% ] 57.14% | 63 | 25.0% |
[ 58.0% - 58.5% ] 58.09% | 272 | 56.6% |
[ 58.5% - 59.0% ] 58.62% | 145 | 34.5% |
[ 63.0% - 63.5% ] 63.07% | 287 | 67.8% |
[ 63.5% - 64.0% ] 63.67% | 245 | 48.4% |
[ 64.0% - 64.5% ] 64.34% | 272 | 22.6% |
[ 67.0% - 67.5% ] 67.24% | 406 | 85.8% |
[ 69.5% - 70.0% ] 69.74% | 76 | 100.0% |
[ 70.5% - 71.0% ] 70.77% | 366 | 84.3% |
[ 75.5% - 76.0% ] 75.68% | 37 | 100.0% |
[ 76.5% - 77.0% ] 76.87% | 640 | 34.3% |
[ 79.0% - 79.5% ] 79.07% | 43 | 52.9% |
[ 80.5% - 81.0% ] 80.88% | 952 | 46.6% |
[ 89.0% - 89.5% ] 89.30% | 187 | 68.3% |
[ 99.5% - 100.0% ] 100.00% | 102 | 100.0% |