Italian GED/Equivalency
COMPARE
Italian
Select to Compare
GED/Equivalency
Italian GED/Equivalency
88.2%
GED/EQUIVALENCY
99.6/ 100
METRIC RATING
40th/ 347
METRIC RANK
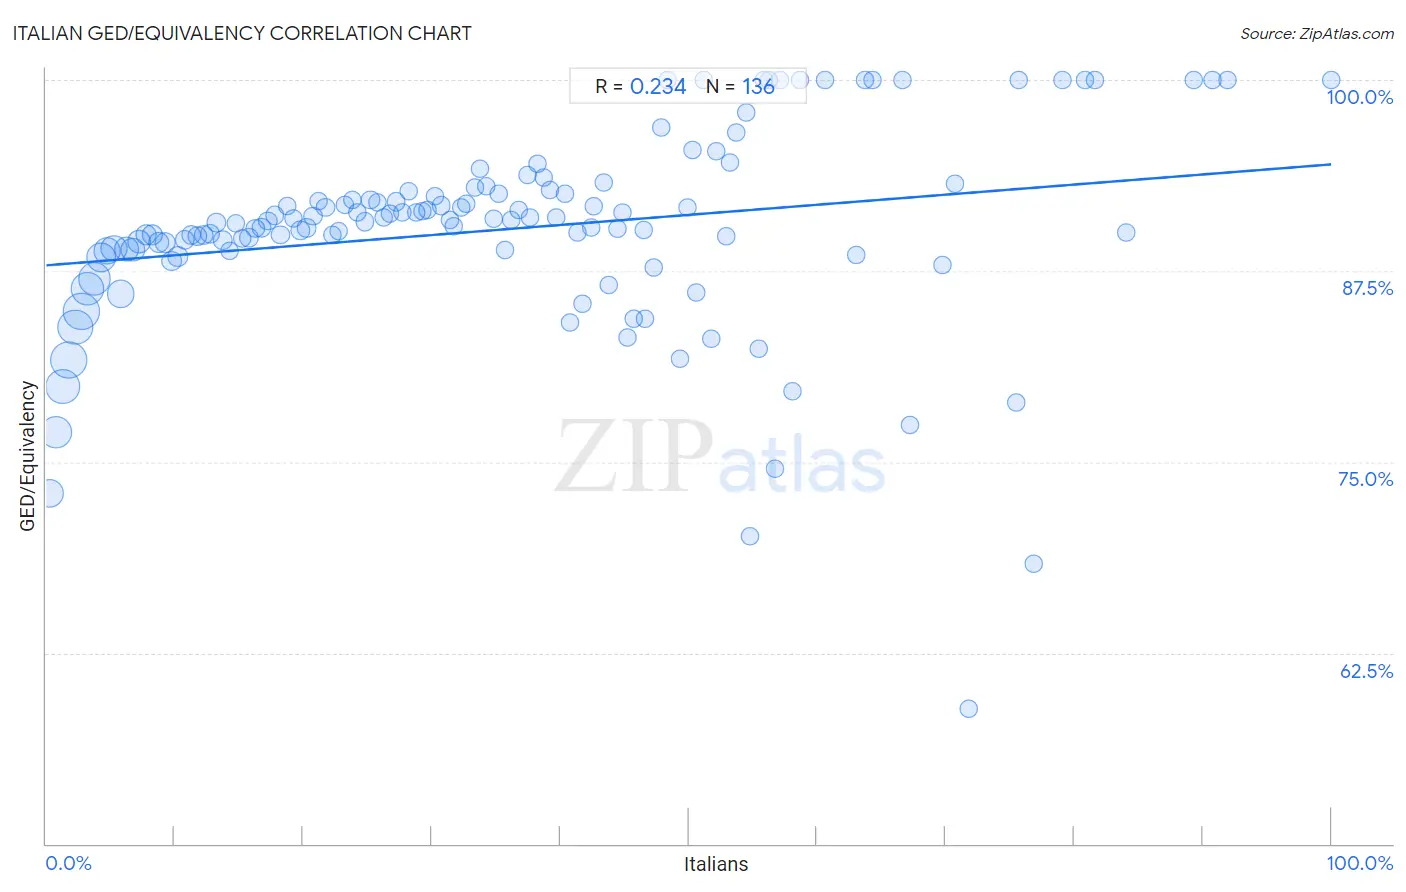
Italian GED/Equivalency Correlation Chart
The statistical analysis conducted on geographies consisting of 575,117,227 people shows a weak positive correlation between the proportion of Italians and percentage of population with at least ged/equivalency education in the United States with a correlation coefficient (R) of 0.234 and weighted average of 88.2%. On average, for every 1% (one percent) increase in Italians within a typical geography, there is an increase of 0.066% in percentage of population with at least ged/equivalency education.
It is essential to understand that the correlation between the percentage of Italians and percentage of population with at least ged/equivalency education does not imply a direct cause-and-effect relationship. It remains uncertain whether the presence of Italians influences an upward or downward trend in the level of percentage of population with at least ged/equivalency education within an area, or if Italians simply ended up residing in those areas with higher or lower levels of percentage of population with at least ged/equivalency education due to other factors.
Demographics Similar to Italians by GED/Equivalency
In terms of ged/equivalency, the demographic groups most similar to Italians are Finnish (88.2%, a difference of 0.010%), Immigrants from Israel (88.2%, a difference of 0.020%), Cambodian (88.2%, a difference of 0.040%), Immigrants from Scotland (88.2%, a difference of 0.050%), and Macedonian (88.1%, a difference of 0.080%).
| Demographics | Rating | Rank | GED/Equivalency |
| Immigrants from Sweden | 99.7 /100 | #33 | Exceptional 88.4% |
| Immigrants from Japan | 99.7 /100 | #34 | Exceptional 88.4% |
| Immigrants from South Central Asia | 99.7 /100 | #35 | Exceptional 88.4% |
| Immigrants from Belgium | 99.7 /100 | #36 | Exceptional 88.3% |
| Immigrants from Austria | 99.7 /100 | #37 | Exceptional 88.3% |
| Burmese | 99.7 /100 | #38 | Exceptional 88.3% |
| Immigrants from Israel | 99.6 /100 | #39 | Exceptional 88.2% |
| Italians | 99.6 /100 | #40 | Exceptional 88.2% |
| Finns | 99.6 /100 | #41 | Exceptional 88.2% |
| Cambodians | 99.6 /100 | #42 | Exceptional 88.2% |
| Immigrants from Scotland | 99.6 /100 | #43 | Exceptional 88.2% |
| Macedonians | 99.5 /100 | #44 | Exceptional 88.1% |
| Czechs | 99.5 /100 | #45 | Exceptional 88.1% |
| Immigrants from Switzerland | 99.5 /100 | #46 | Exceptional 88.1% |
| Immigrants from Latvia | 99.5 /100 | #47 | Exceptional 88.1% |
Italian GED/Equivalency Correlation Summary
| Measurement | Italian Data | GED/Equivalency Data |
| Minimum | 0.27% | 58.8% |
| Maximum | 100.0% | 100.0% |
| Range | 99.7% | 41.2% |
| Mean | 36.0% | 90.2% |
| Median | 34.0% | 90.7% |
| Interquartile 25% (IQ1) | 17.0% | 88.8% |
| Interquartile 75% (IQ3) | 51.4% | 92.6% |
| Interquartile Range (IQR) | 34.5% | 3.8% |
| Standard Deviation (Sample) | 23.3% | 6.6% |
| Standard Deviation (Population) | 23.2% | 6.5% |
Correlation Details
| Italian Percentile | Sample Size | GED/Equivalency |
[ 0.0% - 0.5% ] 0.27% | 28,829,063 | 72.9% |
[ 0.5% - 1.0% ] 0.77% | 38,113,609 | 76.9% |
[ 1.0% - 1.5% ] 1.26% | 41,907,149 | 79.9% |
[ 1.5% - 2.0% ] 1.74% | 50,111,260 | 81.7% |
[ 2.0% - 2.5% ] 2.25% | 45,206,769 | 83.8% |
[ 2.5% - 3.0% ] 2.74% | 49,326,316 | 84.8% |
[ 3.0% - 3.5% ] 3.25% | 40,273,673 | 86.3% |
[ 3.5% - 4.0% ] 3.76% | 39,631,671 | 87.0% |
[ 4.0% - 4.5% ] 4.25% | 30,555,321 | 88.4% |
[ 4.5% - 5.0% ] 4.73% | 25,333,878 | 88.8% |
[ 5.0% - 5.5% ] 5.25% | 21,941,592 | 89.0% |
[ 5.5% - 6.0% ] 5.79% | 26,131,658 | 86.0% |
[ 6.0% - 6.5% ] 6.24% | 14,878,298 | 88.9% |
[ 6.5% - 7.0% ] 6.75% | 14,995,538 | 88.9% |
[ 7.0% - 7.5% ] 7.23% | 11,466,422 | 89.4% |
[ 7.5% - 8.0% ] 7.74% | 7,771,015 | 89.9% |
[ 8.0% - 8.5% ] 8.25% | 7,641,289 | 89.8% |
[ 8.5% - 9.0% ] 8.73% | 6,869,457 | 89.4% |
[ 9.0% - 9.5% ] 9.23% | 5,847,119 | 89.4% |
[ 9.5% - 10.0% ] 9.75% | 4,676,153 | 88.2% |
[ 10.0% - 10.5% ] 10.25% | 5,324,467 | 88.4% |
[ 10.5% - 11.0% ] 10.77% | 4,340,115 | 89.6% |
[ 11.0% - 11.5% ] 11.27% | 3,487,888 | 89.9% |
[ 11.5% - 12.0% ] 11.75% | 4,095,314 | 89.8% |
[ 12.0% - 12.5% ] 12.23% | 3,498,879 | 89.9% |
[ 12.5% - 13.0% ] 12.74% | 3,197,430 | 89.9% |
[ 13.0% - 13.5% ] 13.23% | 2,649,596 | 90.7% |
[ 13.5% - 14.0% ] 13.76% | 2,272,192 | 89.5% |
[ 14.0% - 14.5% ] 14.26% | 2,099,483 | 88.8% |
[ 14.5% - 15.0% ] 14.74% | 2,292,564 | 90.6% |
[ 15.0% - 15.5% ] 15.24% | 1,767,603 | 89.6% |
[ 15.5% - 16.0% ] 15.77% | 2,484,988 | 89.7% |
[ 16.0% - 16.5% ] 16.25% | 1,769,906 | 90.3% |
[ 16.5% - 17.0% ] 16.74% | 2,083,992 | 90.3% |
[ 17.0% - 17.5% ] 17.25% | 1,663,074 | 90.8% |
[ 17.5% - 18.0% ] 17.76% | 1,423,880 | 91.1% |
[ 18.0% - 18.5% ] 18.24% | 997,056 | 89.8% |
[ 18.5% - 19.0% ] 18.74% | 1,301,475 | 91.7% |
[ 19.0% - 19.5% ] 19.22% | 1,592,367 | 90.9% |
[ 19.5% - 20.0% ] 19.77% | 1,395,534 | 90.1% |
[ 20.0% - 20.5% ] 20.25% | 1,270,376 | 90.3% |
[ 20.5% - 21.0% ] 20.76% | 706,614 | 91.1% |
[ 21.0% - 21.5% ] 21.17% | 898,337 | 92.0% |
[ 21.5% - 22.0% ] 21.73% | 677,790 | 91.7% |
[ 22.0% - 22.5% ] 22.26% | 631,535 | 89.9% |
[ 22.5% - 23.0% ] 22.73% | 592,672 | 90.1% |
[ 23.0% - 23.5% ] 23.22% | 804,584 | 91.9% |
[ 23.5% - 24.0% ] 23.79% | 635,182 | 92.1% |
[ 24.0% - 24.5% ] 24.19% | 608,715 | 91.3% |
[ 24.5% - 25.0% ] 24.78% | 699,176 | 90.7% |
[ 25.0% - 25.5% ] 25.24% | 664,323 | 92.2% |
[ 25.5% - 26.0% ] 25.77% | 498,080 | 92.0% |
[ 26.0% - 26.5% ] 26.25% | 412,369 | 91.0% |
[ 26.5% - 27.0% ] 26.73% | 396,184 | 91.3% |
[ 27.0% - 27.5% ] 27.23% | 521,811 | 92.0% |
[ 27.5% - 28.0% ] 27.75% | 669,896 | 91.3% |
[ 28.0% - 28.5% ] 28.21% | 243,420 | 92.7% |
[ 28.5% - 29.0% ] 28.75% | 300,319 | 91.3% |
[ 29.0% - 29.5% ] 29.24% | 335,901 | 91.4% |
[ 29.5% - 30.0% ] 29.70% | 241,344 | 91.5% |
[ 30.0% - 30.5% ] 30.25% | 208,863 | 92.4% |
[ 30.5% - 31.0% ] 30.76% | 190,251 | 91.8% |
[ 31.0% - 31.5% ] 31.41% | 195,201 | 90.9% |
[ 31.5% - 32.0% ] 31.74% | 110,583 | 90.4% |
[ 32.0% - 32.5% ] 32.33% | 138,104 | 91.6% |
[ 32.5% - 33.0% ] 32.72% | 120,142 | 91.9% |
[ 33.0% - 33.5% ] 33.35% | 89,378 | 92.9% |
[ 33.5% - 34.0% ] 33.76% | 60,658 | 94.2% |
[ 34.0% - 34.5% ] 34.22% | 74,431 | 93.0% |
[ 34.5% - 35.0% ] 34.86% | 54,737 | 90.9% |
[ 35.0% - 35.5% ] 35.22% | 75,393 | 92.5% |
[ 35.5% - 36.0% ] 35.74% | 89,111 | 88.9% |
[ 36.0% - 36.5% ] 36.16% | 91,983 | 90.9% |
[ 36.5% - 37.0% ] 36.74% | 78,799 | 91.5% |
[ 37.0% - 37.5% ] 37.42% | 65,002 | 93.8% |
[ 37.5% - 38.0% ] 37.66% | 13,582 | 91.0% |
[ 38.0% - 38.5% ] 38.28% | 42,122 | 94.5% |
[ 38.5% - 39.0% ] 38.70% | 8,060 | 93.6% |
[ 39.0% - 39.5% ] 39.21% | 40,965 | 92.8% |
[ 39.5% - 40.0% ] 39.69% | 94,040 | 91.0% |
[ 40.0% - 40.5% ] 40.34% | 32,938 | 92.5% |
[ 40.5% - 41.0% ] 40.76% | 3,378 | 84.1% |
[ 41.0% - 41.5% ] 41.34% | 1,674 | 90.0% |
[ 41.5% - 42.0% ] 41.70% | 2,043 | 85.4% |
[ 42.0% - 42.5% ] 42.44% | 344 | 90.4% |
[ 42.5% - 43.0% ] 42.64% | 54,970 | 91.7% |
[ 43.0% - 43.5% ] 43.36% | 11,894 | 93.3% |
[ 43.5% - 44.0% ] 43.80% | 1,507 | 86.5% |
[ 44.0% - 44.5% ] 44.41% | 54,067 | 90.3% |
[ 44.5% - 45.0% ] 44.89% | 2,065 | 91.3% |
[ 45.0% - 45.5% ] 45.26% | 791 | 83.2% |
[ 45.5% - 46.0% ] 45.71% | 1,853 | 84.4% |
[ 46.0% - 46.5% ] 46.47% | 15,691 | 90.2% |
[ 46.5% - 47.0% ] 46.62% | 6,294 | 84.4% |
[ 47.0% - 47.5% ] 47.30% | 704 | 87.7% |
[ 47.5% - 48.0% ] 47.81% | 3,384 | 96.9% |
[ 48.0% - 48.5% ] 48.39% | 186 | 100.0% |
[ 49.0% - 49.5% ] 49.30% | 927 | 81.8% |
[ 49.5% - 50.0% ] 49.87% | 770 | 91.7% |
[ 50.0% - 50.5% ] 50.32% | 626 | 95.4% |
[ 50.5% - 51.0% ] 50.61% | 164 | 86.1% |
[ 51.0% - 51.5% ] 51.12% | 268 | 100.0% |
[ 51.5% - 52.0% ] 51.77% | 564 | 83.1% |
[ 52.0% - 52.5% ] 52.16% | 8,114 | 95.3% |
[ 52.5% - 53.0% ] 52.90% | 310 | 89.8% |
[ 53.0% - 53.5% ] 53.18% | 8,227 | 94.6% |
[ 53.5% - 54.0% ] 53.73% | 335 | 96.6% |
[ 54.0% - 54.5% ] 54.45% | 281 | 97.9% |
[ 54.5% - 55.0% ] 54.80% | 323 | 70.1% |
[ 55.0% - 55.5% ] 55.41% | 1,785 | 82.4% |
[ 55.5% - 56.0% ] 55.88% | 136 | 100.0% |
[ 56.0% - 56.5% ] 56.20% | 121 | 100.0% |
[ 56.5% - 57.0% ] 56.67% | 60 | 74.5% |
[ 57.0% - 57.5% ] 57.14% | 63 | 100.0% |
[ 58.0% - 58.5% ] 58.09% | 272 | 79.6% |
[ 58.5% - 59.0% ] 58.62% | 145 | 100.0% |
[ 60.5% - 61.0% ] 60.61% | 132 | 100.0% |
[ 63.0% - 63.5% ] 63.07% | 287 | 88.5% |
[ 63.5% - 64.0% ] 63.67% | 245 | 100.0% |
[ 64.0% - 64.5% ] 64.34% | 272 | 100.0% |
[ 66.5% - 67.0% ] 66.67% | 24 | 100.0% |
[ 67.0% - 67.5% ] 67.24% | 406 | 77.4% |
[ 69.5% - 70.0% ] 69.74% | 76 | 87.9% |
[ 70.5% - 71.0% ] 70.77% | 366 | 93.2% |
[ 71.5% - 72.0% ] 71.83% | 71 | 58.8% |
[ 75.0% - 75.5% ] 75.45% | 220 | 78.9% |
[ 75.5% - 76.0% ] 75.68% | 37 | 100.0% |
[ 76.5% - 77.0% ] 76.87% | 640 | 68.4% |
[ 79.0% - 79.5% ] 79.07% | 43 | 100.0% |
[ 80.5% - 81.0% ] 80.88% | 952 | 100.0% |
[ 81.5% - 82.0% ] 81.63% | 49 | 100.0% |
[ 84.0% - 84.5% ] 84.07% | 226 | 90.0% |
[ 89.0% - 89.5% ] 89.30% | 187 | 100.0% |
[ 90.5% - 91.0% ] 90.76% | 119 | 100.0% |
[ 91.5% - 92.0% ] 91.94% | 186 | 100.0% |
[ 99.5% - 100.0% ] 100.00% | 329 | 100.0% |